Abstract
The purpose of this study was to investigate the clinical significance of the 2017 American College of Cardiology (ACC)/American Heart Association (AHA) defined stage 1 hypertension (systolic blood pressure (SBP) 130–139 mmHg or diastolic blood pressure (DBP) 80–89 mmHg), and increase in BP from previously normal BP in Korean adults. We conducted a retrospective analysis of 60,866 participants from a nationally representative claims database. Study subjects had normal BP (SBP < 120 mmHg and DBP < 80 mmHg), no history of anti-hypertensive medication, and cardiovascular disease (CVD) in the first period (2002–2003). The BP change was defined according to the BP difference between the first and second period (2004–2005). We used time-dependent Cox proportional hazards models in order to evaluate the effect of BP elevation on mortality and CVD with a mean follow-up of 7.8 years. Compared to those who maintained normal BP during the second period, participants with BP elevation from normal BP to stage 1 hypertension had a higher risk for CVD (adjusted hazard ratio (aHR) 1.23; 95% confidence interval (CI), 1.08–1.40), and ischemic stroke (aHR 1.32; 95% CI, 1.06–1.64). BP elevation to 2017 ACC/AHA defined elevated BP (SBP 120–129 mmHg and DBP < 80 mmHg) was associated with an increased risk of CVD (aHR 1.26; 95% CI, 1.06–1.50), but stage 1 isolated diastolic hypertension (SBP < 130 and DBP 80–89 mmHg) was not significantly related with CVD risk (aHR 1.12; 95% CI, 0.95–1.31).
1. Introduction
Hypertension is a modifiable risk factor for cardiovascular disease (CVD) [1,2]. The population-attributable fraction of hypertension for CVD is up to 60% in the Asia-Pacific region [3,4]. The linear relationship between blood pressure (BP) and the risk of CVD has been well demonstrated. A meta-analysis of 61 prospective studies demonstrated that mortality from ischemic heart disease and stroke increases linearly from levels as low as systolic BP (SBP) 115 mmHg and diastolic BP (DBP) 75 mmHg [5]. In the seventh report of the Joint National Committee on Prevention, Detection, Evaluation, and Treatment of High Blood Pressure (JNC 7), a new BP category, prehypertension (SBP 120–139 mmHg or DBP 80–89 mmHg) was introduced [6]. Recently, meta-analysis studies have shown that prehypertension is associated with a high risk of CVD [7,8].
In 2017, the American College of Cardiology (ACC) and the American Heart Association (AHA) released a new guideline on hypertension with a new definition of stage 1 hypertension (SBP 130–139 mmHg or DBP 80–89 mm) [9]. Two cohort studies have shown that stage 1 hypertension in young adults was associated with an increased risk of subsequent CVD. [10,11] Furthermore, changes and variability in BP have also been suggested as independent risk factors for CVD [12,13,14]. Prospective observational cohort studies have indicated that changes in BP were associated with the risk of cardiovascular events and CVD related mortality [15,16]. Meanwhile, studies investigating of the effect of BP changes among those with normal BP on CVD and mortality are lacking, especially upon BP elevation to 2017 ACC/AHA defined Stage 1 hypertension (Stage 1 hypertension). In the present study, we aimed to investigate the relationship between changes in BP and the risk of CVD and death in people with normal BP.
2. Materials and Methods
2.1. Study Population
The current study used the National Health Insurance Service-National Health Screening Cohort (NHIS-HEALS), which is a cohort randomly selected among those who underwent national health screening from the Korean population by the NHIS in South Korea. The NHIS database includes many health check-up items based on anthropometric measurements, physical examinations, and health examinees’ questionnaire results. In addition, blood pressure measurement and laboratory tests were performed, including complete blood count (CBC), fasting serum glucose (FSG), total cholesterol, and dipstick urine tests (occult blood, glucose and protein). Among the participants aged 40–79 years who participated in the biennial national health screening program covered in the NHIS in 2002 and 2003, 10% of the participants were randomly selected. This cohort was followed up for 12 years until 2013.
We identified 334,632 participants who had BP values in the first (2002–2003) and second (2004–2005) health check-up periods. We excluded those who passed away (n = 1043) before the index date of 1 January 2006. In addition, we also excluded those who had previous medical histories of myocardial infarction (MI) or stroke by using the Tenth Revision of the International Classification of Diseases (ICD-10) (I20–I25 for MI and I60–I69 for stroke) diagnosis codes, and a self-reported questionnaire on histories of MI and stroke before the index date (n = 38,825). We excluded subjects with SBP greater than 120 mmHg or DBP greater than 80 mmHg in the first (2002–2003) period (n = 218,626), and subjects with a self-reported previous history of hypertension and antihypertensive medication (n = 14,019), or who had missing values on laboratory results and lifestyle variables at the health check-up (n = 3300), resulting in a total of 60,866 participants (Figure 1). This study was approved by Seoul National University Hospital’s Institutional Review Board (IRB) (IRB number: 1703-039-863), and consent from individual patients was waived as NHIS-HEALS is de-identified according to strict confidentiality guidelines.
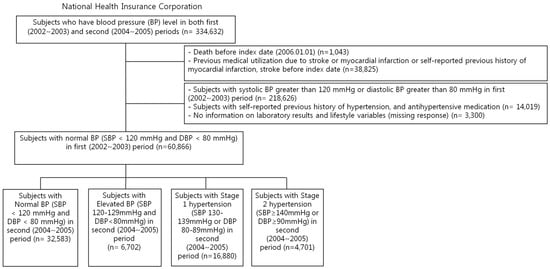
Figure 1.
Flow chart of the study population.
2.2. Change in BP Level
Resting BP was measured after participants rested for at least 5 minutes in sitting position by digital or automatic BP monitors at each health check-up. BP measured during the second period (2004–2005) was divided into four groups: normal (SBP < 120 mmHg and DBP < 80 mmHg), 2017 ACC/AHA defined elevated BP (Elevated BP) (SBP 120–129 mmHg and DBP < 80 mmHg), Stage 1 hypertension (SBP 130–139 mmHg or DBP 80–89 mmHg) and Stage 2 hypertension (SBP ≥ 140 mmHg or DBP ≥ 90 mmHg). For further analysis, the Stage 1 hypertension participants were divided into Stage 1 isolated diastolic hypertension (IDH) (SBP < 130 DBP 80–89 mmHg), Stage 1 isolated systolic hypertension (ISH) (SBP 130–139 DBP < 80 mmHg), and Stage 1 combined systolic/diastolic hypertension (SDH) (SBP 130–139 DBP 80–89 mmHg) groups.
2.3. Follow-up and Outcome Measurement
The mean follow-up period was 7.8 years. Deaths among study population through the end of follow-up date, 31 December 2013 were confirmed by using death certificates from Statistics Korea. CVD mortality (I00–I99) was identified by codes of death. The primary outcome was CVD. A CVD event was defined as a composite end point of two or more days of hospitalization due to acute myocardial infarction (AMI) (I21), stroke (I60–I69) or CVD mortality (I00–I99) according to the International Classification of Diseases, Tenth Revision (ICD-10) codes. The secondary outcomes were AMI (I21), ischemic stroke (I63), hemorrhagic stroke (I60–I62), all-cause mortality and CVD mortality.
2.4. Statistical Analysis
The follow-up period began on 1 January 2006 and extended through 31 December 2013. Each participant was censored at the time of CVD event or deaths from any causes, whichever occurred first. In case of non-censored observations, the participants were followed-up until 31 December 2013. We used Cox proportional hazards regression models in order to evaluate mortality and CVD events according to the change in BP levels. Age was divided into four categories, 40–49, 50–59, 60–69, and ≥70 years (yr). Body mass index (BMI) was calculated by dividing the weight in kilograms by the height in meters squared and classified into <18.5, 18.5–22.9, 23.0–24.9, and ≥25.0 kg/m2 according to the Asian-pacific obesity classification [17]. Comorbidities were summarized by the Charlson comorbidity index (CCI) with ICD-10 coding, as described elsewhere [18]. The use of aspirin was defined as subjects who had been prescribed aspirin between 2002 and 2005. Mean prescribed daily doses for statin were converted to defined daily dose (DDD) and subjects who have claim record more than 30 cumulative DDDs between 2002 and 2005 were defined as statin users [19,20].
We adjusted for age and sex in model 1. We additionally adjusted for CVD risk factors including body mass index (<18.5, 18.5–22.9, 23.0–24.9, ≥25.0 kg/m2), fasting serum glucose (<100.0 mg/dL, 100–125.9 mg/dL, ≥126.0 mg/dL), total cholesterol (<200.0 mg/dL 200.0–239.9 mg/dL, ≥240.0 mg/dL), physical activity (none, 1–2 times/week, 3–4 times/week, and 5–7 times/week), smoking status (Never smoker, Ex-smoker, Current smoker), drinking habit (none, 1–2 times/week, ≥3 times/week), socioeconomic status (Lower half, Upper half, Medical Aid), Charlson comorbidity index (0, 1–2, and ≥3), use of aspirin, and use of statins in order to estimate hazard ratios (HR) and a 95% confidence interval (95% CI) among Elevated BP (SBP 120–129 mmHg and DBP < 80 mmHg), Stage 1 hypertension (SBP 130–139 mmHg or DBP 80–89 mmHg) and Stage 2 hypertension (SBP ≥ 140 mmHg or DBP ≥ 90 mmHg) as compared to those with normal BP (SBP < 120 mmHg and DBP < 80 mmHg). We performed subgroup analysis by stratifying the study sample by sex, baseline age (40–64 and ≥65 yr), fasting serum glucose level (<126.0 mg/dL, ≥126.0 mg/dL), smoking status (Never smoker, Ex- or Current smoker) and Charlson comorbidity index (0–1, and ≥2). Data management and collection were carried out using SAS version 9.4 (SAS Inc, Cary, NC, USA). All statistical analyses were carried out using STATA version 14.1 (Stata Corp, College Station, TX, USA). All tests were two-sided, and statistical significance was defined as a p value of less than 0.05.
3. Results
3.1. Baseline Characteristics
The mean age of the total population was 51.5 (standard deviation 7.6) years old and were composed of 52.5% female subjects (Table 1). The subjects were distributed into 32,583 participants (53.5%) in the normal BP group, 6702 participants (11.0%) in the Elevated BP group, 16,880 participants (27.7%) in the Stage 1 hypertension group, and 4701 participants (7.7%) in the Stage 2 hypertension group. The incidence for all-cause mortality, CVD mortality, CVD, myocardial infarction, ischemic stroke, and hemorrhagic stroke were 1517 (2.49%), 165 (0.27%), 1285 (2.11%), 156 (0.26%), 470 (0.77%) and 198 (0.33%), respectively. Subjects in the hypertension group were more likely to be old, male, obese, and current smokers. Those in the hypertension group showed higher total cholesterol and fasting serum glucose levels compared to those in the normal BP group. Upon dividing the Stage 1 hypertension groups into Stage 1 IDH, ISH, and SDH, the mean ages were 51.0, 54.4, and 52.7 years, respectively.

Table 1.
Descriptive characteristics of study participants on their second health examination.
3.2. Change in BP and Mortality and Cardiovascular Disease
Participants with blood pressure elevation from normal BP to newly defined Stage 1 hypertension had higher risk for CVD (aHR 1.23; 95% CI, 1.08–1.40), and ischemic stroke (aHR 1.32; 95% CI, 1.06–1.64) than those who maintained normal BP (Table 2) (Figure 2). People whose BP rose up from normal BP to the Elevated BP had higher risk for CVD (aHR 1.26; 95% CI, 1.06–1.50), myocardial infarction (aHR 1.91; 95% CI, 1.19–3.06), and ischemic stroke (aHR 1.38; 95% CI, 1.04–1.84) compared to those who maintained normal BP (Table 2) (Figure 2). Compared to those who maintained normal BP, those who had higher BP to Stage 1 IDH levels did not have increased risk for CVD (aHR 1.12; 95% CI, 0.95–1.31) (Table 3). In contrast, participants with Stage 1 SDH (aHR 1.42; 95% CI 1.17–1.71) levels during the second period had elevated risk for CVD. Compared to those with Stage 1 IDH, people with Stage 1 SDH had higher CVD risk (aHR 1.29, 95% CI, 1.04–1.61) (Table 4). The association of BP elevation with CVD was consistent in several subgroups (Table 5).
Table 2.
Associations between change in blood pressure according to the 2017 ACC/AHA high blood pressure guideline and risk of cardiovascular disease, myocardial infarction, stroke, and mortality.
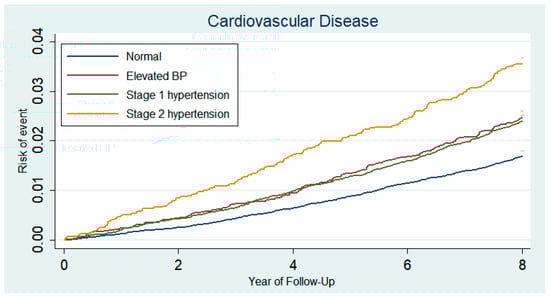
Figure 2.
Kaplan–Meier curves demonstrating the incidence of cardiovascular disease (composite of nonfatal myocardial infarction, stroke, or cardiovascular death) according to the two-year blood pressure changes in people with previously normal blood pressure. Subjects had normal BP in first (2002 to 2003) periods and whose BP checked in second (2004–2005) periods was divided into four groups: normal (SBP < 120 mmHg and DBP < 80 mmHg), 2017 ACC/AHA defined Elevated BP (SBP 120–129 mmHg and DBP < 80 mmHg), Stage 1 hypertension (SBP 130–139 mmHg or DBP 80–89 mmHg) and Stage 2 hypertension (SBP ≥ 140 mmHg or DBP ≥ 90 mmHg).
Table 3.
Additional analysis of associations between change in blood pressure according to the 2017 ACC/AHA high blood pressure guideline and risk of cardiovascular disease, myocardial infarction, stroke, and mortality.
Table 4.
Additional analysis of associations between three categorical changes in blood pressure and risk of cardiovascular disease in 2017 ACC/AHA defined Stage 1 hypertension.
Table 5.
Subgroup analysis of associations between change in blood pressure and risk of cardiovascular disease *.
4. Discussion
In people with normal BP, BP elevation within two years was associated with an increased risk of CVD. Increases in BP to Stage 1 hypertension levels were associated with increased risk of CVD. BP elevation to Elevated BP level was also associated with an increased risk of CVD, but Stage 1 IDH was not significantly related.
Previous research by Hennekens CH et al. on a two-year BP change and the risk of CVD in men reported that a two-year change in DBP, but not SBP, may be associated with CVD risk [16]. The study of Hennekens CH et al. showed that SBP differences above 15 mmHg were not associated with additional increase in CVD risk. However, Hadaegh F et al. reported that three-year rises in SBP (≥ 13.8 mmHg), DBP (≥9.14 mmHg) were associated with increased risk of CVD [21]. This difference seems to be due to the racial difference (US, Iran, and Asian) in the study subjects, participation of subjects with BP above normal BP, the differences in the observation periods, and the adjusted variables [22].
In an analysis including a total of 346,570 participants from 36 Asia-Pacific region cohort studies, JNC 7 defined prehypertension (SBP 120-139 mmHg or DBP 80–89 mmHg) was associated with increased risks of coronary heart disease (aHR 1.31; 95% CI, 1.14-1.50), ischemic stroke (aHR 1.60; 95% CI, 1.33–1.92) and hemorrhagic stroke (aHR 2.17; 95% CI, 1.69–2.79) [7]. Ishikawa S et al. reported that the risk of CVD with prehypertension might increase after progression to hypertension. However, increased BP from normal BP to prehypertension was not associated with CVD [23]. The two-year changes in BP may be due to changes in behavior, medication usage, or regression to the mean.
The 2017 ACC/AHA High Blood Pressure Guideline introduced a new definition of Stage 1 hypertension (SBP 130 to 139 mmHg or DBP 80 to 89 mmHg) [9]. Therefore, some of those previously diagnosed with prehypertension would be diagnosed with Stage 1 hypertension. The results of this study are of public health value that emphasizes the elevated risk of CVD in Elevated BP levels among previously normal BP individuals.
There did not appear to be a significant difference in the risk of CVD between Elevated BP group and Stage 1 hypertension group (Table 2) (Figure 2). Additional analysis showed that the Stage 1 hypertension group could be classified as a heterogeneous group: IDH, ISH, and SDH. In particular, people with Stage 1 IDH accounted for 62% of the Stage 1 hypertension group and their CVD risk was not statistical significantly elevated compared to those who maintained normal BP (Table 3). Despite being categorized as the same Stage 1 hypertension group, people with Stage 1 SDH had higher CVD risk than those with Stage 1 IDH (aHR 1.29, 95% CI, 1.04–1.61) (Table 4). The study population consisted of participants who had normal BP during the first visit, and Stage 1 IDH patients had average SBP and DBP values of 118.1 ± 5.6 and 80.7 ± 1.8 mmHg, respectively. Therefore, as the mean SBP values were below 120 mmHg, the risk for CVD did not seem to increase. Moreover, as the Stage 1 IDH group had a mean age of 51.0 years, the CVD risk may not have increased compared to that of Stage 1 ISH and SDH participants, who had mean age of 54.4 and 52.7 years, respectively. In a study of elderly hypertensive patients, the risk of CVD was similar between SDH and ISH [24]. Further, a long-term follow-up study of young and middle-aged adults showed that ISH was associated with CVD risk [25]. However, there was no statistically significant correlation between IDH and stroke in a study of middle-aged and elderly [26]. Further research is needed on the clinical significance and within-group heterogeneity of the Stage 1 hypertension group.
The limitations of this study are as follows. First, there is a methodological limitation in BP measurements. The hypertension guidelines recommend that BP be measured repeatedly and averaged, but BP measurements in our study were conducted only once. The study of Handler J et al. showed that one BP measurement was appropriate for people with baseline normal BP [27]. However, a cross-sectional study revealed that there were significant differences between a single office BP measurement and the mean of consecutive BP measurements. Therefore, a short-term masked hypertension might not be found using only one BP measurement value [28]. Second, we could not consider the possible effects of medications on the relationship between BP change and CVD during the follow-up period. Further studies are needed to analyze the relationship between drug use during the follow-up period and changes in BP and the incidence of CVD. Third, the study subjects were Koreans; therefore, there is a limit to the generalization of research results to other countries or races.
There are also several strengths. To the best of our knowledge, this is the first study to show that the CVD risk increased upon BP elevation from normal BP among those with two-year BP change from normal BP to elevated BP and Stage 1 hypertension. The current study is a relatively large study population that is representative of the general population with a relatively long-term follow-up duration. This study also considered a number of potential confounders such as drug prescription, sociodemographics, and health behaviors.
5. Conclusions
In conclusion, the results from the current study revealed that BP elevation within two years was associated with an elevated risk of CVD among those with baseline normal BP. BP elevation to Stage 1 hypertension and Elevated BP was also associated with an increased risk of CVD, but Stage 1 IDH was not significantly related.
Author Contributions
J.S.S. was involved in conceptualization, methodology and writing of the original draft; S.C., K.K., G.L., S.-M.J., S.M.K., and J.M.Y. contributed to the investigation; J.S.S., and S.M.P. were involved in funding acquisition, resources, formal analysis, supervision, and writing—review & editing. All authors approved the final version of the paper.
Funding
This research was supported by the Ministry of Health & Welfare in the Republic of Korea (Grant No: 20170322652-00). Kyuwoong Kim and Sung Min Kim received a scholarship from the BK21-plus education program provided by the National Research Foundation of Korea.
Acknowledgments
We would like to thank the National Health Insurance Service for providing the dataset (NHIS-2017-2-463).
Conflicts of Interest
The authors have no conflict of interest. The funders had no role in the design of the study; in the collection, analyses, or interpretation of data; in the writing of the manuscript, or in the decision to publish the results.
References
- Collins, R.; MacMahon, S. Blood pressure, antihypertensive drug treatment and the risks of stroke and of coronary heart disease. Br. Med. Bull. 1994, 50, 272–298. [Google Scholar] [CrossRef] [PubMed]
- Mancia, G.; Fagard, R.; Narkiewicz, K.; Redón, J.; Zanchetti, A.; Böhm, M.; Christiaens, T.; Cifkova, R.; De Backer, G.; Dominiczak, A. Task Force Members. 2013 ESH/ESC Guidelines for the management of arterial hypertension: The Task Force for the management of arterial hypertension of the European Society of Hypertension (ESH) and of the European Society of Cardiology (ESC). J. Hypertens. 2013, 31, 1281–1357. [Google Scholar] [CrossRef] [PubMed]
- Ueshima, H.; Sekikawa, A.; Miura, K.; Turin, T.C.; Takashima, N.; Kita, Y.; Watanabe, M.; Kadota, A.; Okuda, N.; Kadowaki, T. Cardiovascular disease and risk factors in Asia: A selected review. Circulation 2008, 118, 2702–2709. [Google Scholar] [CrossRef] [PubMed]
- Martiniuk, A.L.; Lee, C.M.; Lawes, C.M.; Ueshima, H.; Suh, I.; Lam, T.H.; Gu, D.; Feigin, V.; Jamrozik, K.; Ohkubo, T. Hypertension: Its prevalence and population-attributable fraction for mortality from cardiovascular disease in the Asia-Pacific region. J. Hypertens. 2007, 25, 73–79. [Google Scholar] [CrossRef] [PubMed]
- Lewington, S.; Clarke, R.; Qizilbash, N.; Peto, R.; Collins, R. Age-specific relevance of usual blood pressure to vascular mortality: A meta-analysis of individual data for one million adults in 61 prospective studies. Lancet 2002, 360, 1903–1913. [Google Scholar] [PubMed]
- Chobanian, A.V.; Bakris, G.L.; Black, H.R.; Cushman, W.C.; Green, L.A.; Izzo, J.L., Jr.; Jones, D.W.; Materson, B.J.; Oparil, S.; Wright, J.T., Jr. Seventh report of the joint national committee on prevention, detection, evaluation, and treatment of high blood pressure. Hypertension 2003, 42, 1206–1252. [Google Scholar] [CrossRef] [PubMed]
- Arima, H.; Murakami, Y.; Lam, T.H.; Kim, H.C.; Ueshima, H.; Woo, J.; Suh, I.; Fang, X.; Woodward, M. Effects of prehypertension and hypertension subtype on cardiovascular disease in the Asia-Pacific Region. Hypertension 2012, 59, 1118–1123. [Google Scholar] [CrossRef]
- Huang, Y.; Wang, S.; Cai, X.; Mai, W.; Hu, Y.; Tang, H.; Xu, D. Prehypertension and incidence of cardiovascular disease: A meta-analysis. BMC Med. 2013, 11, 177. [Google Scholar] [CrossRef]
- Whelton, P.K.; Carey, R.M.; Aronow, W.S.; Casey, D.E., Jr.; Collins, K.J.; Dennison Himmelfarb, C.; DePalma, S.M.; Gidding, S.; Jamerson, K.A.; Jones, D.W.; et al. 2017 ACC/AHA/AAPA/ABC/ACPM/AGS/APhA/ASH/ASPC/NMA/PCNA Guideline for the Prevention, Detection, Evaluation, and Management of High Blood Pressure in Adults: Executive Summary: A Report of the American College of Cardiology/American Heart Association Task Force on Clinical Practice Guidelines. Hypertension 2018, 71, 1269–1324. [Google Scholar] [CrossRef]
- Son, J.S.; Choi, S.; Kim, K.; Kim, S.M.; Choi, D.; Lee, G.; Jeong, S.M.; Park, S.Y.; Kim, Y.Y.; Yun, J.M.; et al. Association of Blood Pressure Classification in Korean Young Adults According to the 2017 American College of Cardiology/American Heart Association Guidelines with Subsequent Cardiovascular Disease Events. JAMA 2018, 320, 1783–1792. [Google Scholar] [CrossRef]
- Yano, Y.; Reis, J.P.; Colangelo, L.A.; Shimbo, D.; Viera, A.J.; Allen, N.B.; Gidding, S.S.; Bress, A.P.; Greenland, P.; Muntner, P.; et al. Association of Blood Pressure Classification in Young Adults Using the 2017 American College of Cardiology/American Heart Association Blood Pressure Guideline with Cardiovascular Events Later in Life. JAMA 2018, 320, 1774–1782. [Google Scholar] [CrossRef] [PubMed]
- Hofman, A. Change viewed on the level. Int. J. Epidemiol. 1983, 12, 391–392. [Google Scholar] [CrossRef] [PubMed][Green Version]
- Stevens, S.L.; Wood, S.; Koshiaris, C.; Law, K.; Glasziou, P.; Stevens, R.J.; McManus, R.J. Blood pressure variability and cardiovascular disease: Systematic review and meta-analysis. BMJ 2016, 354, i4098. [Google Scholar] [CrossRef] [PubMed]
- Wang, J.; Shi, X.; Ma, C.; Zheng, H.; Xiao, J.; Bian, H.; Ma, Z.; Gong, L. Visit-to-visit blood pressure variability is a risk factor for all-cause mortality and cardiovascular disease: A systematic review and meta-analysis. J. Hypertens. 2017, 35, 10–17. [Google Scholar] [CrossRef] [PubMed]
- Diaz, K.M.; Tanner, R.M.; Falzon, L.; Levitan, E.B.; Reynolds, K.; Shimbo, D.; Muntner, P. Visit-to-visit variability of blood pressure and cardiovascular disease and all-cause mortality: A systematic review and meta-analysis. Hypertension 2014, 64, 965–982. [Google Scholar] [CrossRef]
- Sesso, H.D.; Stampfer, M.J.; Rosner, B.; Gaziano, J.M.; Hennekens, C.H. Two-year changes in blood pressure and subsequent risk of cardiovascular disease in men. Circulation 2000, 102, 307–312. [Google Scholar] [CrossRef] [PubMed][Green Version]
- WHO Expert Consultation. Appropriate body-mass index for Asian populations and its implications for policy and intervention strategies. Lancet 2004, 363, 157–163. [Google Scholar] [CrossRef]
- Sundararajan, V.; Henderson, T.; Perry, C.; Muggivan, A.; Quan, H.; Ghali, W.A. New ICD-10 version of the Charlson comorbidity index predicted in-hospital mortality. J. Clin. Epidemiol. 2004, 57, 1288–1294. [Google Scholar] [CrossRef]
- WHO. ATC/DDD Index 2018. Available online: https://www. whocc. no/atc_ddd_index (accessed on 15 April 2018).
- Tsan, Y.-T.; Lee, C.-H.; Wang, J.-D.; Chen, P.-C. Statins and the risk of hepatocellular carcinoma in patients with hepatitis B virus infection. J. Clin. Oncol. 2012, 30, 623–630. [Google Scholar] [CrossRef]
- Parizadeh, D.; Ghahvehchian, H.; Asgari, S.; Momenan, A.A.; Azizi, F.; Hadaegh, F. The association between changes in blood pressure components and incident cardiovascular diseases. Blood Pressure 2017, 26, 341–349. [Google Scholar] [CrossRef]
- Roth, G.A.; Johnson, C.; Abajobir, A.; Abd-Allah, F.; Abera, S.F.; Abyu, G.; Ahmed, M.; Aksut, B.; Alam, T.; Alam, K.; et al. Global, Regional, and National Burden of Cardiovascular Diseases for 10 Causes, 1990 to 2015. J. Am. Coll. Cardiol. 2017, 70, 1–25. [Google Scholar] [CrossRef] [PubMed]
- Ishikawa, Y.; Ishikawa, J.; Ishikawa, S.; Kario, K.; Kajii, E. Progression from prehypertension to hypertension and risk of cardiovascular disease. J. Epidemiol. 2017, 27, 8–13. [Google Scholar] [CrossRef] [PubMed]
- Tsimploulis, A.; Sheriff, H.M.; Lam, P.H.; Dooley, D.J.; Anker, M.S.; Papademetriou, V.; Fletcher, R.D.; Faselis, C.; Fonarow, G.C.; Deedwania, P.; et al. Systolic-diastolic hypertension versus isolated systolic hypertension and incident heart failure in older adults: Insights from the Cardiovascular Health Study. Int. J. Cardiol. 2017, 235, 11–16. [Google Scholar] [CrossRef] [PubMed]
- Yano, Y.; Stamler, J.; Garside, D.B.; Daviglus, M.L.; Franklin, S.S.; Carnethon, M.R.; Liu, K.; Greenland, P.; Lloyd-Jones, D.M. Isolated systolic hypertension in young and middle-aged adults and 31-year risk for cardiovascular mortality: The Chicago Heart Association Detection Project in Industry study. J. Am. Coll. Cardiol. 2015, 65, 327–335. [Google Scholar] [CrossRef] [PubMed]
- Nielsen, W.B.; Lindenstrom, E.; Vestbo, J.; Jensen, G.B. Is diastolic hypertension an independent risk factor for stroke in the presence of normal systolic blood pressure in the middle-aged and elderly? Am. J. Hypertens. 1997, 10, 634–639. [Google Scholar] [CrossRef]
- Handler, J.; Zhao, Y.; Egan, B.M. Impact of the number of blood pressure measurements on blood pressure classification in US adults: NHANES 1999–2008. J. Clin. Hypertens. 2012, 14, 751–759. [Google Scholar] [CrossRef] [PubMed]
- Burkard, T.; Mayr, M.; Winterhalder, C.; Leonardi, L.; Eckstein, J.; Vischer, A.S. Reliability of single office blood pressure measurements. Heart 2018, 104, 1173–1179. [Google Scholar] [CrossRef] [PubMed]


© 2019 by the authors. Licensee MDPI, Basel, Switzerland. This article is an open access article distributed under the terms and conditions of the Creative Commons Attribution (CC BY) license (http://creativecommons.org/licenses/by/4.0/).