Differing Spontaneous Brain Activity in Healthy Adults with Two Different Body Constitutions: A Resting-State Functional Magnetic Resonance Imaging Study

 ,
,
Abstract
:1. Introduction
2. Methods
2.1. Study Design and Participants
2.2. MRI Acquisition
2.3. Data Preprocessing
2.4. ALFF and ReHo Analyses
2.5. Statistical Analysis
2.5.1. Within-Group Analysis
2.5.2. Between-Group Analysis
2.5.3. Correlation Analysis
3. Results
3.1. Demographic Data
3.2. Behavior Scale Correlations in the Different Groups
3.3. ReHo and ALFF Analyses
3.4. Correlation Analysis
4. Discussion
5. Conclusions
Supplementary Materials
Author Contributions
Funding
Acknowledgments
Conflicts of Interest
References
- Chan, R.Y.; Chien, W.T. Concepts of body constitution, health and sub-health from traditional Chinese medicine perspective. World J. Transl. Med. 2013, 2, 56–66. [Google Scholar] [CrossRef]
- Hong, T.-Z. Challenges in learning and understanding traditional Chinese medicine and acupuncture. Open Acc. J. Complement. Altern. Med. Acupunct. 2018, 1, OAJCAM. [Google Scholar] [CrossRef]
- Sun, Y.; Zhao, Y.; An, X.S.; Chen, J. The theory development of traditional Chinese medicine constitution: A review. J. Tradit. Chin. Med. Sci. 2018, 5, 16–28. [Google Scholar] [CrossRef]
- Su, Y.C.; Chen, L.L.; Lin, J.D.; Lin, J.S.; Huang, Y.C.; Lai, J.S. BCQ+: A body constitution questionnaire to assess Yang-Xu. Part I: Establishment of a first final version through a Delphi process. Forsch. Komplementarmed. 2008, 15, 327–334. [Google Scholar]
- Wang, Q.; Zhu, Y.B.; Xue, H.S.; Li, S. Primary compiling of constitution in Chinese medicine questionnaire. Chin. J. Clin. Rehab. 2006, 10, 12–14. [Google Scholar]
- Wang, Q.; Yao, S. Molecular basis for cold-intolerant yang-deficient constitution of traditional Chinese medicine. Am. J. Chin. Med. 2008, 36, 827–834. [Google Scholar] [CrossRef] [PubMed]
- Wang, Q.; Yao, S.L.; Dong, J.; Wu, H.D.; Wu, C.Y.; Xia, Z.Y.; Shi, H.F.; Pang, G.M.; Deng, Q.W.; Zhao, J.X.; et al. Changes of endocrine and immune function in subjects of yang deficiency constitution. J. Chin. Integr. Med. 2008, 6, 1226–1232. [Google Scholar] [CrossRef]
- Yu, R.; Liu, D.; Yang, Y.; Han, Y.; Li, L.; Zheng, L.; Wang, J.; Zhang, Y.; Li, Y.; Wang, Q.F.; et al. Expression profiling-based clustering of healthy subjects recapitulates classifications defined by clinical observation in Chinese medicine. J. Genet. Genom. 2017, 44, 191–197. [Google Scholar] [CrossRef]
- Wang, R.; Wang, J.; Guo, L.L. Effect of traditional Chinese medicine on coronary heart disease with phlegm and blood stasis syndrome. Chin. J. Chin. Mater. Med. 2016, 41, 35–37. [Google Scholar]
- Han, Y.M. ZLZLK: Characteristic of constitution theory in traditional Chinese medicine. Zhongyi Linchuang Kangfu 2005, 9, 130–131. [Google Scholar]
- Scognamiglio, C.; Houenou, J. A meta-analysis of fMRI studies in healthy relatives of patients with schizophrenia. Aust. N. Z. J. Psychiatry 2014, 48, 907–916. [Google Scholar] [CrossRef] [PubMed]
- Webb, C.A.; Dillon, D.G.; Pechtel, P.; Goer, F.K. Neural correlates of three promising endophenotypes of depression: Evidence from the EMBARC study. Neuropsychopharmacology 2016, 41, 454–463. [Google Scholar] [CrossRef] [PubMed]
- Ogawa, S.; Lee, T.M.; Kay, A.R.; Tank, D.W. Brain magnetic resonance imaging with contrast dependent on blood oxygenation. Proc. Natl. Acad. Sci. USA 1990, 87, 9868–9872. [Google Scholar] [CrossRef] [PubMed]
- Biswal, B.; Yetkin, F.Z.; Haughton, V.M.; Hyde, J.S. Functional connectivity in the motor cortex of resting human brain using echo-planar MRI. Magn. Reson. Med. 1995, 34, 537–541. [Google Scholar] [CrossRef] [PubMed]
- Smith, K. Brain imaging: fMRI 2.0. Nature 2012, 484, 24–26. [Google Scholar] [CrossRef] [PubMed] [Green Version]
- Guerra-Carrillo, B.; Mackey, A.P.; Bunge, S.A. Resting-state fMRI: A window into human brain plasticity. Neuroscientist 2014, 20, 522–533. [Google Scholar] [CrossRef] [PubMed]
- He, T.; Zhu, W.; Du, S.Q.; Yang, J.W.; Li, F.; Yang, B.F.; Shi, G.X.; Liu, C.Z. Neural mechanisms of acupuncture as revealed by fMRI studies. Auton. Neurosci. 2015, 190, 1–9. [Google Scholar] [CrossRef] [PubMed]
- Cai, R.L.; Shen, G.M.; Wang, H.; Guan, Y.Y. Brain functional connectivity network studies of acupuncture: A systematic review on resting-state fMRI. J. Integr. Med. 2018, 16, 26–33. [Google Scholar] [CrossRef]
- Lin, C.; Zhou, Z.; Xu, J.; Li, Q.; Guo, J.; Long, M.; Wu, D.; Zhang, Y. Changes of brain activity during a functional magnetic resonance imaging stroop task study: Effect of Chinese herbal formula in Alzheimer’s disease. Eur. J. Integr. Med. 2017, 16, 46–53. [Google Scholar] [CrossRef]
- Xu, Z.; Zhang, S.; Huang, L.; Zhu, X.; Zhao, Q.; Zeng, Y.; Zhou, D.; Wang, D.; Kuga, H.; Kamiya, A.; et al. Altered resting-state brain activities in drug-naive major depressive disorder assessed by fMRI: Associations with somatic symptoms defined by Yin-Yang theory of the traditional Chinese medicine. Front. Psychiaty 2018, 9, 195. [Google Scholar] [CrossRef]
- Margulies, D.S.; Bottger, J.; Long, X.; Lv, Y.; Kelly, C.; Schafer, A.; Goldhahn, D.; Abbushi, A.; Milham, M.P.; Lohmann, G.; et al. Resting developments: A review of fMRI post-processing methodologies for spontaneous brain activity. Magma 2010, 23, 289–307. [Google Scholar] [CrossRef] [PubMed]
- Lv, H.; Wang, Z. Resting-state functional MRI: Everything that nonexperts have always wanted to know. Am. J. Neuroradiol. 2018, 39, 1390–1399. [Google Scholar] [CrossRef] [PubMed]
- Zang, Y.; Jiang, T.; Lu, Y.; He, Y.; Tian, L. Regional homogeneity approach to fMRI data analysis. Neuroimage 2004, 22, 394–400. [Google Scholar] [CrossRef] [PubMed]
- Zang, Y.F.; He, Y.; Zhu, C.Z.; Cao, Q.J.; Sui, M.Q.; Liang, M.; Tian, L.X.; Jiang, T.Z.; Wang, Y.F. Altered baseline brain activity in children with ADHD revealed by resting-state functional MRI. Brain Dev. 2007, 29, 83–91. [Google Scholar] [PubMed]
- Cui, Y.; Jiao, Y.; Chen, Y.C.; Wang, K.; Gao, B.; Wen, S.; Ju, S.; Teng, G.J. Altered spontaneous brain activity in type 2 diabetes: A resting-state functional MRI study. Diabetes 2014, 63, 749–760. [Google Scholar] [CrossRef] [PubMed]
- Xu, Y.; Zhuo, C.; Qin, W.; Zhu, J.; Yu, C. Altered spontaneous brain activity in schizophrenia: A meta-analysis and a large-sample study. BioMed Res. Int. 2015, 2015, 204628. [Google Scholar] [CrossRef] [PubMed]
- An, L.; Cao, Q.J.; Sui, M.Q.; Sun, L.; Zou, Q.H.; Zang, Y.F.; Wang, Y.F. Local synchronization and amplitude of the fluctuation of spontaneous brain activity in attention-deficit/hyperactivity disorder: A resting-state fMRI study. Neurosci. Bull. 2013, 29, 603–613. [Google Scholar] [CrossRef] [PubMed]
- Yao, G.; Wu, C.H. Factorial invariance of the WHOQOL-BREF among disease groups. Qual. Life Res. 2005, 14, 1881–1888. [Google Scholar] [CrossRef] [PubMed]
- Yan, C.G.; Wang, X.D.; Zuo, X.N.; Zang, Y.F. DPABI: Data processing & analysis for (resting-state) brain imaging. Neuroinformatics 2016, 14, 339–351. [Google Scholar]
- Kanda, M.; Nagamine, T.; Ikeda, A.; Ohara, S.; Kunieda, T.; Fujiwara, N.; Yazawa, S.; Sawamoto, N.; Matsumoto, R.; Taki, W.; et al. Primary somatosensory cortex is actively involved in pain processing in human. Brain Res. 2000, 853, 282–289. [Google Scholar] [CrossRef]
- Baehr, M.F.M. Duus’ Topical Diagnosis in Neurology: Anatomy, Physiology, Signs, Symptoms, 4th ed.; Thieme: New York, NY, USA, 2005. [Google Scholar]
- Borich, M.R.; Brodie, S.M.; Gray, W.A.; Ionta, S.; Boyd, L.A. Understanding the role of the primary somatosensory cortex: Opportunities for rehabilitation. Neuropsychologia 2015, 79, 246–255. [Google Scholar] [CrossRef] [PubMed] [Green Version]
- Chen, L.L.; Lin, J.S.; Lin, J.D.; Chang, C.H.; Kuo, H.W.; Liang, W.M.; Su, Y.C. BCQ+: A body constitution questionnaire to assess Yang-Xu. Part II: Evaluation of reliability and validity. Forsch. Komplementarmed. 2009, 16, 20–27. [Google Scholar]
- Lin, J.S.; Chen, L.L.; Lin, J.D.; Chang, C.H.; Huang, C.H.; Mayer, P.K.; Su, Y.C. BCQ-: A body constitution questionnaire to assess Yin-Xu. Part II: Evaluation of reliability and validity. Forsch. Komplementarmed. 2012, 19, 285–292. [Google Scholar] [CrossRef] [PubMed]
- Riemann, B.L.; Lephart, S.M. The sensorimotor system, Part II: The role of proprioception in motor control and functional joint stability. J. Athlet. Train. 2002, 37, 80–84. [Google Scholar]
- Li, J.; Li, G.X.; Guo, Y.; Lu, X.Q.; Li, L.; Ding, J.P. Regional homogeneity in the patients of irritable bowel syndrome complicated with depression: A resting-state functional magnetic resonance imaging study. Zhonghua Yi Xue Za Zhi 2018, 98, 196–201. [Google Scholar] [PubMed]
- Zhen, D.; Xia, W.; Yi, Z.Q.; Zhao, P.W.; Zhong, J.G.; Shi, H.C.; Li, H.L.; Dai, Z.Y.; Pan, P.L. Alterations of brain local functional connectivity in amnestic mild cognitive impairment. Transl. Neurodegen. 2018, 7, 26. [Google Scholar] [CrossRef] [PubMed]
- Zhang, S.S.; Wu, W.; Liu, Z.P.; Huang, G.Z.; Guo, S.G.; Yang, J.M. Altered regional homogeneity in experimentally induced low back pain: A resting-state fMRI study. J. Neuroeng. Rehabil. 2014, 11, 115. [Google Scholar] [CrossRef]
- Chen, H.; He, J.; Teng, L.; Yuan, C.; Zhang, Z. Traditional Chinese medicine symptom pattern analysis for Parkinson’s disease. J. Tradit. Chin. Med. 2017, 37, 688–694. [Google Scholar]
- Guo, J.; Chen, H.; Song, J.; Wang, J.; Zhao, L.; Tong, X. Syndrome differentiation of diabetes by the traditional Chinese medicine according to evidence-based medicine and expert consensus opinion. eCAM 2014, 2014, 492193. [Google Scholar] [CrossRef]
- Wang, J.J.; Chen, X.; Sah, S.K.; Zeng, C.; Li, Y.M.; Li, N.; Liu, M.Q.; Du, S.L. Amplitude of low-frequency fluctuation (ALFF) and fractional ALFF in migraine patients: A resting-state functional MRI study. Clin. Radiol. 2016, 71, 558–564. [Google Scholar] [CrossRef]
- Yuan, C.; Zhu, H.; Ren, Z.; Yuan, M.; Gao, M.; Zhang, Y.; Li, Y.; Meng, Y.; Gong, Q.; Lui, S.; et al. Precuneus-related regional and network functional deficits in social anxiety disorder: A resting-state functional MRI study. Compr. Psychiatry 2018, 82, 22–29. [Google Scholar] [CrossRef] [PubMed]
- Tracey, I.; Mantyh, P. The cerebral signature for pain perception and its modulation. Neuron 2007, 55, 377–391. [Google Scholar] [CrossRef]
- Garcia-Larrea, L.; Peyron, R. Pain matrices and neuropathic pain matrices: A review. Pain 2013, 154, S29–S43. [Google Scholar] [CrossRef] [PubMed] [Green Version]
- Schmahmann, J.D.; Weilburg, J.B.; Sherman, J.C. The neuropsychiatry of the cerebellum—Insights from the clinic. Cerebellum 2007, 6, 254–267. [Google Scholar] [CrossRef] [PubMed]
- Ito, M. The Cerebellum and Neural Control; Raven Press Books, Ltd.: New York, NY, USA, 1984. [Google Scholar]
- Yeo, B.T.; Krienen, F.M.; Sepulcre, J.; Sabuncu, M.R.; Lashkari, D.; Hollinshead, M.; Roffman, J.L.; Smoller, J.W.; Zollei, L.; Polimeni, J.R.; et al. The organization of the human cerebral cortex estimated by intrinsic functional connectivity. J. Neurophysiol. 2011, 106, 1125–1165. [Google Scholar] [PubMed]
- Stoodley, C.J.; Valera, E.M.; Schmahmann, J.D. Functional topography of the cerebellum for motor and cognitive tasks: An fMRI study. Neuroimage 2012, 59, 1560–1570. [Google Scholar] [CrossRef] [PubMed] [Green Version]
- Zhou, F.; Gu, L.; Hong, S.; Liu, J.; Jiang, J.; Huang, M.; Zhang, Y.; Gong, H. Altered low-frequency oscillation amplitude of resting state-fMRI in patients with discogenic low-back and leg pain. J. Pain Res. 2018, 11, 165–176. [Google Scholar] [CrossRef]
- Atlas, L.Y.; Wager, T.D. A meta-analysis of brain mechanisms of placebo analgesia: Consistent findings and unanswered questions. Handb. Exp. Pharmacol. 2014, 225, 37–69. [Google Scholar]
- Hiser, J.; Koenigs, M. The multifaceted role of ventromedial prefrontal cortex in emotion, decision-making, social cognition, and psychopathology. Biol. Psychiatry 2018, 83, 638–647. [Google Scholar] [CrossRef]
- Damasio, A.R.; Tranel, D.; Damasio, H. Individuals with sociopathic behavior caused by frontal damage fail to respond autonomically to social stimuli. Behav. Brain Res. 1990, 41, 81–94. [Google Scholar] [CrossRef]
- Koenigs, M.; Huey, E.D.; Calamia, M.; Raymont, V.; Tranel, D.; Grafman, J. Distinct regions of prefrontal cortex mediate resistance and vulnerability to depression. J. Neurosci. 2008, 28, 12341–12348. [Google Scholar] [CrossRef] [PubMed]
- Koenigs, M.; Huey, E.D.; Raymont, V.; Cheon, B.; Solomon, J.; Wassermann, E.M.; Grafman, J. Focal brain damage protects against post-traumatic stress disorder in combat veterans. Nature Neurosci. 2008, 11, 232–237. [Google Scholar] [CrossRef] [PubMed]
- Hao, H.; Chen, C.; Mao, W.; Zhong, J.; Dai, Z. Aberrant brain regional homogeneity in first-episode drug-naive patients with major depressive disorder: A voxel-wise meta-analysis. J. Affect. Disord. 2019, 245, 63–71. [Google Scholar] [CrossRef] [PubMed]
- Zhang, Y.F.; Han, Y.; Wang, Y.Z.; Zhang, Y.F.; Jia, H.X.; Jin, E.H.; Deng, L.G.; Li, L. Characterization of resting-state fMRI-derived functional connectivity in patients with deficiency versus excess patterns of major depression. Complement. Ther. Med. 2015, 23, 7–13. [Google Scholar] [CrossRef] [PubMed]
- Bosch, P.; de Rover, P.; Staudte, H.; Lim, S.; van den Noort, M. Schizophrenia, depression, and sleep disorders: Their traditional oriental medicine equivalents. J. Acupunct. Meridian Stud. 2015, 8, 17–22. [Google Scholar] [CrossRef] [PubMed]
- Shimamura, A.P. The role of the prefrontal cortex in dynamic filtering. Psychobiology 2000, 28, 207–218. [Google Scholar]
- Zhang, X.; Di, X.; Lei, H.; Yang, J.; Xiao, J.; Wang, X.; Yao, S.; Rao, H. Imbalanced spontaneous brain activity in orbitofrontal-insular circuits in individuals with cognitive vulnerability to depression. J. Affect. Disord. 2016, 198, 56–63. [Google Scholar] [CrossRef] [PubMed]

| Characteristics | BCQ-G (n = 18) | BCQ-D (n = 14) | p-Value |
|---|---|---|---|
| Gender (M/F) | 9/9 | 6/8 | 0.688 |
| Age (years) | 52.0 ± 6.32 | 46.36 ± 9.95 | 0.396 |
| BMI | 23.68 ± 2.39 | 24.04 ± 4.56 | 0.794 |
| BCQ Subtype | |||
| YinD | 25.78 ± 2.92 | 34.64 ± 5.02 | 0.000 ** |
| YaD | 25.28 ± 2.65 | 37.21 ± 4.95 | 0.000 ** |
| Phl & STA | 20.06 ± 3.03 | 27.21 ± 4.84 | 0.000 ** |
| WHOQOL-BREF, total | 61.38 ± 8.28 | 58.25 ± 7.24 | 0.27 |
| Physical | 16.10 ± 1.82 | 15.51 ± 1.52 | 0.341 |
| Psychological | 14.78 ± 2.22 | 13.71 ± 2.33 | 0.199 |
| Social | 15.26 ± 2.30 | 14.38 ± 3.10 | 0.390 |
| Environmental | 15.25 ± 2.35 | 14.64 ± 1.20 | 0.386 |
| All Healthy Adult Subjects (n = 32) | BCQ-Gentleness (n = 18) | BCQ-Deficiency (n = 14) | ||||||||||||||
|---|---|---|---|---|---|---|---|---|---|---|---|---|---|---|---|---|
| WHOQOL-BREF (Subdomains) | WHOQOL-BREF (Subdomains) | WHOQOL-BREF (Subdomains) | ||||||||||||||
| Phy | Psy | Soc | Evn | Sum | Phy | Psy | Soc | Evn | Sum | Phy | Psy | Soc | Evn | Sum | ||
| YinD | Pearson r | −0.226 | −0.345 | −0.294 | −0.256 | −0.317 | −0.306 | −0.395 | −0.323 | −0.206 | −0.333 | −0.019 | −0.185 | −0.244 | −0.310 | −0.220 |
| p value | 0.214 | 0.53 | 0.102 | 0.158 | 0.077 | 0.217 | 0.105 | 0.191 | 0.412 | 0.177 | 0.949 | 0.528 | 0.400 | 0.280 | 0.451 | |
| YaD | Pearson r | −0.246 | −0.430 * | −0.313 | −0.277 | −0.358 * | −0.243 | −0.465 | −0.413 | −0.239 | −0.375 | −0.172 | −0.469 | −0.316 | −0.453 | −0.398 |
| p value | 0.174 | 0.014 * | 0.081 | 0.125 | 0.044 * | 0.332 | 0.052 | 0.089 | 0.340 | 0.125 | 0.556 | 0.091 | 0.270 | 0.104 | 0.159 | |
| P&S | Pearson r | −0.165 | −0.412 * | −0.241 | −0.208 | −0.293 | 0.034 | −0.294 | −0.274 | −0.158 | −0.202 | −0.170 | −0.416 | −0.125 | −0.158 | −0.250 |
| p value | 0.368 | 0.019 * | 0.183 | 0.254 | 0.104 | 0.893 | 0.236 | 0.271 | 0.531 | 0.421 | 0.561 | 0.139 | 0.669 | 0.589 | 0.389 | |
| Contrast | Region | BA | Size | t Score | Peak Coordinate | ||
|---|---|---|---|---|---|---|---|
| x | y | z | |||||
| ReHo | |||||||
| Within-group ** | |||||||
| BCQ-Gentleness | |||||||
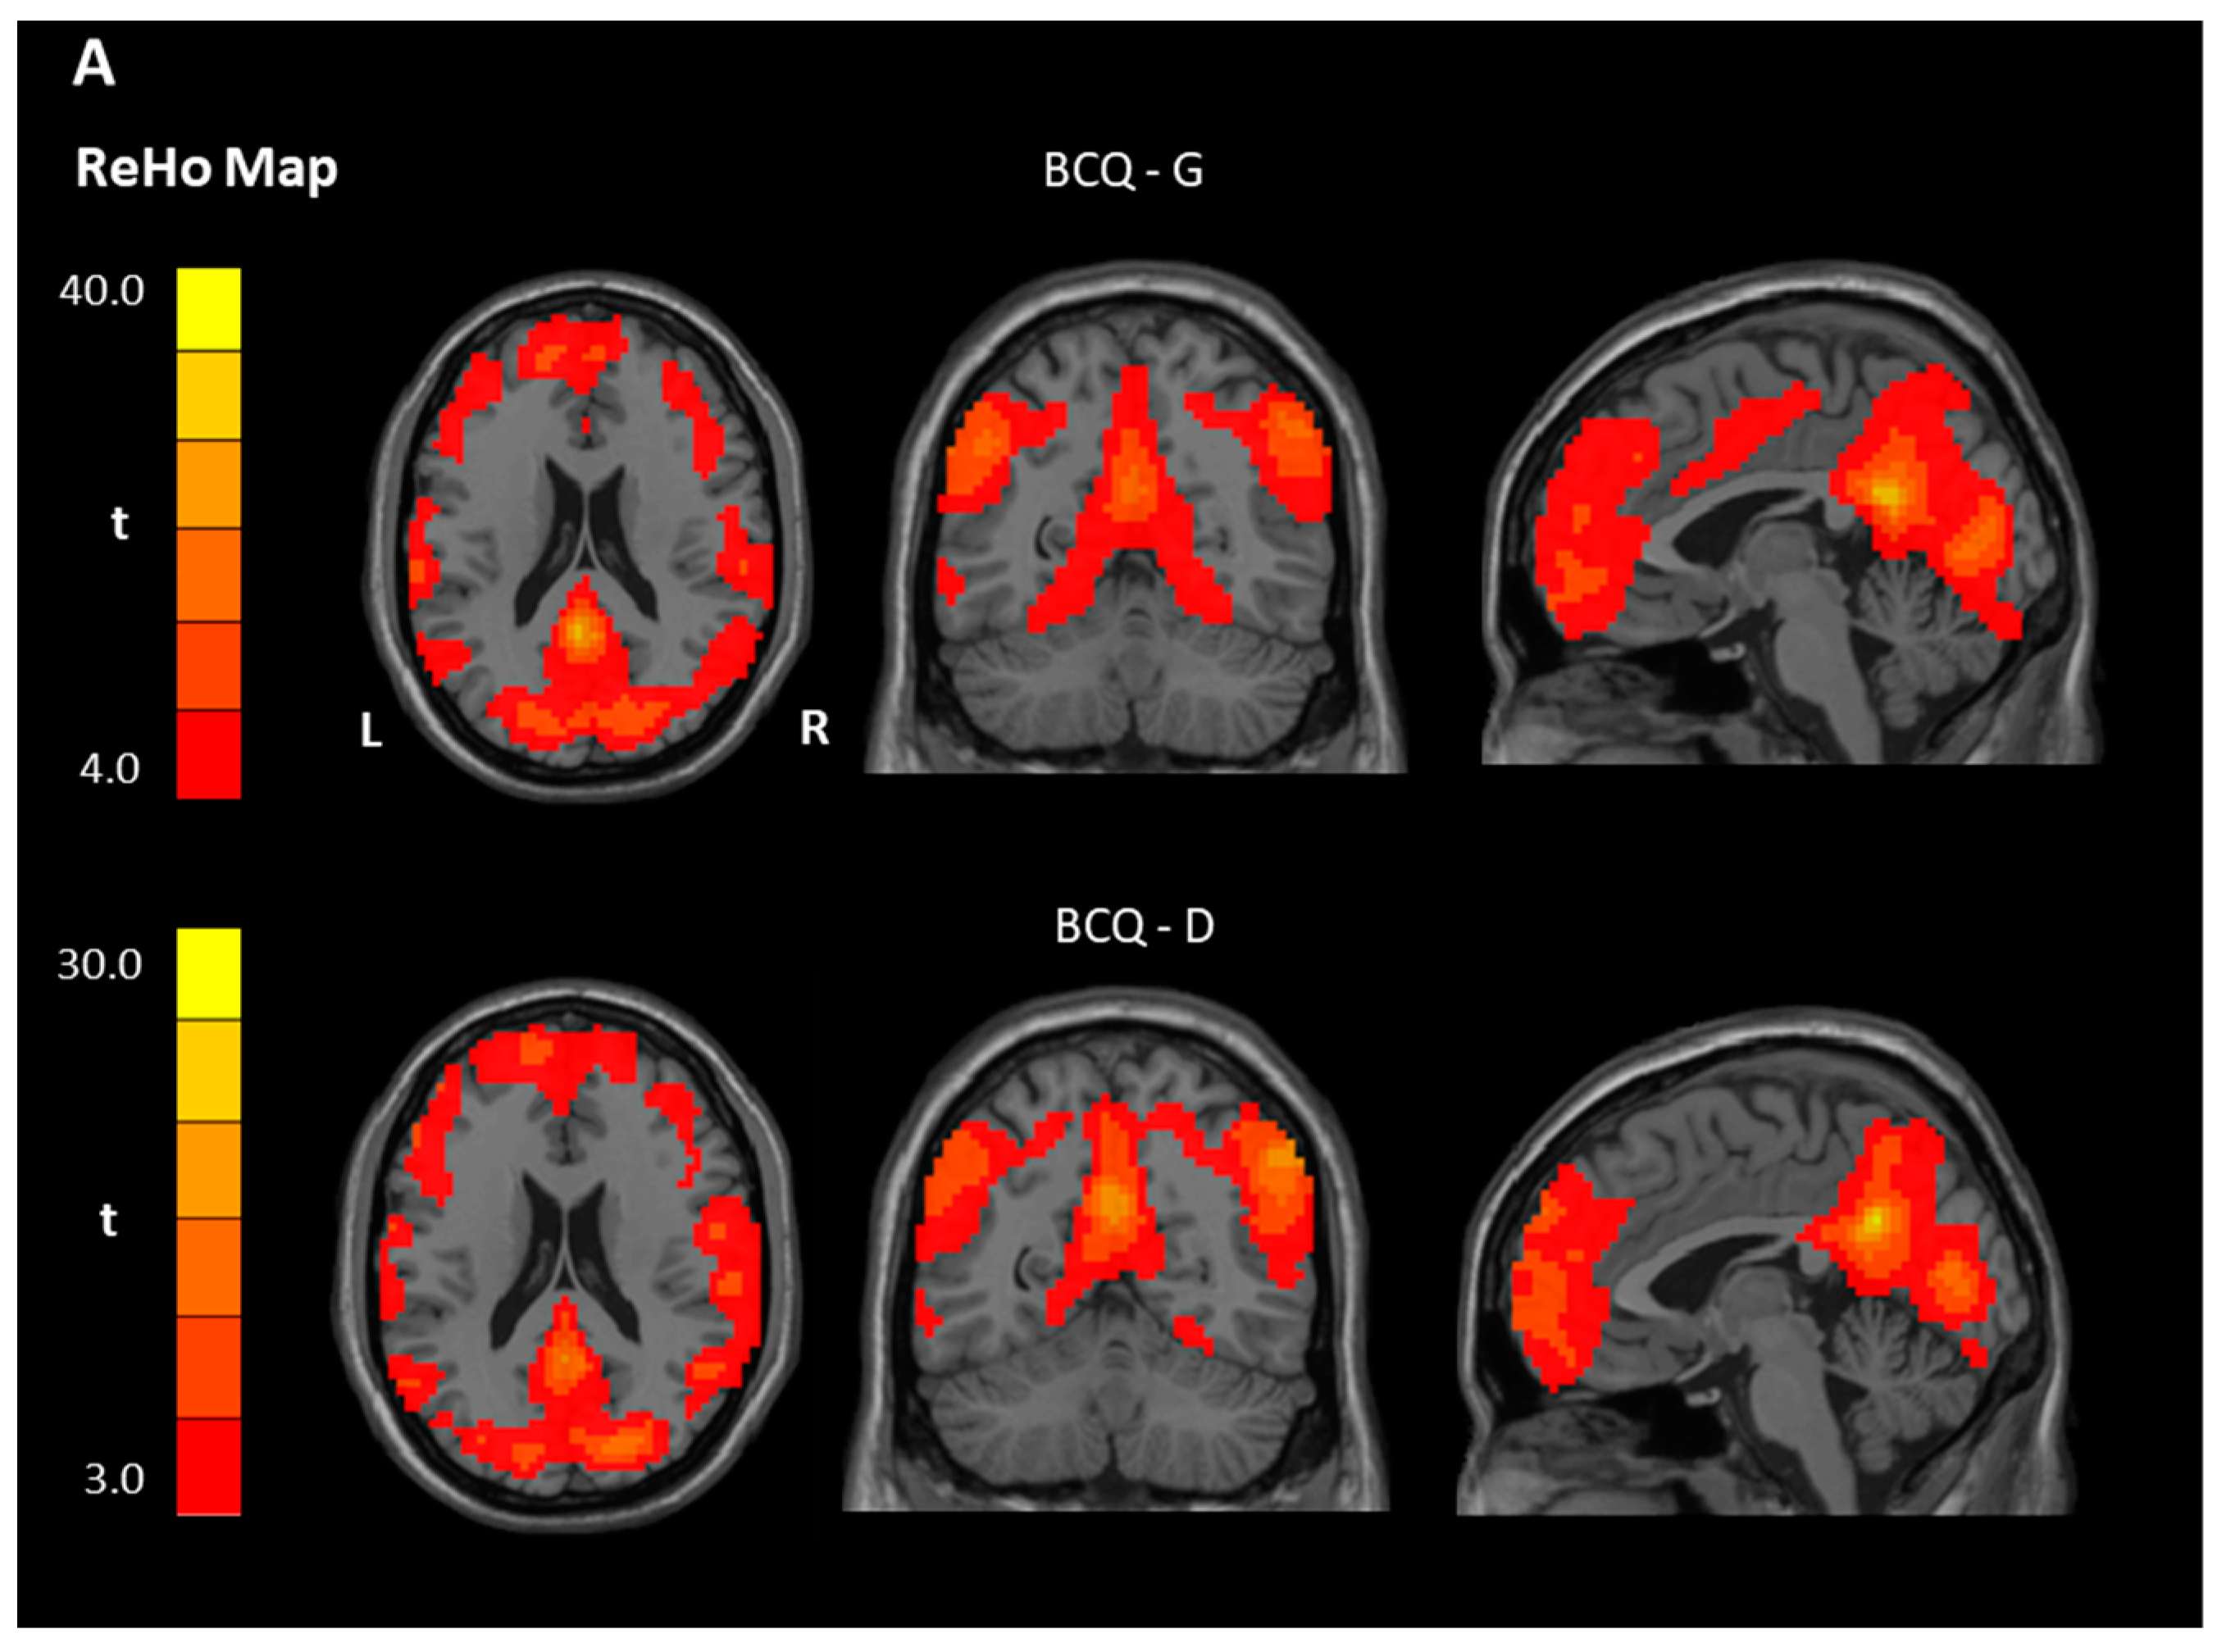
| Gentleness > 0 | PCC, Left | 23 | 16,838 | 33.85 | −3 | −48 | 24 |
| Gentleness < 0 | NS | ||||||
| BCQ-Deficiency | |||||||
| Deficiency > 0 | PCC, Left | 23 | 8516 | 30.36 | −3 | −54 | 30 |
| OFC, Right | 11 | 4593 | 21.54 | 42 | 52 | −12 | |
| Deficiency < 0 | NS | ||||||
| Between-group * | |||||||
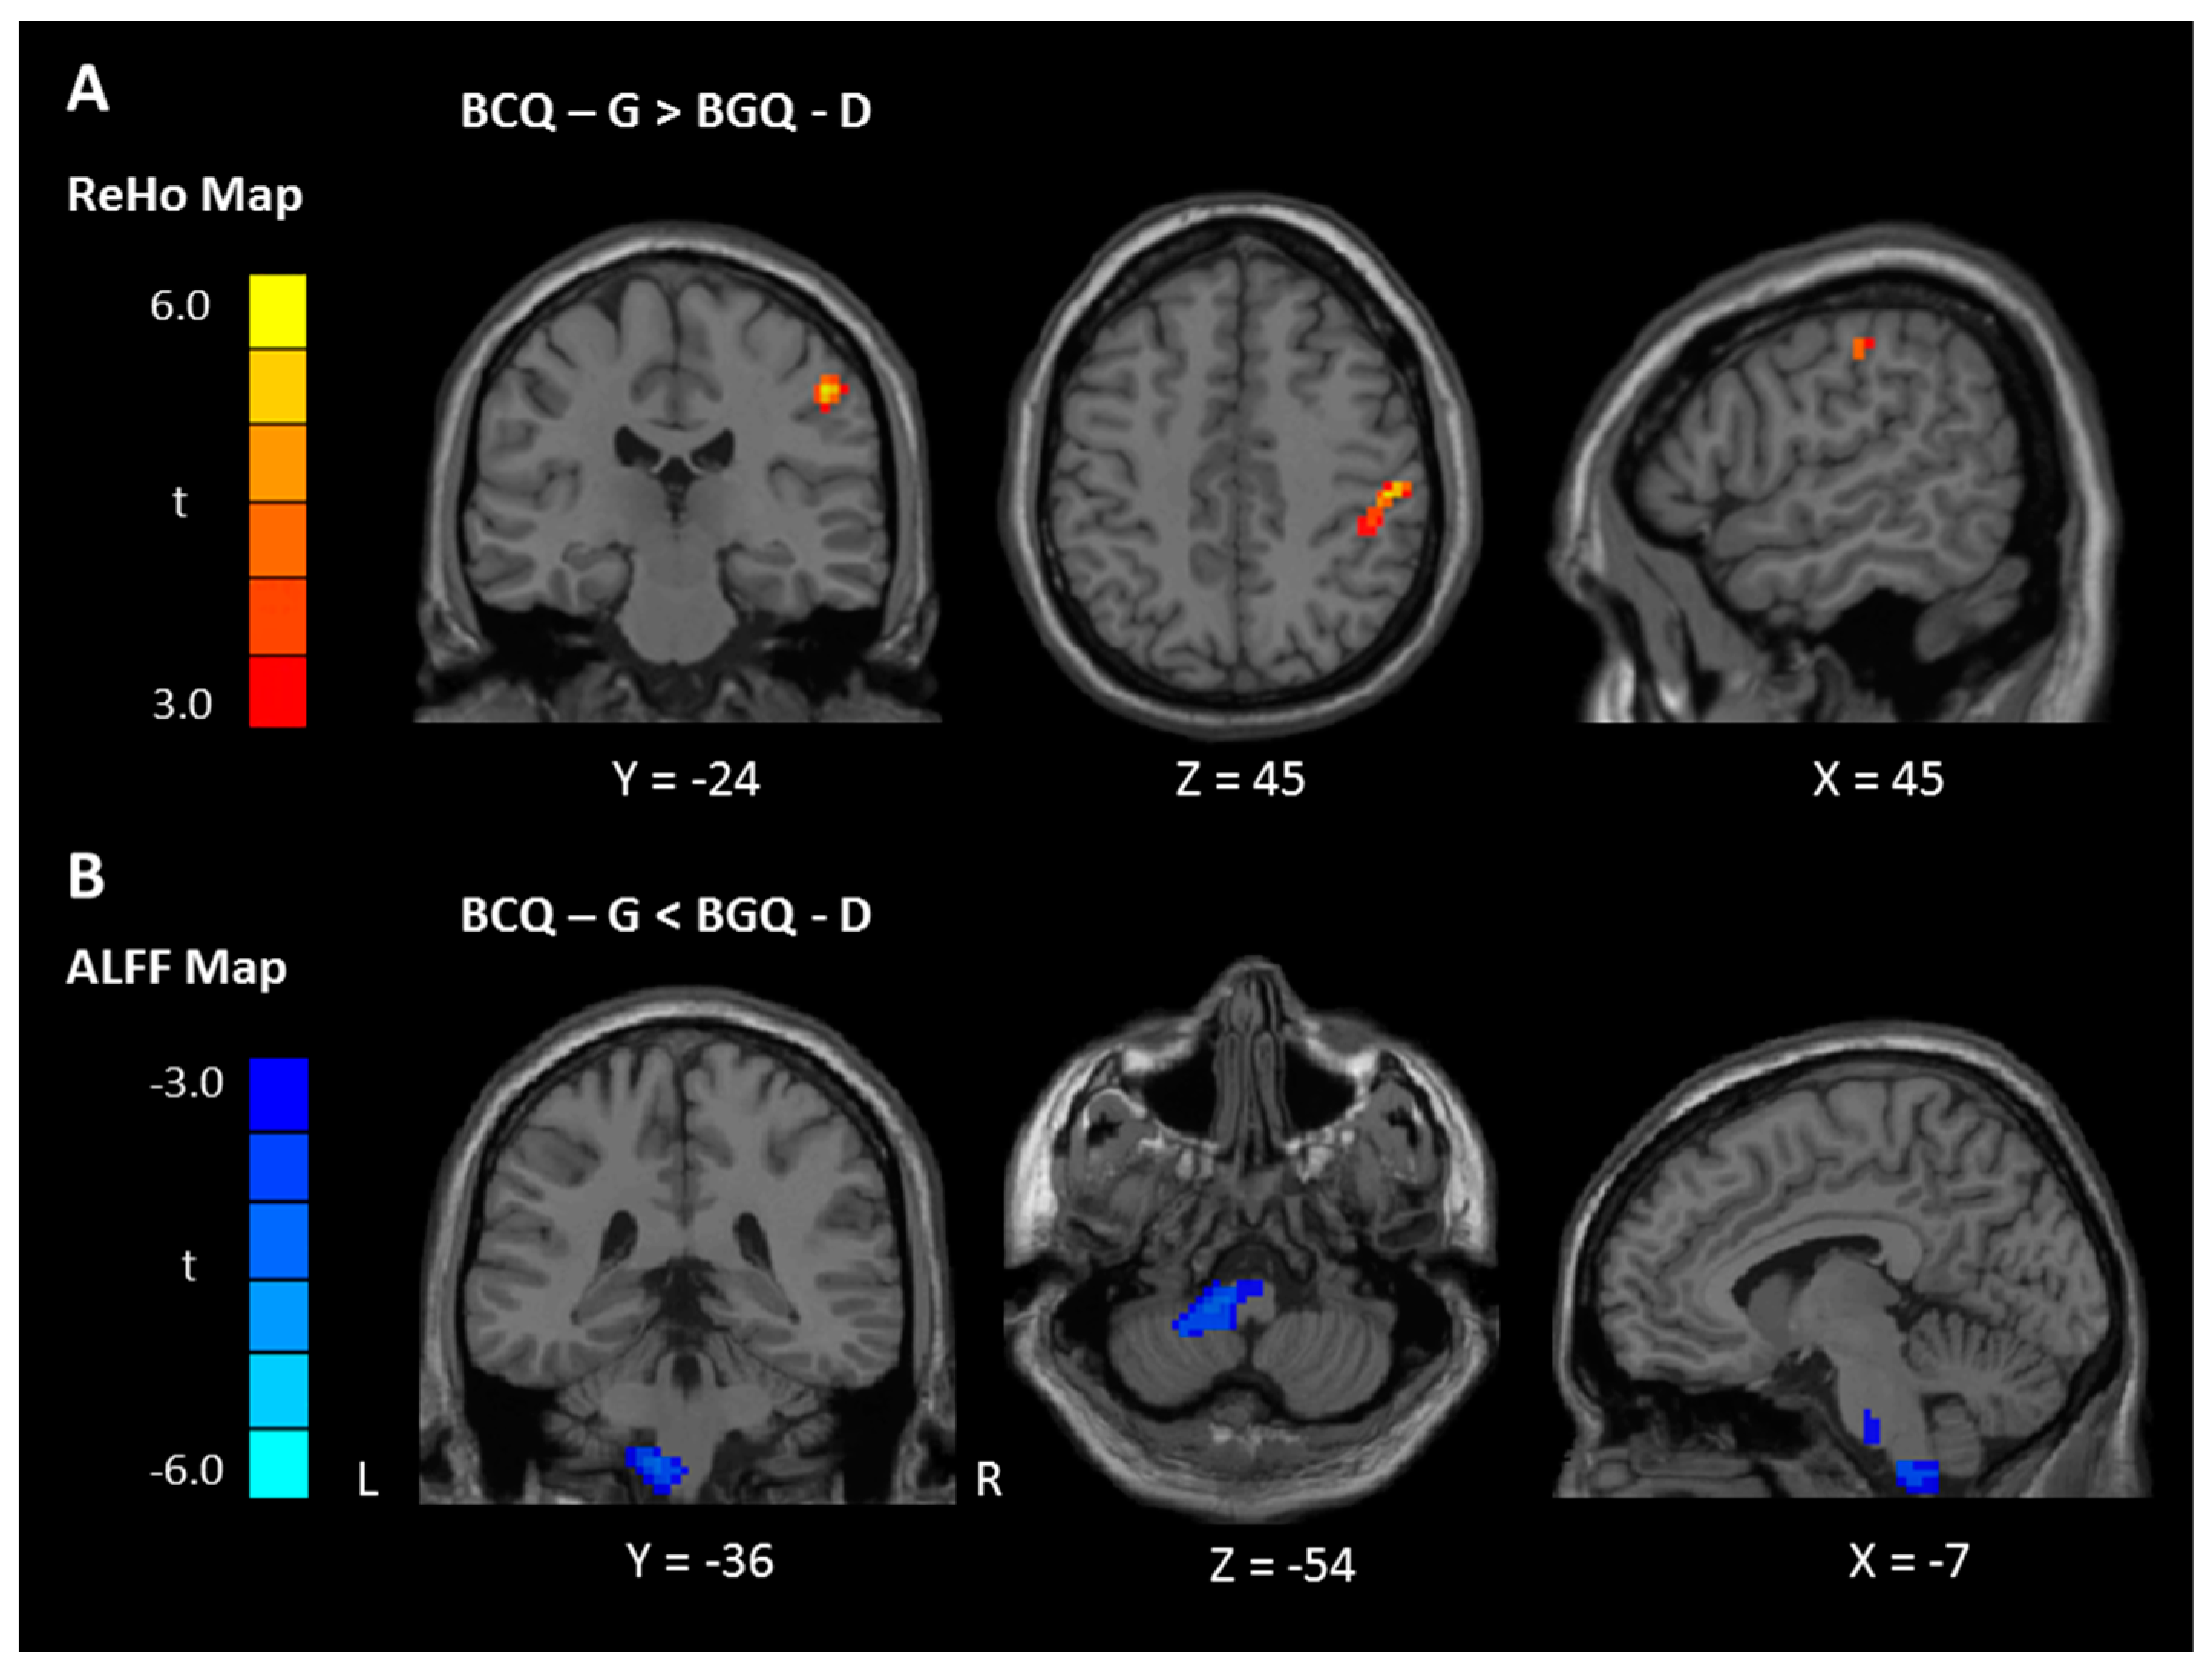
| Gentleness > Deficiency | Postcentral gyrus | 2 | 69 | 5.37 | 51 | −24 | 45 |
| Gentleness < Deficiency | NS | ||||||
| ALFF | |||||||
| Within-group ** | |||||||
| BCQ-Gentleness | |||||||
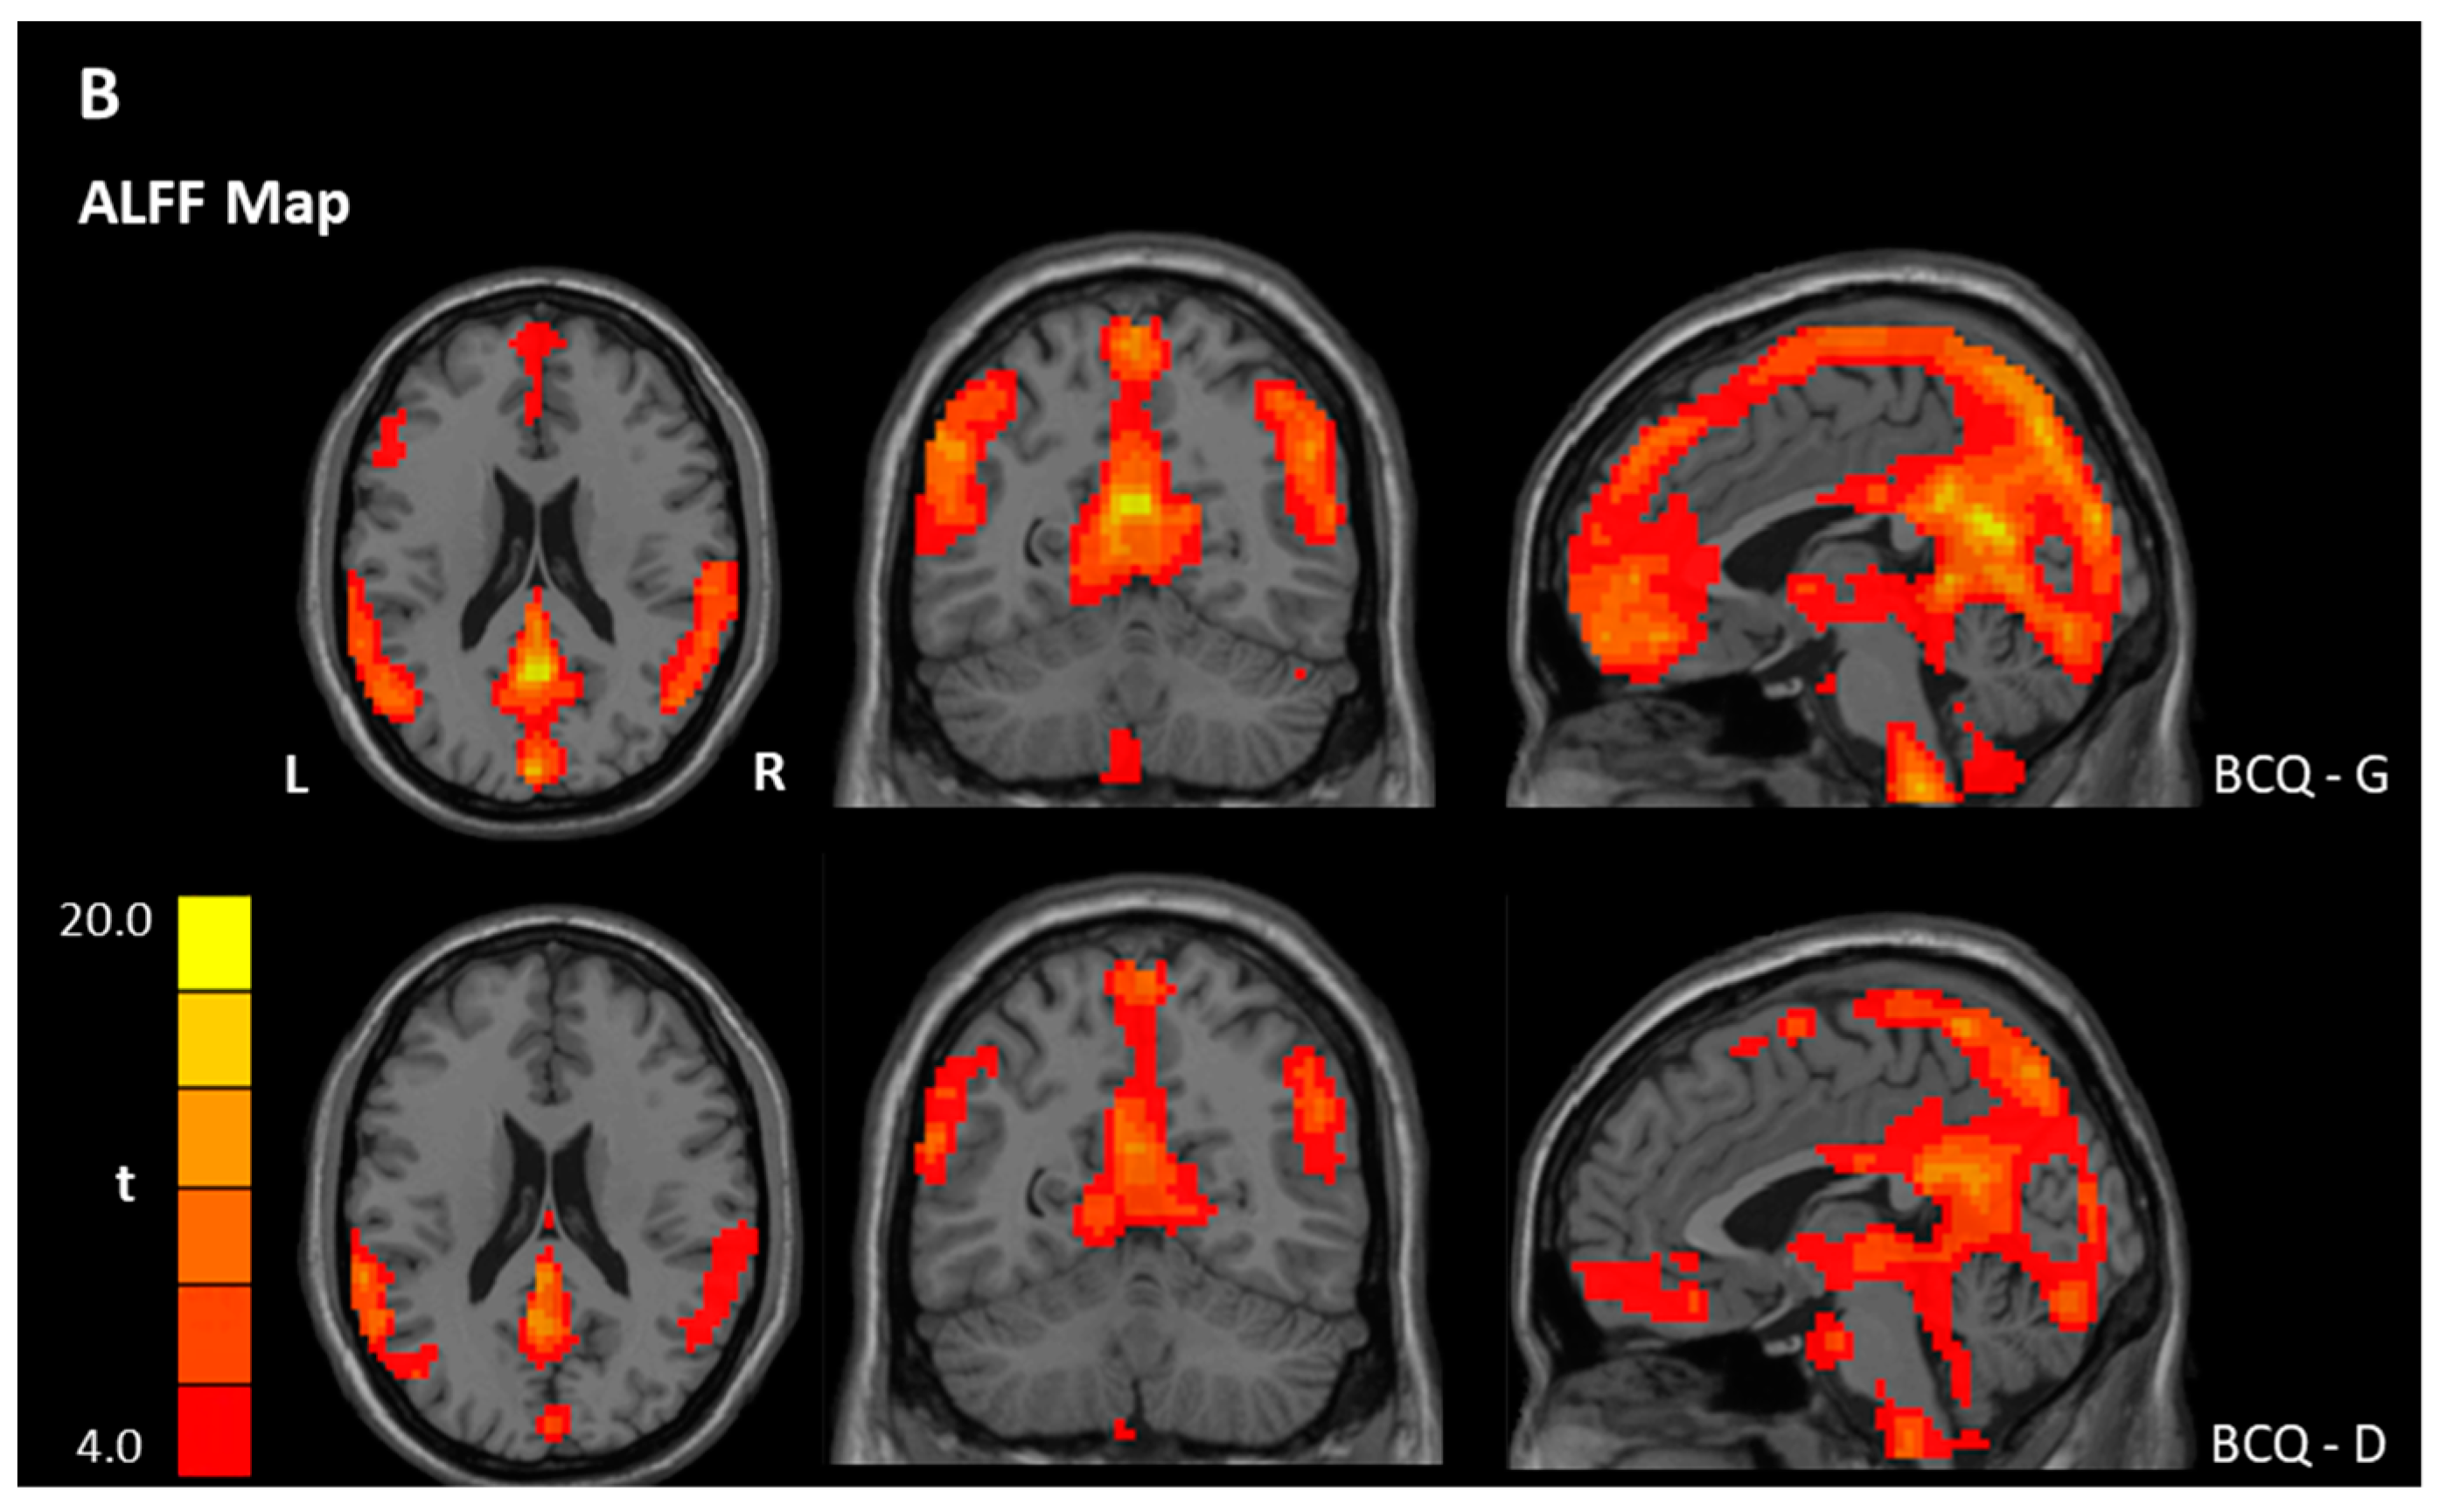
| Gentleness > 0 | PCC | 23 | 11639 | 17.34 | −3 | −54 | 21 |
| Gentleness < 0 | NS | ||||||
| BCQ-Deficiency | |||||||
| Deficiency > 0 | OFC, Left | 11 | 161 | 6.79 | −33 | 33 | −18 |
| Deficiency < 0 | Precentral gyrus, Left | 6 | 29,955 | 52.63 | −18 | −18 | 54 |
| Between-group * | |||||||
| Gentleness > Deficiency | NS | ||||||
| Gentleness < Deficiency | Pons/Cerebellum, Left | 85 | −3.86 | −12 | −36 | −54 | |
| Values | Region | BA | Size | t | Peak Coordinate | ||
|---|---|---|---|---|---|---|---|
| x | y | z | |||||
| WHOQOL-BREF | |||||||
| ReHo | |||||||
| Physiological | |||||||
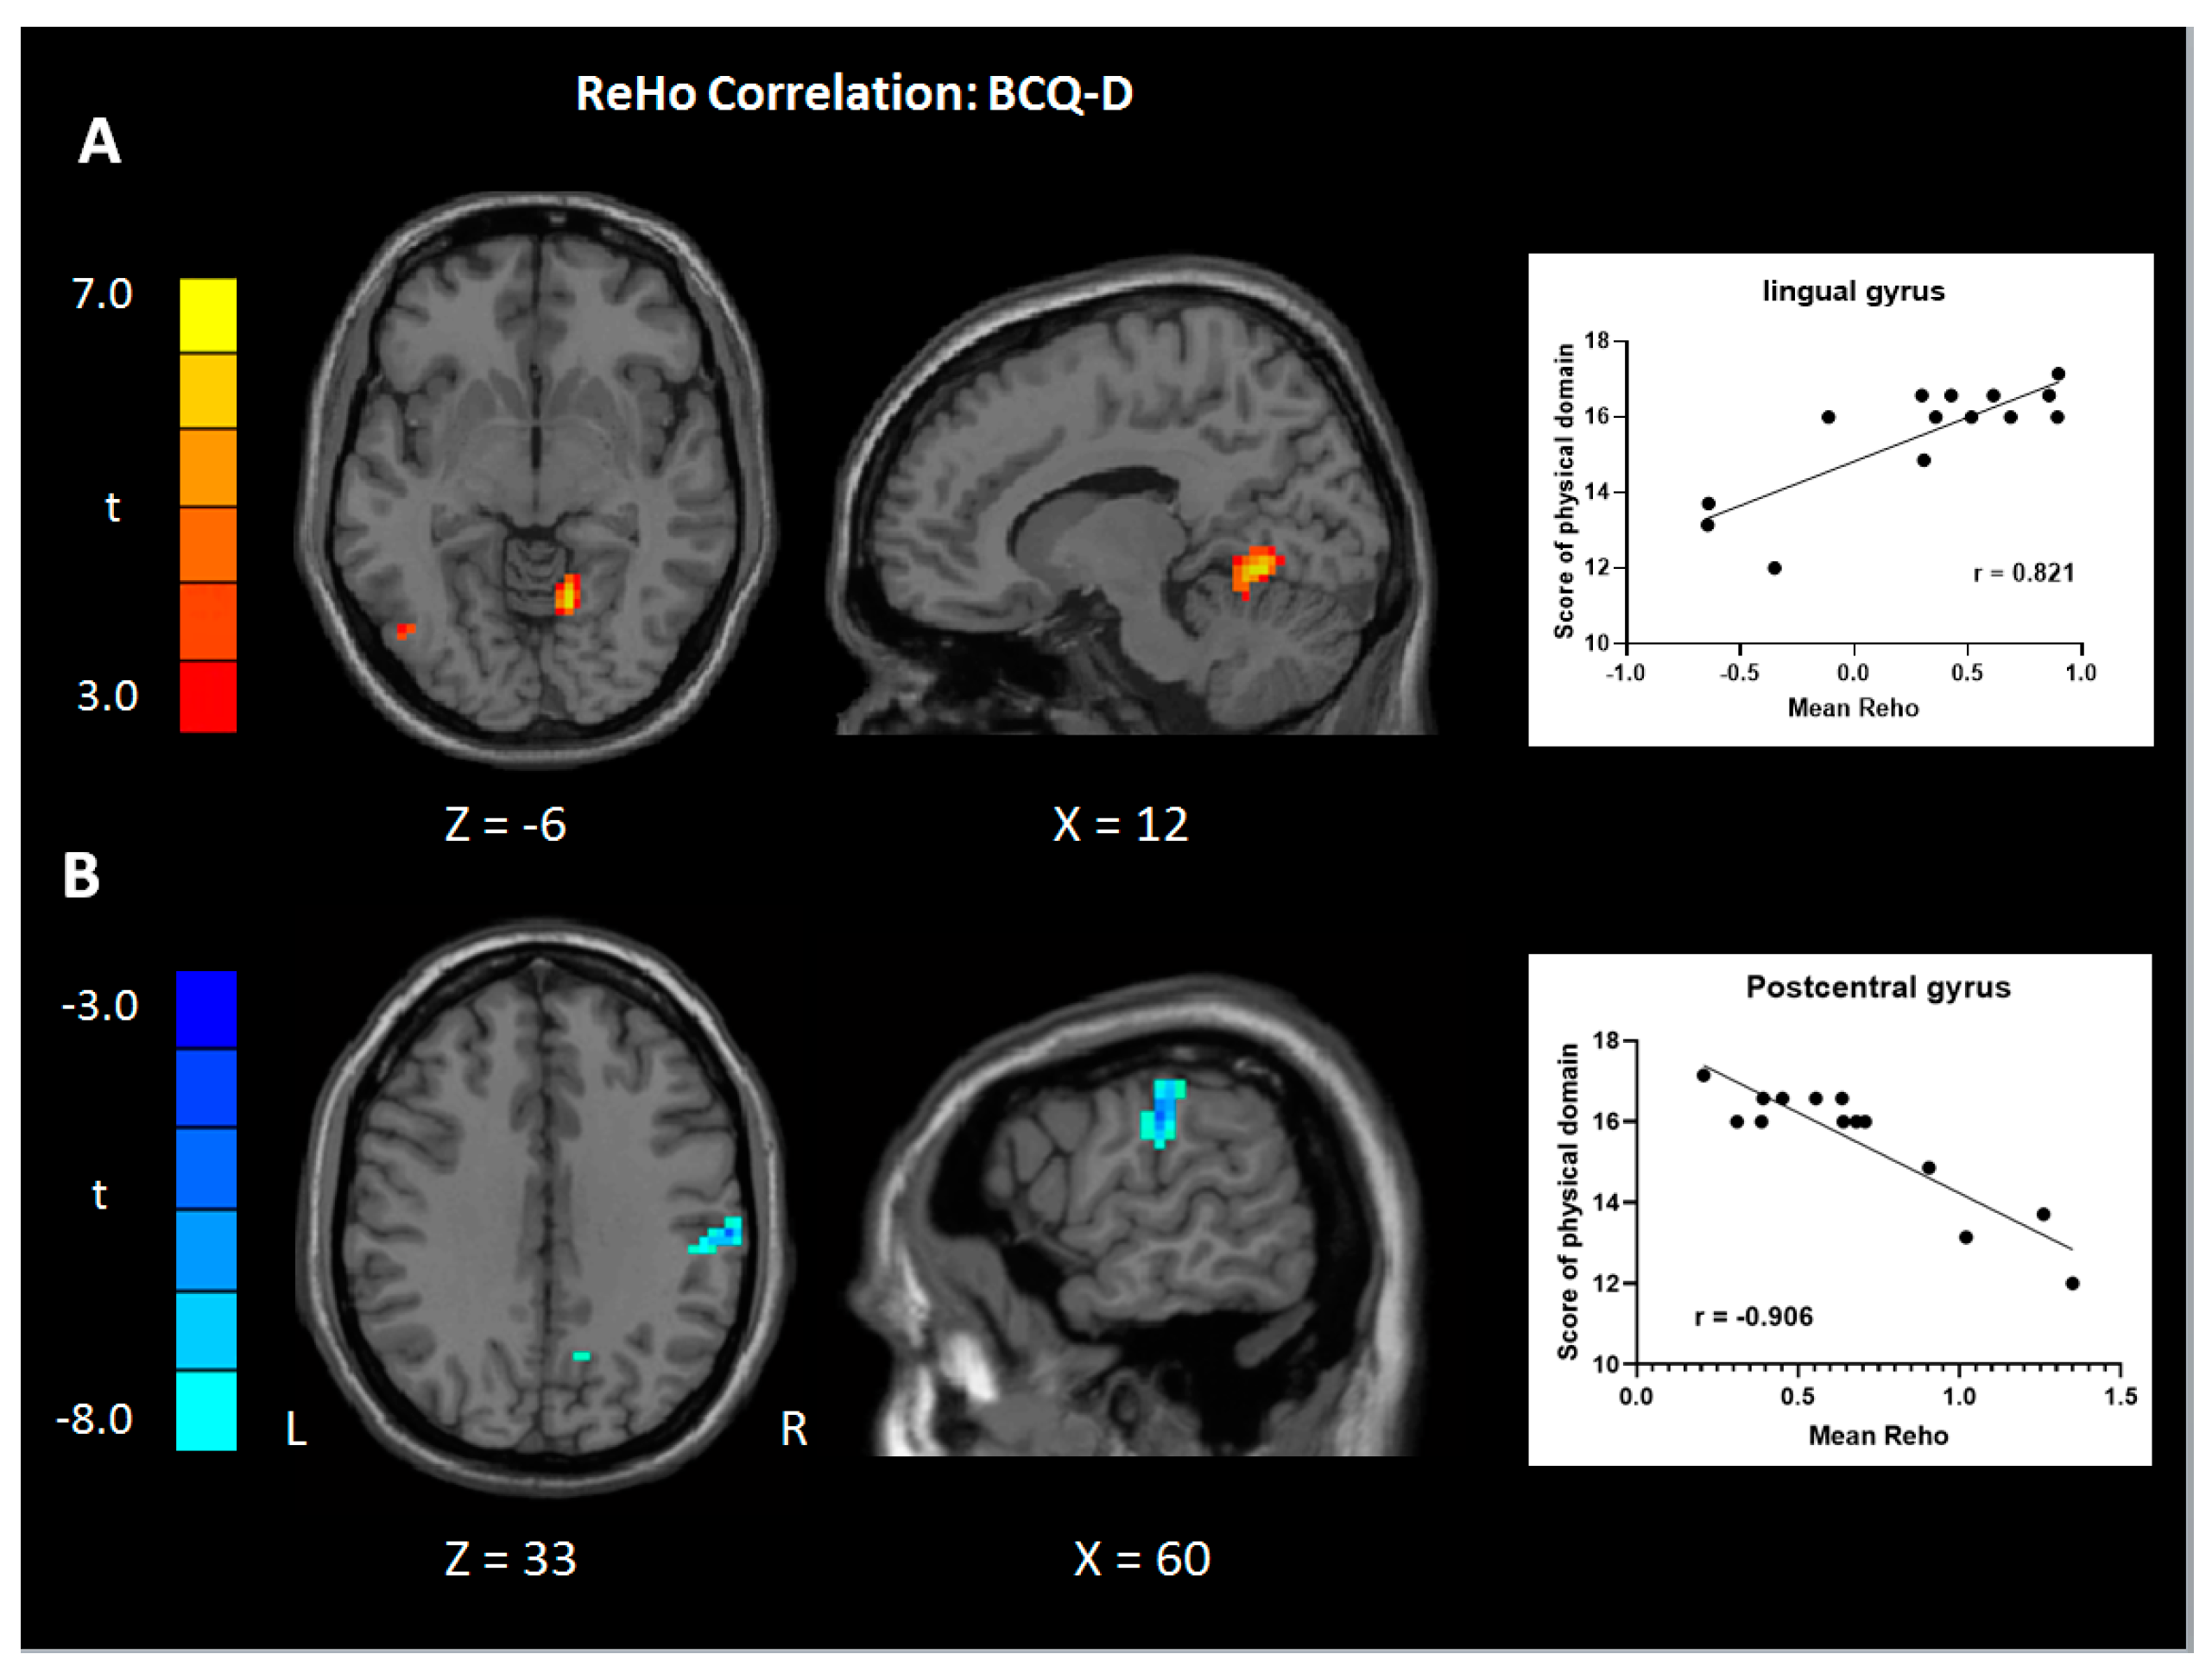
| Positive | Cerebellum/lingual gyrus, R | 19 | 77 | 6.99 | 12 | −57 | −6 |
| Negative | Supramarginal gyrus, R | 40 | 68 | 8.58 | 60 | −21 | 33 |
| ALFF | |||||||
| WHOQOL-total | |||||||
| Positive | NS | ||||||
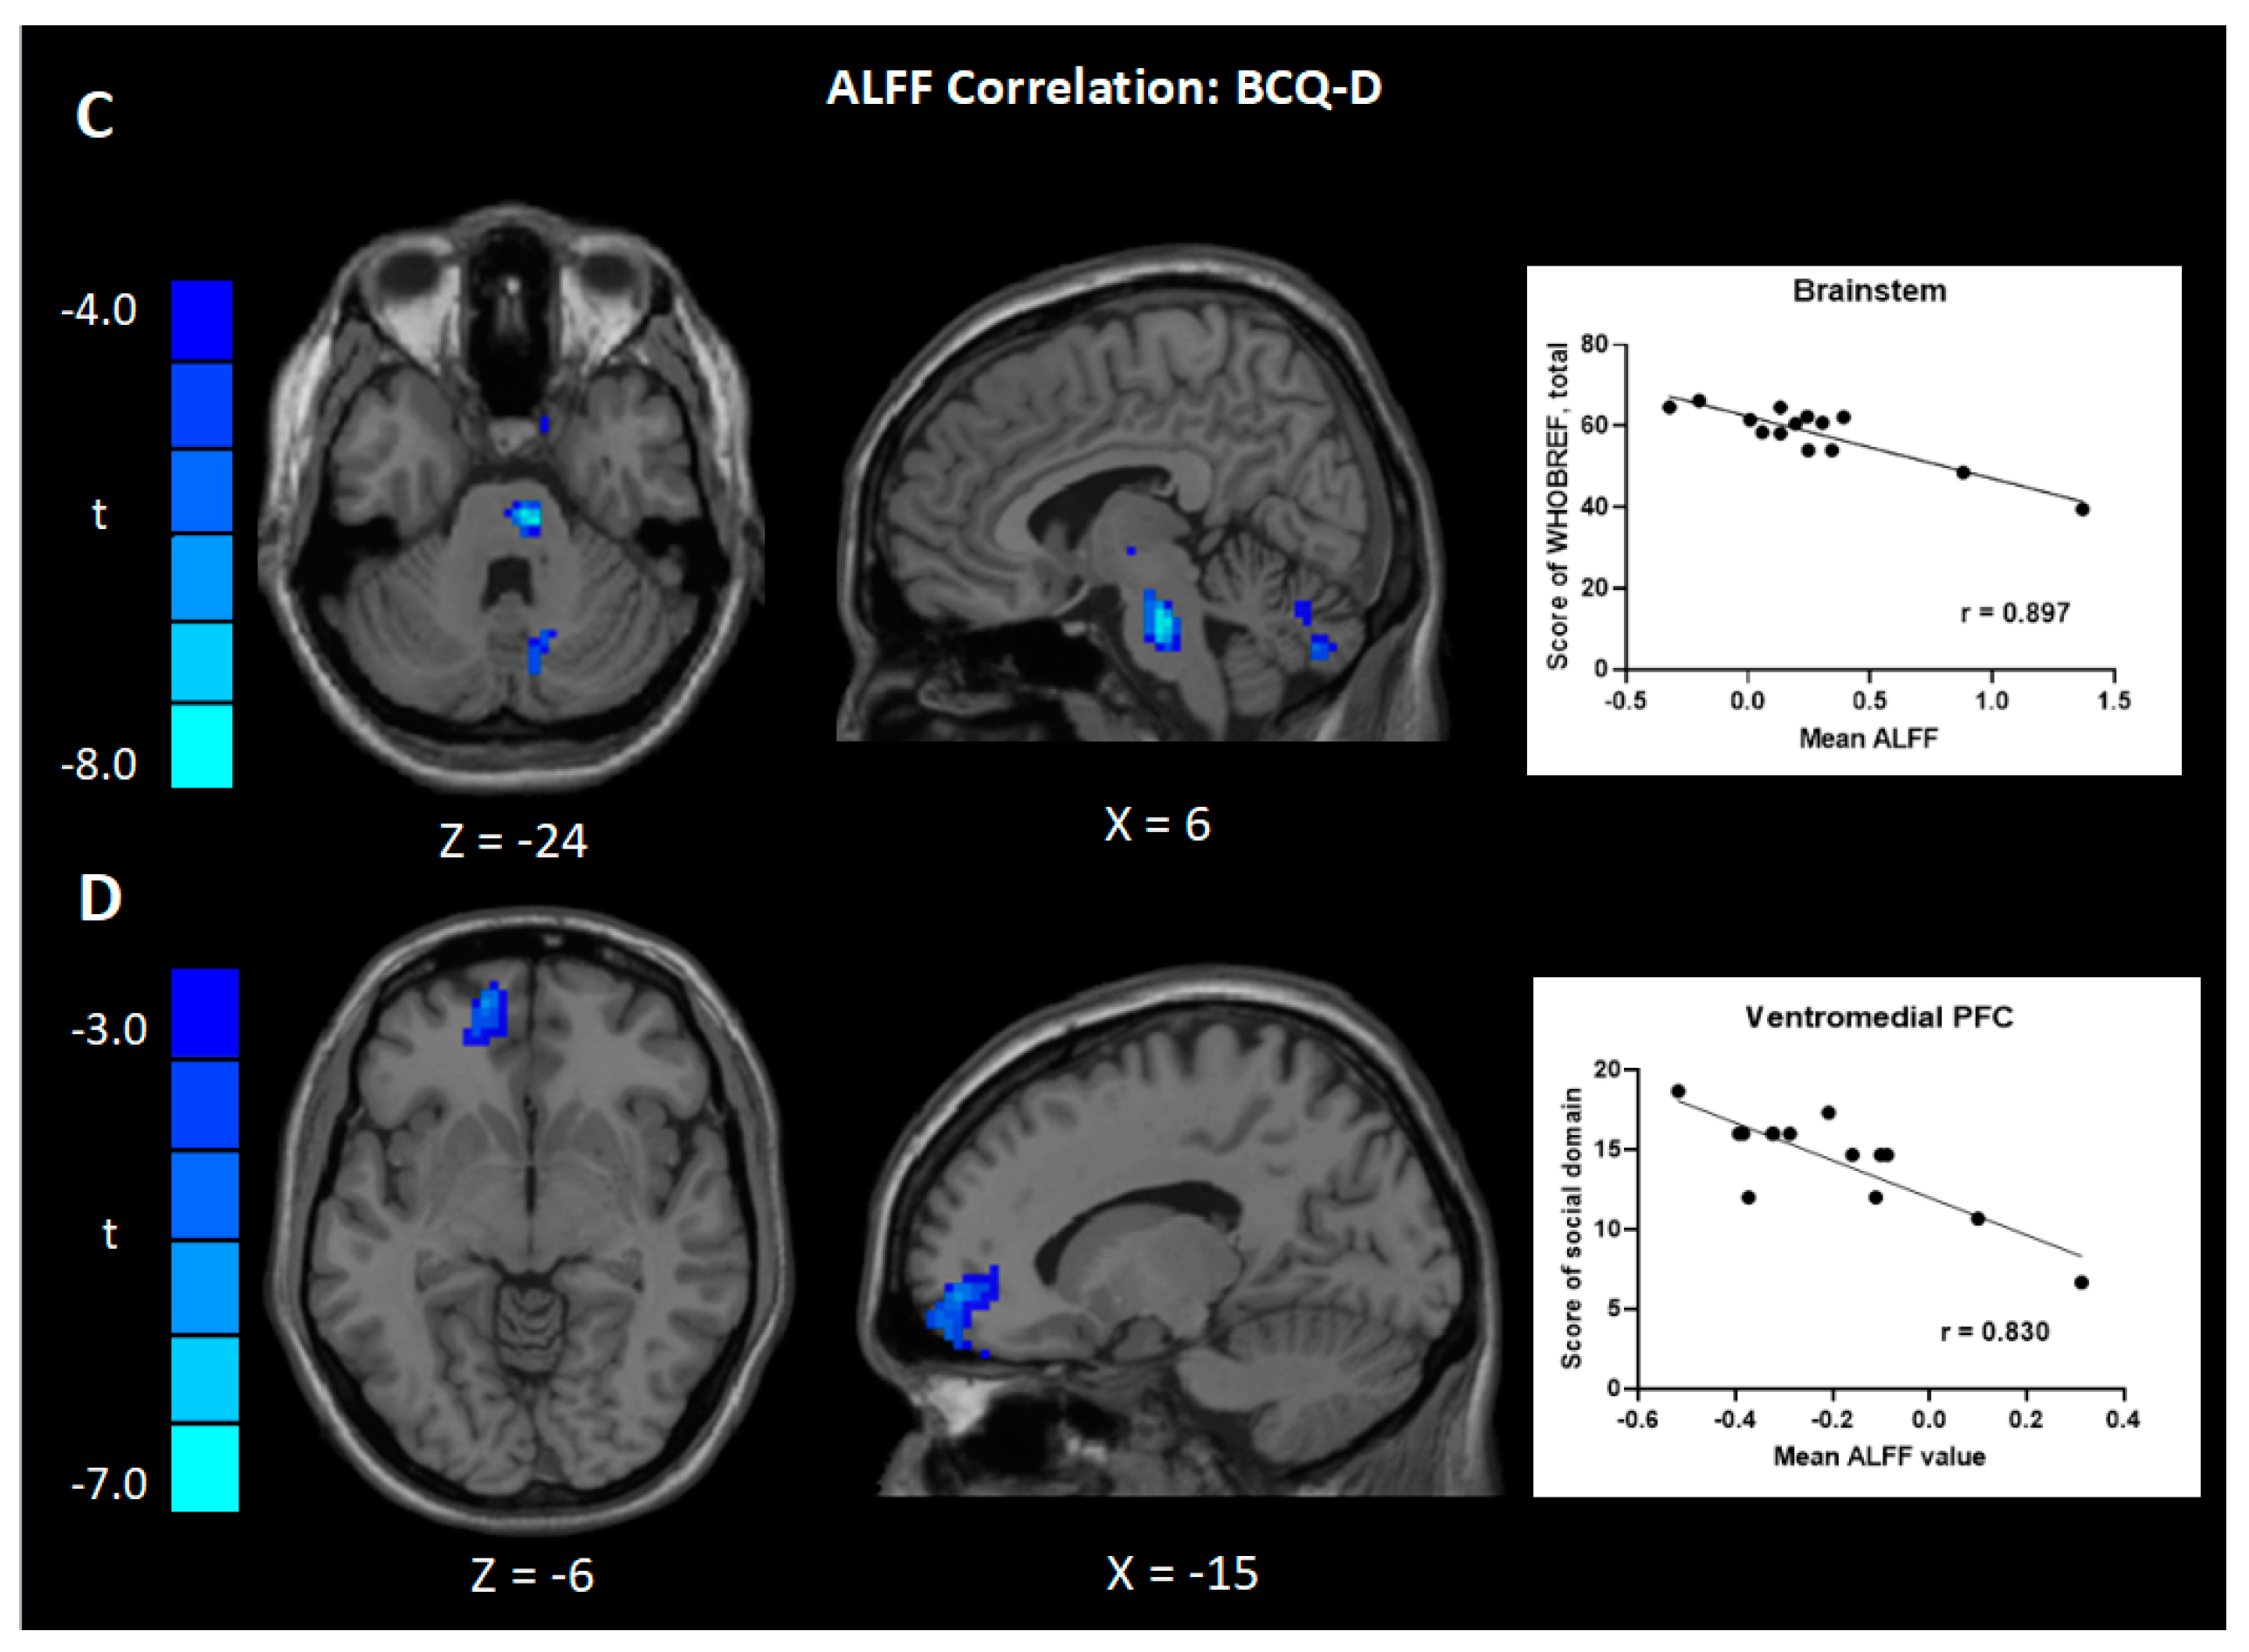
| Negative | Brainstem, R | 67 | 7.84 | 6 | −21 | −24 | |
| Social | |||||||
| Positive | NS | ||||||
| Negative | vmPFC, L | 10 | 168 | 5.75 | −15 | 57 | −6 |
| Values | Region | BA | Size | t | Peak Coordinate | ||
|---|---|---|---|---|---|---|---|
| x | y | z | |||||
| ReHo | |||||||
| Yang-deficiency | |||||||
| Positive | NS | ||||||
| Negative | NS | ||||||
| Yin-deficiency | |||||||
| Positive | NS | ||||||
| Negative | NS | ||||||
| Phl & STA | |||||||
| Positive | NS | ||||||
| Negative | NS | ||||||
| ALFF | |||||||
| Yang-deficiency | |||||||
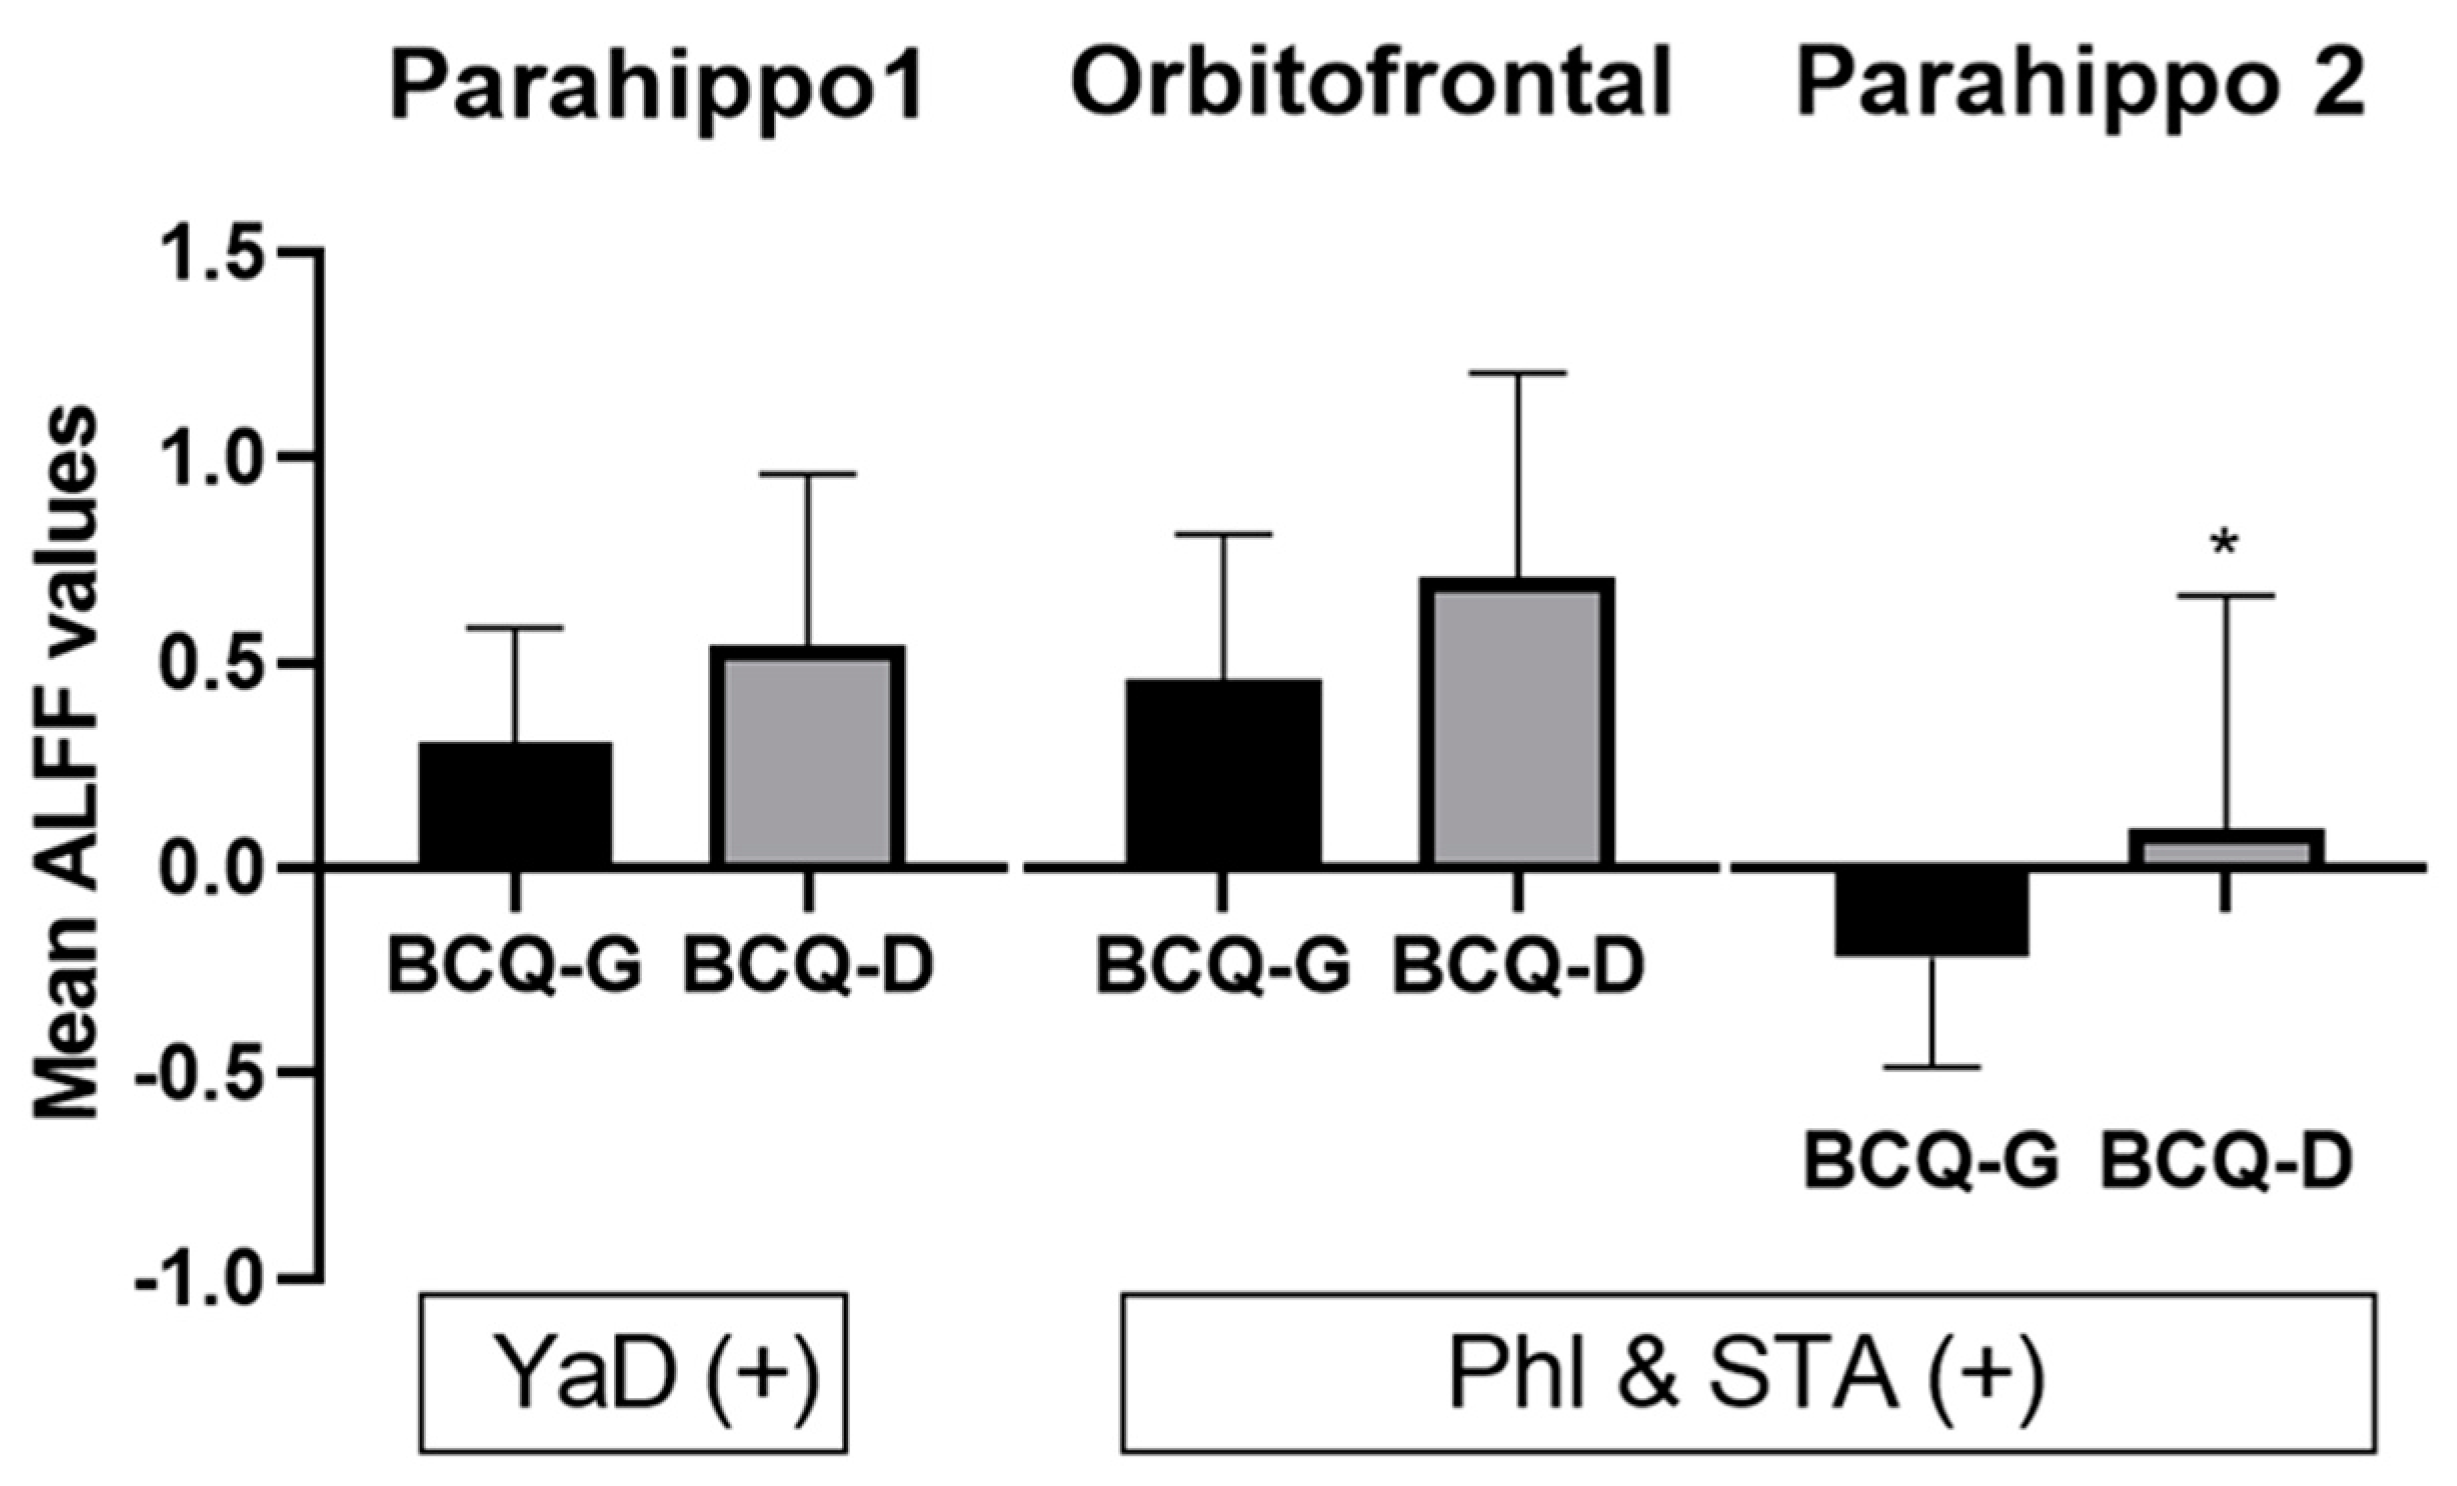
| Positive | Parahippocampus, L | 36 | 289 | 4.32 | −21 | −18 | −24 |
| Negative | NS | ||||||
| Yin-deficiency | |||||||
| Positive | NS | ||||||
| Negative | NS | ||||||
| Phl & STA | |||||||
| Positive | Parahippocampus, L | 36 | 207 | 5.05 | −24 | −6 | −42 |
| Orbitofrontal cortex, L | 11 | 304 | 4.52 | −3 | 33 | −15 | |
| Negative | NS | ||||||
© 2019 by the authors. Licensee MDPI, Basel, Switzerland. This article is an open access article distributed under the terms and conditions of the Creative Commons Attribution (CC BY) license (http://creativecommons.org/licenses/by/4.0/).
Share and Cite
Liu, C.-H.; Kung, Y.-Y.; Yeh, T.-C.; Hsu, P.-S.; Yang, C.-J.; Cheng, C.-M.; Lin, H.-C.; Yang, J.-L.; Wu, T.-P.; Chang, C.-M.; et al. Differing Spontaneous Brain Activity in Healthy Adults with Two Different Body Constitutions: A Resting-State Functional Magnetic Resonance Imaging Study. J. Clin. Med. 2019, 8, 951. https://doi.org/10.3390/jcm8070951
Liu C-H, Kung Y-Y, Yeh T-C, Hsu P-S, Yang C-J, Cheng C-M, Lin H-C, Yang J-L, Wu T-P, Chang C-M, et al. Differing Spontaneous Brain Activity in Healthy Adults with Two Different Body Constitutions: A Resting-State Functional Magnetic Resonance Imaging Study. Journal of Clinical Medicine. 2019; 8(7):951. https://doi.org/10.3390/jcm8070951
Chicago/Turabian StyleLiu, Ching-Hsiung, Yen-Ying Kung, Tzu-Chen Yeh, Pei-Shan Hsu, Ching-Ju Yang, Chou-Ming Cheng, Hong-Chun Lin, Jen-Lin Yang, Ta-Peng Wu, Ching-Mao Chang, and et al. 2019. "Differing Spontaneous Brain Activity in Healthy Adults with Two Different Body Constitutions: A Resting-State Functional Magnetic Resonance Imaging Study" Journal of Clinical Medicine 8, no. 7: 951. https://doi.org/10.3390/jcm8070951