Molecular Profiling of Cutaneous Lupus Lesions Identifies Subgroups Distinct from Clinical Phenotypes


 ,
,
Abstract
:1. Introduction
2. Materials and Methods
2.1. Sample Acquisition
2.2. RNA Isolation and Microarray Procedures
2.3. Calculation of IFN Scores
2.4. Literature-Based Network and Pathway Analyses, Hierarchical Clustering, Heatmap Generation, and Gene List Comparison
2.5. Cell Types Enrichment Analysis
2.6. Statistical Analyses
3. Results
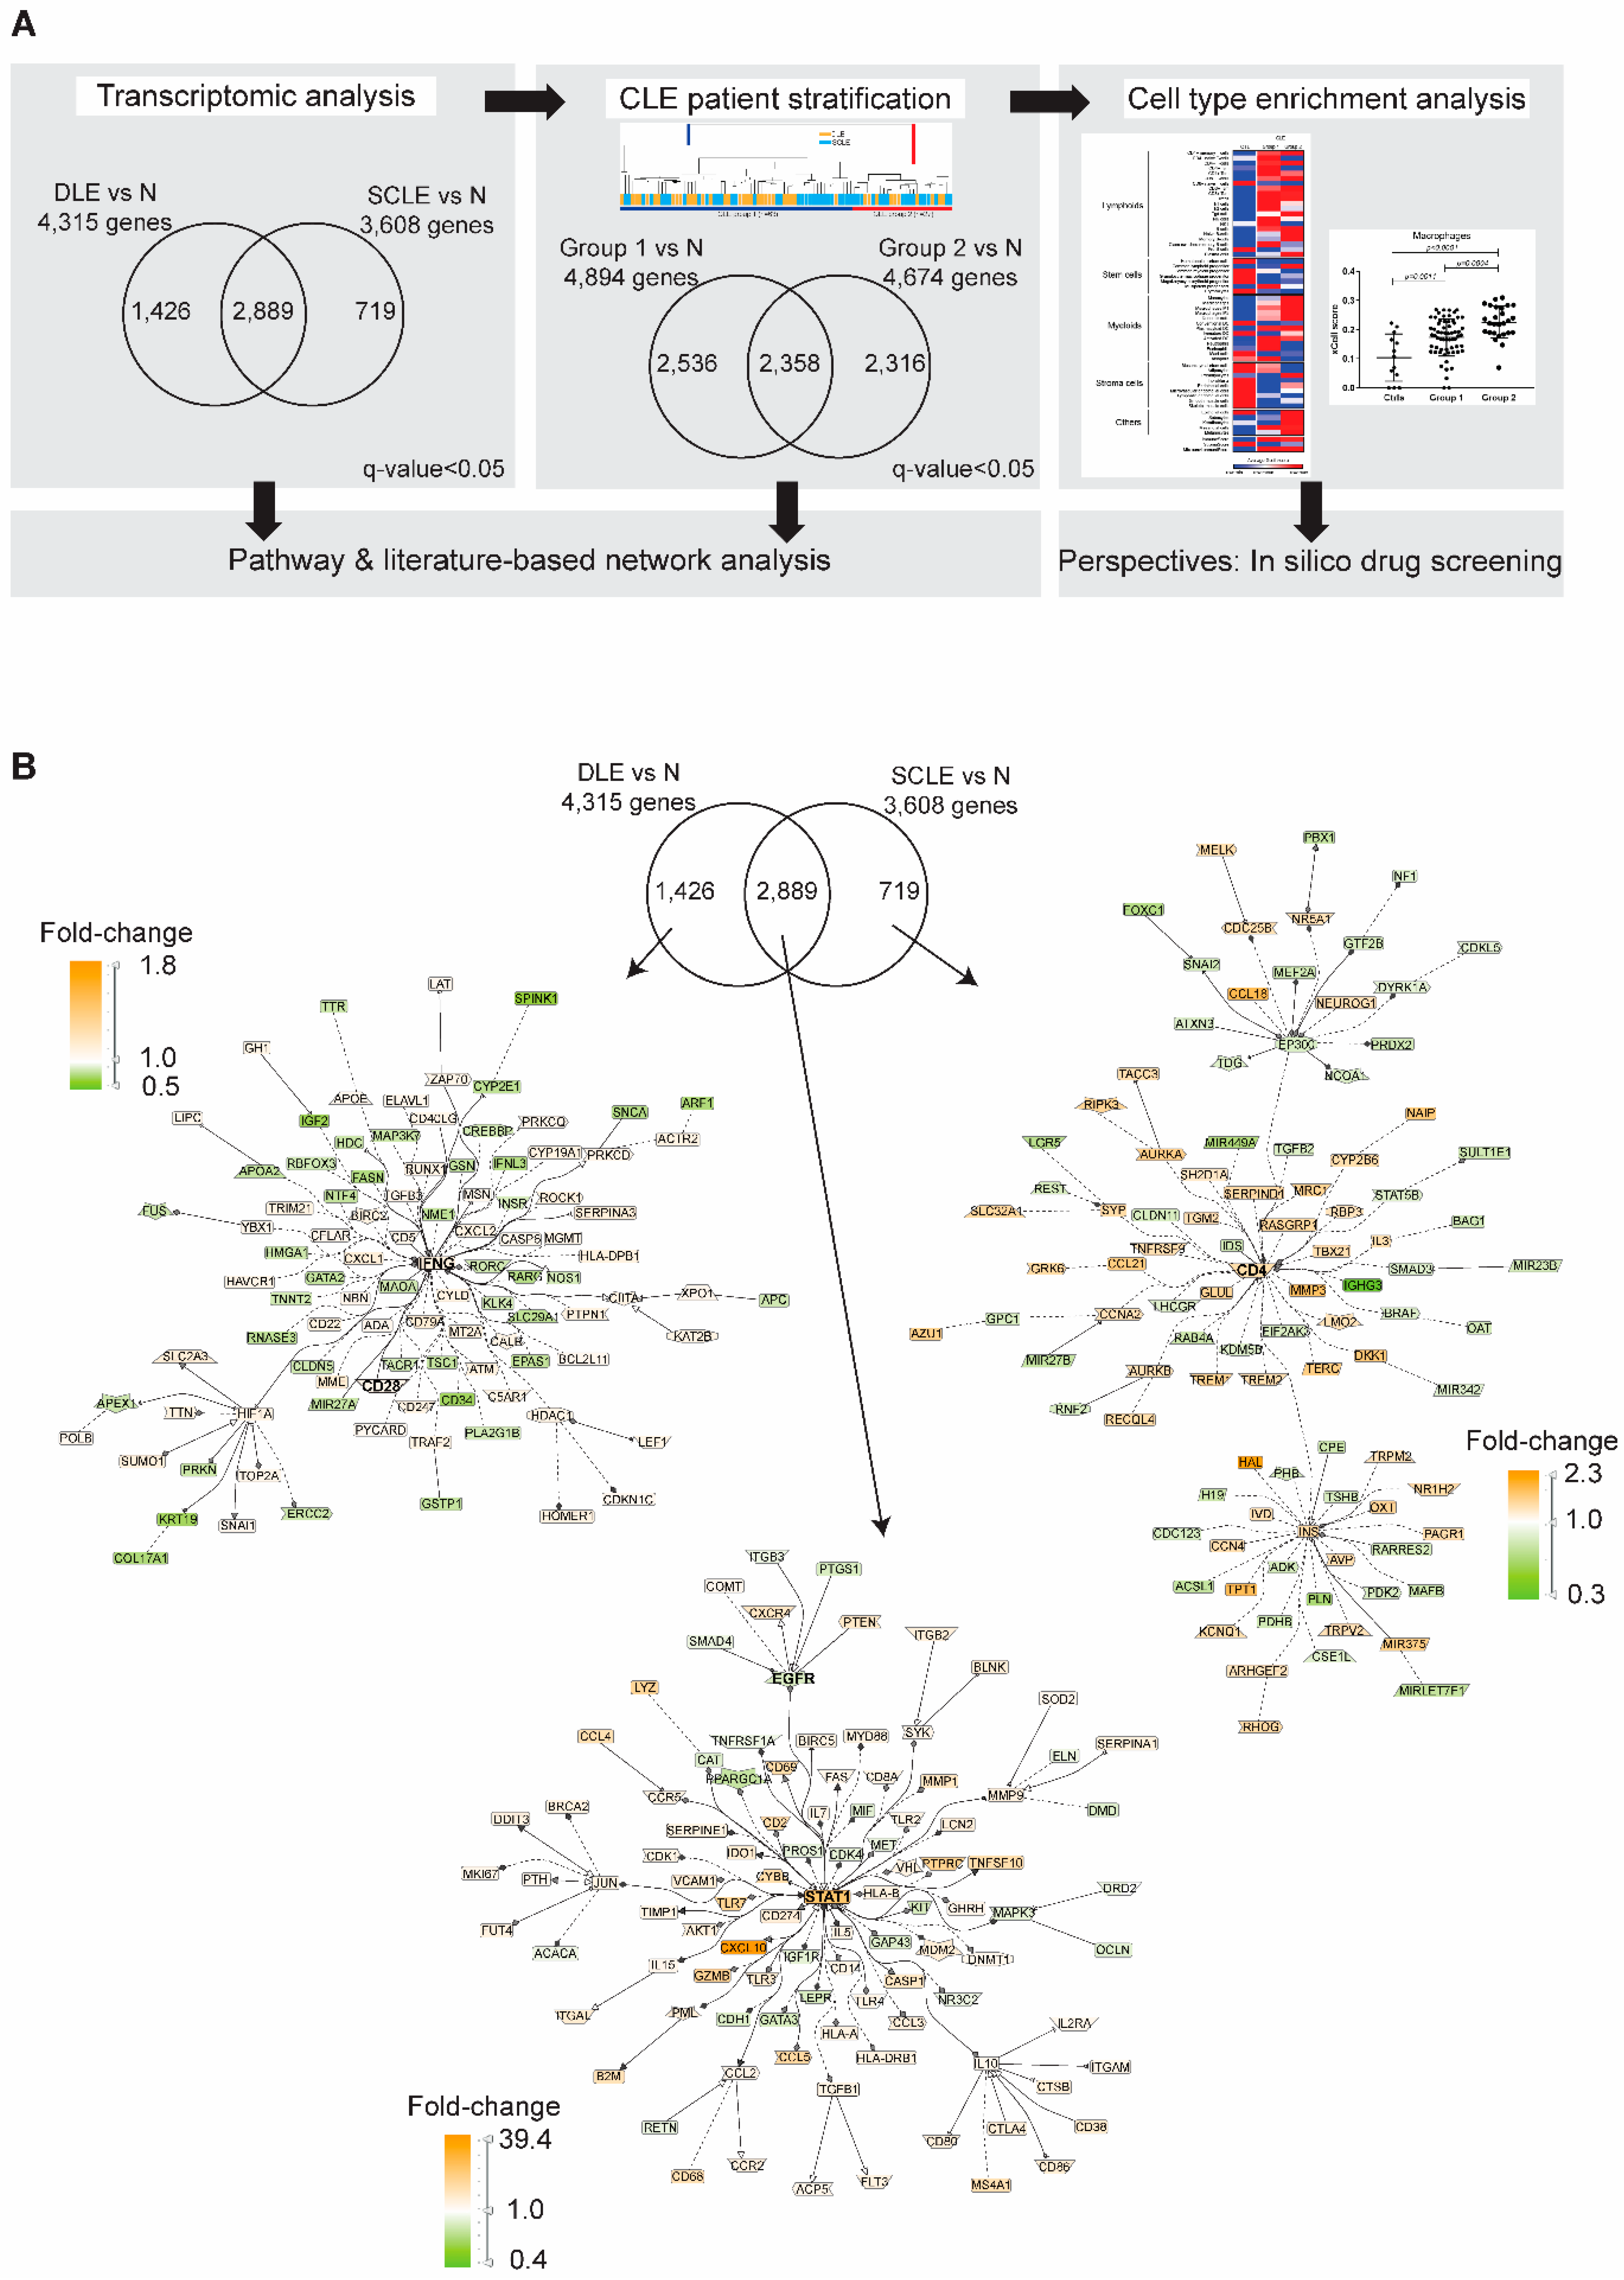
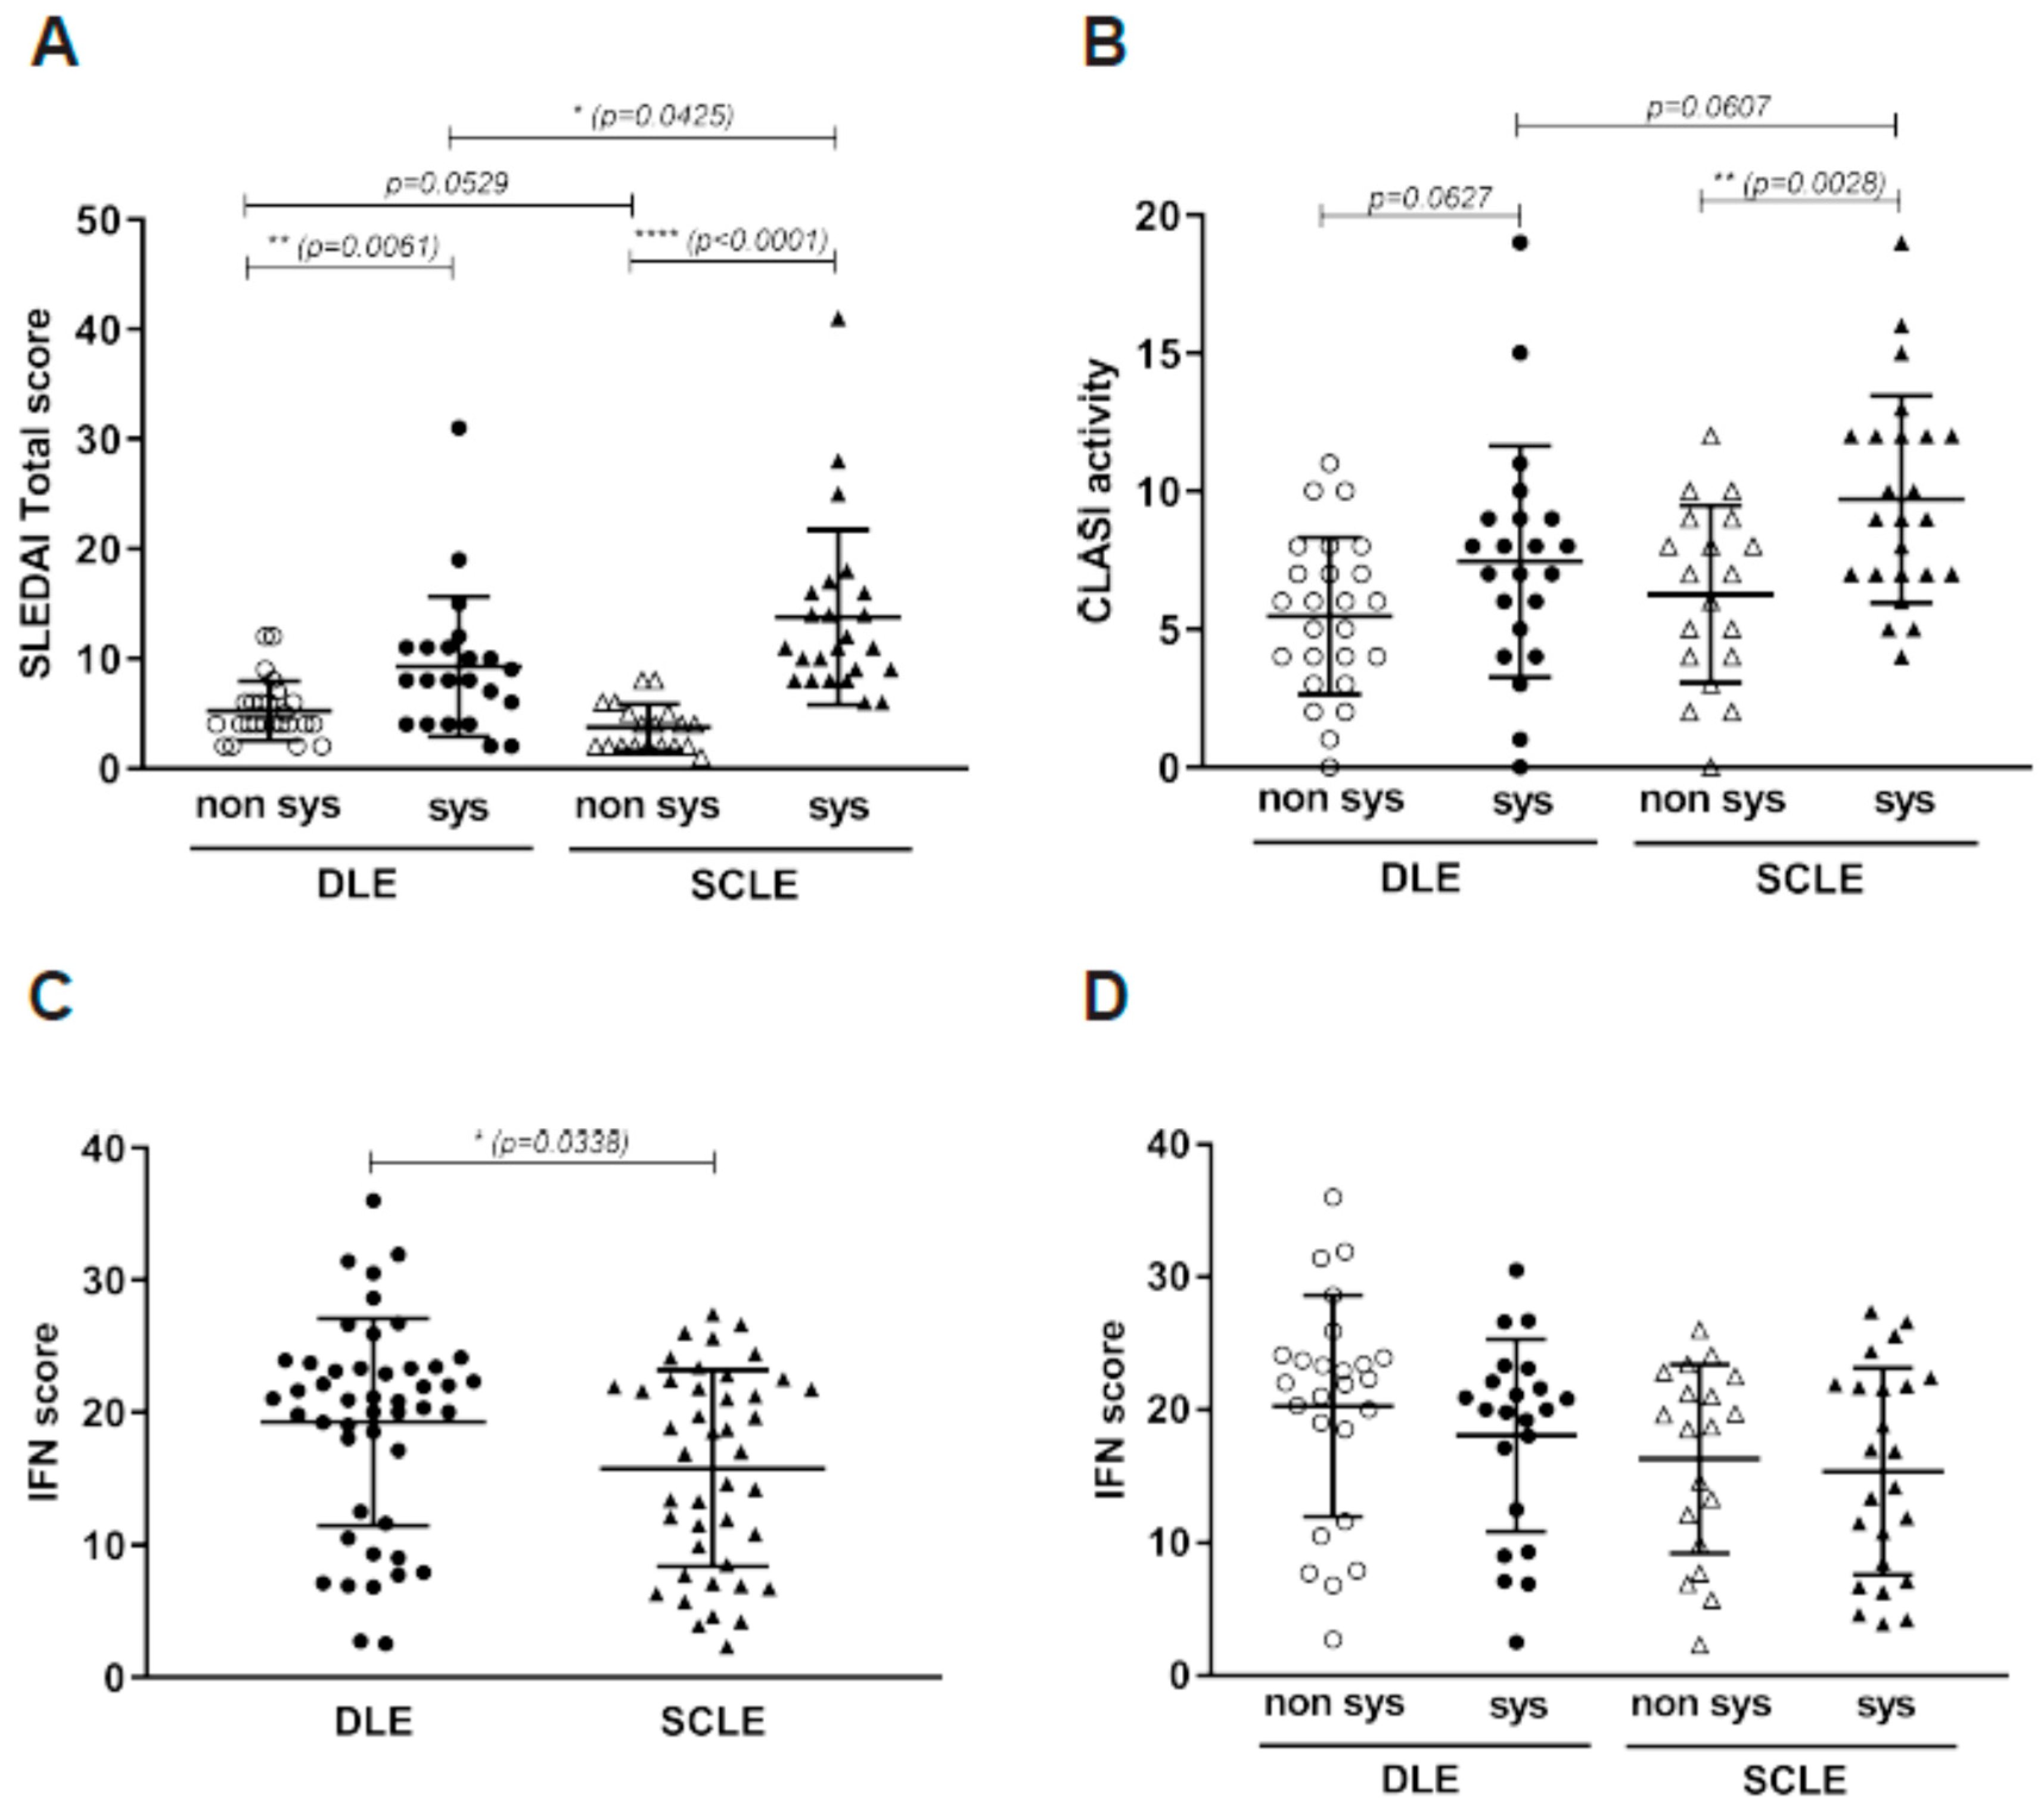
3.1. Comparison of DLE vs. SCLE Skin Lesions
3.2. Characterization of Lesions of CLE-Only vs. SLE Patients
3.3. Molecular Subtyping of CLE Lesions
4. Discussion
5. Conclusions
Supplementary Materials
Author Contributions
Funding
Conflicts of Interest
Abbreviations
| BMI | body mass index |
| cDNA | complementary DNA |
| CLE | cutaneous lupus erythematosus |
| DEG | differentially expressed gene |
| DLE | discoid lupus erythematosus |
| FFPE | formalin-fixed, paraffin-embedded |
| IFN | interferon; |
| SCLE | subacute cutaneous lupus erythematosus |
| SLE | systemic lupus erythematosus |
| UV | ultraviolet |
References
- Mikita, N.; Ikeda, T.; Ishiguro, M.; Furukawa, F. Recent advances in cytokines in cutaneous and systemic lupus erythematosus. J. Dermatol. 2011, 38, 839–849. [Google Scholar] [CrossRef] [PubMed]
- Wenzel, J.; Zahn, S.; Mikus, S.; Wiechert, A.; Bieber, T.; Tüting, T. The expression pattern of interferon-inducible proteins reflects the characteristic histological distribution of infiltrating immune cells in different cutaneous lupus erythematosus subsets. Br. J. Dermatol. 2007, 157, 752–757. [Google Scholar] [CrossRef] [PubMed]
- Gambichler, T.; Genc, Z.; Skrygan, M.; Scola, N.; Tigges, C.; Terras, S.; Bechara, F.G.; Kreuter, A. Cytokine and chemokine ligand expression in cutaneous lupus erythematosus. Eur. J. Dermatol. 2012, 22, 319–323. [Google Scholar] [CrossRef] [PubMed]
- Sarkar, M.; Hile, G.; Tsoi, L.; Xing, X.; Liu, J.; Liang, Y.; Berthier, C.; Swindell, W.; Patrick, M.; Shuai, S.; et al. Photosensitivity and type I IFN responses in cutaneous lupus are driven by epidermal derived interferon kappa. Ann. Rheum. Dis. 2018, 77, 1653–1664. [Google Scholar] [CrossRef] [PubMed]
- Wallace, D.; Hahn, B.H. (Eds.) Dubois’ Lupus Erythematosus and Related Syndromes, 8th ed.; Elsevier: Philadelphia, PA, USA, 2013. [Google Scholar]
- Ruland, V.; Haust, M.; Stilling, R.M.; Metze, D.; Amler, S.; Ruzicka, T.; Kuhn, A. Updated analysis of standardized photoprovocation in patients with cutaneous lupus erythematosus. Arthritis Care Res. 2013, 65, 767–776. [Google Scholar] [CrossRef] [PubMed]
- Janssens, A.S.; Lashley, E.E.L.O.; Out-Luiting, C.J.; Willemze, R.; Pavel, S.; De Gruijl, F.R. UVB-induced leucocyte trafficking in the epidermis of photosensitive lupus erythematosus patients: Normal depletion of Langerhans cells. Exp. Dermatol. 2005, 14, 138–142. [Google Scholar] [CrossRef]
- Presto, J.K.; Hejazi, E.Z.; Werth, V.P. Biological therapies in the treatment of cutaneous lupus erythematosus. Lupus 2016, 26, 115–118. [Google Scholar] [CrossRef]
- Sole, C.; Gimeniz-Barcons, M.; Ferrer, B.; Ordi-Ros, J.; Cortes-Hernandez, J. Microarray study reveals a TGFbeta-Dependent mechanism of fibrosis in discoid lupus erythematosus. Br. J. Dermatol. 2016, 175, 302–313. [Google Scholar] [CrossRef]
- Jabbari, A.; Suarez-Farinas, M.; Fuentes-Duculan, J.; Gonzalez, J.; Cueto, I.; Franks, A.G.; Krueger, J.G. Dominant Th1 and Minimal Th17 Skewing in Discoid Lupus Revealed by Transcriptomic Comparison with Psoriasis. J. Investig. Dermatol. 2014, 134, 87–95. [Google Scholar] [CrossRef] [Green Version]
- Albrecht, J.; Taylor, L.; Berlin, J.A.; Dulay, S.; Ang, G.; Fakharzadeh, S.; Kantor, J.; Kim, E.; Militello, G.; McGinnis, K.; et al. The CLASI (Cutaneous Lupus Erythematosus Disease Area and Severity Index): An outcome instrument for cutaneous lupus erythematosus. J. Investig. Dermatol. 2005, 125, 889–894. [Google Scholar] [CrossRef]
- Irizarry, R.A.; Hobbs, B.; Collin, F.; Beazer-Barclay, Y.D.; Antonellis, K.J.; Scherf, U.; Speed, T.P. Exploration, normalization, and summaries of high density oligonucleotide array probe level data. Biostatistics 2003, 4, 249–264. [Google Scholar] [CrossRef] [Green Version]
- R software version 3.1.3. Available online: http://brainarray.mbni.med.umich.edu/Brainarray/Database/CustomCDF/genomic_curated_CDF (accessed on 1 April 2016).
- GenePattern. Available online: http://www.broadinstitute.org/cancer/software/genepattern/ (accessed on 1 April 2016).
- Feng, X.; Wu, H.; Grossman, J.M.; Hanvivadhanakul, P.; FitzGerald, J.D.; Park, G.S.; Dong, X.; Chen, W.; Kim, M.H.; Weng, H.H.; et al. Association of increased interferon-inducible gene expression with disease activity and lupus nephritis in patients with systemic lupus erythematosus. Arthritis Rheum. 2006, 54, 2951–2962. [Google Scholar] [CrossRef]
- Genomatix. Available online: www.genomatix.de (accessed on 9 July 2019).
- GenePattern. Available online: https://cloud.genepattern.org (accessed on 9 July 2019).
- Venny 2.1.0. Available online: https://bioinfogp.cnb.csic.es/tools/venny (accessed on 23 July 2019).
- xCell webtool. Available online: http://xcell.ucsf.edu/ (accessed on 9 July 2019).
- Aran, D.; Hu, Z.; Butte, A.J. xCell: Digitally portraying the tissue cellular heterogeneity landscape. Genome Biol. 2017, 18, 220. [Google Scholar] [CrossRef] [PubMed]
- Saeed, A.I.; Bhagabati, N.K.; Braisted, J.C.; Liang, W.; Sharov, V.; Howe, E.A.; Li, J.; Thiagarajan, M.; White, J.A.; Quackenbush, J. TM4 microarray software suite. Methods Enzymol. 2006, 411, 134–193. [Google Scholar] [CrossRef]
- Hodgin, J.B.; Borczuk, A.C.; Nasr, S.H.; Markowitz, G.S.; Nair, V.; Martini, S.; Eichinger, F.; Vining, C.; Berthier, C.C.; Kretzler, M.; et al. A molecular profile of focal segmental glomerulosclerosis from formalin-fixed, paraffin-embedded tissue. Am. J. Pathol. 2010, 177, 1674–1686. [Google Scholar] [CrossRef]
- Turner, L.; Heath, J.D.; Kurn, N. Gene expression profiling of RNA extracted from FFPE tissues: NuGEN technologies’ whole-transcriptome amplification system. Methods Mol. Biol. 2011, 724, 269–280. [Google Scholar] [CrossRef]
- Johnston, A.; Xing, X.; Wolterink, L.; Barnes, D.H.; Yin, Z.; Reingold, L.; Kahlenberg, J.M.; Harms, P.W.; Gudjonsson, J.E. IL-1 and IL-36 are dominant cytokines in generalized pustular psoriasis. J. Allergy Clin. Immunol. 2017, 140, 109–120. [Google Scholar] [CrossRef]
- Braunstein, I.; Klein, R.; Okawa, J.; Werth, V.P. The interferon-regulated gene signature is elevated in subacute cutaneous lupus erythematosus and discoid lupus erythematosus and correlates with the cutaneous lupus area and severity index score. Br. J. Dermatol. 2012, 166, 971–975. [Google Scholar] [CrossRef]
- Vasquez, R.; Wang, D.; Tran, Q.P.; Adams-Huet, B.; Chren, M.M.; Costner, M.I.; Cohen, J.B.; Werth, V.P.; Chong, B.F. A multicentre, cross-sectional study on quality of life in patients with cutaneous lupus erythematosus. Br. J. Dermatol. 2013, 168, 145–153. [Google Scholar] [CrossRef]
- Klein, R.; Moghadam-Kia, S.; Taylor, L.; Coley, C.; Okawa, J.; LoMonico, J.; Chren, M.M.; Werth, V.P. Quality of life in cutaneous lupus erythematosus. J. Am. Acad. Dermatol. 2011, 64, 849–858. [Google Scholar] [CrossRef] [Green Version]
- Teske, N.M.; Cardon, Z.E.; Ogunsanya, M.E.; Li, X.; Adams-Huet, B.; Chong, B. Predictors of low quality of life in discoid lupus patients. Br. J. Dermatol. 2017, 177, e147–e149. [Google Scholar] [CrossRef]
- Shipman, W.D.; Chyou, S.; Ramanathan, A.; Izmirly, P.M.; Sharma, S.; Pannellini, T.; Dasoveanu, D.C.; Qing, X.; Magro, C.M.; Granstein, R.D.; et al. A protective Langerhans cell-keratinocyte axis that is dysfunctional in photosensitivity. Sci. Transl. Med. 2018, 10. [Google Scholar] [CrossRef]
- Banchereau, R.; Hong, S.; Cantarel, B.; Baldwin, N.; Baisch, J.; Edens, M.; Cepika, A.-M.; Acs, P.; Turner, J.; Anguiano, E.; et al. Personalized Immunomonitoring Uncovers Molecular Networks that Stratify Lupus Patients. Cell 2016, 165, 551–565. [Google Scholar] [CrossRef] [Green Version]
- Lood, C.; Blanco, L.P.; Purmalek, M.M.; Carmona-Rivera, C.; De Ravin, S.S.; Smith, C.K.; Malech, H.L.; Ledbetter, J.A.; Elkon, K.B.; Kaplan, M.J. Neutrophil extracellular traps enriched in oxidized mitochondrial DNA are interferogenic and contribute to lupus-like disease. Nat. Med. 2016, 22, 146–153. [Google Scholar] [CrossRef] [Green Version]
- Guo, X.; Fang, X.; He, G.; Zaman, M.H.; Fei, X.; Qiao, W.; Deng, G.M. The role of neutrophils in skin damage induced by tissue-deposited lupus IgG. Immunology 2018, 154, 604–612. [Google Scholar] [CrossRef]
- Villanueva, E.; Yalavarthi, S.; Berthier, C.C.; Hodgin, J.B.; Khandpur, R.; Lin, A.M.; Rubin, C.J.; Zhao, W.; Olsen, S.H.; Klinker, M.; et al. Netting neutrophils induce endothelial damage, infiltrate tissues, and expose immunostimulatory molecules in systemic lupus erythematosus. J. Immunol. 2011, 187, 538–552. [Google Scholar] [CrossRef]
- Ribero, S.; Sciascia, S.; Borradori, L.; Lipsker, D. The Cutaneous Spectrum of Lupus Erythematosus. Clin. Rev. Allergy Immunol. 2017, 53, 291–305. [Google Scholar] [CrossRef]
- de Jong, E.M.; van Erp, P.E.; Ruiter, D.J.; van de Kerkhof, P.C. Immunohistochemical detection of proliferation and differentiation in discoid lupus erythematosus. J. Am. Acad. Dermatol. 1991, 25, 1032–1038. [Google Scholar] [CrossRef]


| DLE (n = 47) | SCLE (n = 43) | p Value | |
|---|---|---|---|
| Mean Age (±SEM) | 45.2 (2.0) | 47.2 (2.7) | 0.5590 |
| Gender (% Female) | 78.7 | 83.7 | 0.5504 |
| Ethnicity (% African-American) | 40.4 | 4.7 | <0.0001 |
| BMI (±SEM) | 28.0 (0.9) | 27.6 (1.2) | 0.8022 |
| SLEDAI (±SEM) | 7.1 (0.8) | 9.3 (1.2) | 0.1180 |
| CLASI Activity (±SEM) | 6.4 (0.5) | 8.2 (0.6) | 0.0272 |
| CLASI Damage (±SEM) | 4.2 (0.7) | 0.7 (0.3) | 0.0001 |
| % ≥4 ACR criteria for SLE within 3 years of biopsy | 46.8 | 55.8 | 0.1541 |
| Positive anti-Smith antibodies (%) | 23.4 | 25.6 | 0.8981 |
| Positive anti-Ro antibodies (%) | 31.9 | 58.1 | 0.0308 |
| Positive antiphospholipid antibodies (%) | 10.6 | 25.6 | 0.1342 |
| dsDNA titer (±SEM) | 9.6 (2.8) | 35.0 (13.4) | 0.0703 |
| IFN score (±SEM) | 19.3 (0.2) | 15.8 (0.2) | 0.0338 |
| Medications (% on drug at time of biopsy) | |||
| Oral Prednisone <10 mg daily | 8.5 | 4.7 | 0.4690 |
| Oral Prednisone >10 mg daily | 10.6 | 23.3 | 0.1111 |
| Mycophenolate Mofetil | 2.1 | 11.6 | 0.0725 |
| Antimalarials | 40.4 | 44.2 | 0.7219 |
| Methotrexate | 2.1 | 0 | 0.3417 |
| From the 1426 Genes Uniquely Regulated in DLE Compared to Controls | p-Value | Number of Regulated Genes | |
| 1 | Phospholipase C Signaling (238) | 7.6 × 10⁻⁵ | 29 |
| 2 | Epithelial Adherens Junction Signaling (149) | 9.3 × 10⁻⁵ | 21 |
| 3 | ×enobiotic Metabolism Signaling (276) | 9.3 × 10⁻⁴ | 29 |
| 4 | Regulation of IL-2 E×pression in Activated and Anergic T Lymphocytes (86) | 1.0 × 10⁻³ | 13 |
| 5 | Glucocorticoid Receptor Signaling (344) | 1.0 × 10⁻³ | 34 |
| 6 | NF-κB Signaling (182) | 1.4 × 10⁻³ | 21 |
| 7 | Systemic Lupus Erythematosus Signaling (209) | 1.6 × 10⁻³ | 23 |
| 8 | PKCθ Signaling in T Lymphocytes (161) | 1.8 × 10⁻³ | 19 |
| 9 | Granzyme A Signaling (17) | 1.9 × 10⁻³ | 5 |
| 10 | T Cell Receptor Signaling (117) | 2.3 × 10⁻³ | 15 |
| From the 2889 Genes Shared in DLE and SCLE Compared to Controls | p-Value | Number of Regulated Genes | |
| 1 | Communication between Innate and Adaptive Immune Cells (80) | 5.0 × 10⁻¹³ | 34 |
| 2 | Th1 and Th2 Activation Pathway (175) | 3.2 × 10⁻¹¹ | 51 |
| 3 | Crosstalk between Dendritic Cells and Natural Killer Cells (86) | 1.7 × 10⁻¹⁰ | 32 |
| 4 | Pathogenesis of Multiple Sclerosis (9) | 2.3 × 10⁻⁹ | 9 |
| 5 | Dendritic Cell Maturation (179) | 2.8 × 10⁻⁹ | 48 |
| 6 | Role of Pattern Recognition Receptors in Recognition of Bacteria and Viruses (158) | 3.6 × 10⁻⁹ | 44 |
| 7 | Granulocyte Adhesion and Diapedesis (160) | 5.5 × 10⁻⁹ | 44 |
| 8 | Th2 Pathway (141) | 1.0 × 10⁻⁸ | 40 |
| 9 | Th1 Pathway (125) | 1.0 × 10⁻⁸ | 37 |
| 10 | T Cell E×haustion Signaling Pathway (176) | 4.2 × 10⁻⁸ | 45 |
| From the 719 Genes Uniquely Regulated in SCLE Compared to Controls | p-Value | Number of Regulated Genes | |
| 1 | Role of Oct4 in Mammalian Embryonic Stem Cell Pluripotency (44) | 1.2 × 10⁻³ | 6 |
| 2 | Cancer Drug Resistance by Drug Efflu× (58) | 5.1 × 10⁻³ | 6 |
| 3 | Hematopoiesis from Pluripotent Stem Cells (37) | 1.8 × 10⁻² | 4 |
| 4 | Dermatan Sulfate Biosynthesis (Late Stages) (41) | 2.6 × 10⁻² | 4 |
| 5 | Glutamine Biosynthesis I (1) | 2.8 × 10⁻² | 1 |
| 6 | Adenine and Adenosine Salvage VI (1) | 2.8 × 10⁻² | 1 |
| 7 | Protein Ubiquitination Pathway (263) | 3.1 × 10⁻² | 13 |
| 8 | Antiproliferative Role of TOB in T Cell Signaling (26) | 3.4 × 10⁻² | 3 |
| 9 | Dolichyl-diphosphooligosaccharide Biosynthesis (11) | 3.5 × 10⁻² | 2 |
| 10 | Protein Kinase A Signaling (383) | 3.7 × 10⁻² | 17 |
| Transcription Factor | ENTREZ GENE ID | Number of Genes Having a Potential Binding Site in Their Promoter for the Indicated Transcription Factor in the 1335 Genes Regulated in Both DLE and SCLE vs Normal Biopsies (q-value <0.05, Absolute Log Fold-Change ≥0.6) | DLE Fold-Change | DLE q-Value | SCLE Fold-Change | SCLE q-Value |
|---|---|---|---|---|---|---|
| STAT1 | 6772 | 226 | 8.1 | 0.0000 | 6.1 | 0.0000 |
| IRF1 | 3659 | 157 | 2.7 | 0.0000 | 2.2 | 0.0000 |
| GATA3 | 2625 | 132 | 0.5 | 0.0012 | 0.7 | 0.0254 |
| IRF7 | 3665 | 122 | 1.6 | 0.0000 | 1.6 | 0.0010 |
| SPI1 | 6688 | 102 | 1.9 | 0.0000 | 2.0 | 0.0000 |
| IRF8 | 3394 | 93 | 2.3 | 0.0000 | 2.1 | 0.0000 |
| STAT4 | 6775 | 88 | 1.9 | 0.0000 | 1.5 | 0.0021 |
| STAT2 | 6773 | 74 | 3.1 | 0.0000 | 2.4 | 0.0000 |
| IRF9 | 10379 | 64 | 1.7 | 0.0000 | 1.8 | 0.0000 |
| IKZF1 | 10320 | 56 | 1.9 | 0.0000 | 1.9 | 0.0000 |
| PML | 5371 | 55 | 1.8 | 0.0000 | 1.8 | 0.0000 |
| SRY | 6736 | 33 | 0.3 | 0.0020 | 0.3 | 0.0009 |
| EBF1 | 1879 | 30 | 0.6 | 0.0077 | 0.6 | 0.0073 |
| PLAGL1 | 5325 | 26 | 0.5 | 0.0024 | 0.6 | 0.0051 |
| SOX5 | 6660 | 25 | 0.4 | 0.0000 | 0.4 | 0.0000 |
| IKZF3 | 22806 | 25 | 2.2 | 0.0000 | 1.8 | 0.0000 |
| E2F3 | 1871 | 25 | 1.6 | 0.0000 | 1.7 | 0.0000 |
| IRF6 | 3664 | 23 | 0.6 | 0.0000 | 0.7 | 0.0056 |
| NFIA | 4774 | 23 | 0.5 | 0.0000 | 0.5 | 0.0000 |
| THRA | 7067 | 22 | 0.5 | 0.0000 | 0.6 | 0.0016 |
| NFIB | 4781 | 19 | 0.6 | 0.0036 | 0.6 | 0.0159 |
| TBX5 | 6910 | 18 | 0.6 | 0.0020 | 0.7 | 0.0159 |
| NR1D1 | 9572 | 18 | 0.4 | 0.0000 | 0.4 | 0.0000 |
| HSF2 | 3298 | 17 | 0.6 | 0.0000 | 0.6 | 0.0000 |
| EMX2 | 2018 | 14 | 0.5 | 0.0000 | 0.5 | 0.0000 |
| SIX3 | 6496 | 13 | 0.6 | 0.0004 | 0.6 | 0.0011 |
| TFAP2B | 7021 | 12 | 0.6 | 0.0007 | 0.6 | 0.0009 |
| TCF7L1 | 83439 | 11 | 0.6 | 0.0027 | 0.7 | 0.0116 |
| PEG3 | 5178 | 10 | 0.6 | 0.0008 | 0.6 | 0.0000 |
| FOXN3 | 1112 | 10 | 0.6 | 0.0007 | 0.7 | 0.0103 |
| PAX9 | 5083 | 9 | 0.6 | 0.0045 | 0.7 | 0.0228 |
| GRHL2 | 79977 | 6 | 0.6 | 0.0007 | 0.6 | 0.0029 |
| TFEC | 22797 | 6 | 2.5 | 0.0000 | 2.1 | 0.0000 |
| HOXC10 | 3226 | 5 | 0.4 | 0.0000 | 0.6 | 0.0066 |
| NFIX | 4784 | 5 | 0.5 | 0.0000 | 0.5 | 0.0021 |
| PPARGC1A | 10891 | 5 | 0.4 | 0.0000 | 0.5 | 0.0009 |
| HOXC4 | 3221 | 3 | 0.5 | 0.0000 | 0.7 | 0.0121 |
| MESP1 | 55897 | 3 | 0.6 | 0.0014 | 0.6 | 0.0111 |
| POU2F3 | 25833 | 3 | 0.4 | 0.0000 | 0.5 | 0.0021 |
| ZNF704 | 619279 | 2 | 0.5 | 0.0000 | 0.6 | 0.0000 |
| HLF | 3131 | 1 | 0.5 | 0.0000 | 0.6 | 0.0131 |
| Group 1 (n = 63) | Group 2 (n = 27) | p Value | |
|---|---|---|---|
| Mean Age (±SEM) | 46.4 (1.9) | 45.6 (3.4) | 0.8286 |
| Gender (% Female) | 79.4 | 85.2 | 0.5234 |
| Ethnicity (% African-American) | 23.8 | 22.2 | 0.8722 |
| BMI (±SEM) | 28.9 (0.9) | 25.1 (0.8) | 0.0161 |
| % of DLE—% of SCLE | 49.2–50.8 | 59.3–40.7 | 0.3873 |
| SLEDAI (±SEM) | 8.7 (0.9) | 6.9 (1.0) | 0.3221 |
| CLASI Activity (±SEM) | 7.3 (0.4) | 7.1 (0.9) | 0.9102 |
| CLASI Damage (±SEM) | 2.0 (0.4) | 3.8 (1.0) | 0.0408 |
| % ≥4 ACR criteria for SLE within 3 years of biopsy | 55.6 | 40.7 | 0.2531 |
| Positive anti-Smith antibodies (%) | 20.6 | 33.3 | 0.1280 |
| Positive anti-Ro antibodies (%) | 41.3 | 51.9 | 0.2640 |
| Positive antiphospholipid antibodies (%) | 23.8 | 3.7 | 0.0705 |
| dsDNA titer (±SEM) | 22.2 (8.5) | 21.6 (10.8) | 0.9718 |
| IFN score (±SEM) | 16.4 (0.9) | 20.3 (1.6) | 0.0289 |
| Medications (%) | |||
| Oral Prednisone <10 mg daily | 7.9 | 3.7 | 0.4663 |
| Oral Prednisone >10 mg daily | 14.3 | 22.2 | 0.3602 |
| Mycophenolate Mofetil | 9.5 | 0.0 | 0.0991 |
| Antimalarials | 47.6 | 29.6 | 0.1159 |
| Methotrexate | 1.6 | 0.0 | 0.5158 |
© 2019 by the authors. Licensee MDPI, Basel, Switzerland. This article is an open access article distributed under the terms and conditions of the Creative Commons Attribution (CC BY) license (http://creativecommons.org/licenses/by/4.0/).
Share and Cite
Berthier, C.C.; Tsoi, L.C.; Reed, T.J.; Stannard, J.N.; Myers, E.M.; Namas, R.; Xing, X.; Lazar, S.; Lowe, L.; Kretzler, M.; et al. Molecular Profiling of Cutaneous Lupus Lesions Identifies Subgroups Distinct from Clinical Phenotypes. J. Clin. Med. 2019, 8, 1244. https://doi.org/10.3390/jcm8081244
Berthier CC, Tsoi LC, Reed TJ, Stannard JN, Myers EM, Namas R, Xing X, Lazar S, Lowe L, Kretzler M, et al. Molecular Profiling of Cutaneous Lupus Lesions Identifies Subgroups Distinct from Clinical Phenotypes. Journal of Clinical Medicine. 2019; 8(8):1244. https://doi.org/10.3390/jcm8081244
Chicago/Turabian StyleBerthier, Celine C., Lam C. Tsoi, Tamra J. Reed, Jasmine N. Stannard, Emily M. Myers, Rajaie Namas, Xianying Xing, Stephanie Lazar, Lori Lowe, Matthias Kretzler, and et al. 2019. "Molecular Profiling of Cutaneous Lupus Lesions Identifies Subgroups Distinct from Clinical Phenotypes" Journal of Clinical Medicine 8, no. 8: 1244. https://doi.org/10.3390/jcm8081244