Abstract
The aim of the study was to assess the postpartum risk for glucose intolerance since the introduction of the ‘International Association of Diabetes and Pregnancy Study Groups’ (IADPSG) criteria for gestational diabetes mellitus (GDM). Studies published since 2010 were included, which evaluated the risk for type 2 diabetes mellitus (T2DM), impaired glucose tolerance (IGT), and cardiovascular (CV) events in women with previous GDM compared to normal glucose tolerant women. We included forty-three studies, evaluating 4,923,571 pregnant women of which 5.8% (284,312) had a history of GDM. Five studies used IADPSG criteria (n = 6174 women, 1314 with GDM). The overall pooled relative risk (RR) for postpartum T2DM was 7.42 (95% CI: 5.99–9.19) and the RR for postpartum T2DM with IADPSG criteria was 6.45 (95% CI: 4.74–8.77) compared to the RR of 9.08 (95% CI: 6.96–11.85; p = 0.17) for postpartum T2DM based on other diagnostic criteria. The RR for postpartum IGT was 2.45 (95% CI: 1.92–3.13), independent of the criteria used. None of the available studies with IADPSG criteria evaluated the risk for CV events. Women with a history of GDM based on the IADPSG criteria have a similarly increased risk for postpartum glucose intolerance compared to GDM based on other diagnostic criteria. More studies with GDM based on the IADPSG criteria are needed to increase the quality of evidence concerning the long-term metabolic risk.
1. Introduction
Gestational diabetes mellitus (GDM) is defined as diabetes diagnosed in the second or third trimester of pregnancy provided that overt diabetes has been excluded in early pregnancy [1]. Women with a history of GDM are at an increased risk of developing type 2 diabetes mellitus (T2DM) postpartum and also have a significantly higher risk of developing a metabolic syndrome and cardiovascular diseases compared to women with normal glucose tolerance (NGT) in pregnancy [2,3]. The diagnostic criteria for GDM were initially based on the postpartum risk of developing T2DM, as proposed by the Carpenter and Coustan (CC) criteria, while the World Health Organization (WHO) initially defined GDM as impaired glucose tolerance (IGT) outside pregnancy [4]. Based on the “Hyperglycemia and Adverse Pregnancy Outcome” (HAPO) study, a universal one-step diagnostic approach with a 75 g oral glucose tolerance test (OGTT) and more stringent diagnostic criteria for GDM were proposed in 2010 by the “International Association of Diabetes and Pregnancy Study Groups” (IADPSG) [5,6]. The IADPSG criteria are the first diagnostic criteria for GDM based on adverse pregnancy outcomes and have now been endorsed by several national and international societies, including the WHO since 2013 [7]. A systematic review of 2009, published before the introduction of the IADPSG criteria, showed that women with GDM have a seven-fold increased risk of developing T2DM later in life compared to NGT women during pregnancy [2]. A subgroup analysis showed no difference in the postpartum risk for T2DM when women were stratified according to the different diagnostic criteria used for GDM [2]. However, this systematic review included mostly old studies and was performed before the introduction of the IADPSG criteria for GDM. A systematic review from 2018 included more recent studies and confirmed the seven-fold increased postpartum risk for T2DM but did not evaluate the postpartum risk based on the IADPSG criteria compared to other criteria [8]. The IADPSG screening strategy identifies women with milder degrees of hyperglycemia during pregnancy compared to other diagnostic criteria and screening strategies (two-step or selective screening), which might lead to a lower proportion at risk of postpartum glucose intolerance [9,10,11]. Our objective was therefore to assess the postpartum risk for glucose intolerance and cardiovascular events in women with GDM based on the IADPSG criteria compared to other diagnostic criteria.
2. Methods
2.1. Protocol and Registration
Data were reported in accordance with the Guidelines for Meta-Analyses and Systematic Reviews of Observational Studies (MOOSE) [12]. The study protocol was registered on the International Prospective Register of Systematic Reviews (PROSPERO) under the following identification number: CRD42018102315.
2.2. Data Sources and Searches
We searched MEDLINE, EMBASE, Web of Science, the Cochrane Library, and Latin American and Caribbean Health Sciences Literature (LILACS) up to 20 January 2019 for eligible studies published after 2009. Electronic searches were supplemented with manual searches of references of included studies. The journals Diabetes Care and Diabetologia (including special supplements) were screened for possible relevant articles. Table S1 shows our detailed search strategy. This was developed in consultation with biomedical reference librarians of the Catholic University of Leuven (KU Leuven).
2.3. Study Selection
We included retrospective and prospective cohort, case-control and cross-sectional studies that evaluated the postpartum risk of glucose intolerance (T2DM and IGT (defined as impaired fasting glycemia and/or impaired glucose tolerance based on the 2 h glycemia on the OGTT)) or cardiovascular events (myocardial infarction or stroke) in women with a history of GDM. The study selection was performed by two investigators (K.B. and K.L.) independently. To be included, studies had to be published after 2009 (after the introduction of the IADPSG criteria), have a minimum follow-up period of six weeks after the index pregnancy, and contain a control group without a history of GDM. The control NGT group could be matched or not matched to the GDM group. No matched controls were defined as NGT women not matched by other characteristics (such as age and body mass index (BMI)) to the GDM group. Studies were included independent of which GDM screening strategy or diagnostic criteria were used. Studies including women with type 1 diabetes, T2DM, or with overt diabetes in early pregnancy were excluded. No language restriction was applied, but studies written in languages other than English, French, or Spanish were only included if they could be adequately translated using Google Translate.
2.4. Data Extraction
Studies were uploaded in Endnote (version X9). Duplicated records were removed using Endnote software and by performing a manual search. Two investigators (K.B. and K.L.) independently reviewed and extracted relevant data from each included report using pre-designed forms. Any disagreement in data extraction was reconciled by consensus. If needed, a third reviewer (J.B.) was consulted. Extracted data included study setting, design, participant characteristics (country, origin, definition of control group, family history of T2DM, personal history of GDM, maternal age and body mass index (BMI, kg/m2) in the index pregnancy and at follow-up, and parity), characteristics about the diagnosis of GDM, IGT, and T2DM (timing of screening, screening strategy, diagnostic criteria), outcome data, and follow-up data (duration and loss to follow-up). The origin of women was considered to be mixed if <80% of the study participants had the same ethnicity. When studies reported data concerning the risk for T2DM at multiple time points after the index pregnancy, the data with the longest follow-up were extracted since the risk for glucose intolerance increases with the duration of the follow-up. Authors were contacted for missing outcome data.
2.5. Outcomes
Outcomes included T2DM as the primary outcome and IGT, myocardial infarction, and stroke as the secondary outcomes. No restrictions were applied concerning the strategy (fasting glycemia, OGTT, or HbA1c) or diagnostic criteria used to define glucose intolerance postpartum.
2.6. Data Synthesis and Analysis
Pooled analyses and subgroup analyses were conducted on Review Manager (RevMan), version 5.3 (The Nordic Cochrane Centre, The Cochrane Collaboration, Copenhagen, Denmark) using the DerSimonian and Laird random-effects model and Mantel–Haenszel methods, given their better statistical properties in case of sparse data, to calculate the summary relative risk (RR). Unadjusted absolute risks were determined. Heterogeneity was assessed using the Cochran Q statistic and quantified using the I2 statistic, where I2 > 50% was considered as important heterogeneity [13]. We investigated potential sources of heterogeneity by performing the following subgroup analyses for T2DM and IGT: duration of postpartum follow-up (<3 years, ≥3 to <6 years, ≥6 to <10 years, ≥10 to <15 years, ≥15 to <20 years, ≥20 years, or not reported), maternal age during pregnancy and at follow-up (<30 years, ≥30 to <35 years, ≥35 years, or not reported), maternal BMI during pregnancy and at follow-up (<25 kg/m2, ≥25 to <30 kg/m2, ≥30 kg/m2, or not reported), origin (White, Asian, Pacific Islanders, Middle Eastern, mixed, or not reported), diagnostic criteria, and screening strategy used for GDM and glucose intolerance postpartum. Heterogeneity within and between subgroups was assessed using the I2-test, with a significance level of 0.10.
Sensitivity analyses were performed to evaluate whether the conclusions would have differed if eligibility had been restricted to studies with good quality according to the Newcastle–Ottawa Scale (NOS) or prospective cohort studies.
2.7. Quality Assessment
The same two reviewers (K.B. and K.L.) independently evaluated the quality of the studies in accordance with NOS [14]. The quality assessment was divided into good quality (three or four stars for selection, one or two stars for comparability, and two or three stars for outcome/exposure), fair quality (two stars for selection, one or two stars for comparability, and two or three stars for outcome/exposure), and poor quality (none or one star for selection, no stars for comparability, or none or one star for outcome/exposure). In order to investigate possible publication bias, we performed a visual inspection of funnel plots.
3. Results
3.1. Search Results
Figure 1 shows the literature search and selection process. Our initial search yielded 7970 publications, of which 109 articles were reviewed in full and 43 studies were included in the final analysis [3,11,15,16,17,18,19,20,21,22,23,24,25,26,27,28,29,30,31,32,33,34,35,36,37,38,39,40,41,42,43,44,45,46,47,48,49,50,51,52,53,54,55]. Forty studies reported on T2DM [3,11,15,16,17,18,19,20,21,22,23,24,25,26,27,28,29,30,31,32,33,34,35,36,37,38,39,40,41,42,43,44,45,46,47,48,49,50,51,55], twenty-one on IGT [11,15,19,20,21,22,23,24,25,26,27,28,29,30,31,32,33,34,39,53,55], and five studies on cardiovascular events [16,17,18,52,54].
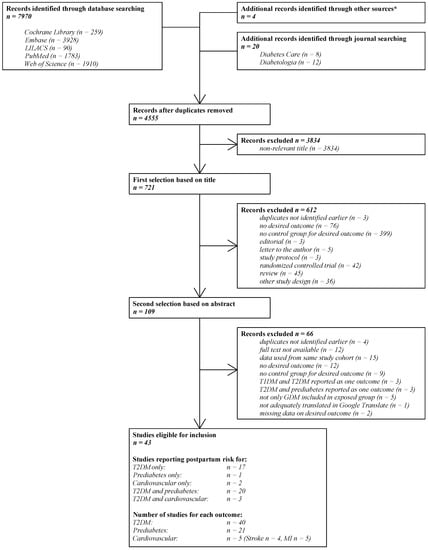
Figure 1.
The literature search and selection process. N: the number of studies; LILACS: Latin American and Caribbean Health Sciences Literature; T1DM: type 1 diabetes mellitus; T2DM: type 2 diabetes mellitus; GDM: gestational diabetes mellitus; MI: myocardial infarction. * Retrieved from the systematic review of Song et al. [8].
3.2. Study Characteristics
Table 1 shows the characteristics of included studies. Across all studies, the total number of pregnant women included was 4,923,571, of which 284,312 had GDM (5.8%). Of all studies, 18 (41.9%) included less than 200 women with GDM. The follow-up ranged from 12 weeks to 25.7 years postpartum, with a mean follow-up of 7.9 years. Of all included studies, 19 (44.2%) were prospective cohorts, 13 (30.2%) retrospective cohorts, 6 (14.0%) case-control studies, and 5 (11.6%) cross-sectional studies. Fifteen studies (34.9%) were performed in Europe, ten (23.3%) in Asia, fourteen (32.6%) in North America, three (7.0%) in Australia, and one (2.3%) was an international study. The mean maternal age at follow-up was 36.5 years with a median BMI at follow-up of 26.9 kg/m2. The drop-out rate was only reported in six (14.0%) studies—three had a non important (<5%) drop-out and three studies reported a drop-out of >20%.

Table 1.
The characteristics of included studies: (A) study and patient characteristics, (B) characteristics concerning GDM, T2DM, and prediabetes, and (C) characteristics concerning stroke and myocardial infarction.
The diagnostic criteria for GDM were reported in 29 (67.4%) studies, of which six (14.0%) used the 1999 WHO criteria, five (11.6%) the IADPSG criteria, six (14.0%) the CC criteria, four (9.3%) the Canadian Diabetes Association (CDA) criteria, two (4.7%) the Australasian Diabetes in Pregnancy Society (ADIPS) criteria, two (4.7%) the National Diabetes Data Group (NDDG) criteria, one (2.3%) the German Diabetes Association criteria, and three (7.0%) used other local criteria. The five studies using the IADPSG screening strategy, included 6174 women of which 1314 had GDM, with a mean follow-up of 5.6 years, mean maternal age at follow-up of 36.9 years, and median maternal BMI at follow-up of 29.3 kg/m2. Three studies were performed in Europe, one in Asia, and one was an international study.
The screening strategy for GDM was reported in 24 (55.8%) studies, of which three (7.0%) used screening for GDM based on risk factors, 10 (23.3%) studies used a two-step screening strategy with a glucose challenge test (GCT), and 11 (25.6%) studies used a universal one-step approach with a 75 g OGTT. T2DM was defined according to the ADA criteria in 13 (32.5%) studies, the WHO criteria in seven (17.5%) studies, the CDA criteria in three (7.5%) studies, and the German Diabetes Association criteria in one study (2.5%). IGT was defined according to the ADA criteria in nine (42.9%) studies, the WHO criteria in five (23.8%) studies, and the CDA criteria in three (14.3%) studies.
3.3. Postpartum Risk of Type 2 Diabetes
Figure 2A shows the overall postpartum risk for T2DM in women with a history of GDM compared to NGT women. The risk for T2DM stratified according to the IADPSG criteria compared to other diagnostic criteria is reported in Table 2A. The overall pooled RR for postpartum T2DM was 7.42 (95% CI: 5.99–9.19). The RR for postpartum T2DM for GDM based on the IADPSG criteria was 6.45 (95% CI: 4.74–8.77) compared to a RR of 9.08 (95% CI: 6.96–11.85; p = 0.17) for GDM based on other diagnostic criteria. There was substantial heterogeneity across different subgroups (Table 2A). The highest RR for T2DM was seen within the first 6 years after the index pregnancy. The risk for T2DM decreased with a longer follow-up period but remained significantly increased in comparison to NGT women. The RR was highest in women aged ≥30 to <35 years at follow-up, among women with a BMI ≥ 30 kg/m2 during pregnancy, in women with a BMI < 25 kg/m2 at follow-up, and in women with a White or mixed origin. The RR for postpartum T2DM was not significantly different according to the screening strategy used for GDM or the screening strategy used for T2DM postpartum.
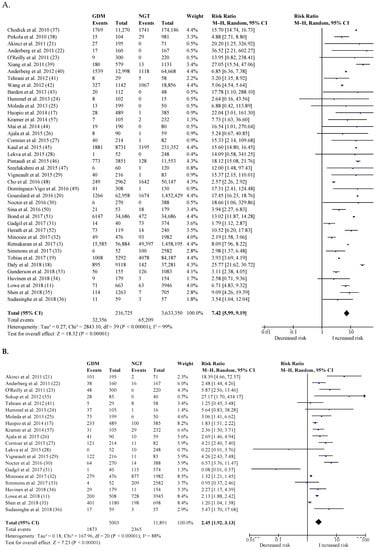
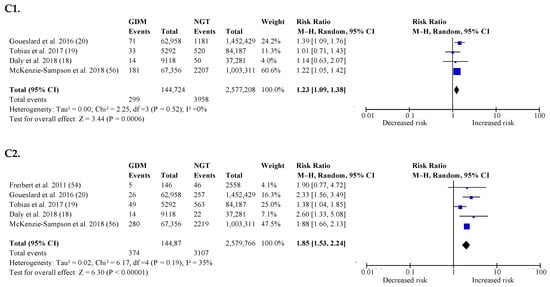
Figure 2.
The overall postpartum risk for glucose intolerance and cardiovascular events in women with a history of GDM compared to NGT women: (A) Type 2 diabetes mellitus (T2DM), (B) prediabetes, (C1) stroke, and (C2) myocardial infarction. T2DM: Type 2 diabetes mellitus; GDM, gestational diabetes mellitus; 95% CI: confidence interval; M–H: Mantel–Haenszel method; df: degrees of freedom; RR: relative risk or risk ratio. X-axis is log scale of RR. Squares represent the RR of an individual study. The size of the square is proportional to the weight of the study, which was calculated using a random-effects model. The horizontal lines indicate 95% CI. The diamond represents the pooled RR with its 95% CI.
Table 2.
Subgroup analyses for T2DM and prediabetes: (A) subgroup analyses for T2DM and (B) subgroup analyses for prediabetes.
3.4. Postpartum Risk of Impaired Glucose Tolerance
Figure 2B shows the overall postpartum risk for IGT in women with a history of GDM compared to NGT women. The risk for IGT stratified according to studies using the IADPSG criteria compared to other criteria is reported in Table 2B. The overall pooled RR for postpartum IGT was 2.45 (95% CI: 1.92–3.13). The RR for postpartum IGT for GDM based on the IADPSG criteria was 2.79 (95% CI: 1.30–5.96) compared to a RR of 2.03 (95% CI: 1.57–2.62; p = 0.73) for GDM based on other diagnostic criteria. Heterogeneity was substantial across different subgroups (Table 2B). The highest RR for IGT was seen within the first 3 years after the index pregnancy. The risk for IGT decreased with a longer follow-up period but remained significantly increased in comparison to NGT women. The RR was highest in women with a BMI ≥30 kg/m2 during pregnancy, in women with a BMI of 25–30 kg/m2 at follow-up, and in women with a White or mixed origin. The RR for IGT was not significantly different according to the screening strategy used for GDM or according to the diagnostic criteria used for IGT or maternal age during pregnancy or postpartum.
3.5. Sensitivity Analyses
Studies with good quality according to the NOS showed a much higher RR for T2DM of 15.21 (95% CI 8.36–27.69), while prospective cohort studies showed a lower RR for T2DM of 4.41 (95% CI: 3.64–5.35) compared to the overall effect (Table S3). Studies with good quality according to the NOS showed a higher RR for IGT of 4.57 (95% CI: 2.13–9.80), while prospective cohort studies showed a similar RR for IGT of 2.41 (95% CI: 1.87–3.10) as the overall effect (Table S2).
3.6. Postpartum Risk of Cardiovascular Events
Figure 2C shows the overall postpartum risk for stroke and myocardial infarction in women with a history of GDM compared to NGT women. RR for stroke was 1.23 (95% CI: 1.09–1.38) and RR for myocardial infarction was 1.85 (95% CI: 1.53–2.24). Of all studies evaluating cardiovascular events, none used the IADPSG criteria. Three studies reported on the postpartum risk of both T2DM and cardiovascular events [16,17,18]. However, only one study reported on the cardiovascular risk in women with previous GDM with and without T2DM and showed that women with GDM without T2DM had no increased risk (RR for stroke of 0.94 (95% CI: 0.63–1.41) and RR for myocardial infarction of 1.26 (95% CI: 0.90–1.76)), while women with GDM and T2DM had a significantly increased risk for myocardial infarction (RR of 1.28 (95% CI: 0.64–2.58) for stroke and RR for myocardial infarction of 1.93 (95% CI: 1.12–3.33)) [17].
3.7. Publication Bias
The funnel plots are shown in Figure S1. Since the estimated RRs for individual studies had a similar value, a visual inspection of the funnel plots for T2DM and cardiovascular events was not applicable. A visual inspection of the funnel plot for IGT suggested the absence of publication bias or only a small effect.
3.8. Assessment of Quality
Table S3 shows the quality of studies according to the NOS. Of all the 40 studies for T2DM, 30 (75.0%) had poor quality. The poor quality was mostly due to the absence of a matched control group. Of all the studies for IGT and cardiovascular events, 15 (71.4%) and 3 (60.0%), respectively, had poor quality.
4. Discussion
4.1. Summary of Findings
The present systematic review and meta-analysis of 43 studies, including nearly five million pregnant women of which 6% (about 280,000) had prior GDM, showed that women with a history of GDM based on the IADPSG criteria have a similarly increased risk for postpartum glucose intolerance compared to GDM based on other diagnostic criteria and other GDM screening strategies. Overall, women with GDM have a seven-fold increased risk of developing T2DM, a two-fold increased risk of developing IGT, and about a 1.5 times increased risk for cardiovascular events later in life compared to NGT women during pregnancy. This might be an underestimation, as the sensitivity analyses showed that the highest quality studies demonstrated a fifteen-fold increased risk for T2DM and a four-fold increased risk for IGT in women with a history of GDM compared to NGT women. The highest risk for developing glucose intolerance was present within the 3–6 years after the index pregnancy. In addition, the highest risk for T2DM was present in White and mixed-race women, in women with higher age and higher BMI during pregnancy, and in normal weight women at follow-up. The highest risk for IGT was present in obese women during pregnancy and in White and mixed-race women.
4.2. Results in Relation to What We Already Know
Our findings extend those of previous systematic reviews and meta-analyses showing that women with GDM have a seven-fold increased risk of developing T2DM later in life compared to NGT women during pregnancy [2,8]. The first systematic review of 2009 included twenty cohort studies and showed no significant heterogeneity from the subgroup analysis of the criteria used for the diagnosis of GDM and T2DM [2]. However, this systematic review included older studies and was performed before the introduction of the IADPSG criteria for GDM. In contrast to our systematic review, effect estimates were broadly consistent in all subgroups analyzed (such as ethnic origin, follow-up time, maternal age, and BMI) [2]. The most recent systematic review and meta-analysis from 2018 evaluated more than 2 million pregnant women from thirty cohort studies and confirmed the unadjusted seven-fold increased postpartum risk for T2DM. However, this review did not evaluate the postpartum risk based on the IADPSG criteria compared to other diagnostic criteria for GDM [8]. Twenty-eight cohorts reported the diagnostic criteria used for GDM but none of the included studies used the IADPSG criteria for GDM. In line with the results of our systematic review, the 2018 review showed that the highest risk for T2DM was present within 3–6 years after the index pregnancy and that women with normal weight at follow-up had the highest RR for T2DM [8]. As in our systematic review, women with a White origin had a higher RR of postpartum T2DM than Asian women. As in previous systematic reviews, no significant heterogeneity was observed according to the screening strategy used for GDM or according to the screening strategy and diagnostic criteria used for glucose intolerance postpartum [2,8].
To date, long-term data on the risk of T2DM developing in women with GDM diagnosed by the universal IADPSG screening strategy have been limited. In general, the IADPSG screening strategy identifies women with milder degrees of hyperglycemia during pregnancy compared to other diagnostic criteria and screening strategies (two-step or selective screening), which might lead to a lower proportion at risk of postpartum glucose intolerance [9,10,11]. We have previously shown glucose intolerance in 42% of women three months after a pregnancy with GDM diagnosed by a two-step screening strategy with a GCT, while less than 20% of women had glucose intolerance in early postpartum after a GDM pregnancy based on a universal one-step diagnostic approach with the IADPSG criteria [9,10]. A follow-up of the HAPO study 10–14 years postpartum showed that untreated women with GDM, defined post hoc by the IADPSG criteria, had significantly higher rates of a glucose metabolism disorder than women without GDM (52.2% vs. 20.1% (T2DM 10.7% vs. 1.6%)) [11]. However, GDM, according to the CC criteria, was associated with a much higher risk for T2DM (20% vs. 7.9%) compared to women with GDM according to the IADPSG criteria alone [11]. Our systematic review includes the largest number of studies to date on the risk for T2DM after GDM and presents the first summarized data on the risk for glucose intolerance postpartum in GDM based on the IADPSG criteria compared to GDM based on other diagnostic criteria. In addition, we have shown that women with previous GDM are also at increased risk of stroke and myocardial infarction. This is in line with a recent meta-analysis showing that women with GDM had a two-fold higher risk for future cardiovascular events and that this cardiovascular risk is independent of the intercurrent development of T2DM [56].
4.3. Implications
Our study has important public health implications. The IADPSG criteria are the first diagnostic criteria based on pregnancy outcomes. By implementing the IADPSG screening strategy, important adverse pregnancy outcomes can be prevented. However, due to concerns concerning the increased workload and associated costs, the adoption of the IADPSG screening strategy varies worldwide [57]. The limited data on the long-term risk for glucose intolerance postpartum in women with GDM based on the IADPSG criteria contribute to the ongoing discussion on whether implementing the IADPSG screening strategy will be cost-effective. Our data show that women with GDM based on the IADPSG criteria have a similarly increased risk for glucose intolerance postpartum compared to women with GDM based on other diagnostic criteria or other screening strategies for GDM. Since the implementation of the IADPSG screening strategy has led to an important increase in the prevalence of GDM, this might offer a window of opportunity to identify a large group of women at increased risk of glucose intolerance later in life. This can help to timely implement strategies to prevent the development of T2DM. Our data confirm that the highest RR to develop glucose intolerance is present within the first three to six years after the index pregnancy, highlighting the importance to start early after delivery with screening and prevention programs in this high-risk group to prevent and timely detect T2DM. In addition, continued follow-up beyond six years postpartum remains important since the risk to develop glucose intolerance over time remains significantly higher compared to women without a history of GDM. Our data also show that women with a White origin and women with normal weight at follow-up have the highest risks to develop T2DM. This might suggest that GDM identifies a high-risk group for T2DM at a young age due to beta-cell dysfunction and that genetic predisposition might play an important role in Caucasian women. However, caution for interpretation is warranted since many subgroup analyses were based on a limited number of studies and the majority of studies evaluated Caucasian women.
4.4. Strengths and Limitations
This systematic review and meta-analysis included the largest number of studies to date on the long-term risk for glucose intolerance after GDM. In contrast to other systematic reviews, our review included only recent studies published after 2009, and we did not only include cohort studies but also case-control and cross-sectional studies provided they met the eligible criteria [2,8]. In addition, our study provides the first data on the long-term risk for glucose intolerance in women with GDM based on the IADPSG criteria. However, our study has several limitations. Due to the language barrier, we only searched studies published in English, French, and Spanish. However, we only had to exclude one study due to the language used (Chinese). Several key variables, such as BMI and data on the family history of GDM and family history of T2DM, were absent in many studies. We contacted the authors to limit the number of missing variables. The overall quality of the studies was low, often due to the lack of a matched control group. In addition, nearly one-third of the studies did not report the diagnostic criteria used for GDM. Moreover, since the IADPSG criteria have only been recommended since 2010, only five studies with GDM based on the IADPSG criteria were identified and none of the studies evaluating the risk for cardiovascular events used the IADPSG criteria. More studies with GDM based on the IADPSG criteria and with a longer follow-up are needed to increase the quality of evidence concerning the long-term metabolic risk.
5. Conclusions
Women with a history of GDM based on the IADPSG criteria have a similarly increased risk for postpartum glucose intolerance compared to GDM based on other diagnostic criteria and other screening strategies. Women with GDM have a seven-fold increased risk of developing T2DM, a two-fold increased risk of developing IGT, and about a 1.5 times increased risk for cardiovascular events later in life compared to NGT women during pregnancy. As the relative increase in risk for T2DM is highest within the first six years after delivery, screening and prevention strategies should be implemented within the first years after the index pregnancy.
Supplementary Materials
Supplementary materials can be found at https://www.mdpi.com/2077-0383/8/9/1431/s1. Table S1: Detailed search strategy; Table S2: Sensitivity analyses; Table S3: Assessment of quality of studies by NOS; Figure S1: Funnel plot.
Author Contributions
K.B., K.L., J.B. and M.C. wrote the protocol of the systematic review. K.B. and K.L. performed independently of each other the selection of articles and data extraction. K.L. and J.B. performed the analyses. K.B. wrote the first draft of the manuscript. All authors contributed to the study design, including data interpretation and manuscript revision. The corresponding author, K.B., is the guarantor of this work, had full access to all the data in the study, and had final responsibility for the contents of the article and the decision to submit for publication.
Acknowledgments
K.B. is the recipient of a “Fundamenteel Klinisch Navorserschap FWO Vlaanderen”.
Conflicts of Interest
The authors declare that there is no conflict of interest associated with this manuscript.
References
- American Diabetes Association. Management of Diabetes in Pregnancy: Standards of Medical Care in Diabetes-2019. Diabetes Care 2019, 42 (Suppl. 1), S165–S172. [Google Scholar] [CrossRef] [PubMed]
- Bellamy, L.; Casas, J.P.; Hingorani, A.D.; Williams, D. Type 2 diabetes mellitus after gestational diabetes: A systematic review and meta-analysis. Lancet 2009, 373, 1773–1779. [Google Scholar] [CrossRef]
- Retnakaran, R.; Shah, B.R. Role of Type 2 Diabetes in Determining Retinal, Renal, and Cardiovascular Outcomes in Women With Previous Gestational Diabetes Mellitus. Diabetes Care 2017, 40, 101–108. [Google Scholar] [CrossRef] [PubMed]
- Metzger, B.E.; Buchanan, T.A.; Coustan, D.R.; de Leiva, A.; Dunger, D.B.; Hadden, D.R.; Hod, M.; Kitzmiller, J.L.; Kjos, S.L.; Oats, J.N.; et al. Summary and recommendations of the Fifth International Workshop-Conference on Gestational Diabetes Mellitus. Diabetes Care 2007, 30 (Suppl. 2), S251–S260. [Google Scholar] [CrossRef]
- HAPO Study Cooperative Research Group; Metzger, B.E.; Lowe, L.P.; Dyer, A.R.; Trimble, E.R.; Chaovarindr, U.; Coustan, D.R.; Hadden, D.R.; McCance, D.R.; Hod, M.; et al. Hyperglycemia and adverse pregnancy outcomes. N. Engl. J. Med. 2008, 358, 1991–2002. [Google Scholar]
- International Association of Diabetes; Pregnancy Study Groups Consensus Panel; Metzger, B.E.; Gabbe, S.G.; Persson, B.; Buchanan, T.A.; Catalano, P.A.; Damm, P.; Dyer, A.R.; Leiva, A.D.; et al. International association of diabetes and pregnancy study groups recommendations on the diagnosis and classification of hyperglycemia in pregnancy. Diabetes Care 2010, 33, 676–682. [Google Scholar]
- Diagnostic criteria and classification of hyperglycaemia first detected in pregnancy: A World Health Organization Guideline. Diabetes Res. Clin. Pr. 2014, 103, 341–363. [CrossRef]
- Song, C.; Lyu, Y.; Li, C.; Liu, P.; Li, J.; Ma, R.C.; Yang, X. Long-term risk of diabetes in women at varying durations after gestational diabetes: A systematic review and meta-analysis with more than 2 million women. Obes. Rev. 2018, 19, 421–429. [Google Scholar] [CrossRef] [PubMed]
- Benhalima, K.; Jegers, K.; Devlieger, R.; Verhaeghe, J.; Mathieu, C. Glucose Intolerance after a Recent History of Gestational Diabetes Based on the 2013 WHO Criteria. PLoS ONE 2016, 11, e0157272. [Google Scholar] [CrossRef] [PubMed]
- Benhalima, K.; Van Crombrugge, P.; Moyson, C.; Verhaeghe, J.; Vandeginste, S.; Verlaenen, H.; Vercammen, C.; Maes, T.; Dufraimont, E.; de Block, C.; et al. Prediction of Glucose Intolerance in Early Postpartum in Women with Gestational Diabetes Mellitus Based on the 2013 WHO Criteria. J. Clin. Med. 2019, 8, 383. [Google Scholar] [CrossRef]
- Lowe, W.L., Jr.; Scholtens, D.M.; Lowe, L.P.; Kuang, A.; Nodzenski, M.; Talbot, O.; Catalano, P.M.; Linder, B.; Brickman, W.J.; Clayton, P.; et al. Association of Gestational Diabetes With Maternal Disorders of Glucose Metabolism and Childhood Adiposity. JAMA 2018, 320, 1005–1016. [Google Scholar] [CrossRef] [PubMed]
- Stroup, D.F.; Berlin, J.A.; Morton, S.C.; Olkin, I.; Williamson, G.D.; Rennie, D.; Moher, D.; Becker, B.J.; Sipe, T.A.; Thacker, S.B. Meta-analysis of observational studies in epidemiology: A proposal for reporting. Meta-analysis Of Observational Studies in Epidemiology (MOOSE) group. JAMA 2000, 283, 2008–2012. [Google Scholar] [CrossRef] [PubMed]
- Higgins, J.P.; Thompson, S.G. Quantifying heterogeneity in a meta-analysis. Stat. Med. 2002, 21, 1539–1558. [Google Scholar] [CrossRef] [PubMed]
- Wells, G.S.B.; O’Connell, D.; Peterson, J.; Welch, V.; Losos, M.; Tugwell, P. The Newcastle-Ottawa Scale (NOS) for Assessing the Quality of Nonrandomised Studies in Meta-Analyses. Available online: http://www.ohri.ca/programs/clinical_epidemiology/oxford.asp (accessed on 22 October 2018).
- Huopio, H.; Hakkarainen, H.; Paakkonen, M.; Kuulasmaa, T.; Voutilainen, R.; Heinonen, S.; Cederberg, H. Long-term changes in glucose metabolism after gestational diabetes: A double cohort study. BMC Pregnancy Childbirth 2014, 14, 296. [Google Scholar] [CrossRef] [PubMed]
- Daly, B.; Toulis, K.A.; Thomas, N.; Gokhale, K.; Martin, J.; Webber, J.; Keerthy, D.; Jolly, K.; Saravanan, P.; Nirantharakumar, K. Increased risk of ischemic heart disease, hypertension, and type 2 diabetes in women with previous gestational diabetes mellitus, a target group in general practice for preventive interventions: A population-based cohort study. PLoS Med. 2018, 15, e1002488. [Google Scholar] [CrossRef] [PubMed]
- Tobias, D.K.; Stuart, J.J.; Li, S.; Chavarro, J.; Rimm, E.B.; Rich-Edwards, J.; Hu, F.B.; Manson, J.E.; Zhang, C. Association of History of Gestational Diabetes With Long-term Cardiovascular Disease Risk in a Large Prospective Cohort of US Women. JAMA Intern. Med. 2017, 177, 1735–1742. [Google Scholar] [CrossRef] [PubMed]
- Goueslard, K.; Cottenet, J.; Mariet, A.S.; Giroud, M.; Cottin, Y.; Petit, J.M.; Quantin, C. Early cardiovascular events in women with a history of gestational diabetes mellitus. Cardiovasc. Diabetol. 2016, 15, 15. [Google Scholar] [CrossRef] [PubMed]
- Akinci, B.; Celtik, A.; Genc, S.; Yener, S.; Demir, T.; Secil, M.; Kebapcilar, L.; Yesil, S. Evaluation of postpartum carbohydrate intolerance and cardiovascular risk factors in women with gestational diabetes. Gynecol. Endocrinol. 2011, 27, 361–367. [Google Scholar] [CrossRef] [PubMed]
- Anderberg, E.; Landin-Olsson, M.; Kalen, J.; Frid, A.; Ursing, D.; Berntorp, K. Prevalence of impaired glucose tolerance and diabetes after gestational diabetes mellitus comparing different cut-off criteria for abnormal glucose tolerance during pregnancy. Acta Obstet. Gynecol. Scand. 2011, 90, 1252–1258. [Google Scholar] [CrossRef]
- O’Reilly, M.W.; Avalos, G.; Dennedy, M.C.; O’Sullivan, E.P.; Dunne, F. Atlantic DIP: High prevalence of abnormal glucose tolerance post partum is reduced by breast-feeding in women with prior gestational diabetes mellitus. Eur. J. Endocrinol. 2011, 165, 953–959. [Google Scholar] [CrossRef]
- Hummel, S.; Much, D.; Rossbauer, M.; Ziegler, A.G.; Beyerlein, A. Postpartum outcomes in women with gestational diabetes and their offspring: POGO study design and first-year results. Rev. Diabet. Stud. 2013, 10, 49–57. [Google Scholar] [CrossRef]
- Moleda, P.; Homa, K.; Safranow, K.; Celewicz, Z.; Fronczyk, A.; Majkowska, L. Women with normal glucose tolerance and a history of gestational diabetes show significant impairment of beta-cell function at normal insulin sensitivity. Diabetes Metab. 2013, 39, 155–162. [Google Scholar] [CrossRef] [PubMed]
- Ajala, O.; Jensen, L.A.; Ryan, E.; Chik, C. Women with a history of gestational diabetes on long-term follow up have normal vascular function despite more dysglycemia, dyslipidemia and adiposity. Diabetes Res. Clin. Pract. 2015, 110, 309–314. [Google Scholar] [CrossRef] [PubMed]
- Cormier, H.; Vigneault, J.; Garneau, V.; Tchernof, A.; Vohl, M.C.; Weisnagel, S.J.; Robitaille, J. An explained variance-based genetic risk score associated with gestational diabetes antecedent and with progression to pre-diabetes and type 2 diabetes: A cohort study. BJOG Int. J. Obs. Gynaecol. 2015, 122, 411–419. [Google Scholar] [CrossRef] [PubMed]
- Lekva, T.; Bollerslev, J.; Godang, K.; Roland, M.C.; Friis, C.M.; Voldner, N.; Henriksen, T.; Ueland, T. beta-cell dysfunction in women with previous gestational diabetes is associated with visceral adipose tissue distribution. Eur. J. Endocrinol. 2015, 173, 63–70. [Google Scholar] [CrossRef] [PubMed]
- Vigneault, J.; Lemieux, S.; Garneau, V.; Weisnagel, S.J.; Tchernof, A.; Robitaille, J. Association between metabolic deteriorations and prior gestational diabetes according to weight status. Obesity 2015, 23, 345–350. [Google Scholar] [CrossRef] [PubMed]
- Noctor, E.; Crowe, C.; Carmody, L.A.; Saunders, J.A.; Kirwan, B.; O’Dea, A.; Gillespie, P.; Glynn, L.G.; McGuire, B.E.; O’Neill, C.; et al. Abnormal glucose tolerance post-gestational diabetes mellitus as defined by the International Association of Diabetes and Pregnancy Study Groups criteria. Eur. J. Endocrinol. 2016, 175, 287–297. [Google Scholar] [CrossRef] [PubMed]
- Gadgil, M.D.; Oza-Frank, R.; Kandula, N.R.; Kanaya, A.M. Type 2 diabetes after gestational diabetes mellitus in South Asian women in the United States. Diabetes Metabzolism Res. Rev. 2017, 33, e2891. [Google Scholar] [CrossRef]
- Minooee, S.; Ramezani Tehrani, F.; Rahmati, M.; Mansournia, M.A.; Azizi, F. Diabetes incidence and influencing factors in women with and without gestational diabetes mellitus: A 15 year population-based follow-up cohort study. Diabetes Res. Clin. Pract. 2017, 128, 24–31. [Google Scholar] [CrossRef]
- Simmons, D.; Kumar, S.; Crook, N.; Rush, E. Diabetes among Maori women with self-reported past gestational diabetes mellitus in a New Zealand Maori community. Aust. N. Z. J. Obstet. Gynaecol. 2017, 57, 599–603. [Google Scholar] [CrossRef]
- Huvinen, E.; Eriksson, J.G.; Koivusalo, S.B.; Grotenfelt, N.; Tiitinen, A.; Stach-Lempinen, B.; Rönö, K. Heterogeneity of gestational diabetes (GDM) and long-term risk of diabetes and metabolic syndrome: Findings from the RADIEL study follow-up. Acta Diabetol. 2018, 55, 493–501. [Google Scholar] [CrossRef] [PubMed]
- Shen, Y.; Wang, P.; Wang, L.; Zhang, S.; Liu, H.; Li, W.; Li, N.; Li, W.; Leng, J.; Wang, J.; et al. Gestational diabetes with diabetes and prediabetes risks: A large observational study. Eur. J. Endocrinol. 2018, 179, 51–58. [Google Scholar] [CrossRef] [PubMed]
- Sudasinghe, B.H.; Wijeyaratne, C.N.; Ginige, P.S. Long and short-term outcomes of Gestational Diabetes Mellitus (GDM) among South Asian women-A community-based study. Diabetes Res. Clin. Pract. 2018, 145, 93–101. [Google Scholar] [CrossRef] [PubMed]
- Chodick, G.; Elchalal, U.; Sella, T.; Heymann, A.D.; Porath, A.; Kokia, E.; Shalev, V. The risk of overt diabetes mellitus among women with gestational diabetes: A population-based study. Diabet. Med. J. Br. Diabet. Assoc. 2010, 27, 779–785. [Google Scholar] [CrossRef] [PubMed]
- Pirkola, J.; Pouta, A.; Bloigu, A.; Miettola, S.; Hartikainen, A.L.; Jarvelin, M.R.; Vääräsmäki, M. Prepregnancy overweight and gestational diabetes as determinants of subsequent diabetes and hypertension after 20-year follow-up. J. Clin. Endocrinol. Metab. 2010, 95, 772–778. [Google Scholar] [CrossRef] [PubMed]
- Xiang, A.H.; Li, B.H.; Black, M.H.; Sacks, D.A.; Buchanan, T.A.; Jacobsen, S.J.; Lawrence, J.M. Racial and ethnic disparities in diabetes risk after gestational diabetes mellitus. Diabetologia 2011, 54, 3016–3021. [Google Scholar] [CrossRef] [PubMed]
- Anderberg, E.; Carlsson, K.S.; Berntorp, K. Use of healthcare resources after gestational diabetes mellitus: A longitudinal case-control analysis. Scand. J. Public Health 2012, 40, 385–390. [Google Scholar] [CrossRef] [PubMed]
- Tehrani, F.R.; Hashemi, S.; Hasheminia, M.; Azizi, F. Follow-up of women with gestational diabetes in the Tehran Lipid and Glucose Study (TLGS): A population-based cohort study. J. Obstet. Gynaecol. Res. 2012, 38, 698–704. [Google Scholar] [CrossRef] [PubMed]
- Wang, Y.; Chen, L.; Horswell, R.; Xiao, K.; Besse, J.; Johnson, J.; Ryan, D.H.; Hu, G. Racial differences in the association between gestational diabetes mellitus and risk of type 2 diabetes. J. Women’s Health 2012, 21, 628–633. [Google Scholar] [CrossRef] [PubMed]
- Barden, A.; Singh, R.; Walters, B.; Phillips, M.; Beilin, L.J. A simple scoring method using cardiometabolic risk measurements in pregnancy to determine 10-year risk of type 2 diabetes in women with gestational diabetes. Nutr. Diabetes 2013, 3, e72. [Google Scholar] [CrossRef] [PubMed]
- Mai, C.; Wang, B.; Wen, J.; Lin, X.; Niu, J. Lipoprotein-associated phospholipase A2 and AGEs are associated with cardiovascular risk factors in women with history of gestational diabetes mellitus. Gynecol. Endocrinol. 2014, 30, 241–244. [Google Scholar] [CrossRef] [PubMed]
- Kaul, P.; Savu, A.; Nerenberg, K.A.; Donovan, L.E.; Chik, C.L.; Ryan, E.A.; Johnson, J.A. Impact of gestational diabetes mellitus and high maternal weight on the development of diabetes, hypertension and cardiovascular disease: A population-level analysis. Diabet. Med. 2015, 32, 164–173. [Google Scholar] [CrossRef] [PubMed]
- Pintaudi, B.; Lucisano, G.; Pellegrini, F.; D’Ettorre, A.; Lepore, V.; De Berardis, G.; Scardapane, M.; Di Vieste, G.; Rossi, M.C.; Sacco, M.; et al. The long-term effects of stillbirth on women with and without gestational diabetes: A population-based cohort study. Diabetologia 2015, 58, 67–74. [Google Scholar] [CrossRef] [PubMed]
- Sreelakshmi, P.R.; Nair, S.; Soman, B.; Alex, R.; Vijayakumar, K.; Kutty, V.R. Maternal and neonatal outcomes of gestational diabetes: A retrospective cohort study from Southern India. J. Fam. Med. Prim. Care 2015, 4, 395–398. [Google Scholar] [CrossRef] [PubMed]
- Cho, G.J.; Park, J.H.; Lee, H.; Yoo, S.; Shin, S.A.; Oh, M.J. Prepregnancy Factors as Determinants of the Development of Diabetes Mellitus After First Pregnancy. J. Clin. Endocrinol. Metab. 2016, 101, 2923–2930. [Google Scholar] [PubMed]
- Dominguez-Vigo, P.; Alvarez-Silvares, E.; Alves-Perez, M.T.; Dominguez-Sanchez, J.; Gonzalez-Gonzalez, A. Incidence and clinical risk factors for the development of diabetes mellitus in women with previous gestational diabetes. Ginecol. Obstet. Mex. 2016, 84, 228–242. [Google Scholar]
- Sina, M.; Hoy, W.E.; Wang, Z. Gestational diabetes and the risk of subsequent Type 2 diabetes in Australian Aboriginal women living in a remote community. Diabet. Med. 2016, 33, 693–694. [Google Scholar] [CrossRef] [PubMed]
- Bond, R.; Pace, R.; Rahme, E.; Dasgupta, K. Diabetes risk in women with gestational diabetes mellitus and a history of polycystic ovary syndrome: A retrospective cohort study. Diabet. Med. 2017, 34, 1684–1695. [Google Scholar] [CrossRef] [PubMed]
- Herath, H.; Herath, R.; Wickremasinghe, R. Gestational diabetes mellitus and risk of type 2 diabetes 10 years after the index pregnancy in Sri Lankan women-A community based retrospective cohort study. PLoS ONE 2017, 12, e0179647. [Google Scholar] [CrossRef] [PubMed]
- Gunderson, E.P.; Lewis, C.E.; Lin, Y.; Sorel, M.; Gross, M.; Sidney, S.; Jacobs, D.R., Jr.; Shikany, J.M.; Quesenberry, C.P., Jr. Lactation Duration and Progression to Diabetes in Women Across the Childbearing Years: The 30-Year CARDIA Study. JAMA Intern. Med. 2018, 178, 328–337. [Google Scholar] [CrossRef]
- Freibert, S.M.; Mannino, D.M.; Bush, H.; Crofford, L.J. The association of adverse pregnancy events and cardiovascular disease in women 50 years of age and older. J. Women’s Health 2011, 20, 287–293. [Google Scholar] [CrossRef] [PubMed]
- Sokup, A.; Ruszkowska, B.; Goralczyk, B.; Goralczyk, K.; Szymanski, M.; Grabiec, M.; Rość, D. Elevation of sE-Selectin Levels 2-24 Months following Gestational Diabetes Is Associated with Early Cardiometabolic Risk in Nondiabetic Women. Int. J. Endocrinol. 2012, 2012, 278050. [Google Scholar] [CrossRef] [PubMed][Green Version]
- McKenzie-Sampson, S.; Paradis, G.; Healy-Profitos, J.; St-Pierre, F.; Auger, N. Gestational diabetes and risk of cardiovascular disease up to 25 years after pregnancy: A retrospective cohort study. Acta Diabetol. 2018, 55, 315–322. [Google Scholar] [CrossRef] [PubMed]
- Kramer, C.K.; Swaminathan, B.; Hanley, A.J.; Connelly, P.W.; Sermer, M.; Zinman, B.; Retnakaran, R. Each degree of glucose intolerance in pregnancy predicts distinct trajectories of beta-cell function, insulin sensitivity, and glycemia in the first 3 years postpartum. Diabetes Care 2014, 37, 3262–3269. [Google Scholar] [CrossRef] [PubMed]
- Kramer, C.K.; Campbell, S.; Retnakaran, R. Gestational diabetes and the risk of cardiovascular disease in women: A systematic review and meta-analysis. Diabetologia 2019, 62, 905–914. [Google Scholar] [CrossRef] [PubMed]
- Benhalima, K.; Mathieu, C.; Damm, P.; Van Assche, A.; Devlieger, R.; Desoye, G.; Corcoy, R.; Mahmood, T.; Nizard, J.; Savona-Ventura, C.; et al. A proposal for the use of uniform diagnostic criteria for gestational diabetes in Europe: An opinion paper by the European Board & College of Obstetrics and Gynaecology (EBCOG). Diabetologia 2015, 58, 1422–1429. [Google Scholar] [PubMed]


© 2019 by the authors. Licensee MDPI, Basel, Switzerland. This article is an open access article distributed under the terms and conditions of the Creative Commons Attribution (CC BY) license (http://creativecommons.org/licenses/by/4.0/).