Multimodal Photoplethysmography-Based Approaches for Improved Detection of Hypertension

 , ,
, ,  , , , , , ,
  , ,
, ,
Abstract
:1. Introduction
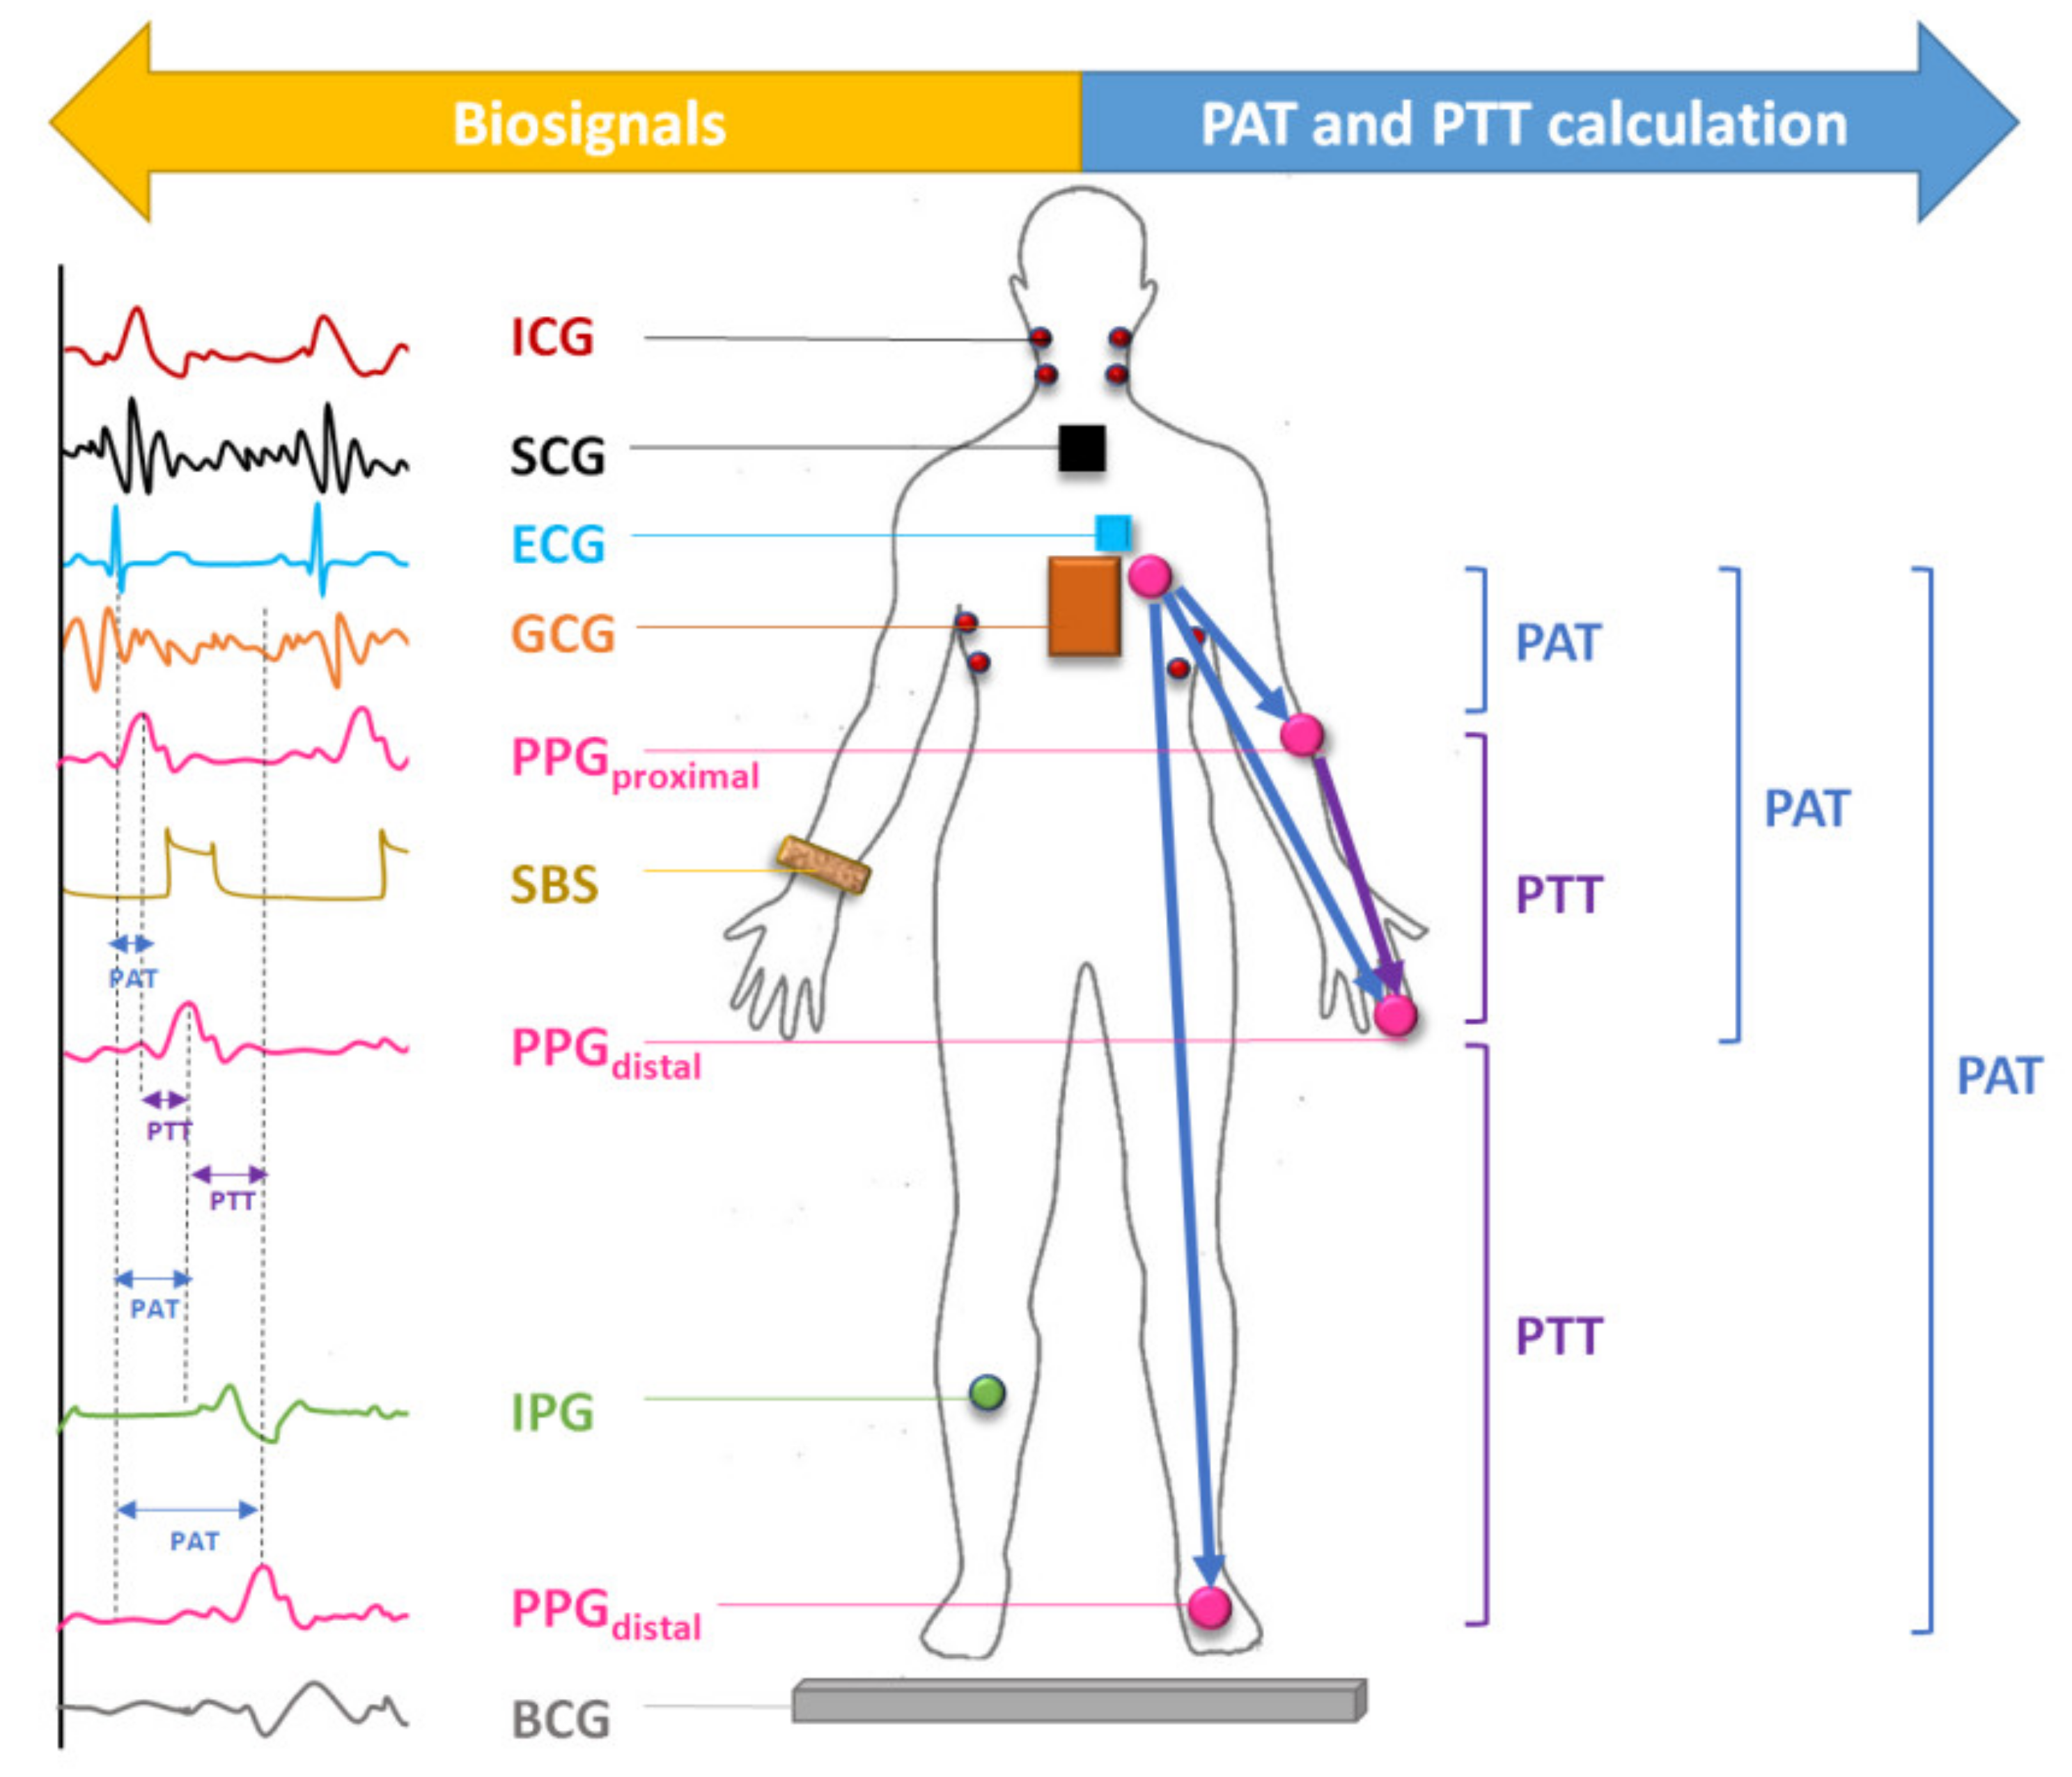
Combining Other Biosignals with PPG for BP Estimation
2. Methods
2.1. Literature Search
2.2. Statistical Analysis
3. Results
3.1. Global Distribution and Combinations of Biosignals Used in Literature
3.2. Sample Size and Patient Demographics
3.3. Appropriate Gold Standard
4. Discussion
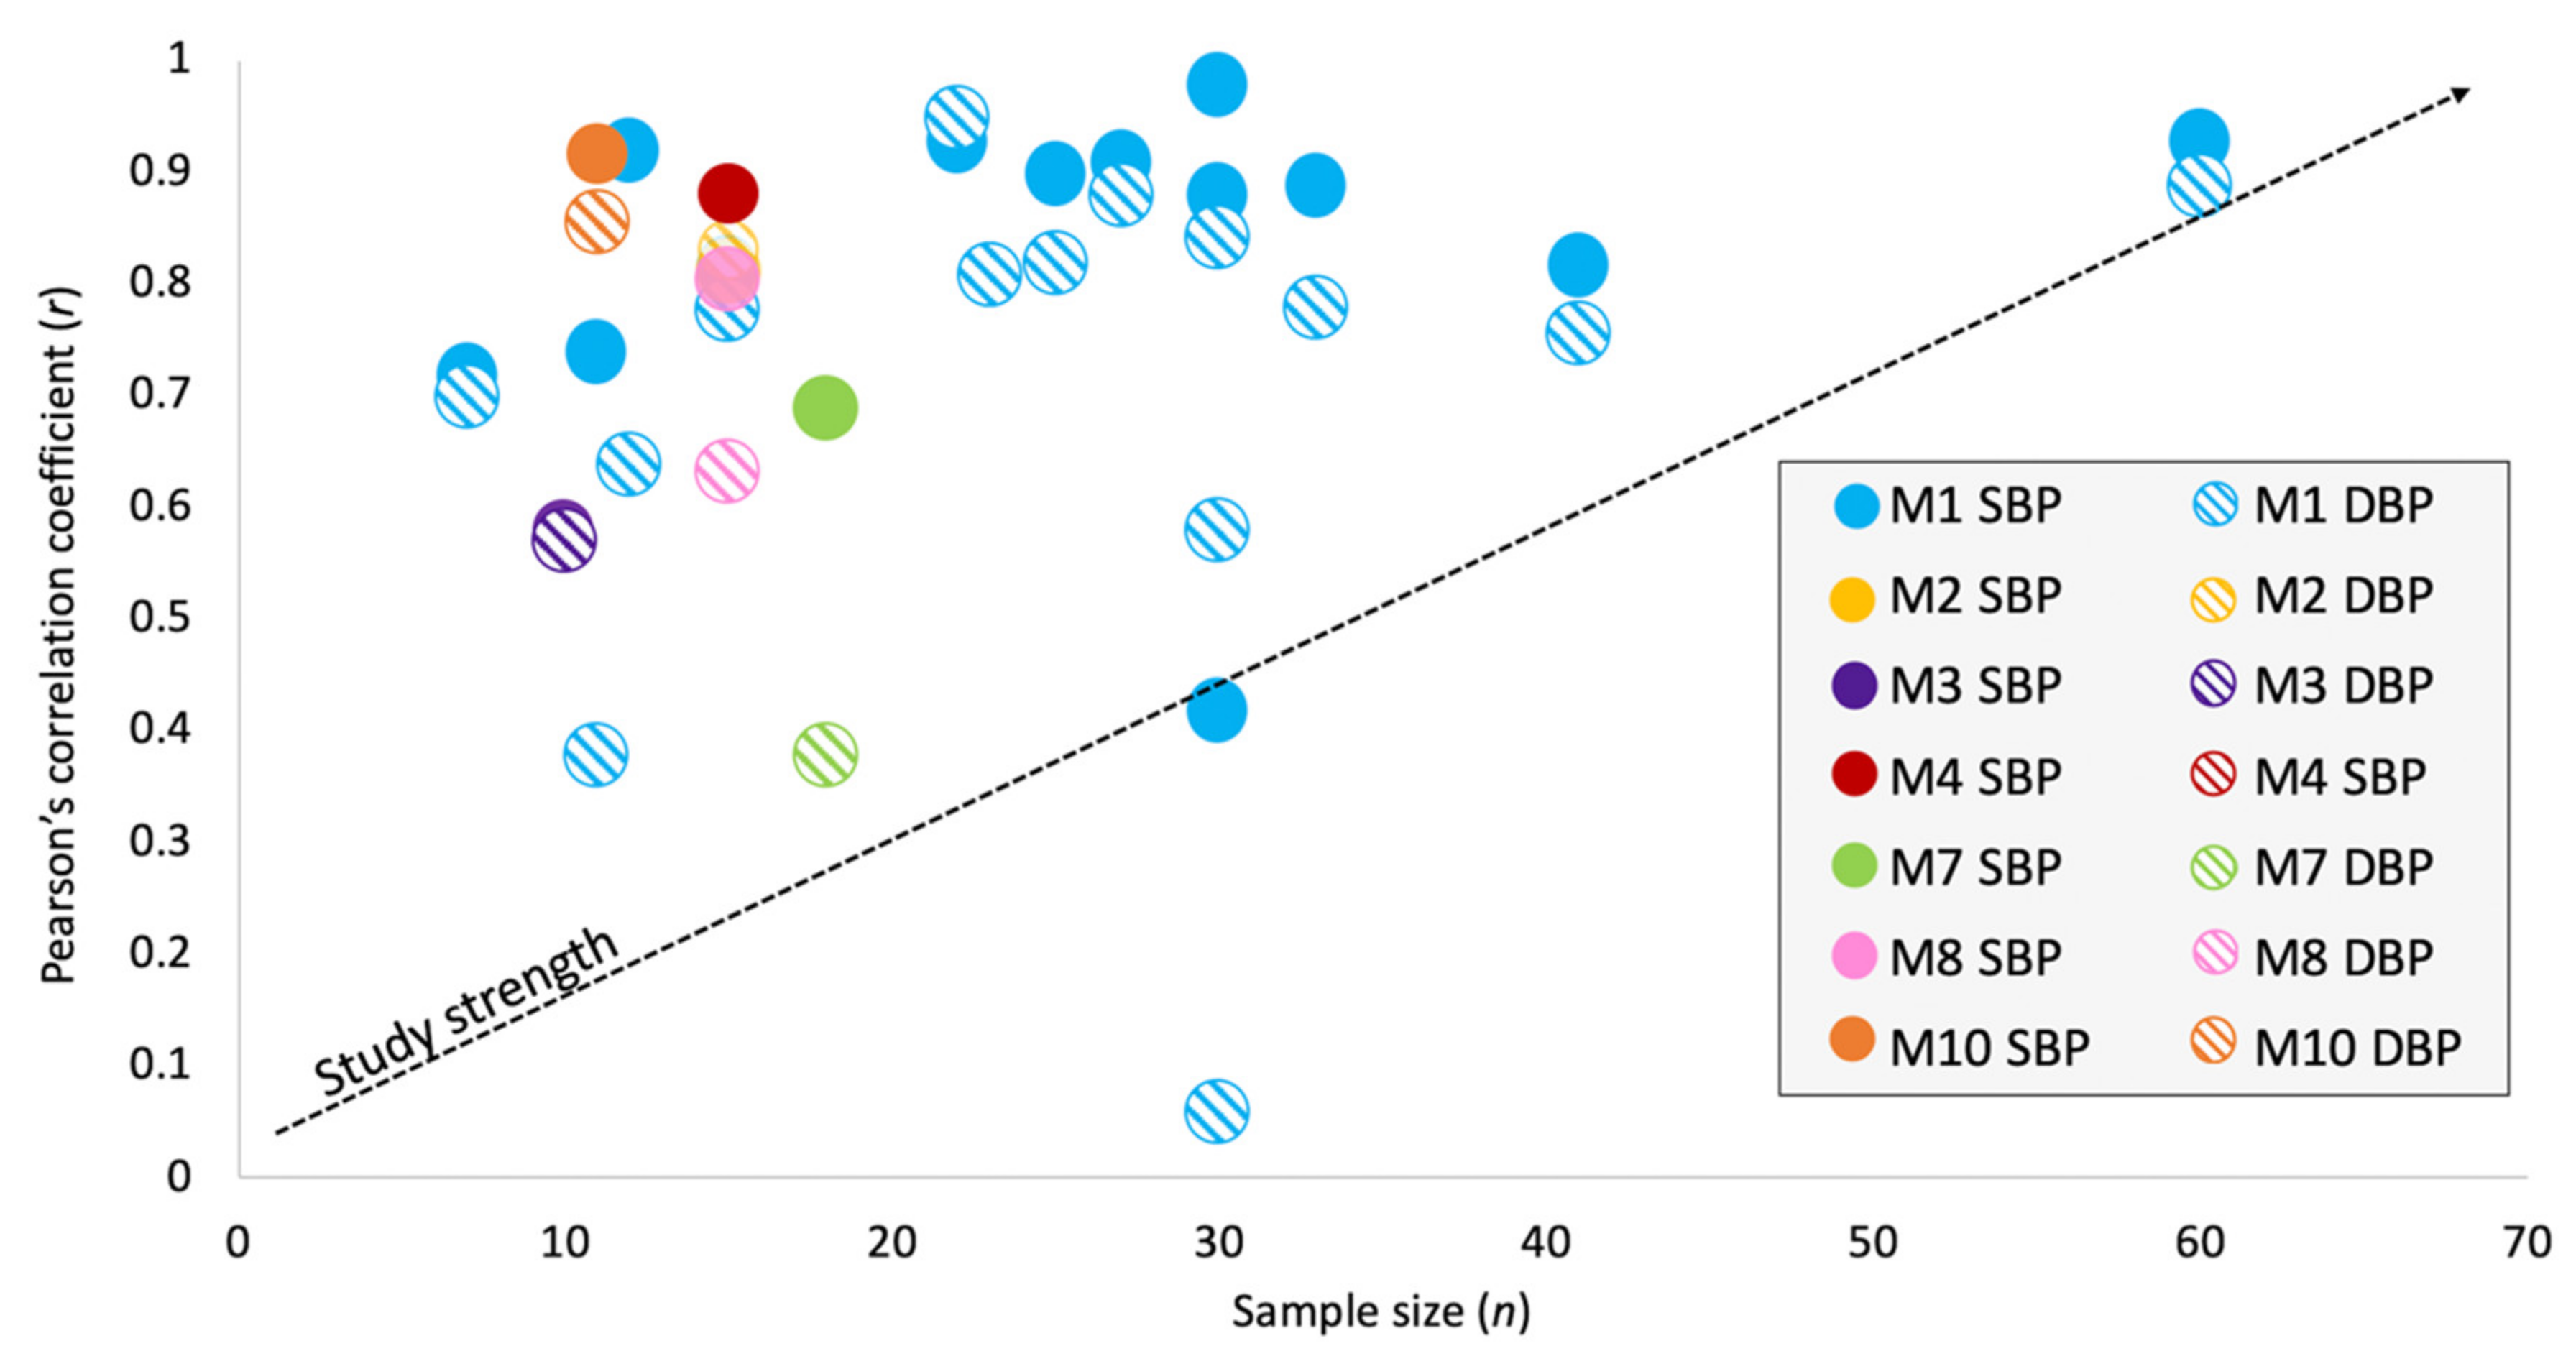
4.1. Accuracy of Proposed Methods
- Synchronization between biosignals. If biosignals are not collected at the same time, PTT cannot be determined accurately. Unfortunately, this point is overlooked and therefore, there is inconsistency in reporting accuracy using PAT [86].
- Calibration. Current PTT-BP estimations require calibration of PTT (ms) to BP (mmHg), which is dependent on several patient-specific factors: distance between measurement sites, average cross-sectional area of arteries between measurement sites, blood density, and the compliance of arteries [87]. As the composition of arteries changes with age (elastin in central arteries is replaced with collagen, which contributes to the atherosclerotic processes and stiffening of arteries), these techniques require subject specific calibration using a BP cuff at intervals in-line with atherosclerotic aging processes [87]. Mukkamala and Hahn [88] identified the maximum calibration interval to be about one year at age 30 with a linear decline to roughly six months by age 70. The need for calibration greatly limits the feasibility of these technologies, however new techniques such as those from Kachuee et al. [59] have eliminated the need for calibration using a machine learning approach. To avoid the calibration step (i.e., the step taken to map feature(s) values to mmHg), risk stratification could be used as an alternative output. In other words, build a model to classify PPG-based features into three classes: normotensive, pre-hypertensive, and hypertensive, rather than proving a specific mmHg value [9,10,80,89].
4.2. Reporting of Patient Demographics
4.3. Testing Conditions
4.4. Recommendations for Future Advancements
- −
- implementation of the IEEE guidelines for research regarding cuff-less BP devices, which includes information pertaining to observer training and measurement, validation procedures and appropriate gold standards, validation criteria, subject recruitment, and data reporting [93];
- −
- inclusion of hypertensive and pregnant populations with improved reporting of gender and health status;
- −
- appropriate definition and application of PAT and PTT that account for PEP to improve the measurement accuracy and decrease error;
- −
- continued research on wearable devices that tests subjects during various ambulation activities, especially research on noise- and calibration-reducing algorithms.
5. Conclusions
Author Contributions
Funding
Acknowledgments
Conflicts of Interest
Abbreviations
| BP | Blood pressure | M1 | Modality 1 (PPG + ECG) |
| PPG | Photoplethysmography | M2 | Modality 2 (PPG + BCG) |
| PTT | Pulse transit time | M3 | Modality 3 (PPG + SCG) |
| PAT | Pulse arrival time | M4 | Modality 4 (PPG + IPG) |
| PWV | Pulse wave velocity | M5 | Modality 5 (PPG + SBS) |
| PEP | Pre-ejection period | M6 | Modality 6 (PPG + ICG) |
| AO | Aortic opening | M7 | Modality 7 (PPG + ECG + ICG) |
| ECG | Electrocardiography | M8 | Modality 8 (PPG + ECG + BCG) |
| ICG | Impedance cardiography | M9 | Modality 9 (PPG + SCG + GCG) |
| BCG | Ballistocardiography | M10 | Modality 10 (PPG + ECG + SCG) |
| SCG | Seismocardiography | ME | Mean error |
| GCG | Gyrocardiography | SD | Standard deviation |
| IPG | Impedance plethysmography | MIMIC | Medical Information Mart for Intensive Care |
| SBS | Strain based sensor | AAMI | Association for the Advancement of Medical Instrumentation |
| MAP | Mean arterial pressure | HTN | Hypertension |
| SBP | Systolic blood pressure | NTN | Normotension |
| DBP | Diastolic blood pressure | ABP | Arterial invasive blood pressure |
| HR | Heart rate | CBP | Cuff blood pressure |
| PIR | PPG intensity ratio | FABP | Finger arterial blood pressure |
| HRPS | Heart-power spectrum ration | IEEE | Institute of Electrical and Electronics Engineers |
References
- Calvillo, L.; Gironacci, M.M.; Crotti, L.; Meroni, P.L.; Parati, G. Neuroimmune crosstalk in the pathophysiology of hypertension. Nat. Rev. Cardiol. 2019, 16, 476–490. [Google Scholar] [CrossRef]
- McCrindle, B.W. Assessment and management of hypertension in children and adolescents. Nat. Rev. Cardiol. 2010, 7, 155. [Google Scholar] [CrossRef] [PubMed]
- Nabeel, P.; Jayaraj, J.; Mohanasankar, S. Single-source PPG-based local pulse wave velocity measurement: A potential cuffless blood pressure estimation technique. Physiol. Meas. 2017, 38, 2122. [Google Scholar] [CrossRef] [PubMed]
- Elgendi, M.; Fletcher, R.; Liang, Y.; Howard, N.; Lovell, N.H.; Abbott, D.; Lim, K.; Ward, R. The use of photoplethysmography for assessing hypertension. NPJ Digit. Med. 2019, 2, 60. [Google Scholar] [CrossRef] [PubMed] [Green Version]
- Martin, S.L.O.; Carek, A.M.; Kim, C.-S.; Ashouri, H.; Inan, O.T.; Hahn, J.-O.; Mukkamala, R. Weighing Scale-Based Pulse Transit Time is a Superior Marker of Blood Pressure than Conventional Pulse Arrival Time. Sci. Rep. 2016, 6, 39273. [Google Scholar] [CrossRef]
- Chan, G.; Cooper, R.; Hosanee, M.; Welykholowa, K.; Kyriacou, P.A.; Zheng, D.; Allen, J.; Abbott, D.; Lovell, N.H.; Fletcher, R.; et al. Multi-Site Photoplethysmography Technology for Blood Pressure Assessment: Challenges and Recommendations. J. Clin. Med. 2019, 8, 1827. [Google Scholar] [CrossRef] [Green Version]
- Liu, J.; Yan, B.P.; Dai, W.X.; Ding, X.R.; Zhang, Y.T.; Zhao, N. Multi-wavelength photoplethysmography method for skin arterial pulse extraction. Biomed Opt. Express 2016, 7, 4313–4326. [Google Scholar] [CrossRef] [Green Version]
- Hosanee, M.; Chan, G.; Welykholowa, K.; Cooper, R.; Kyriacou, P.A.; Zheng, D.; Allen, J.; Abbott, D.; Menon, C.; Lovell, N.H. Cuffless Single-Site Photoplethysmography for Blood Pressure Monitoring. J. Clin. Med. 2020, 9, 723. [Google Scholar] [CrossRef] [Green Version]
- Martínez, G.; Howard, N.; Abbott, D.; Lim, K.; Ward, R.; Elgendi, M. Can Photoplethysmography Replace Arterial Blood Pressure in the Assessment of Blood Pressure? J. Clin. Med. 2018, 7, 316. [Google Scholar] [CrossRef] [Green Version]
- Liang, Y.; Chen, Z.; Ward, R.; Elgendi, M. Hypertension Assessment Using Photoplethysmography: A Risk Stratification Approach. J. Clin. Med. 2018, 8, 12. [Google Scholar] [CrossRef] [Green Version]
- Zhang, G.; Cottrell, A.C.; Henry, I.C.; McCombie, D.B. Assessment of pre-ejection period in ambulatory subjects using seismocardiogram in a wearable blood pressure monitor. In Proceedings of the 38th Annual International Conference of the IEEE Engineering in Medicine and Biology Society (EMBC), Orlando, FL, USA, 16–20 August 2016; pp. 3386–3389. [Google Scholar]
- Proença, J.; Muehlsteff, J.; Aubert, X.; Carvalho, P. Is pulse transit time a good indicator of blood pressure changes during short physical exercise in a young population? In Proceedings of the 2010 Annual International Conference of the IEEE Engineering in Medicine and Biology, Buenos Aires, Argentina, 31 August–4 September 2010; pp. 598–601. [Google Scholar]
- Wong, M.Y.; Pickwell-MacPherson, E.; Zhang, Y.T.; Cheng, J.C. The effects of pre-ejection period on post-exercise systolic blood pressure estimation using the pulse arrival time technique. Eur. J. Appl. Physiol. 2011, 111, 135–144. [Google Scholar] [CrossRef]
- Payne, R.; Symeonides, C.; Webb, D.; Maxwell, S. Pulse transit time measured from the ECG: An unreliable marker of beat-to-beat blood pressure. J. Appl. Physiol. 2006, 100, 136–141. [Google Scholar] [CrossRef] [PubMed] [Green Version]
- Kim, C.S.; Carek, A.M.; Mukkamala, R.; Inan, O.T.; Hahn, J.O. Ballistocardiogram as Proximal Timing Reference for Pulse Transit Time Measurement: Potential for Cuffless Blood Pressure Monitoring. IEEE Trans. Biomed. Eng. 2015, 62, 2657–2664. [Google Scholar] [CrossRef] [PubMed] [Green Version]
- Ding, X.R.; Zhang, Y.T. Photoplethysmogram intensity ratio: A potential indicator for improving the accuracy of PTT-based cuffless blood pressure estimation. In Proceedings of the Annual International Conference of the IEEE Engineering in Medicine and Biology Society, Milan, Italy, 25–29 August 2015; pp. 398–401. [Google Scholar]
- Yang, C.; Tavassolian, N. Pulse transit time measurement using seismocardiogram, photoplethysmogram, and acoustic recordings: Evaluation and comparison. IEEE J. Biomed. Health Inform. 2018, 22, 733–740. [Google Scholar] [CrossRef] [PubMed]
- Yang, C.; Dong, Y.; Chen, Y.; Tavassolian, N. A Low-cost, Smartphone-only Pulse Transit Time Measurement System Using Cardio-mechanical Signals and Optical Sensors. In Proceedings of the Annual International Conference of the IEEE Engineering in Medicine and Biology Society, Honolulu, HI, USA, 18–21 July 2018; pp. 1–4. [Google Scholar]
- Ibrahim, B.; Nathan, V.; Jafari, R. Exploration and validation of alternate sensing methods for wearable continuous pulse transit time measurement using optical and bioimpedance modalities. In Proceedings of the 39th Annual International Conference of the IEEE Engineering in Medicine and Biology Society (EMBC), Seogwipo, Korea, 11–15 July 2017; pp. 2051–2055. [Google Scholar]
- Huynh, T.H.; Jafari, R.; Chung, W.-Y. Noninvasive cuffless blood pressure estimation using pulse transit time and impedance plethysmography. IEEE Trans. Biomed. Eng. 2019, 66, 967–976. [Google Scholar] [CrossRef] [PubMed]
- Younessi Heravi, M.A.; Khalilzadeh, M.A.; Joharinia, S. Continuous and Cuffless Blood Pressure Monitoring Based on ECG and SpO2 Signals ByUsing Microsoft Visual C Sharp. J. Biomed. Phys. Eng. 2014, 4, 27–32. [Google Scholar]
- Ding, X.; Zhang Tsang, H.K. Impact of heart disease and calibration interval on accuracy of pulse transit time-based blood pressure estimation. Physiol. Meas. 2016, 37, 227–237. [Google Scholar] [CrossRef]
- Lee, J.; Sohn, J.; Park, J.; Yang, S.; Lee, S.; Kim, H.C. Novel blood pressure and pulse pressure estimation based on pulse transit time and stroke volume approximation. Biomed. Eng. Online 2018, 17, 81. [Google Scholar] [CrossRef] [Green Version]
- Association for the Advancement of Medical Instrumentation. International Standard: Non-Invasive Sphygmomanometers; ANSI/AAMI/ISO 81060-2: 2013 (E); Association for the Advancement of Medical Instrumentation: Arlington, VA, USA, 2013. [Google Scholar]
- Baek, H.J.; Kim, K.K.; Kim, J.S.; Lee, B.; Park, K.S. Enhancing the estimation of blood pressure using pulse arrival time and two confounding factors. Physiol. Meas. 2010, 31, 145–157. [Google Scholar] [CrossRef]
- Chua, E.C.-P.; Redmond, S.J.; McDarby, G.; Heneghan, C. Towards Using Photo-Plethysmogram Amplitude to Measure Blood Pressure During Sleep. Ann. Biomed. Eng. 2010, 38, 945–954. [Google Scholar] [CrossRef]
- Mase, M.; Mattei, W.; Cucino, R.; Faes, L.; Nollo, G. Feasibility of cuff-free measurement of systolic and diastolic arterial blood pressure. J. Electrocardiol. 2011, 44, 201–207. [Google Scholar] [CrossRef]
- Gesche, H.; Grosskurth, D.; Kuchler, G.; Patzak, A. Continuous blood pressure measurement by using the pulse transit time: Comparison to a cuff-based method. Eur. J. Appl. Physiol. 2012, 112, 309–315. [Google Scholar] [CrossRef]
- Kato, Y.; Nambu, M.; Imura, M.; Kuroda, Y.; Oshiro, O. Smart sensing of cardiovascular physiological information from soles without direct skin contact. In Proceedings of the Annual Conference of the IEE Engineering in Medicine and Biology Society, San Diego, CA, USA, 28 August–1 September 2012; pp. 5806–5809. [Google Scholar]
- Baek, H.J.; Chung, G.S.; Kim, K.K.; Park, K.S. A smart health monitoring chair for nonintrusive measurement of biological signals. IEEE Trans. Inf. Technol. Biomed. 2012, 16, 150–158. [Google Scholar] [CrossRef] [PubMed]
- Kim, S.H.; Song, J.G.; Park, J.H.; Kim, J.W.; Park, Y.S.; Hwang, G.S. Beat-to-beat tracking of systolic blood pressure using noninvasive pulse transit time during anesthesia induction in hypertensive patients. Anesth. Analg. 2013, 116, 94–100. [Google Scholar] [CrossRef] [PubMed]
- Spießhöfer, J.; Heinrich, J.; Bitter, T.; Efken, C.; Lehmann, R.; Eckert, S.; Horstkotte, D.; Oldenburg, O. Validation of blood pressure monitoring using pulse transit time in heart failure patients with Cheyne-Stokes respiration undergoing adaptive servoventilation therapy. Sleep Breath. 2013, 18, 411–421. [Google Scholar] [CrossRef] [PubMed]
- Chen, Z.; Yang, X.; Teo, J.T.; Ng, S.H. Noninvasive monitoring of blood pressure using optical Ballistocardiography and Photoplethysmograph approaches. In Proceedings of the Annual International Conference of the IEE Engineering in Medicine and Biology Society, Osaka, Japan, 3–7 July 2013; pp. 2425–2428. [Google Scholar]
- Puke, S.; Suzuki, T.; Nakayama, K.; Tanaka, H.; Minami, S. Blood pressure estimation from pulse wave velocity measured on the chest. In Proceedings of the Annual International Conference of the IEEE Engineering in Medicine and Biology Society, Osaka, Japan, 3–7 July 2013; pp. 6107–6110. [Google Scholar]
- Couceiro, R.; Carvalho, P.; Paiva, R.P.; Muehlsteff, J.; Henriques, J.; Schulze, V.; Ritz, A.; Kelm, M.; Meyer, C. Characterization of surrogate parameters for blood pressure regulation in neurally-mediated syncope. In Proceedings of the Annual International Conference of the IEEE Engineering in Medicine and Biology Society, Osaka, Japan, 3–7 July 2013; pp. 5381–5385. [Google Scholar]
- Sola, J.; Proenca, M.; Ferrario, D.; Porchet, J.A.; Falhi, A.; Grossenbacher, O.; Allemann, Y.; Rimoldi, S.F.; Sartori, C. Noninvasive and Nonocclusive Blood Pressure Estimation Via a Chest Sensor. IEEE Trans. Biomed. Eng. 2013, 60, 3505–3513. [Google Scholar] [CrossRef] [Green Version]
- Jeong, I.; Finkelstein, J. Optimizing non-invasive blood pressure estimation using pulse transit time. Stud. Health Technol. Inform. 2013, 192, 1198. [Google Scholar]
- Wang, R.; Jia, W.; Mao, Z.-H.; Sclabassi, R.J.; Sun, M. Cuff-free blood pressure estimation using pulse transit time and heart rate. In Proceedings of the 12th International Conference on Signal Processing (ICSP), Hangzhou, China, 19–23 October 2014; pp. 115–118. [Google Scholar]
- Thomas, S.S.; Nathan, V.; Zong, C.; Akinbola, E.; Aroul, A.L.P.; Philipose, L.; Soundarapandian, K.; Shi, X.; Jafari, R. BioWatch—A wrist watch based signal acquisition system for physiological signals including blood pressure. In Proceedings of the 36th Annual International Conference of the IEEE Engineering in Medicine and Biology Society, Chicago, IL, USA, 26–30 August 2014; pp. 2286–2289. [Google Scholar]
- Ma, H.T. A blood pressure monitoring method for stroke management. BioMed Res. Int. 2014, 2014, 571623. [Google Scholar] [CrossRef] [Green Version]
- Zhang, G.; McCombie, S.A.; Greenstein, R.; McCombie, D.B. Assessing the challenges of a pulse wave velocity based blood pressure measurement in surgical patients. In Proceedings of the Annual International Conference of the IEEE Engineering in Medicine and Biology Society, Chicago, IL, USA, 26–30 August 2014; pp. 574–577. [Google Scholar]
- Vlahandonis, A.; Biggs, S.N.; Nixon, G.M.; Davey, M.J.; Walter, L.M.; Horne, R.S. Pulse transit time as a surrogate measure of changes in systolic arterial pressure in children during sleep. J. Sleep Res. 2014, 23, 406–413. [Google Scholar] [CrossRef] [Green Version]
- Gomez Garcia, M.T.; Troncoso Acevedo, M.F.; Rodriguez Guzman, M.; Alegre de Montaner, R.; Fernandez Fernandez, B.; del Rio Camacho, G.; Gonzalez-Mangado, N. Can pulse transit time be useful for detecting hypertension in patients in a sleep unit? Archivos De Bronconeumologia 2014, 50, 278–284. [Google Scholar] [CrossRef]
- Wibmer, T.; Doering, K.; Kropf-Sanchen, C.; Rudiger, S.; Blanta, I.; Stoiber, K.M.; Rottbauer, W.; Schumann, C. Pulse transit time and blood pressure during cardiopulmonary exercise tests. Physiol. Res. 2014, 63, 287–296. [Google Scholar]
- Zheng, Y.L.; Yan, B.P.; Zhang, Y.T.; Poon, C.C. An armband wearable device for overnight and cuff-less blood pressure measurement. IEEE Trans. Biomed. Eng. 2014, 61, 2179–2186. [Google Scholar] [CrossRef] [PubMed]
- Liu, Q.; Yan, B.P.; Yu, C.M.; Zhang, Y.T.; Poon, C.C. Attenuation of systolic blood pressure and pulse transit time hysteresis during exercise and recovery in cardiovascular patients. IEEE Trans. Biomed. Eng. 2014, 61, 346–352. [Google Scholar] [PubMed]
- Liu, J.; Li, Y.; Ding, X.R.; Dai, W.X.; Zhang, Y.T. Effects of cuff inflation and deflation on pulse transit time measured from ECG and multi-wavelength PPG. In Proceedings of the Annual International Conference of the IEEE Engineering in Medicine and Biology Society, Milan, Italy, 25–29 August 2015; pp. 5973–5976. [Google Scholar]
- Tang, Z.; Sekine, M.; Tamura, T.; Yoshida, M.; Chen, W. A chair for cuffless real-time estimation of systolic blood pressure based on pulse transit time. In Proceedings of the Annual International Conference of the IEEE Engineering in Medicine and Biology Society, Milan, Italy, 25–29 August 2015; pp. 5118–5121. [Google Scholar]
- Tamura, T.; Sekine, M.; Zunyi, T.; Yoshida, M.; Takeuchi, Y.; Imai, M. Preliminary study of a new home healthcare monitoring to prevent the recurrence of stroke. In Proceedings of the Annual International Conference of the IEEE Engineering in Medicine and Biology Society, Milan, Italy, 25–29 August 2015; pp. 5489–5492. [Google Scholar]
- Wibmer, T.; Denner, C.; Fischer, C.; Schildge, B.; Rudiger, S.; Kropf-Sanchen, C.; Rottbauer, W.; Schumann, C. Blood pressure monitoring during exercise: Comparison of pulse transit time and volume clamp methods. Blood Press. 2015, 24, 353–360. [Google Scholar] [CrossRef] [PubMed]
- Ding, X.R.; Zhang, Y.T.; Liu, J.; Dai, W.X.; Tsang, H.K. Continuous Cuffless Blood Pressure Estimation Using Pulse Transit Time and Photoplethysmogram Intensity Ratio. IEEE Trans. Biomed. Eng. 2016, 63, 964–972. [Google Scholar] [CrossRef] [PubMed]
- Thomas, S.S.; Nathan, V.; Zong, C.; Soundarapandian, K.; Shi, X.; Jafari, R. BioWatch: A noninvasive wrist-based blood pressure monitor that incorporates training techniques for posture and subject variability. IEEE J. Biomed. Health Inform. 2016, 20, 1291–1300. [Google Scholar] [CrossRef]
- Sun, S.; Bezemer, R.; Long, X.; Muehlsteff, J.; Aarts, R. Systolic blood pressure estimation using PPG and ECG during physical exercise. Physiol. Meas. 2016, 37, 2154. [Google Scholar] [CrossRef]
- Dai, W.-X.; Zhang, Y.-T.; Liu, J.; Ding, X.-R.; Zhao, N. Dual-modality arterial pulse monitoring system for continuous blood pressure measurement. In Proceedings of the 38th Annual International Conference of the IEEE Engineering in Medicine and Biology Society (EMBC), Orlando, FL, USA, 16–20 August 2016; pp. 5773–5776. [Google Scholar]
- Shahrbabaki, S.S.; Ahmed, B.; Penzel, T.; Cvetkovic, D. Photoplethysmography derivatives and pulse transit time in overnight blood pressure monitoring. In Proceedings of the 38th Annual International Conference of the IEEE Engineering in Medicine and Biology Society (EMBC), Orlando, FL, USA, 16–20 August 2016; pp. 2855–2858. [Google Scholar]
- Gholamhosseini, H.; Meintjes, A.; Baig, M.M.; Lindén, M. Smartphone-based Continuous Blood Pressure Measurement Using Pulse Transit Time. In Studies in Health Technology and Informatics; IOS Press: Amsterdam, The Netherlands, 2016; Volume 224, pp. 84–89. [Google Scholar]
- Schoot, T.S.; Weenk, M.; van de Belt, T.H.; Engelen, L.J.; van Goor, H.; Bredie, S.J. A new cuffless device for measuring blood pressure: A real-life validation study. J. Med. Internet Res. 2016, 18, e85. [Google Scholar] [CrossRef]
- Jain, M.; Kumar, N.; Deb, S. An affordable cuff-less blood pressure estimation solution. In Proceedings of the 38th Annual International Conference of the IEEE Engineering in Medicine and Biology Society (EMBC), Orlando, FL, USA, 16–20 August 2016; pp. 5294–5297. [Google Scholar]
- Kachuee, M.; Kiani, M.M.; Mohammadzade, H.; Shabany, M. Cuffless blood pressure estimation algorithms for continuous health-care monitoring. IEEE Trans. Biomed. Eng. 2016, 64, 859–869. [Google Scholar] [CrossRef]
- Tang, Z.; Tamura, T.; Sekine, M.; Huang, M.; Chen, W.; Yoshida, M.; Sakatani, K.; Kobayashi, H.; Kanaya, S. A Chair–Based Unobtrusive Cuffless Blood Pressure Monitoring System Based on Pulse Arrival Time. IEEE J. Biomed. Health Inform. 2017, 21, 1194–1205. [Google Scholar] [CrossRef]
- Seeberg, T.M.; Orr, J.G.; Opsahl, H.; Austad, H.; Røed, M.H.; Dalgard, S.H.; Houghton, D.; Jones, D.E.; Strisland, F. A Novel Method for Continuous, Noninvasive, Cuff-Less Measurement of Blood Pressure: Evaluation in Patients With Nonalcoholic Fatty Liver Disease. IEEE Trans. Biomed. Eng. 2017, 64, 1469–1478. [Google Scholar] [CrossRef] [PubMed] [Green Version]
- Janjua, G.; Guldenring, D.; Finlay, D.; McLaughlin, J. Wireless chest wearable vital sign monitoring platform for hypertension. In Proceedings of the 39th Annual International Conference of the IEEE Engineering in Medicine and Biology Society (EMBC), Seogwipo, Korea, 11–15 July 2017; pp. 821–824. [Google Scholar]
- Liu, S.-H.; Cheng, D.-C.; Su, C.-H. A Cuffless Blood Pressure Measurement Based on the Impedance Plethysmography Technique. Sensors 2017, 17, 1176. [Google Scholar] [CrossRef] [PubMed] [Green Version]
- Chen, Y.; Cheng, S.; Wang, T.; Ma, T. Novel blood pressure estimation method using single photoplethysmography feature. In Proceedings of the 39th Annual International Conference of the IEEE Engineering in Medicine and Biology Society (EMBC), Seowipo, Korea, 11–15 July 2017; pp. 1712–1715. [Google Scholar]
- Ahmaniemi, T.; Rajala, S.; Lindholm, H.; Taipalus, T. Pulse arrival time measurement with coffee provocation. In Proceedings of the 39th Annual International Conference of the IEEE Engineering in Medicine and Biology Society (EMBC), Seogwipo, Korea, 11–15 July 2017; pp. 254–257. [Google Scholar]
- Zhang, Q.; Zhou, D.; Zeng, X. Highly wearable cuff-less blood pressure and heart rate monitoring with single-arm electrocardiogram and photoplethysmogram signals. Biomed. Eng. Online 2017, 16, 23. [Google Scholar] [CrossRef] [PubMed] [Green Version]
- Lin, W.; Wang, H.; Samuel, O.W.; Li, G. Using a new PPG indicator to increase the accuracy of PTT-based continuous cuffless blood pressure estimation. In Proceedings of the 39th Annual International Conference of the IEEE Engineering in Medicine and Biology Society (EMBC), Seogwipo, Korea, 11–15 July 2017; pp. 738–741. [Google Scholar]
- Bhattacharya, T.; Gupta, A.; Singh, S.T.; Roy, S.; Prasad, A. Robust motion artefact resistant circuit for calculation of Mean Arterial Pressure from pulse transit time. In Proceedings of the 39th Annual International Conference of the IEEE Engineering in Medicine and Biology Society (EMBC), Seogwipo, Korea, 11–15 July 2017; pp. 3553–3556. [Google Scholar]
- Ding, X.; Yan, B.P.; Zhang, Y.-T.; Liu, J.; Zhao, N.; Tsang, H.K. Pulse transit time based continuous cuffless blood pressure estimation: A new extension and a comprehensive evaluation. Sci. Rep. 2017, 7, 11554. [Google Scholar] [CrossRef] [PubMed]
- Pflugradt, M.; Geissdoerfer, K.; Goernig, M.; Orglmeister, R. A Fast Multimodal Ectopic Beat Detection Method Applied for Blood Pressure Estimation Based on Pulse Wave Velocity Measurements in Wearable Sensors. Sensors 2017, 17. [Google Scholar] [CrossRef] [Green Version]
- Ding, X.-R.; Yan, B.P.; Yuan-Ting, Z.; Jing, L.; Peng, S.; Ni, Z. Coherence analysis of invasive blood pressure and its noninvasive indicators for improvement of cuffless measurement accuracy. In Proceedings of the Annual International Conference of the IEEE Engineering in Medicine and Biology Society, Seogwipo, Korea, 11–15 July 2017; pp. 2255–2258. [Google Scholar]
- Xu, J.; Jiang, J.; Zhou, H.; Yan, Z. A novel Blood Pressure estimation method combing Pulse Wave Transit Time model and neural network model. In Proceedings of the Annual International Conference of the IEEE Engineering and Biology Society, Seogwipo, Korea, 11–15 July 2017; pp. 2130–2133. [Google Scholar]
- Lo, F.P.; Li, C.X.; Jiankun, W.; Jiyu, C.; Meng, M.Q. Continuous systolic and diastolic blood pressure estimation utilizing long short-term memory network. In Proceedings of the Annual International Conference of the IEEE Engineering in Medicine and Biology Society, Seogwipo, Korea, 11–15 July 2017; pp. 1853–1856. [Google Scholar]
- Rajala, S.; Lindholm, H.; Taipalus, T. Comparison of photoplethysmogram measured from wrist and finger and the effect of measurement location on pulse arrival time. Physiol. Meas. 2018, 39, 075010. [Google Scholar] [CrossRef]
- Wang, Y.-J.; Chen, C.-H.; Sue, C.-Y.; Lu, W.-H.; Chiou, Y.-H. Estimation of Blood Pressure in the Radial Artery Using Strain-Based Pulse Wave and Photoplethysmography Sensors. Micromachines 2018, 9, 556. [Google Scholar] [CrossRef] [Green Version]
- Lin, W.-H.; Wang, H.; Samuel, O.W.; Liu, G.; Huang, Z.; Li, G. New photoplethysmogram indicators for improving cuffless and continuous blood pressure estimation accuracy. Physiol. Meas. 2018, 39, 025005. [Google Scholar] [CrossRef]
- Kim, H.; Park, Y.; Ko, Y.; Mun, Y.; Lee, S.; Ko, H. Biosignal integrated circuit with simultaneous acquisition of ECG and PPG for wearable healthcare applications. Technol. Health Care 2018, 26, 3–9. [Google Scholar] [CrossRef]
- Sharifi, I.; Goudarzi, S.; Khodabakhshi, M.B. A novel dynamical approach in continuous cuffless blood pressure estimation based on ECG and PPG signals. Artif. Intell. Med. 2018, 97, 143–151. [Google Scholar] [CrossRef]
- Ahmaniemi, T.; Rajala, S.; Lindholm, H.; Taipalus, T.; Müller, K. Variations of Heart Rate, Pulse Arrival Time and Blood Pressure in a Versatile Laboratory Protocol. In Proceedings of the 40th Annual International Conference of the IEEE Engineering in Medicine and Biology Society (EMBC), Honolulu, HI, USA, 18–21 July 2018; pp. 2772–2775. [Google Scholar]
- Liang, Y.; Chen, Z.; Ward, R.; Elgendi, M. Hypertension assessment via ECG and PPG signals: An evaluation using MIMIC database. Diagnostics 2018, 8, 65. [Google Scholar] [CrossRef] [PubMed] [Green Version]
- Xu, Y.; Ping, P.; Wang, D.; Zhang, W. Analysis for the Influence of ABR Sensitivity on PTT-Based Cuff-Less Blood Pressure Estimation before and after Exercise. J. Healthc. Eng. 2018, 2018. [Google Scholar] [CrossRef] [PubMed]
- Chen, Y.; Shi, S.; Liu, Y.-K.; Huang, S.-L.; Ma, T. Cuffless blood-pressure estimation method using a heart-rate variability-derived parameter. Physiol. Meas. 2018, 39, 095002. [Google Scholar] [CrossRef] [PubMed]
- Feng, J.; Huang, Z.; Zhou, C.; Ye, X. Study of continuous blood pressure estimation based on pulse transit time, heart rate and photoplethysmography-derived hemodynamic covariates. Australas. Phys. Eng. Sci. Med. 2018, 41, 403–413. [Google Scholar] [CrossRef] [PubMed]
- Lillie, J.S.; Liberson, A.S.; Borkholder, D.A. Improved Blood Pressure Prediction Using Systolic Flow Correction of Pulse Wave Velocity. Cardiovasc. Eng. Technol. 2016, 7, 439–447. [Google Scholar] [CrossRef]
- Pickering, T.G. What will replace the mercury sphygmomanometer? Blood Press. Monit. 2003, 8, 23–25. [Google Scholar] [CrossRef]
- Liang, Y.; Abbott, D.; Howard, N.; Lim, K.; Ward, R.; Elgendi, M. How effective is pulse arrival time for evaluating blood pressure? Challenges and recommendations from a study using the MIMIC database. J. Clin. Med. 2019, 8, 337. [Google Scholar] [CrossRef] [Green Version]
- Mukkamala, R.; Hahn, J.-O.; Inan, O.T.; Mestha, L.K.; Kim, C.-S.; Töreyin, H.; Kyal, S. Toward ubiquitous blood pressure monitoring via pulse transit time: Theory and practice. IEEE Trans. Biomed. Eng. 2015, 62, 1879–1901. [Google Scholar] [CrossRef] [Green Version]
- Mukkamala, R.; Hahn, J.-O. Toward ubiquitous blood pressure monitoring via pulse transit time: Predictions on maximum calibration period and acceptable error limits. IEEE Trans. Biomed. Eng. 2017, 65, 1410–1420. [Google Scholar] [CrossRef]
- Liang, Y.; Chen, Z.; Ward, R.; Elgendi, M. Photoplethysmography and Deep Learning: Enhancing Hypertension Risk Stratification. Biosensors 2018, 8, 101. [Google Scholar] [CrossRef] [Green Version]
- Liang, Y.; Elgendi, M.; Chen, Z.; Ward, R. An optimal filter for short photoplethysmogram signals. Sci. Data 2018, 5, 180076. [Google Scholar] [CrossRef] [PubMed]
- Waugh, W.; Allen, J.; Wightman, J.; Sims, A.J.; Beale, T.A. Novel signal noise reduction method through cluster analysis, applied to photoplethysmography. Comput. Math. Methods Med. 2018, 2018. [Google Scholar] [CrossRef] [PubMed] [Green Version]
- Elgendi, M. Optimal Signal Quality Index for Photoplethysmogram Signals. Bioengineering 2016, 3, 21. [Google Scholar] [CrossRef] [PubMed] [Green Version]
- IEEE Standard Association. IEEE Standard for Wearable Cuffless Blood Pressure Measuring Devices. IEEE Std. 2014, 1–38, 1708–2014. [Google Scholar] [CrossRef]


| Publication | # Subjects (M:F) | BP Status | Comorbidities | Gold Standard | Modality Category | ME ± SD (mmHg) | Pearson’s Coefficient (r) |
|---|---|---|---|---|---|---|---|
| Baek et al. (2010) [25] | 15 (11:4) | NTN | Yes | ABP, FABP | M1 | SBP = N/R DBP = N/R | SBP = 0.815 DBP = 0.779 |
| Chua et al. (2010) [26] | 18 (14:4) | NTN | No | FABP | M1 | SBP = N/R DBP = N/R | SBP = 0.73 DBP = N/R |
| Proença et al. (2010) [12] | 20 (14:6) | NTN | No | FABP | M7 | SBP = N/R DBP = N/R | SBP = N/R DBP = N/R |
| Wong et al. (2011) [13] | 22 (14:8) | NTN | No | ABP | M7 | SBP = N/R DBP = N/R | SBP = N/R DBP = N/R |
| Mase et al. (2011) [27] | 33 (19:14) | NTN, HTN | Yes | CBP | MI | SBP = N/R DBP = N/R | SBP = 0.89 DBP = 0.78 |
| Gesche et al. (2012) [28] | 63 (36:27) | NTN | No | CBP | M1 | SBP = N/R DBP = N/R | SBP = 0.83 DBP = N/R |
| Kato et al. (2012) [29] | 1 (1:0) | NTN | No | CBP | M8 | SBP = N/R DBP = N/R | SBP = 0.805 DBP = 0.633 |
| Baek et al. (2012) [30] | 5 (5:0) | NTN | No | FABP | M1 | SBP = N/R DBP = N/R | SBP = 0.848 DBP = N/R |
| Kim et al. (2013) [31] | 23 (17:6) | HTN | Yes | ABP | M1 | SBP = N/R DBP = N/R | SBP = 0.81 DBP = 0.81 |
| Spießhöfer et al. (2013) [32] | 29 (27:2) | N/R | Yes | CBP | M1 | SBP = N/R DBP = N/R | SBP = N/R DBP = N/R |
| Chen et al. (2013) [33] | 5 (N/R) | NTN | No | CBP | M2 | SBP = 9.0 ± 5.6 DBP = 1.8 ± 1.3 | SBP = N/R DBP = N/R |
| Puke et al. (2013) [34] | 4 (3:1) | N/R | N/R | CBP | M1 | SBP = 6.91 ± 4.23 DBP = N/R | SBP = N/R DBP = N/R |
| Couceiro et al. (2013) [35] | 43 (23:20) | N/R | Yes | FABP | M7 | SBP = N/R DBP = N/R | SBP = N/R DBP = N/R |
| Solà et al. (2013) [36] | 15 (15:0) | NTN | No | CBP | M7 | SBP = N/R DBP = N/R | SBP = N/R DBP = N/R |
| Jeong & Finkelstein (2013) [37] | 5 (2:3) | NTN | No | CBP | M1 | SBP = N/R DBP = N/R | SBP = N/R DBP = N/R |
| Wang et al. (2014)[38] | 6 (N/R) | N/R | N/R | CBP | M1 | SBP = 0.04 ± 3.78 DBP = −0.01 ± 4.34 | SBP = N/R DBP = N/R |
| Thomas et al. (2014) [39] | 4 (N/R) | N/R | N/R | CBP | M1 | SBP = N/R DBP = N/R | SBP = N/R DBP = N/R |
| Ma, HT (2014) [40] | 30 (N/R) | NTN | No | CBP | M1 | SBP = N/R DBP = N/R | SBP R2 = 0.96 DBP R2 = 0.71 |
| Zhang et al. (2014) [41] | 2 (N/R) | N/R | Yes | ABP | M1 | SBP = N/R DBP = N/R | SBP = N/R DBP = N/R |
| Vlahandonis et al. (2014) [42] | 25 (12:18) | NTN | Yes | CBP | M1 | SBP = N/R DBP = N/R | SBP = N/R DBP = N/R |
| Younessi heravi et al. (2014) [21] | 25 (15:10) | N/R | N/R | CBP | M1 | SBP = 6.73 ± 2.68 DBP = 8.13 ± 3.18 | SBP = 0.89 DBP = 0.82 |
| Gomez Garcia et al. (2014) [43] | 30 (20:10) | NTN, HTN | Yes | CBP | M1 | SBP = −0.2 ± 2.4 DBP = N/R | SBP = 0.88 DBP = 0.58 |
| Wibmer et al. (2014) [44] | 20 (14:6) | NTN, HTN | Yes | CBP | M1 | SBP = N/R DBP = N/R | SBP R2 = 0.92 DBP R2 = 0.46 |
| Zheng et al. (2014) [45] | 10 (N/R) | NTN | No | CBP | M1 | SBP = 2.8 ± 8.2 DBP = N/R | SBP = N/R DBP = N/R |
| Liu et al. (2014) [46] | 46 (34:7) | NTN, HTN | Yes | CBP, FABP | M1 | SBP = N/R DBP = N/R | SBP = N/R DBP = N/R |
| Liu et al. (2015) [47] | 10 (6:4) | NTN | No | CBP | M1 | SBP = N/R DBP = N/R | SBP = N/R DBP = N/R |
| Tang et al. (2015) [48] | 9 (9:0) | NTN | No | CBP, FABP | M1 | SBP = N/R DBP = N/R | SBP = N/R DBP = N/R |
| Ding & Zhang (2015) [16] | 5 (N/R) | NTN | No | FABP | M1 + PIR | SBP = N/R DBP = N/R | SBP = N/R DBP = N/R |
| Tamura et al. (2015) [49] | 9 (9:0) | NTN | No | FABP | M1 | 0.7 ± 3.65 (Unclear if SBP or DBP) | SBP = N/R DBP = N/R |
| Kim et al. (2015) [15] | 15 (10:5) | NTN | No | PAT | M2 | SBP = N/R DBP = N/R | SBP = 0.81 DBP = 0.83 |
| Wibmer et al. (2015) [50] | 18 (11:7) | NTN, HTN | Yes | CBP | M1 | SBP = N/R DBP = N/R | SBP = 0.93 DBP = N/R |
| Ding et al. (2016)[51] | 27 (14:13) | NTN | No | FABP | M1 + PIR | SBP = −0.037 ± 5.21 DBP = −0.08 ± 4.06 | SBP = 0.91 DBP = 0.88 |
| Thomas et al. (2016) [52] | 11 (N/R) | NTN | No | CBP | M1 | SBP = N/R DBP = N/R | SBP = 0.72 DBP = 0.70 |
| Sun et al. (2016) [53] | 19 (14:5) | N/R | No | FABP | M1 | SBP = 0.43 ± 13.52 DBP = N/R | SBP = 0.93 DBP = N/R |
| Ding et al. (2016) [22] | 85 (37:48) | NTN, HTN | Yes | CBP | M1 | SBP = −1.55 ± 13.79 DBP = 0.07 ± 8.49 | SBP = N/R DBP = N/R |
| Martin et al. (2016) [5] | 22 (19:3) | NTN | No | FABP | M2 | SBP = N/R DBP = N/R | SBP = N/R DBP = N/R |
| Dai et al. (2016) [54] | 7 (N/R) | NTN | No | FABP | M1 | SBP = N/R DBP = N/R | SBP = N/R DBP = N/R |
| Zhang et al. (2016) [11] | 2 (N/R) | NTN | N/R | CBP | M8 | SBP = N/R DBP = N/R | SBP = N/R DBP = N/R |
| Shahrbabaki et al. (2016) [55] | 10 (N/R) | N/R | N/R | CBP | M1 | SBP = N/R DBP = N/R | SBP R2 = 0.59 DBP R2 = 0.42 |
| Gholamhosseini et al. (2016) [56] | 13 (N/R) | N/R | N/R | CBP | M1 | SBP = N/R DBP = N/R | SBP = N/R DBP = N/R |
| Schoot et al. (2016) [57] | 37 (18:19) | NTN, HTN | Yes | CBP | M1 | SBP = N/R DBP = N/R | SBP = N/R DBP = N/R |
| Jain et al. (2016) [58] | 72 (N/R) | N/R | N/R | CBP | M1 | SBP = N/R DBP = N/R | SBP = N/R DBP = N/R |
| Liu et al. (2016) [7] | 20 (N/R) | NTN, HTN | Yes | FABP | M1 | SBP = N/R DBP = N/R | SBP R2 = 0.95 DBP = N/R |
| Kachuee et al. (2017) [59] | 1000 (N/R) | N/R | N/R | ABP | M1 | SBP = −0.06 ± 9.88 DBP = 0.36 ± 5.7 | SBP = 0.54 DBP = 0.57 |
| Tang et al. (2017)[60] | 12 (11:1) | NTN, HTN | No | ABP | M1 | SBP = 0.2 ± 5.8 DBP = 0.4 ± 5.7 | SBP = 0.92 DBP = 0.64 |
| Seeberg et al. (2017) [61] | 18 (15:3) | N/R | Yes | CBP, FABP | M7 | SBP = N/R DBP = N/R | SBP = 0.69 DBP = 0.38 |
| Janjua et al. (2017) [62] | 11 (9:2) | NTN | No | CBP | M8 | SBP = N/R DBP = N/R | SBP = N/R DBP = N/R |
| Liu et al. (2017) [63] | 20 (N/R) | NTN | No | CBP | M7 | SBP = N/R DBP = N/R | SBP = 0.7 DBP = N/R |
| Chen et al. (2017)[64] | 10 (5:5) | NTN | No | FABP | M1 | SBP = −0.91 ± 3.84 DBP = −0.36 ± 3.36 | SBP = N/R DBP = N/R |
| Ahmaniemi et al. (2017) [65] | 30 (N/R) | NTN | No | CBP | M1 | SBP = N/R DBP = N/R | SBP = 0.42 DBP = 0.06 |
| Zhang et al. (2017) [66] | 10 (7:3) | N/R | N/R | CBP | M1 | SBP = 1.63 ± 4.4 DBP = N/R | SBP = N/R DBP = N/R |
| Lin et al. (2017) [67] | 22 (N/R) | NTN | No | CBP | M1 + PIR | SBP = 3.22 ± 8.02 DBP = 3.13 ± 4.82 | SBP = 0.93 DBP = 0.95 |
| Bhattacharya et al. (2017) [68] | 6 (N/R) | N/R | N/R | CBP | M1 | SBP = N/R DBP = N/R | SBP = N/R DBP = N/R |
| Ding et al. (2017)[69] | 33 (N/R) | NTN, HTN | Yes | FABP | M1 + PIR | SBP = 1.17 ± 5.72 DBP = 0.46 ± 5.49 | SBP = N/R DBP = N/R |
| Pflugradt et al. (2017) [70] | N/R (N/R) | N/R | N/R | ABP | M1 | SBP = 0.015 ± 4.41 DBP = N/R | SBP = N/R DBP = N/R |
| Ding et al. (2017) [71] | 6 (N/R) | N/R | N/R | ABP | M1 + PIR | SBP = N/R DBP = N/R | SBP = N/R DBP = N/R |
| Xu et al. (2017)[72] | 10 (8:2) | N/R | N/R | CBP | M1 | SBP = 4.5 ± 6.13 DBP = 3.4 ± 3.37 | SBP = N/R DBP = N/R |
| Ibrahim et al. (2017) [19] | 3 (N/R) | N/R | N/R | PTT, FABP | M6 | SBP = N/R DBP = N/R | SBP = 0.84 DBP = N/R |
| Lo et al. (2017) [73] | 25 (N/R) | N/R | N/R | ABP | M1 | SBP = N/R DBP = N/R | SBP = N/R DBP = N/R |
| Yang & Tavassolian (2018) [17] | 10 (10:0) | NTN | No | CBP | M3 | SBP = N/R DBP = N/R | SBP = 0.58 DBP = 0.57 |
| Rajala et al. (2018) [74] | 30 (19:11) | NTN | No | CBP | MI | SBP = N/R DBP = N/R | SBP = 0.37 DBP = N/R |
| Wang et al. (2018) [75] | 59 (N/R) | N/R | N/R | CBP | M5 | SBP = N/R DBP = N/R | SBP = N/R DBP = N/R |
| Lin et al. (2018) [76] | 22 (N/R) | NTN | No | FABP | M1 | SBP = N/R DBP = N/R | SBP = N/R DBP = N/R |
| Kim et al. (2018) [77] | N/R (N/R) | N/R | N/R | PAT | M1 | SBP = N/R DBP = N/R | SBP = N/R DBP = N/R |
| Sharifi et al. (2018) [78] | 1000 (N/R) | N/R | N/R | ABP | M1 + PIR | SBP = −0.29 ± 9.1 DBP = −0.1 ± 8.62 | SBP = N/R DBP = N/R |
| Ahmaniemi et al. (2018) [79] | 10 (9:1) | NTN | No | FABP | MI | SBP = 9.8 DBP = N/R | SBP = 0.75 DBP = N/R |
| Liang et al. (2018) [80] | 121 (N/R) | NTN, HTN | Yes | ABP | M1 | SBP = N/R DBP = N/R | SBP = N/R DBP = N/R |
| Yang et al. (2018) [18] | 10 (N/R) | NTN | No | PTT | M9 | SBP = N/R DBP = N/R | SBP = N/R DBP = N/R |
| Xu et al. (2018) [81] | 41 (21:21) | NTN | No | CBP | M1 | SBP = N/R DBP = N/R | SBP = 0.817 DBP = 0.757 |
| Chen et al. (2018) [82] | 60 (40:20) | NTN, HTN | Yes | CBP | M1 + PIR, HPSR | SBP = 0.61 ± 9.36 DBP = 0.68 ± 6.67 | SBP = 0.93 DBP = 0.89 |
| Lee et al. (2018) [23] | 11 (11:0) | NTN | No | FABP | M10 | SBP = N/R DBP = N/R | SBP = 0.915 DBP = 0.854 |
| Feng et al. (2018)[83] | 28 (15:13) | N/R | Yes | ABP | M1 | SBP = −0.98 ± 6.0 DBP = 0.02 ± 4.98 | SBP = N/R DBP = N/R |
| Huynh et al. (2018) [20] | 15 (10:5) | NTN | No | CBP | M4 | SBP = N/R DBP = N/R | SBP = 0.88 DBP = 0.88 |
© 2020 by the authors. Licensee MDPI, Basel, Switzerland. This article is an open access article distributed under the terms and conditions of the Creative Commons Attribution (CC BY) license (http://creativecommons.org/licenses/by/4.0/).
Share and Cite
Welykholowa, K.; Hosanee, M.; Chan, G.; Cooper, R.; Kyriacou, P.A.; Zheng, D.; Allen, J.; Abbott, D.; Menon, C.; Lovell, N.H.; et al. Multimodal Photoplethysmography-Based Approaches for Improved Detection of Hypertension. J. Clin. Med. 2020, 9, 1203. https://doi.org/10.3390/jcm9041203
Welykholowa K, Hosanee M, Chan G, Cooper R, Kyriacou PA, Zheng D, Allen J, Abbott D, Menon C, Lovell NH, et al. Multimodal Photoplethysmography-Based Approaches for Improved Detection of Hypertension. Journal of Clinical Medicine. 2020; 9(4):1203. https://doi.org/10.3390/jcm9041203
Chicago/Turabian StyleWelykholowa, Kaylie, Manish Hosanee, Gabriel Chan, Rachel Cooper, Panayiotis A. Kyriacou, Dingchang Zheng, John Allen, Derek Abbott, Carlo Menon, Nigel H. Lovell, and et al. 2020. "Multimodal Photoplethysmography-Based Approaches for Improved Detection of Hypertension" Journal of Clinical Medicine 9, no. 4: 1203. https://doi.org/10.3390/jcm9041203