The Association between Serum Levels of 25[OH]D, Body Weight Changes and Body Composition Indices in Patients with Heart Failure

 , , , and
Abstract
:1. Introduction
2. Materials and Methods
2.1. Study Group
2.2. Measurements
2.3. Statistical Analysis
3. Results
3.1. The Basic Characteristics of Study Group and Comparisons between WC Subgroups
3.2. The Risk of 25(OH)D Insufficiency/Deficiency in Relation to Weight Change
3.3. Comparison of Patients with Low Versus High Potential to UVB Exposure
4. Discussion
Clinical Relevance
5. Conclusions
Author Contributions
Funding
Conflicts of Interest
References
- Von Haehling, S.; Lainscak, M.; Springer, J.; Anker, S.D. Cardiac cachexia: A systematic overview. Pharmacol. Ther. 2009, 121, 227–252. [Google Scholar] [CrossRef]
- Anker, S.D.; Negassa, A.; Coats, A.J.; Afzal, R.; Poole-Wilson, P.A.; Cohn, J.N.; Salim, Y. Prognostic importance of weight loss in chronic heart failure and the effect of treatment with angiotensin-converting-enzyme inhibitors: An observational study. Lancet 2003, 361, 1077–1083. [Google Scholar] [CrossRef]
- Niedziela, J.; Hudzik, B.; Rozentryt, P. Epidemiology of weight changes in patients with heart failure. Folia Cardiologica Excerpta 2013, 8, 18–24. [Google Scholar]
- Loncar, G.; Fülster, S.; Von Haehling, S.; Popovic, V. Metabolism and the heart: An overview of muscle, fat, and bone metabolism in heart failure. Int. J. Cardiol. 2013, 162, 77–85. [Google Scholar] [CrossRef] [PubMed]
- Wong, K.E.; Szeto, F.L.; Zhang, W.; Ye, H.; Kong, J.; Zhang, Z.; Sun, X.J.; Li, Y.C. Involvement of the vitamin D receptor in energy metabolism: Regulation of uncoupling proteins. Am. J. Physiol. Metab. 2009, 296, E820–E828. [Google Scholar] [CrossRef] [PubMed] [Green Version]
- Dzik, K.P.; Kaczor, J.J. Mechanisms of vitamin D on skeletal muscle function: Oxidative stress, energy metabolism and anabolic state. Graefe’s Arch. Clin. Exp. Ophthalmol. 2019, 119, 825–839. [Google Scholar] [CrossRef] [PubMed] [Green Version]
- Bouillon, R.; Carmeliet, G.; Lieben, L.; Watanabe, M.; Perino, A.; Auwerx, J.; Schoonjans, K.; Verstuyf, A. Vitamin D and energy homeostasis—of mice and men. Nat. Rev. Endocrinol. 2013, 10, 79–87. [Google Scholar] [CrossRef] [PubMed]
- Girgis, C.M.; Mokbel, N.; Cha, K.M.; Houweling, P.J.; Abboud, M.; Fraser, D.R.; Mason, R.S.; Clifton-Bligh, R.J.; Gunton, J.E. The Vitamin D Receptor (VDR) Is Expressed in Skeletal Muscle of Male Mice and Modulates 25-Hydroxyvitamin D (25OHD) Uptake in Myofibers. Endocrinology 2014, 155, 3227–3237. [Google Scholar] [CrossRef] [Green Version]
- Ding, C.; Gao, D.; Wilding, J.P.; Trayhurn, P.; Bing, C. Vitamin D signalling in adipose tissue. Br. J. Nutr. 2012, 108, 1915–1923. [Google Scholar] [CrossRef] [Green Version]
- Girgis, C.M.; Clifton-Bligh, R.; Mokbel, N.; Cheng, K.; Gunton, J.E. Vitamin D Signaling Regulates Proliferation, Differentiation, and Myotube Size in C2C12 Skeletal Muscle Cells. Endocrinology 2014, 155, 347–357. [Google Scholar] [CrossRef] [Green Version]
- Pojednic, R.M.; Ceglia, L. The Emerging Biomolecular Role of Vitamin D in Skeletal Muscle. Exerc. Sport Sci. Rev. 2014, 42, 76–81. [Google Scholar] [CrossRef] [PubMed]
- Narvaez, C.J.; Matthews, D.G.; Broun, E.; Chan, M.; Welsh, J. Lean phenotype and resistance to diet-induced obesity in vitamin D receptor knockout mice correlates with induction of uncoupling protein-1 in white adipose tissue. Endocrinology 2008, 150, 651–661. [Google Scholar] [CrossRef]
- Wong, K.E.; Kong, J.; Zhang, W.; Szeto, F.L.; Ye, H.; Deb, D.K.; Brady, M.J.; Li, Y.C. Targeted Expression of Human Vitamin D Receptor in Adipocytes Decreases Energy Expenditure and Induces Obesity in Mice*. J. Boil. Chem. 2011, 286, 33804–33810. [Google Scholar] [CrossRef] [PubMed] [Green Version]
- Endo, I.; Inoue, D.; Mitsui, T.; Umaki, Y.; Akaike, M.; Yoshizawa, T.; Kato, S.; Matsumoto, T. Deletion of Vitamin D Receptor Gene in Mice Results in Abnormal Skeletal Muscle Development with Deregulated Expression of Myoregulatory Transcription Factors. Endocrinology 2003, 144, 5138–5144. [Google Scholar] [CrossRef] [PubMed] [Green Version]
- Srikuea, R.; Zhang, X.; Park-Sarge, O.-K.; Esser, K.A. VDR and CYP27B1 are expressed in C2C12 cells and regenerating skeletal muscle: Potential role in suppression of myoblast proliferation. Am. J. Physiol. Physiol. 2012, 303, C396–C405. [Google Scholar] [CrossRef] [PubMed] [Green Version]
- Bischoff-Ferrari, H.; Borchers, M.; Gudat, F.; Dürmüller, U.; Stahelin, H.; Dick, W. Vitamin D Receptor Expression in Human Muscle Tissue Decreases with Age. J. Bone Miner. Res. 2004, 19, 265–269. [Google Scholar] [CrossRef]
- Ceglia, L.; Niramitmahapanya, S.; Morais, M.D.S.; Rivas, D.; Harris, S.S.; Bischoff-Ferrari, H.; Fielding, R.A.; Dawson-Hughes, B. A randomized study on the effect of vitamin D₃ supplementation on skeletal muscle morphology and vitamin D receptor concentration in older women. J. Clin. Endocrinol. Metab. 2013, 98, E1927–E1935. [Google Scholar] [CrossRef] [Green Version]
- Zittermann, A.; Schleithoff, S.S.; Götting, C.; Dronow, O.; Fuchs, U.; Kuhn, J.; Kleesiek, K.; Tenderich, G.; Koerfer, R. Poor outcome in end-stage heart failure patients with low circulating calcitriol levels. Eur. J. Heart Fail. 2008, 10, 321–327. [Google Scholar] [CrossRef]
- Pilz, S.; März, W.; Wellnitz, B.; Seelhorst, U.; Fahrleitner-Pammer, A.; Dimai, H.P.; Boehm, B.O.; Dobnig, H. Association of Vitamin D Deficiency with Heart Failure and Sudden Cardiac Death in a Large Cross-Sectional Study of Patients Referred for Coronary Angiography. J. Clin. Endocrinol. Metab. 2008, 93, 3927–3935. [Google Scholar] [CrossRef] [Green Version]
- De Ulíbarri, J.I.; Madroño, A.G.; De Villar, N.G.P.; González, P.; González, B.; Mancha, A.; Rodríguez, F.; Fernández, G. CONUT: A tool for controlling nutritional status. First validation in a hospital population. Nutrición Hospitalaria 2005, 20, 38–45. [Google Scholar]
- Shin, S.-Y.; Kwon, M.-J.; Song, J.; Park, H.; Woo, H.-Y. Measurement of Serum Total Vitamin D (25-OH) Using Automated Immunoassay in Comparison With Liquid Chromatography Tandem-Mass Spectrometry. J. Clin. Lab. Anal. 2013, 27, 284–289. [Google Scholar] [CrossRef] [PubMed]
- Holick, M.F.; Binkley, N.; Bischoff-Ferrari, H.A.; Gordon, C.M.; Hanley, D.A.; Heaney, R.P.; Murad, M.H.; Weaver, C.M. Guidelines for Preventing and Treating Vitamin D Deficiency and Insufficiency Revisited. J. Clin. Endocrinol. Metab. 2012, 97, 1153–1158. [Google Scholar] [CrossRef] [PubMed]
- O’Neill, C.M.; Kazantzidis, A.; Ryan, M.J.; Barber, N.; Sempos, C.T.; Durazo-Arvizu, R.A.; Jorde, R.; Grimnes, G.; Eiriksdottir, G.; Gudnason, V.; et al. Seasonal Changes in Vitamin D-Effective UVB Availability in Europe and Associations with Population Serum 25-Hydroxyvitamin D. Nutrients 2016, 8, 533. [Google Scholar] [CrossRef] [PubMed] [Green Version]
- Gotsman, I.; Shauer, A.; Zwas, N.R.; Hellman, Y.; Keren, A.; Lotan, C.; Admon, D. Vitamin D deficiency is a predictor of reduced survival in patients with heart failure; vitamin D supplementation improves outcome. Eur. J. Heart Fail. 2012, 14, 357–366. [Google Scholar] [CrossRef]
- Saponaro, F.; Marcocci, C.; Zucchi, R.; Prontera, C.; Clerico, A.; Scalese, M.; Frascarelli, S.; Saba, A.; Passino, C. Hypovitaminosis D in patients with heart failure: Effects on functional capacity and patients’ survival. Endocrine 2017, 58, 574–581. [Google Scholar] [CrossRef]
- Boxer, R.; Kenny, A.M.; Cheruvu, V.K.; Vest, M.; Fiutem, J.J.; Piña, I.I. Serum 25-hydroxyvitamin D concentration is associated with functional capacity in older adults with heart failure. Am. Heart J. 2010, 160, 893–899. [Google Scholar] [CrossRef] [Green Version]
- Carbone, S.; Billingsley, H.E.; Miguelez, P.R.; Kirkman, D.L.; Garten, R.; Franco, R.L.; Lee, D.-C.; Lavie, C.J. Lean Mass Abnormalities in Heart Failure: The Role of Sarcopenia, Sarcopenic Obesity, and Cachexia. Curr. Probl. Cardiol. 2019, 28, 100417. [Google Scholar] [CrossRef]
- Han, X.; Quarles, L.D. Multiple faces of fibroblast growth factor-23. Curr. Opin. Nephrol. Hypertens. 2016, 25, 333–342. [Google Scholar] [CrossRef] [Green Version]
- Ter Maaten, J.M.; Voors, A.A.; Damman, K.; Van Der Meer, P.; Anker, S.D.; Cleland, J.G.; Dickstein, K.; Filippatos, G.; Van Der Harst, P.; Hillege, H.L.; et al. Fibroblast growth factor 23 is related to profiles indicating volume overload, poor therapy optimization and prognosis in patients with new-onset and worsening heart failure. Int. J. Cardiol. 2018, 253, 84–90. [Google Scholar] [CrossRef] [Green Version]
- Kolokotroni, O.; Papadopoulou, A.; Yiallouros, P.; Raftopoulos, V.; Kouta, C.; Lamnisos, D.; Nicolaidou, P.; Middleton, N. Association of vitamin D with adiposity measures and other determinants in a cross-sectional study of Cypriot adolescents. Public Health Nutr. 2014, 18, 112–121. [Google Scholar] [CrossRef] [Green Version]
- Rajakumar, K.; Heras, J.D.L.; Chen, T.; Lee, S.; Holick, M.F.; Arslanian, S. Vitamin D status, adiposity, and lipids in black American and Caucasian children. J. Clin. Endocrinol. Metab. 2011, 96, 1560–1567. [Google Scholar] [CrossRef] [PubMed]
- Schöttker, B.; Saum, K.-U.; Perna, L.; Ordóñez-Mena, J.M.; Holleczek, B.; Brenner, H. Is vitamin D deficiency a cause of increased morbidity and mortality at older age or simply an indicator of poor health? Eur. J. Epidemiol. 2014, 29, 199–210. [Google Scholar] [CrossRef] [PubMed]
- Bendik, I.; Friedel, A.; Roos, F.F.; Weber, P.; Eggersdorfer, M. Vitamin D: A critical and essential micronutrient for human health. Front. Physiol. 2014, 5, 1–14. [Google Scholar] [CrossRef] [PubMed]
- Pasini, E.; Opasich, C.; Pastoris, O.; Aquilani, R. Inadequate nutritional intake for daily life activity of clinically stable patients with chronic heart failure. Am. J. Cardiol. 2004, 93, 41–43. [Google Scholar] [CrossRef]
- Makarewicz-Wujec, M.; Kozlowska-Wojciechowska, M.; Sygnowska, E.; Waśkiewicz, A. Does heart failure determine the nutrition of patients? Kardiologia Polska 2014, 72, 56–63. [Google Scholar] [CrossRef]
- Braun, T.; Marks, D.L. Pathophysiology and treatment of inflammatory anorexia in chronic disease. J. Cachex- Sarcopenia Muscle 2010, 1, 135–145. [Google Scholar] [CrossRef] [Green Version]
- Christakos, S.; Dhawan, P.; Verstuyf, A.; Verlinden, L.; Carmeliet, G. Vitamin D: Metabolism, Molecular Mechanism of Action, and Pleiotropic Effects. Physiol. Rev. 2016, 96, 365–408. [Google Scholar] [CrossRef]
- Takashi, Y.; Fukumoto, S. Phosphate-sensing and regulatory mechanism of FGF23 production. J. Endocrinol. Investig. 2020, 1–7. [Google Scholar] [CrossRef]
- Mawer, E.B.; Backhouse, J.; Holman, C.A.; Lumb, G.A.; Stanbury, S.W. The Distribution and Storage of Vitamin D and its Metabolites in Human Tissues. Clin. Sci. 1972, 43, 413–431. [Google Scholar] [CrossRef]
- Valle, Y.L.; Almalki, S.G.; Agrawal, D.K. Vitamin D machinery and metabolism in porcine adipose-derived mesenchymal stem cells. Stem Cell Res. Ther. 2016, 7, 118. [Google Scholar] [CrossRef] [Green Version]
- Schroten, N.F.; Ruifrok, W.P.; Kleijn, L.; Dokter, M.M.; Sillje, H.H.; Heerspink, H.J.L.; Bakker, S.J.L.; Kema, I.P.; Van Gilst, W.H.; Van Veldhuisen, D.J.; et al. Short-term vitamin D3 supplementation lowers plasma renin activity in patients with stable chronic heart failure: An open-label, blinded end point, randomized prospective trial (VitD-CHF trial). Am. Heart J. 2013, 166, 357–364.e2. [Google Scholar] [CrossRef] [PubMed]
- Wassmann, S.; Nickenig, G. The role of the AT1 receptor in the cardiovascular continuum. Eur. Heart J. Suppl. 2004, 6 (Suppl. H). [Google Scholar] [CrossRef]
- Wöbke, T.K.; Sorg, B.L.; Steinhilber, D. Vitamin D in inflammatory diseases. Front. Physiol. 2014, 5, 1–20. [Google Scholar] [CrossRef] [PubMed] [Green Version]
- Szulc, P.; Schoppet, M.; Goettsch, C.; Rauner, M.; Dschietzig, T.; Chapurlat, R.; Hofbauer, L.C. Endocrine and clinical correlates of myostatin serum concentration in men--the STRAMBO study. J. Clin. Endocrinol. Metab. 2012, 97, 3700–3708. [Google Scholar] [CrossRef]
- Rodriguez, A.; Mousa, A.; Ebeling, P.R.; Scott, D.; De Courten, B. Effects of vitamin D supplementation on inflammatory markers in heart failure: A systematic review and meta-analysis of randomized controlled trials. Sci. Rep. 2018, 8, 1169. [Google Scholar] [CrossRef] [Green Version]
- Foo, L.H.; Zhang, Q.; Zhu, K.; Ma, G.; Trube, A.; Greenfield, H.; Fraser, D.R. Relationship between vitamin D status, body composition and physical exercise of adolescent girls in Beijing. Osteoporos. Int. 2008, 20, 417–425. [Google Scholar] [CrossRef]


| Feature | All N = 412 | Quintiles of Weight Change | ||||||
|---|---|---|---|---|---|---|---|---|
| Weight Gain [%] | Weight Stable [%] (Reference) | Weight Loss [%] | ||||||
| Q1 N = 76 (+36.60 to +2.50) | Q2 N = 99 (+2.27 to −4.17) | Q3 N = 82 (−4.35 to −9.33) | Q4 N = 69 (−9.35 to −15.26) | Q5 N = 86 (−15.29 to −39.60) | p-Value | |||
| Demography | ||||||||
| Sex [% female] | 14.3 | 17.1 | 5.2 | 7.W | 11.6 | 19.8 | 0.177 | |
| Age [years] | 54 (10) | 54.0 (8.5) | 56.0 (12.0) | 54.0 (11.0) | 53.0 (8.0) | 55.0 (13.0) | 0.79 | |
| Pre-HF BMI [kg/m2] | 28.3 (5.8) | 26.6 (5.2) | 27.8 (5.9) | 27.8 (5.0) | 28.4 (5.5) | 31.2 (7.2) and | <0.0001 | |
| Index BMI [kg/m2] | 26.6 (5.7) | 29.8 (6.0) | 27.5 (5.8) | 26.1 (5.0) | 25.2 (5.6) @ | 24.5 (5.4) and | <0.0001 | |
| Weight loss in HF | −6.1 (13.3) | +8.4 (11.5) and | G−1.4 (3.0) | −6.9 (3.0) and | −12.0 (2.5) and | −19.5 (6.9) and | <0.0001 | |
| Ischemic etiology [%] | 68.0 | 69.7 | 71.7 | 63.4 | 73.9 | 61.6 | 0.38 | |
| Duration of HF [months] | 31 (50) | 43 (17) | 29 (40) | 22 (56) | 25 (29) | 44 (69) | 0.51 | |
| UVBE [low/high] [%] | 60.2/39.8 | 63.2/36.8 | 57.6/42.4 | 59.8/40.2 | 60.9/39.1 | 60.5/39.5 | 0.97 | |
| Clinical characteristics, echocardiography and body composition | ||||||||
| NYHA class I/II/III/IV [%] | 9/36/46/9 | 13/46/38/3 | 18/41/36/5 | 8/50 /38/4 | 1/23/62/14 and | 3/19/57/21 and | <0.0001 | |
| LVEF [%] | 25 (12) | 27 (15) | 25 (14) | 24 (10) | 23.0 (10) | 22.0 (8.0) | <0.0001 | |
| MVO2 [mL/kg fat-free mass*min] | 21.2 ± 7.4 | 22.3 ± 6.8 | 21.9 ± 7.3 | 21.0 ± 7.1 | 18.9 ± 6.0 | 21.7 ± 8.8 | 0.07 | |
| MVO2 [mL/kg*min] | 14.6 ± 4.7 | 15.1 ± 4.2 | 15.1 ± 4.9 | 14.9 ± 4.6 | 13.0 ± 3.9 # | 14.7 ± 5.4 | 0.01 | |
| Fat mass [kg/m2] | 7.3 (3.2) | 9.2 (3.3) | 7.8 (2.9) | 7.0 (2.8) | 6.4 (2.3) # | 6.7 (3.5) | <0.0001 | |
| Fat content [%] | 28.7 (8.3) | 32.4 (6.3) | 29.8 (7.1) | 28.0 (9.5) | 26.2 (6.8) # | 28.3 (10.6) | 0.0001 | |
| Fat-free mass [kg/m2] | 17.9 ± 2.4 | 19.0 ± 2.9 | 18.1 ± 2.4 | 17.8 ± 2.0 | 18.0 ± 2.7 | 17.0 ± 2.1 | 0.0002 | |
| Biochemistry and nutritional indices | ||||||||
| NTproBNP [pg/mL] | 1376 (2645) | 1034 (1226) | 1092 (1778) | 1370.5 (3068) | 1996 (3274) and | 2734 (3538) and | <0.0001 | |
| eGFRMDRD [mL/min*1.73 m2] | 88.5 (35.8) | 88.4 (39.9) | 87.3 (33.8) | 92.8 (26.7) | 89.1 (34.0) | 80.9 (42.4) | 0.47 | |
| eGFRMDRD < 60 mL/min*1.73 m2 [%] | 15.0 | 14.5 | 15.2 | 15.9 | 11.6 | 17.4 | 0.57 | |
| hsCRP | 2.8 (5.0) | 2.6 (4.0) | 1.9 (3.4) | 2.1 (4.0) | 2.8 (5.4) | 5.2. (8.8) and | 0.002 | |
| Phosphate [mmol/L] | 1.1 ± 0.2 | 1.02 ± 0.2 | 1.07 ± 0.2 | 1.12 ± 0.2 | 1.10 ± 0.2 | 1.19 ± 0.3 and | 0.001 | |
| Lymphocyte [*103/mm/3] | 1.8 (0.8) | 1.8 (0,8) | 1.9 (0.9) | 1.8 (0.8) | 1.9 (0.8) | 1.7 (0.8) | 0.047 | |
| Albumin [g/L] | 41 ± 4.0 | 42 ± 3.6 | 41 ± 3.5 | 41 ± 4.0 | 41 ± 3.8 | 40 ± 4.3 | 0.11 | |
| Cholesterol [mmol/L] | 4.4 ± 1.2 | 4.6 ± 1.3 | 4.3 ± 1.1 | 4.4 ± 1.2 | 4.5 ± 1.1 | 4.2 ± 1.2 | 0.1 | |
| Calcium* [mmol/L] | 2.27 (0.2) | 2.23 (0.2) # | 2.28 (0.2) | 2.26 (0.2) | 2.26 (0.2) | 2.33 (0.2) @ | <0.0001 | |
| CONUT [non/malnourished] [%] | 51.9/48.1 | 59.2/40.8 | 55.6/44.4 | 48.8/51.2 | 58.0/42.0 | 39.5/60.5 | 0.07 | |
| 25[OH]D | ng/mL | 26.3 (22.6) | 28.9 (22.0) | 30.1 (22.5) | 27.2 (18.9) | 23.8 (29.3) | 21.7 (19.5) # | 0.01 |
| % < 30 ng/mL | 58.5 | 56.8 | 49.5 | 57.3 | 62.3 | 68.6 | 0.11 | |
| % < 20 ng/mL | 32.5 | 32.9 | 23.2 | 23.2 | 42.0 | 44.2 | 0.004 | |
| Comorbidities [% of patients with diagnosis] | ||||||||
| Hypertension | 57.7 | 64.5 | 60.6 | 53.7 | 59.4 | 51.2 | 0.42 | |
| Diabetes mellitus type 2 | 28.2 | 23.7 | 23.2 | 23.2 | 37.7 | 34.9 | 0.09 | |
| Hypercholesterolemia | 58.0 | 60.5 | 61.6 | 54.9 | 63.8 | 50.0 | 0.34 | |
| History of smoking | 74.0 | 72.4 | 71.7 | 78.1 | 68.1 | 79.1 | 0.48 | |
| Pharmacotherapy [% of treated patients] | ||||||||
| ACEI/ARB | 93.7 | 96.1 | 96.0 | 92.7 | 89.9 | 93.0 | 0.48 | |
| Beta-blockers | 97.3 | 98.7 | 98.0 | 96.3 | 98.6 | 95.4 | 0.61 | |
| Aldosterone antagonists | 89.6 | 81.6 | 83.8 | 92.7 | 95.7 | 95.3 | 0.004 | |
| Loop diuretics | 83.3 | 75.0 | 75.8 | 84.2 | 91.3 | 91.9 | 0.004 | |
| Digoxin | 43.7 | 26.3 | 32.3 | 48.8 | 55.1 | 58.1 # | <0.0001 | |
| 1-year mortality [%] | 13.4 | 11.8 | 8.0 | 13.4 | 11.6 | 23.2 | 0.04 | |
| Feature | Quintiles of Weight Change | ||||
|---|---|---|---|---|---|
| Weight Gain | Weight Stable (reference) | Weight Loss | |||
| Q1 (+36.62% to +2.5%) | Q2 (+2.27% to −4.17%) | Q3 (−4.35% to −9.33%) | Q4 (−9.35% to −15.26%) | Q5 (−15.29% to −39.56%) | |
| 25[OH]D serum level < 20 ng/mL (deficiency), Odds ratio ± 95 Confidence Intervals, p-value | |||||
| Unadjusted | 1.62 (0.83–3.6), p = 0.93 | 1.0 | 0,99 (0.40–2.00), p = 0.99 | 2.39 (1.23–4.67), p = 0.01 | 2.62 (1.39–4.92), p = 0.003 |
| Model 1 | 2.47 (0.94–6.53), p = 0.06 | 1.0 | 1.38 (0.56–3.41), p = 0.32 | 2.97 (1.21–7.29), p = 0.02 | 3.42 (1.46–8.02), p = 0.006 |
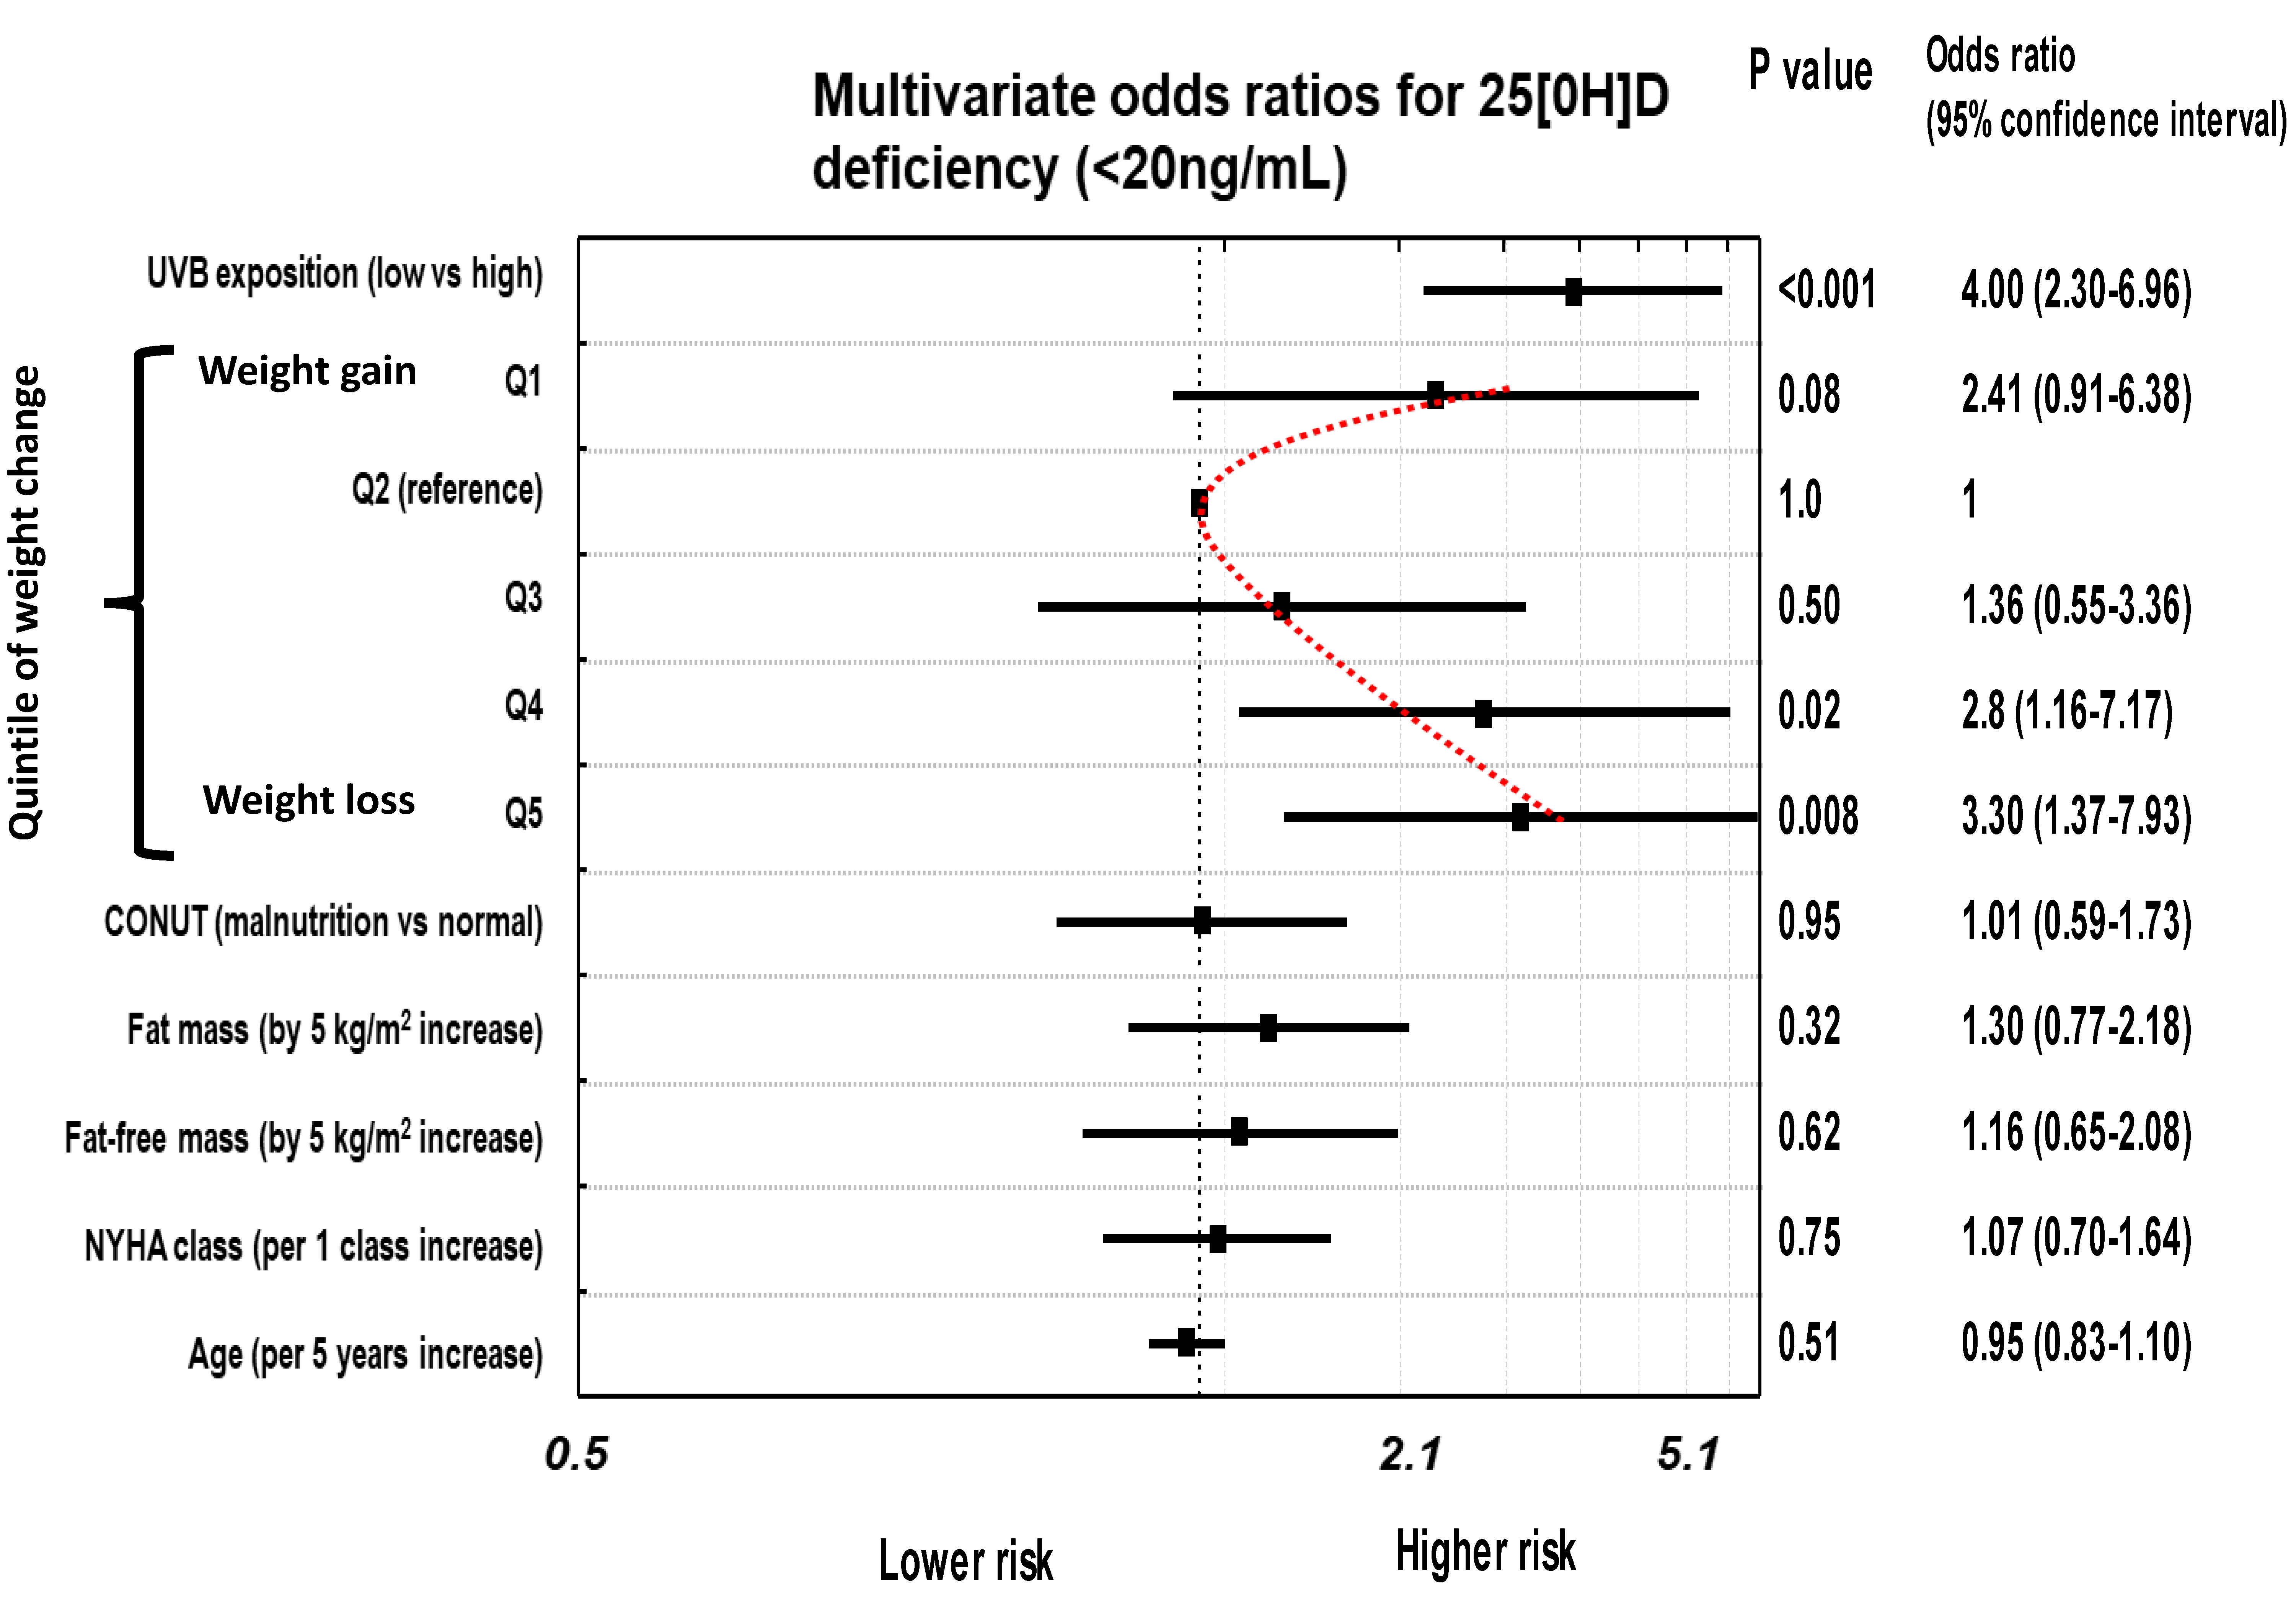
| Model 2 | 2.41 (0.91–6.38), p = 0.08 | 1.0 | 1.36 (0.55–3.36), p = 0.50 | 2.80 (1.16–7.17), p = 0.02 | 3.30 (1.37–7.93), p = 0.008 |
| 25[OH]D serum level < 30 ng/mL (insufficiency), Odds ratio ± 95 Confidence Intervals, p-value | |||||
| Unadjusted | 1.33 (0.73–2.43), p = 0.35 | 1.0 | 1.37 (0.76–2.47), p = 0.29 | 1.64 (0.78–3.45), p = 0.20 | 2.23 (1.22–4.07), p = 0.01 |
| Model 1 | 2.53 (1.07–6.01), p = 0.03 | 1.0 | 1.53 (0.73–3.20), p = 0.26 | 1.71 (0.78–3.72), p = 0.20 | 2.72 (1.30–5.69), p = 0.008 |
| Model 2 | 2.22 (0.92–5.35), p = 0.07 | 1.0 | 1.61 (0.76–3.40), p = 0.21 | 1.87 (0.83–4.19), p = 0.13 | 2.92 (1.34–6.36), p = 0.007 |
© 2020 by the authors. Licensee MDPI, Basel, Switzerland. This article is an open access article distributed under the terms and conditions of the Creative Commons Attribution (CC BY) license (http://creativecommons.org/licenses/by/4.0/).
Share and Cite
Stefaniak, A.; Partyka, R.; Duda, S.; Ostręga, W.; Niedziela, J.; Nowak, J.; Malinowska-Borowska, J.; Rywik, T.; Leszek, P.; Hudzik, B.; et al. The Association between Serum Levels of 25[OH]D, Body Weight Changes and Body Composition Indices in Patients with Heart Failure. J. Clin. Med. 2020, 9, 1228. https://doi.org/10.3390/jcm9041228
Stefaniak A, Partyka R, Duda S, Ostręga W, Niedziela J, Nowak J, Malinowska-Borowska J, Rywik T, Leszek P, Hudzik B, et al. The Association between Serum Levels of 25[OH]D, Body Weight Changes and Body Composition Indices in Patients with Heart Failure. Journal of Clinical Medicine. 2020; 9(4):1228. https://doi.org/10.3390/jcm9041228
Chicago/Turabian StyleStefaniak, Apolonia, Robert Partyka, Sylwia Duda, Weronika Ostręga, Jacek Niedziela, Jolanta Nowak, Jolanta Malinowska-Borowska, Tomasz Rywik, Przemysław Leszek, Bartosz Hudzik, and et al. 2020. "The Association between Serum Levels of 25[OH]D, Body Weight Changes and Body Composition Indices in Patients with Heart Failure" Journal of Clinical Medicine 9, no. 4: 1228. https://doi.org/10.3390/jcm9041228