Correlation Between Tumor-Associated Macrophage and Immune Checkpoint Molecule Expression and Its Prognostic Significance in Cutaneous Melanoma

Abstract
1. Introduction
2. Experimental Section
2.1. Study Design
2.2. Histopathological Analysis and Immunohistochemistry
2.3. Statistical Analyses
2.4. Variables of Interest
3. Results
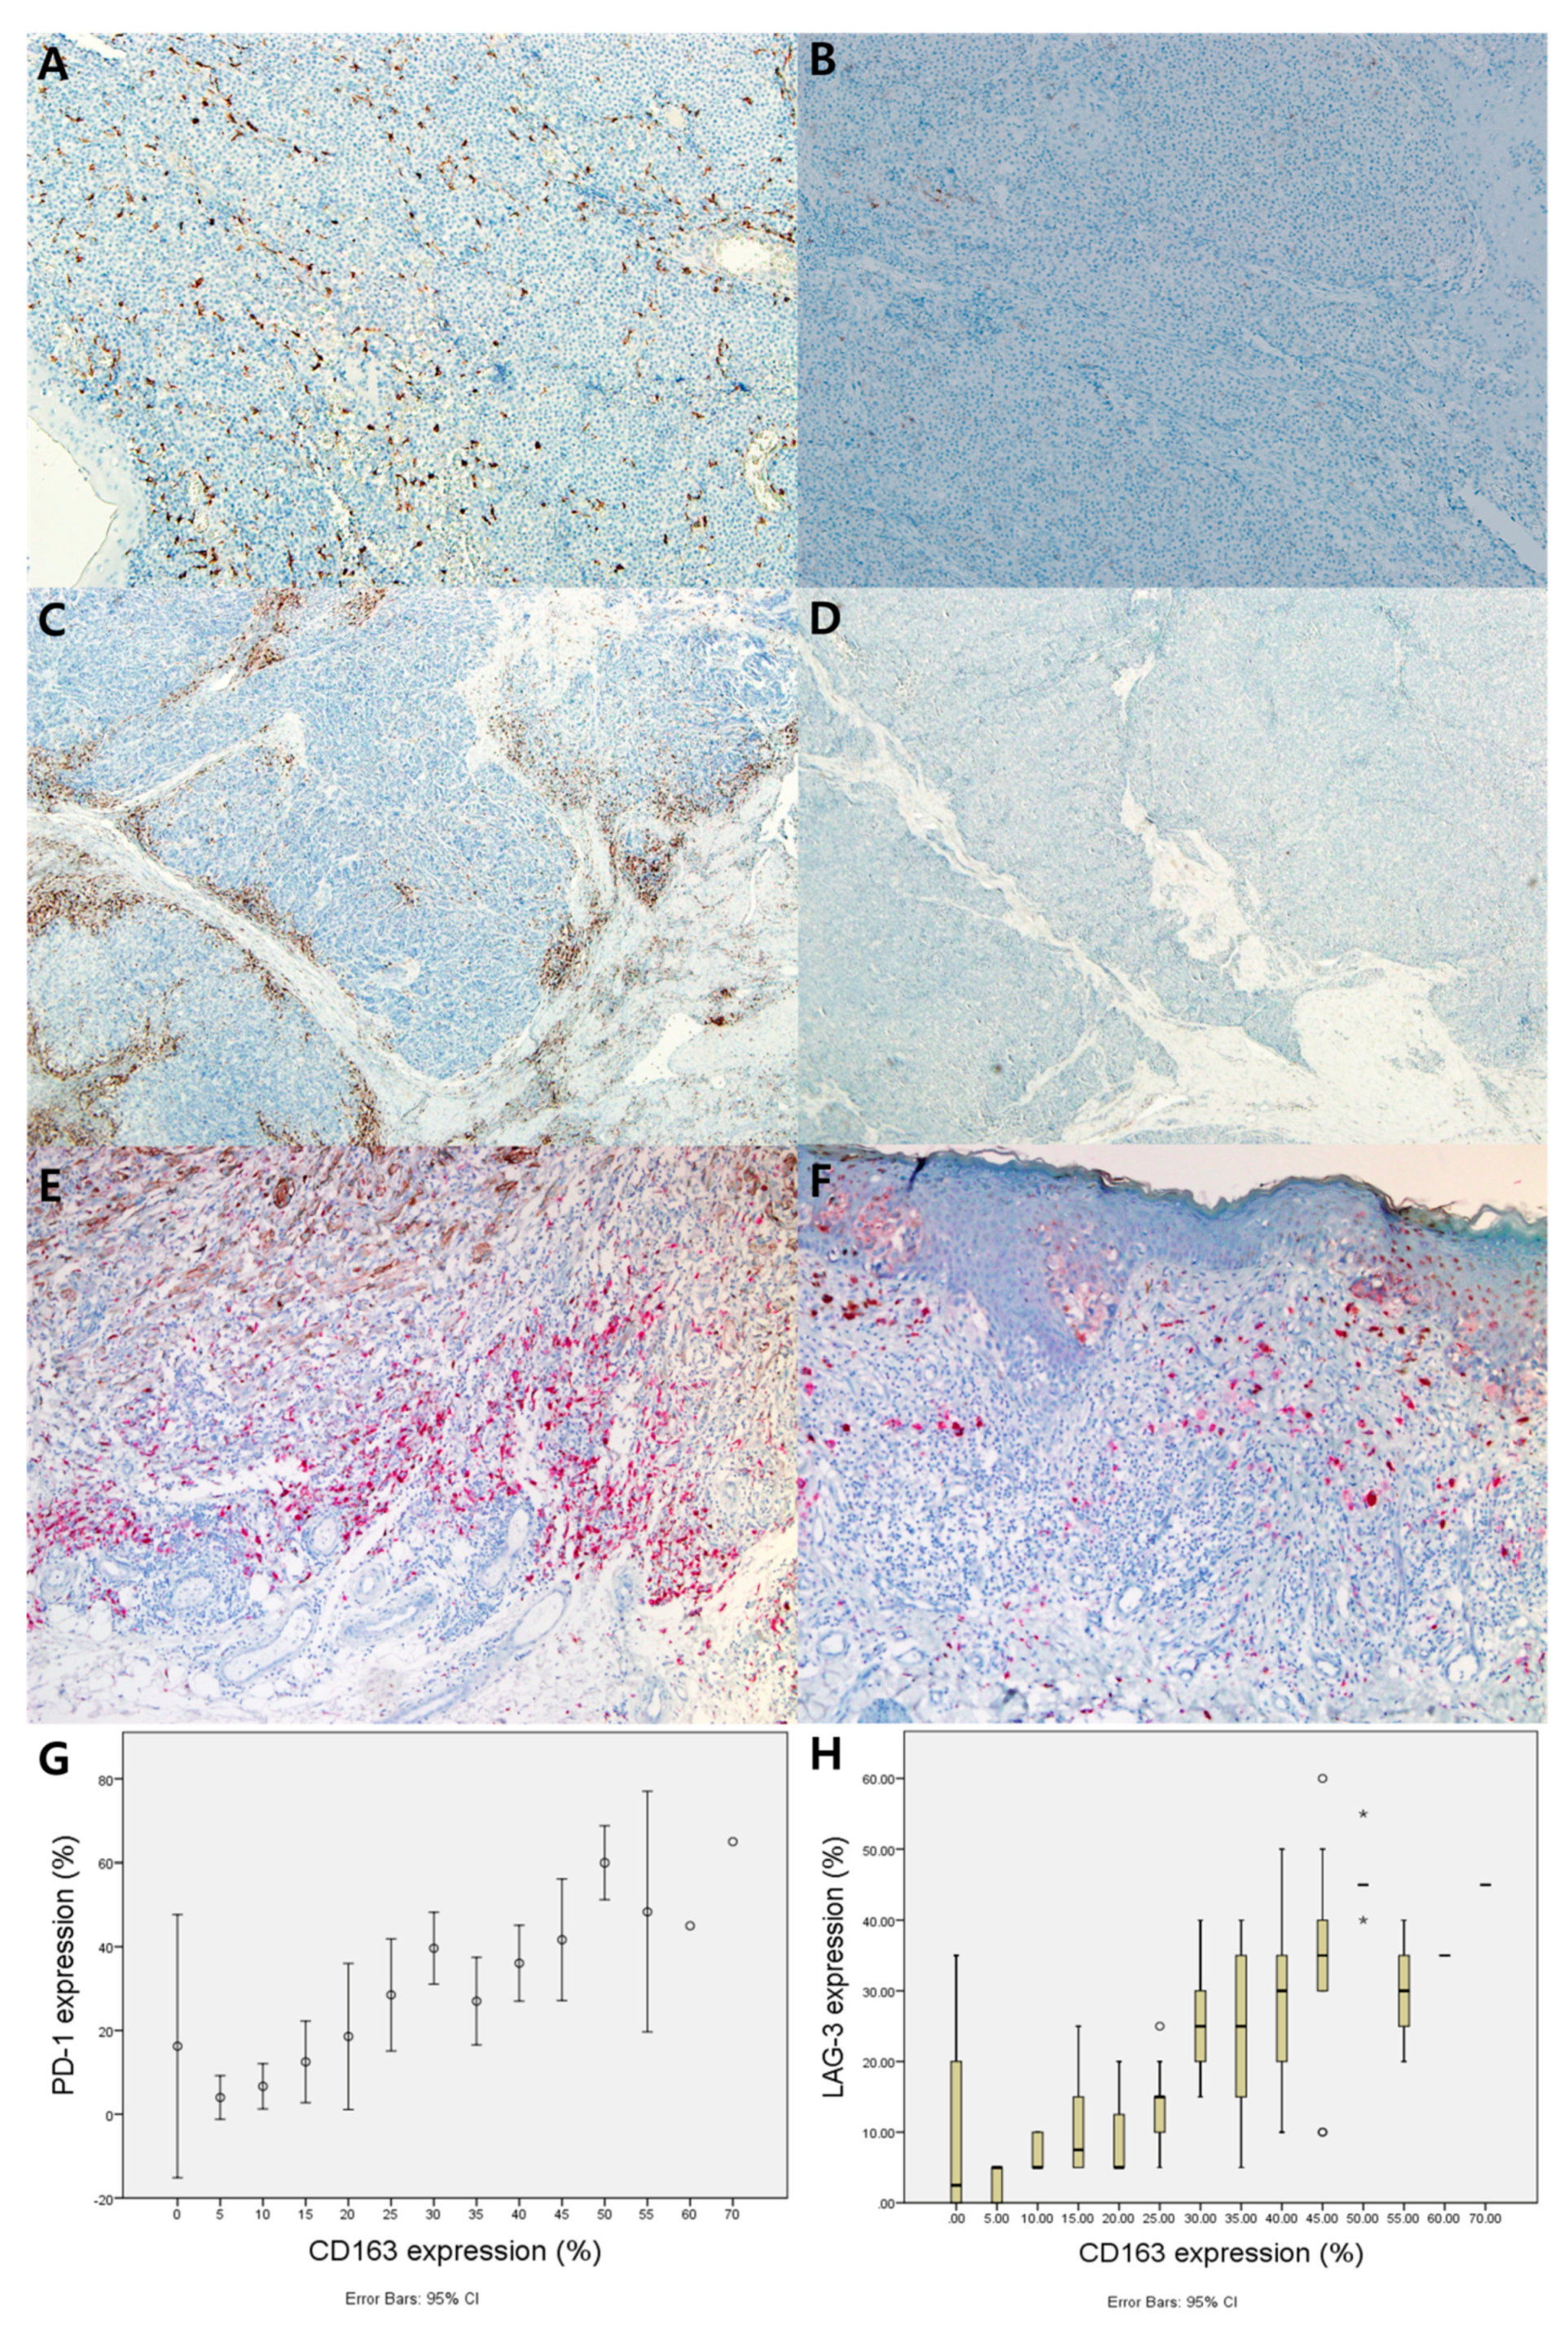
3.1. Correlation between CD163, PD-1, and LAG-3 Expression in Melanoma Tissue
3.2. Expression of CD163, PD-1, LAG-3, and Their Association With Clinicopathological Features
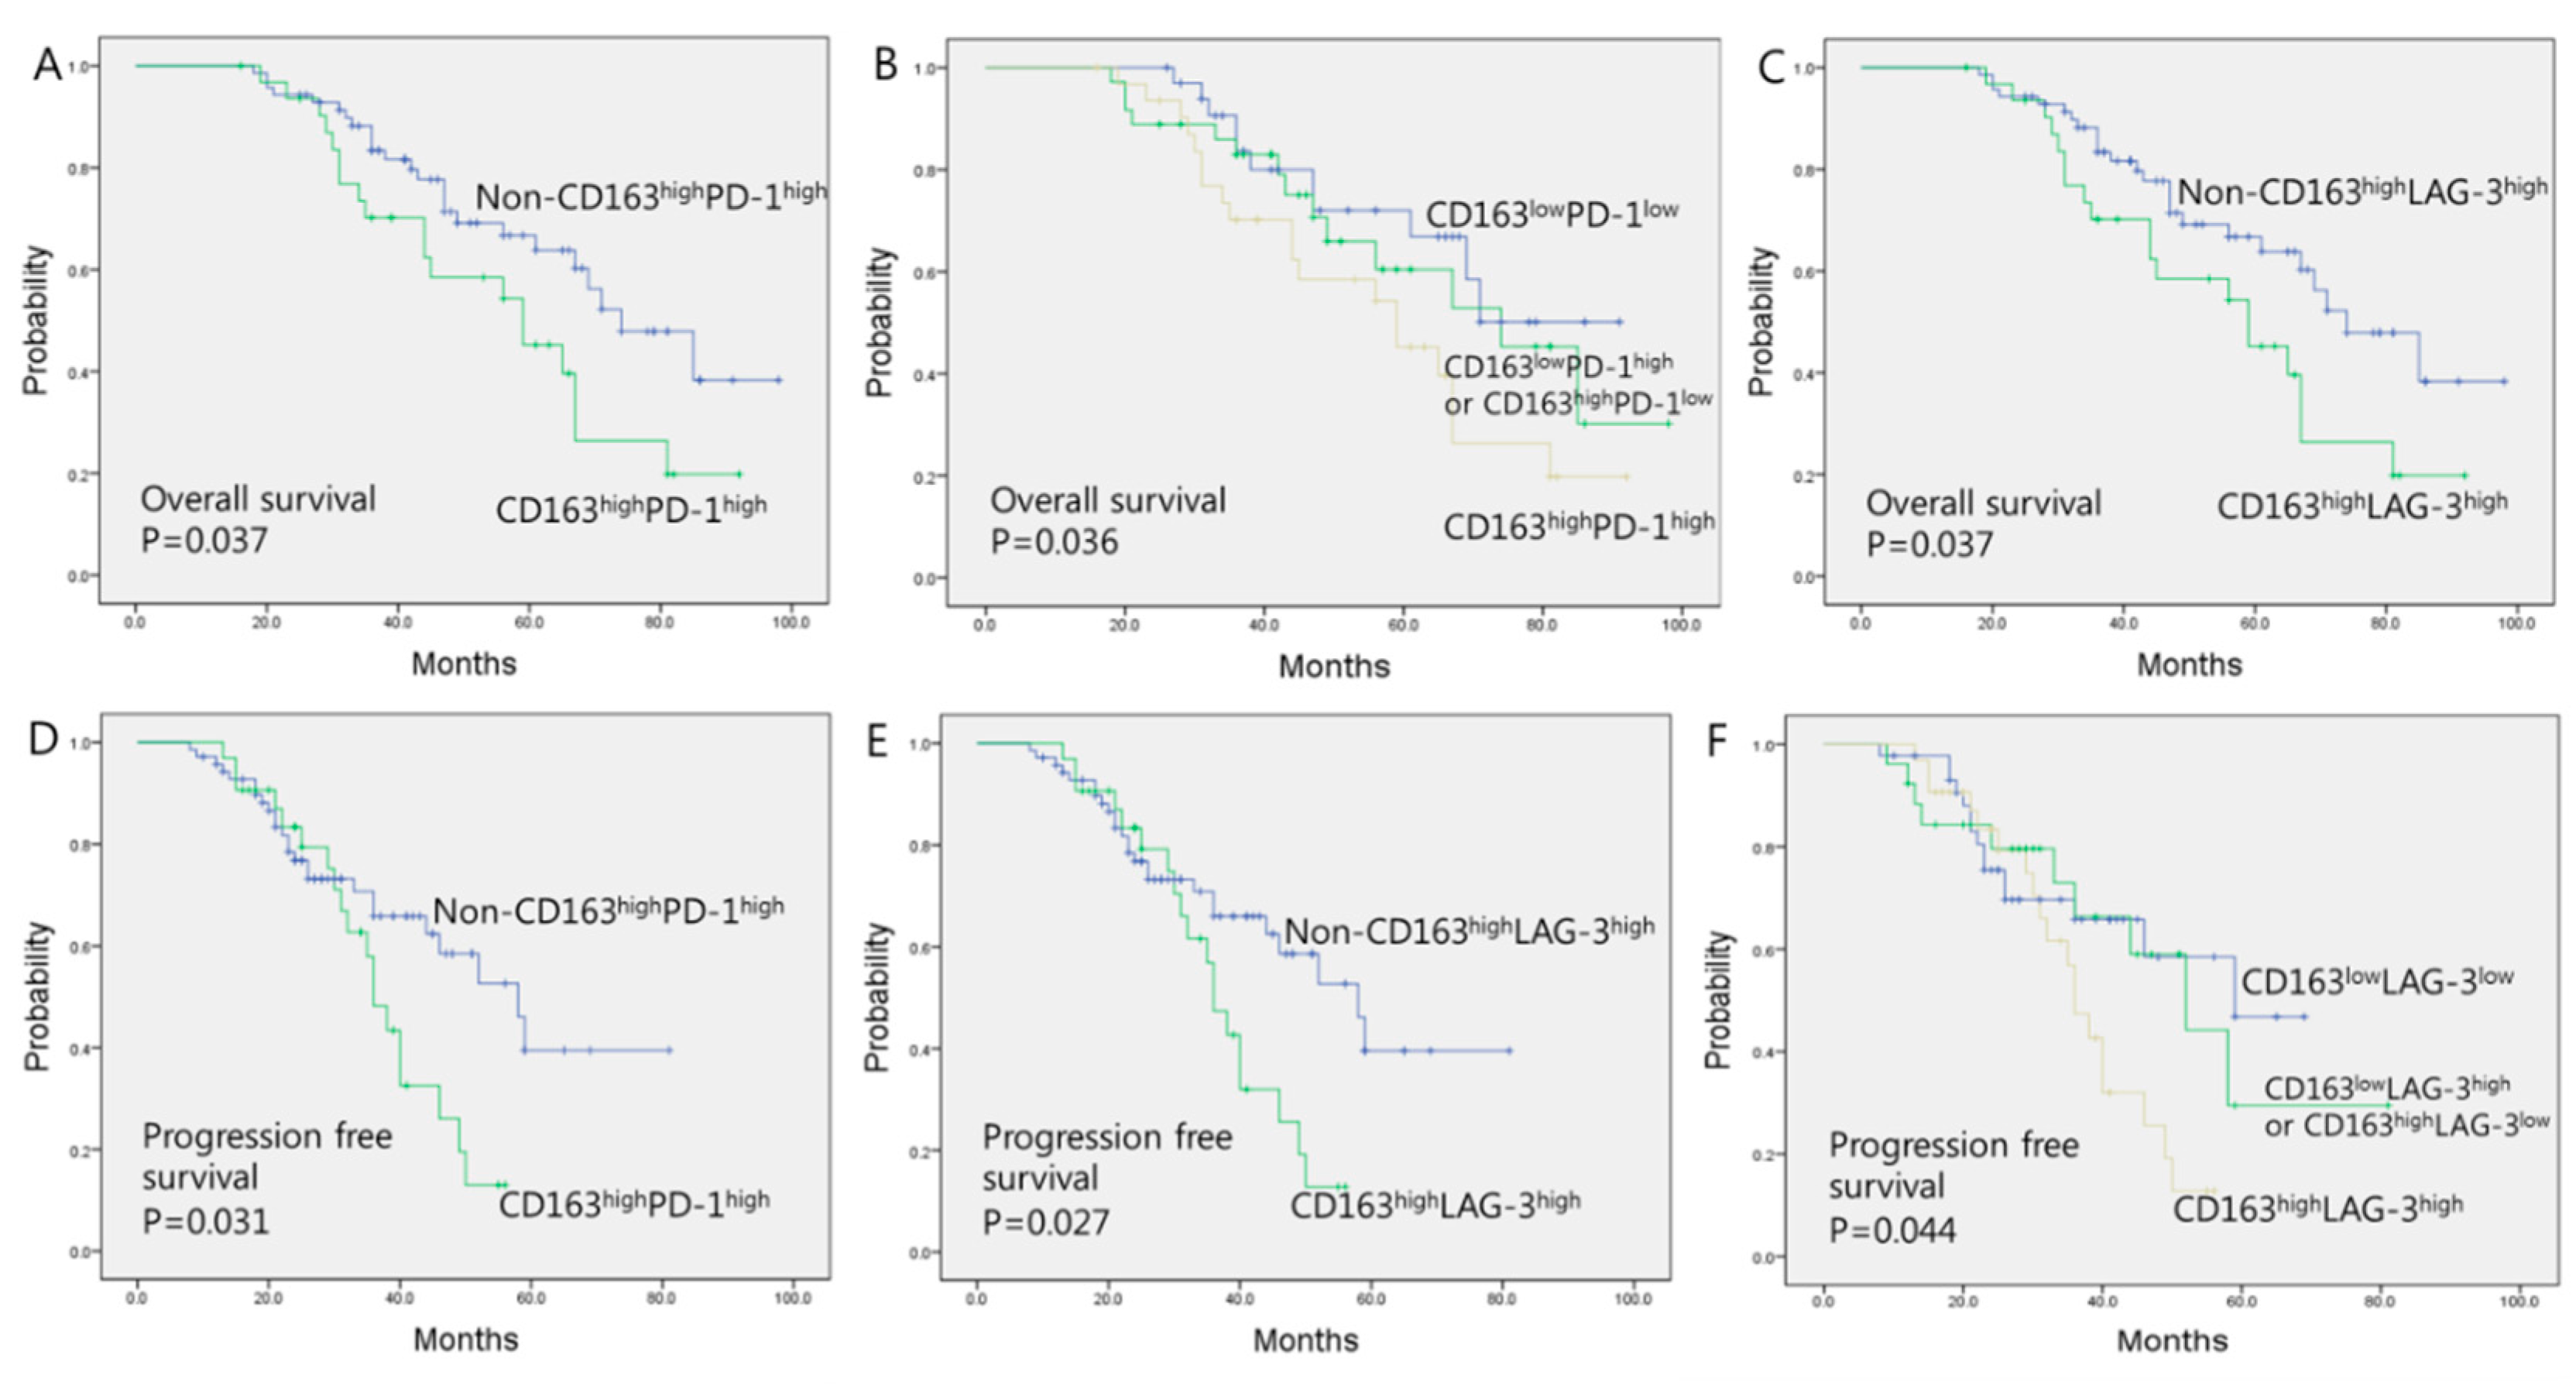
3.3. Prognostic Significance of CD163, PD-1, and LAG-3 Expression
4. Discussion
5. Conclusions
Author Contributions
Funding
Conflicts of Interest
References
- Dong, Y.; Sun, Q.; Zhang, X. PD-1 and its ligands are important immune checkpoints in cancer. Oncotarget 2017, 8, 2171–2186. [Google Scholar] [CrossRef] [PubMed]
- Poh, A.R.; Ernst, M. Targeting Macrophages in Cancer: From Bench to Bedside. Front. Oncol. 2018, 8, 49. [Google Scholar] [CrossRef] [PubMed]
- Sun, S.; Fei, X.; Mao, Y.; Wang, X.; Garfield, D.H.; Huang, O.; Wang, J.; Yuan, F.; Sun, L.; Yu, Q.; et al. PD-1+ immune cell infiltration inversely correlates with survival of operable breast cancer patients. Cancer Immunol. Immunother. 2014, 63, 395–406. [Google Scholar] [CrossRef] [PubMed]
- Seidel, J.A.; Otsuka, A.; Kabashima, K. Anti-PD-1 and anti-CTLA-4 therapies in cancer: mechanisms of action, efficacy, and limitations. Front. Oncol. 2018, 8, 86. [Google Scholar] [CrossRef]
- Grosso, J.F.; Goldberg, M.V.; Getnet, D.; Bruno, T.C.; Yen, H.R.; Pyle, K.J.; Hipkiss, E.; Vignali, D.A.; Pardoll, D.M.; Drake, C.G. Functionally distinct LAG-3 and PD-1 subsets on activated and chronically stimulated CD8 T cells. J. Immunol. 2009, 182, 6659–6669. [Google Scholar] [CrossRef]
- Basu, A.; Yearley, J.H.; Annamalai, L.; Pryzbycin, C.; Rini, B. Association of PD-L1, PD-L2, and immune response markers in matched renal clear cell carcinoma primary and metastatic tissue specimens. Am. J. Clin. Pathol. 2019, 151, 217–225. [Google Scholar] [CrossRef]
- Yuan, A.; Hsiao, Y.J.; Chen, H.Y.; Chen, H.W.; Ho, C.C.; Chen, Y.Y.; Liu, Y.C.; Hong, T.H.; Yu, S.L.; Chen, J.J.; et al. Opposite effects of M1 and M2 macrophage subtypes on lung cancer progression. Sci. Rep. 2015, 5, 14273. [Google Scholar] [CrossRef]
- Etzerodt, A.; Tsalkitzi, K.; Maniecki, M.; Damsky, W.; Delfini, M.; Baudoin, E.; Moulin, M.; Bosenberg, M.; Graversen, J.H.; Auphan-Anezin, N.; et al. Specific targeting of CD163+ TAMs mobilizes inflammatory monocytes and promotes T cell-mediated tumor regression. J. Exp. Med. 2019, 216, 2394–2411. [Google Scholar] [CrossRef]
- Neagu, M. The immune system--a hidden treasure for biomarker discovery in cutaneous melanoma. Adv. Clin. Chem. 2012, 58, 89–140. [Google Scholar]
- Gordon, S.R.; Maute, R.L.; Dulken, B.W.; Hutter, G.; George, B.M.; McCracken, M.N.; Gupta, R.; Tsai, J.M.; Sinha, R.; Corey, D.; et al. PD-1 expression by tumour-associated macrophages inhibits phagocytosis and tumour immunity. Nature 2017, 545, 495–499. [Google Scholar] [CrossRef]
- Chen, L.; Cao, M.F.; Xiao, J.F.; Ma, Q.H.; Zhang, H.; Cai, R.L.; Miao, J.Y.; Wang, W.Y.; Zhang, H.; Luo, M.; et al. Stromal PD-1+ tumor-associated macrophages predict poor prognosis in lung adenocarcinoma. Hum. Pathol. 2020, 97, 68–79. [Google Scholar] [CrossRef] [PubMed]
- Lee, W.J.; Lee, Y.J.; Choi, M.E.; Yun, K.A.; Won, C.H.; Lee, M.W.; Choi, J.H.; Chang, S.E. Expression of lymphocyte-activating gene 3 and T-cell immunoreceptor with immunoglobulin and ITIM domains in cutaneous melanoma and their correlation with programmed cell death 1 expression in tumor-infiltrating lymphocytes. J. Am. Acad. Dermatol. 2019, 81, 219–227. [Google Scholar] [CrossRef] [PubMed]
- Blackburn, S.D.; Shin, H.; Haining, W.N.; Zou, T.; Workman, C.J.; Polley, A.; Betts, M.R.; Freeman, G.J.; Vignali, D.A.A.; Wherry, E.J. Coregulation of CD8+ T cell exhaustion by multiple inhibitory receptors during chronic viral infection. Nat. Immunol. 2009, 10, 29–37. [Google Scholar] [CrossRef] [PubMed]
- Quaranta, V.; Schmid, M.C. Macrophage-mediated subversion of anti-tumour immunity. Cells 2019, 8, 747. [Google Scholar] [CrossRef]
- Gershenwald, J.E.; Scolyer, R.A. Melanoma staging: American Joint Committee on Cancer (AJCC) 8th edition and beyond. Ann. Surg. Oncol. 2018, 25, 2105–2110. [Google Scholar] [CrossRef]
- Lee, W.J.; Lee, M.H.; Kim, H.T.; Won, C.H.; Lee, M.W.; Choi, J.H.; Chang, S.E. Prognostic significance of CD163 expression and its correlation with cyclooxygenase-2 and vascular endothelial growth factor expression in cutaneous melanoma. Melanoma Res. 2019, 29, 501–509. [Google Scholar] [CrossRef]
- Zhao, X.; Qu, J.; Sun, Y.; Wang, J.; Liu, X.; Wang, F.; Zhang, H.; Wang, W.; Ma, X.; Gao, X.; et al. Prognostic significance of tumor-associated macrophages in breast cancer: a meta-analysis of the literature. Oncotarget 2017, 8, 30576–30586. [Google Scholar] [CrossRef]
- Yin, S.; Huang, J.; Li, Z.; Zhang, J.; Luo, J.; Lu, C.; Xu, H.; Xu, H. The prognostic and clinicopathological significance of tumor-associated macrophages in patients with gastric cancer: a meta-analysis. PLoS ONE 2017, 12, e0170042. [Google Scholar] [CrossRef]
- Yuan, X.; Zhang, J.; Li, D.; Mao, Y.; Mo, F.; Du, W.; Ma, X. Prognostic significance of tumor-associated macrophages in ovarian cancer: a meta-analysis. Gynecol. Oncol. 2017, 147, 181–187. [Google Scholar] [CrossRef]
- Yu, M.; Guan, R.; Hong, W.; Zhou, Y.; Lin, Y.; Jin, H.; Hou, B.; Jian, Z. Prognostic value of tumor-associated macrophages in pancreatic cancer: a meta-analysis. Cancer Manag. Res. 2019, 11, 4041–4058. [Google Scholar] [CrossRef]
- Troiano, G.; Caponio, V.C.A.; Adipietro, I.; Tepedino, M.; Santoro, R.; Laino, L.; Lo Russo, L.; Cirillo, N.; Lo Muzio, L. Prognostic significance of CD68+ and CD163+ tumor associated macrophages in head and neck squamous cell carcinoma: a systematic review and meta-analysis. Oral Oncol. 2019, 93, 66–75. [Google Scholar] [CrossRef] [PubMed]
- Fujimura, T.; Sato, Y.; Tanita, K.; Kambayashi, Y.; Otsuka, A.; Fujisawa, Y.; Yoshino, K.; Matsushita, S.; Funakoshi, T.; Hata, H.; et al. Serum level of soluble CD163 may be a predictive marker of the effectiveness of nivolumab in patients with advanced cutaneous melanoma. Front. Oncol. 2018, 8, 530. [Google Scholar] [CrossRef] [PubMed]
- Cantero-Cid, R.; Casas-Martin, J.; Hernandez-Jimenez, E.; Cubillos-Zapata, C.; Varela-Serrano, A.; Avendano-Ortiz, J.; Casarrubios, M.; Montalban-Hernandez, K.; Villacanas-Gil, I.; Guerra-Pastrian, L.; et al. PD-L1/PD-1 crosstalk in colorectal cancer: are we targeting the right cells? BMC Cancer 2018, 18, 945. [Google Scholar] [CrossRef] [PubMed]
- Man, K.; Gabriel, S.S.; Liao, Y.; Gloury, R.; Preston, S.; Henstridge, D.C.; Pellegrini, M.; Zehn, D.; Berberich-Siebelt, F.; Febbraio, M.A.; et al. Transcription factor IRF4 promotes CD8+ T cell exhaustion and limits the development of memory-like T cells during chronic infection. Immunity 2017, 47, 1129–1141.e5. [Google Scholar] [CrossRef]
- Noy, R.; Pollard, J.W. Tumor-Associated Macrophages: From Mechanisms to Therapy. Immunity 2014, 41, 49–61. [Google Scholar] [CrossRef]
- Deng, W.W.; Mao, L.; Yu, G.T.; Bu, L.L.; Ma, S.R.; Liu, B.; Gutkind, J.S.; Kulkarni, A.B.; Zhang, W.F.; Sun, Z.J. LAG-3 confers poor prognosis and its blockade reshapes antitumor response in head and neck squamous cell carcinoma. Oncoimmunology 2016, 5, e1239005. [Google Scholar] [CrossRef]
- Lee, W.J.; Lee, Y.J.; Shin, H.J.; Won, C.H.; Chang, S.E.; Choi, J.H.; Lee, M.W. Clinicopathological significance of tumor-infiltrating lymphocytes and programmed death-1 expression in cutaneous melanoma: a comparative study on clinical subtypes. Melanoma Res. 2018, 28, 423–434. [Google Scholar] [CrossRef]
- Fourcade, J.; Sun, Z.; Benallaoua, M.; Guillaume, P.; Luescher, I.F.; Sander, C.; Kirkwood, J.M.; Kuchroo, V.; Zarour, H.M. Upregulation of Tim-3 and PD-1 expression is associated with tumor antigen-specific CD8+ T cell dysfunction in melanoma patients. J. Exp. Med. 2010, 207, 2175–2186. [Google Scholar] [CrossRef]
- Tsukamoto, H.; Fujieda, K.; Miyashita, A.; Fukushima, S.; Ikeda, T.; Kubo, Y.; Senju, S.; Ihn, H.; Nishimura, Y.; Oshiumi, H. Combined blockade of IL6 and PD-1/PD-L1 signaling abrogates mutual regulation of their immunosuppressive effects in the tumor microenvironment. Cancer Res. 2018, 78, 5011–5022. [Google Scholar] [CrossRef]
- Ma, C.J.; Ni, L.; Zhang, Y.; Zhang, C.L.; Wu, X.Y.; Atia, A.N.; Thayer, P.; Moorman, J.P.; Yao, Z.Q. PD-1 negatively regulates interleukin-12 expression by limiting STAT-1 phosphorylation in monocytes/macrophages during chronic hepatitis C virus infection. Immunology 2011, 132, 421–431. [Google Scholar] [CrossRef]
- Dhupkar, P.; Gordon, N.; Stewart, J.; Kleinerman, E.S. Anti-PD-1 therapy redirects macrophages from an M2 to an M1 phenotype inducing regression of OS lung metastases. Cancer Med. 2018, 7, 2654–2664. [Google Scholar] [CrossRef] [PubMed]
- Tumeh, P.C.; Harview, C.L.; Yearley, J.H.; Shintaku, I.P.; Taylor, E.J.; Robert, L.; Chmielowski, B.; Spasic, M.; Henry, G.; Ciobanu, V.; et al. PD-1 blockade induces responses by inhibiting adaptive immune resistance. Nature 2014, 515, 568–571. [Google Scholar] [CrossRef] [PubMed]
- Ruffell, B.; Chang-Strachan, D.; Chan, V.; Rosenbusch, A.; Ho, C.M.; Pryer, N.; Daniel, D.; Hwang, E.S.; Rugo, H.S.; Coussens, L.M. Macrophage IL-10 blocks CD8+ T cell-dependent responses to chemotherapy by suppressing IL-12 expression in intratumoral dendritic cells. Cancer Cell 2014, 26, 623–637. [Google Scholar] [CrossRef]
- He, Y.; Rivard, C.J.; Rozeboom, L.; Yu, H.; Ellison, K.; Kowalewski, A.; Zhou, C.; Hirsch, F.R. Lymphocyte-activation gene-3, an important immune checkpoint in cancer. Cancer Sci. 2016, 107, 1193–1197. [Google Scholar] [CrossRef] [PubMed]
- Georgoudaki, A.M.; Prokopec, K.E.; Boura, V.F.; Hellqvist, E.; Sohn, S.; Ostling, J.; Dahan, R.; Harris, R.A.; Rantalainen, M.; Klevebring, D.; et al. Reprogramming tumor-associated macrophages by antibody targeting inhibits cancer progression and metastasis. Cell Rep. 2016, 15, 2000–2011. [Google Scholar] [CrossRef] [PubMed]


| Total | CD163High | CD163High PD-1High | CD163High LAG-3High | |||||||
|---|---|---|---|---|---|---|---|---|---|---|
| n = 102 | No (n = 55) | Yes (n = 47) | p-value | No (n = 70) | Yes (n = 32) | p-value | No (n = 70) | Yes (n = 32) | p-value | |
| Age (years) | 0.455 | 0.662 | 0.624 | |||||||
| Range | 25–89 | 25–80 | 31–89 | 25–89 | 31–86 | 25–89 | 31–82 | |||
| Mean | 61.8 | 60.8 | 62.1 | 61.4 | 62.0 | 61.3 | 62.4 | |||
| Sex | 0.769 | 0.705 | 0.419 | |||||||
| Male | 57 | 30 (54.5) | 27 (57.4) | 40 (57.1) | 17 (53.1) | 41 (58.6) | 16 (50.0) | |||
| Female | 45 | 25 (45.5) | 20 (42.6) | 30 (42.9) | 15 (46.9) | 29 (41.4) | 16 (50.0) | |||
| Breslow thickness, mm | 0.001 * | 0.001 * | 0.011 * | |||||||
| ≤1 (T1) | 15/55 (27.2) | 6/47 (12.8) | T1 or T2 | T1 or T2 | T1 or T2 | T1 or T2 | ||||
| >1 to ≤2 (T2) | 24/55 (43.6) | 12/47 (25.5) | 47/70 (67.1) | 10/32 (31.3) | 45/70 (64.3) | 12/32 (37.5) | ||||
| >2 to ≤4 (T3) | 10/55 (18.2) | 16/47 (34.0) | T3 or T4 | T3 or T4 | T3 or T4 | T3 or T4 | ||||
| >4 (T4) | 6/55 (10.9) | 13/47 (27.7) | 23/70 (32.9) | 22/32 (68.8) | 25/70 (35.7) | 20/32 (62.5) | ||||
| Ulceration | 0.591 | 0.659 | 0.173 | |||||||
| No | 70 | 39/55 (70.9) | 31/47 (66.0) | 49/70 (70.0) | 21/32 (65.6) | 51/70 (72.9) | 19/32 (59.4) | |||
| Yes | 32 | 16/55 (29.1) | 16/47 (34.0) | 21/70 (30.0) | 11/32 (34.4) | 19/70 (27.1) | 13/32 (40.6) | |||
| Vertical growth phase | 0.001 * | <0.001 * | <0.001 * | |||||||
| No | 61 | 41/55 (74.5) | 20/47 (42.6) | 51/70 (72.9) | 10/32 (31.3) | 50/70 (71.4) | 11/32 (34.4) | |||
| Yes | 41 | 14/55 (25.5) | 27/47 (57.4) | 19/70 (27.1) | 22/32 (68.8) | 20/70 (28.6) | 21/32 (65.6) | |||
| Lymph node involvement | 0.005 * | 0.033 * | 0.008 * | |||||||
| No | 80 | 49/55 (89.1) | 31/47 (66.0) | 59/70 (84.3) | 21/32 (65.6) | 60/70 (85.7) | 20/32 (62.5) | |||
| Yes | 22 | 6/55 (10.9) | 16/47 (34.0) | 11/70 (15.7) | 11/32 (34.4) | 10/70 (14.3) | 12/32 (37.5) | |||
| Visceral involvement | 0.087 | 0.048 * | 0.237 | |||||||
| No | 94 | 53/55 (96.4) | 41/47 (87.2) | 67/70 (95.7) | 27/32 (84.4) | 66/70 (94.3) | 28/32 (87.5) | |||
| Yes | 8 | 2/55 (3.6) | 6/47 (12.8) | 3/70 (4.3) | 5/32 (15.6) | 4/70 (5.7) | 4/32 (12.5) | |||
| AJCC stage | 0.012 * | 0.028 * | 0.007 * | |||||||
| I/II | 75 | 46/55 (83.6) | 29/47 (61.7) | 56/70 (80.0) | 19/32 (59.4) | 57/70 (81.4) | 18/32 (56.3) | |||
| III/IV | 27 | 9/55 (16.4) | 18/47 (38.3) | 14/70 (20.0) | 13/32 (40.6) | 13/70 (18.6) | 14/32 (43.8) | |||
| PD-1 Expression, n (%) | LAG-3 Expression, n (%) | |||||
|---|---|---|---|---|---|---|
| Low Expression (n = 49) | High Expression (n = 53) | p-Value | Low Expression (n = 58) | High Expression (n = 44) | p-Value | |
| CD163 expression | 0.003 * | <0.001 * | ||||
| Low expression (n = 55) | 34/49 (69.4) | 21/53 (39.6) | 43/58 (74.1) | 12/44 (27.3) | ||
| High expression (n = 47) | 15/49 (30.6) | 32/53 (60.4) | 15/58 (25.9) | 32/44 (72.7) | ||
| Mean OS (95% CI) (Months) | Mean PFS (95% CI) (Months) | |
|---|---|---|
| A) CD163lowPD-1low expression (n = 34) | 70.94 (61.78–80.10) | 51.48 (43.41–59.55) |
| B) Either CD163lowPD-1high or CD163highPD-1low expression (n = 36) | 68.17 (57.36–78.98) | 50.46 (39.54–61.39) |
| C) CD163highPD-1high expression (n = 32) | 57.57 (48.49–66.66) | 37.06 (32.24–41.87) |
| D) CD163lowLAG-3low expression (n = 44) | 68.53 (60.20–76.85) | 50.19 (42.83–57.57) |
| E) Either CD163lowLAG-3high or CD163highLAG-3low expression (n = 26) | 70.35 (57.80–82.89) | 50.93 (38.74–63.12) |
| F) CD163highLAG-3high expression (n = 32) | 57.57 (48.49–66.66) | 36.89 (32.06–41.72) |
| Overall (n = 102) | 66.86 (60.67–73.05) | 48.39 (42.26–54.53) |
| p-value | ||
| A, B, C separately | 0.036 *,§ | 0.026 *,§ |
| C versus. others | 0.037 *,§§ | 0.031 *,§§ |
| D, E, F separately | 0.064 ǂ | 0.044 *,ǂ |
| F versus. others | 0.037 *,ǂǂ | 0.027 *,ǂǂ |
| Univariate analysis | ||||||
|---|---|---|---|---|---|---|
| OS | PFS | |||||
| Covariate | HR | 95% CI | p Value | HR | 95% CI | p Value |
| Age (years) | ||||||
| <60 vs. ≥60 | 0.92 | 0.68–2.93 | 0.328 | 1.10 | 0.68–1.78 | 0.624 |
| Sex | ||||||
| Female vs. Male | 1.84 | 0.67–3.28 | 0.412 | 1.28 | 0.79–4.57 | 0.492 |
| AJCC stage | ||||||
| Early vs. Advanced | 2.41 | 1.24–4.28 | 0.023 * | 2.19 | 1.14–5.37 | 0.045 * |
| Involvement of LN | ||||||
| Yes vs. No | 1.69 | 1.10–5.63 | 0.037 * | 1.13 | 1.16–5.74 | 0.041 * |
| Amelanosis | ||||||
| Yes vs. No | 0.69 | 0.23–4.69 | 0.333 | 0.71 | 0.29–5.19 | 0.572 |
| Breslow thickness | ||||||
| T1 | 0.75 | 0.35–0.82 | 0.027 * | 0.52 | 0.31–0.81 | 0.031 * |
| T2 | 0.82 | 0.05–1.18 | 0.141 | 0.86 | 0.23–1.11 | 0.062 |
| T3 | 1.88 | 1.16–5.23 | 0.029 * | 1.52 | 1.14–6.32 | 0.041 * |
| T4 | 2.41 | 1.11-4.82 | 0.018 * | 1.99 | 1.19–5.81 | 0.039 * |
| CD163 expression | ||||||
| Yes vs. No | 2.62 | 1.39–4.88 | 0.033* | 2.71 | 1.13–4.16 | 0.159 |
| LAG-3 expression | ||||||
| High vs. Low | 2.11 | 1.21–5.20 | 0.037* | 2.07 | 1.13–5.31 | 0.041 * |
| PD-1 expression | ||||||
| High vs. Low | 1.09 | 0.59–4.75 | 0.421 | 1.13 | 0.85–4.92 | 0.280 |
| CD163highPD-1high | 2.31 | 1.21–5.11 | 0.029* | 1.88 | 1.07–5.09 | 0.043 * |
| CD163highLAG-3high | 2.03 | 1.18–5.44 | 0.032 * | 2.08 | 1.14–5.25 | 0.038 * |
| Multivariate analysis | ||||||
| AJCC stage | ||||||
| Early vs. Advanced | 1.89 | 1.21–4.59 | 0.042 * | 1.87 | 1.11–4.21 | 0.051 |
| Involvement of LN | ||||||
| Yes vs. No | 1.12 | 0.82–4.19 | 0.156 | 1.17 | 0.65–3.84 | 0.147 |
| Breslow thickness | ||||||
| T1 | 0.88 | 0.43–0.91 | 0.043 * | 0.92 | 0.55–0.98 | 0.047 * |
| T2 | 0.89 | 0.27–1.47 | 0.117 | 0.84 | 0.33–1.61 | 0.215 |
| T3 | 1.16 | 1.08–5.14 | 0.088 | 1.21 | 1.03–4.22 | 0.174 |
| T4 | 1.89 | 0.041 * | 1.61 | 1.10-4.87 | 0.063 | |
| CD163 expression | ||||||
| High vs. Low | 2.38 | 1.16–4.74 | 0.040 * | 2.19 | 1.06–5.08 | 0.188 |
| LAG-3 expression | ||||||
| High vs. Low | 1.99 | 1.19–5.44 | 0.044 * | 1.87 | 1.10–5.01 | 0.061 |
| CD163highPD-1high | 2.08 | 1.14–5.57 | 0.042 * | 1.76 | 1.08–5.46 | 0.066 |
| CD163highLAG-3high | 1.88 | 1.16–5.87 | 0.044 * | 1.54 | 1.07–5.13 | 0.046 * |
© 2020 by the authors. Licensee MDPI, Basel, Switzerland. This article is an open access article distributed under the terms and conditions of the Creative Commons Attribution (CC BY) license (http://creativecommons.org/licenses/by/4.0/).
Share and Cite
Kim, Y.J.; Won, C.H.; Lee, M.W.; Choi, J.H.; Chang, S.E.; Lee, W.J. Correlation Between Tumor-Associated Macrophage and Immune Checkpoint Molecule Expression and Its Prognostic Significance in Cutaneous Melanoma. J. Clin. Med. 2020, 9, 2500. https://doi.org/10.3390/jcm9082500
Kim YJ, Won CH, Lee MW, Choi JH, Chang SE, Lee WJ. Correlation Between Tumor-Associated Macrophage and Immune Checkpoint Molecule Expression and Its Prognostic Significance in Cutaneous Melanoma. Journal of Clinical Medicine. 2020; 9(8):2500. https://doi.org/10.3390/jcm9082500
Chicago/Turabian StyleKim, Young Jae, Chong Hyun Won, Mi Woo Lee, Jee Ho Choi, Sung Eun Chang, and Woo Jin Lee. 2020. "Correlation Between Tumor-Associated Macrophage and Immune Checkpoint Molecule Expression and Its Prognostic Significance in Cutaneous Melanoma" Journal of Clinical Medicine 9, no. 8: 2500. https://doi.org/10.3390/jcm9082500
APA StyleKim, Y. J., Won, C. H., Lee, M. W., Choi, J. H., Chang, S. E., & Lee, W. J. (2020). Correlation Between Tumor-Associated Macrophage and Immune Checkpoint Molecule Expression and Its Prognostic Significance in Cutaneous Melanoma. Journal of Clinical Medicine, 9(8), 2500. https://doi.org/10.3390/jcm9082500