Alcohol Induced Depression: Clinical, Biological and Genetic Features

 , and
, and
Abstract
1. Introduction
2. Material and Methods
2.1. Design
2.2. Participants and Recruitment
2.3. Measures
2.3.1. Clinical Assessments
2.3.2. Blood Samples
2.4. Procedure
2.5. Data Analysis
2.5.1. Clinical and Blood Tests
2.5.2. Genetic Data
- Genotyping procedure
- Association analysis
3. Results
3.1. Clinical
3.1.1. Socio-Demographic/Family History
3.1.2. Clinical Assessment
3.2. Blood Test Results
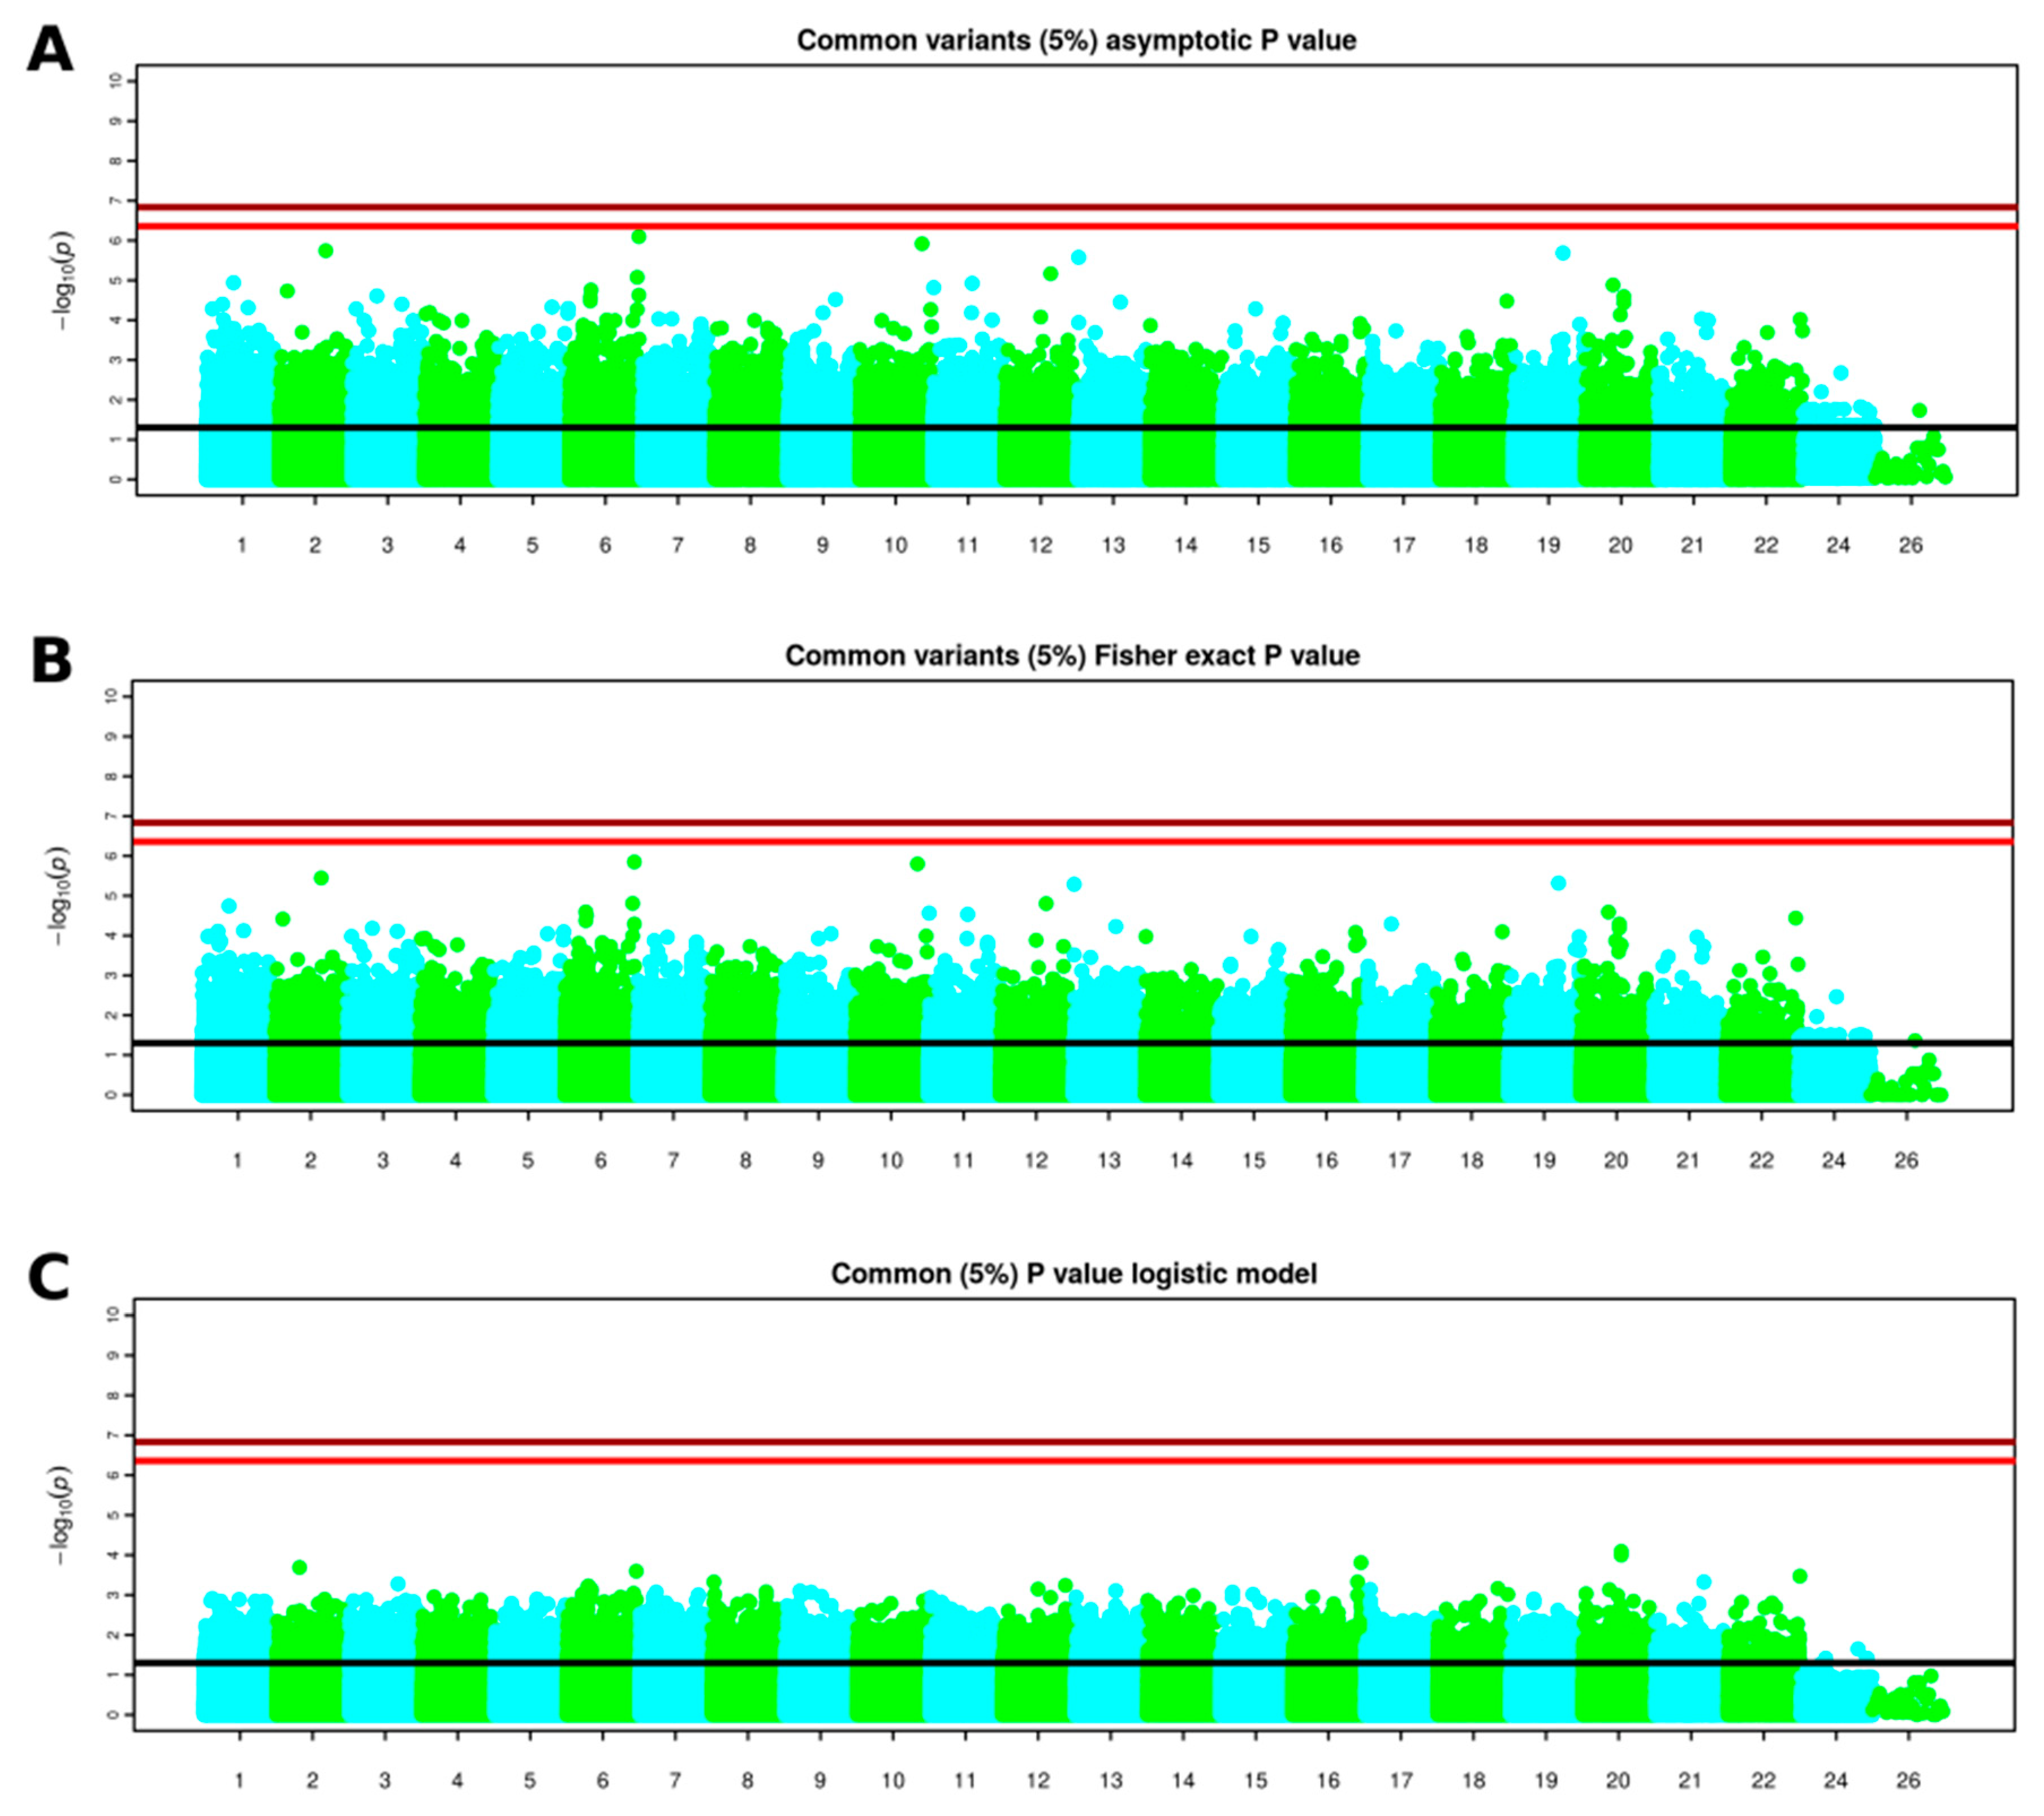
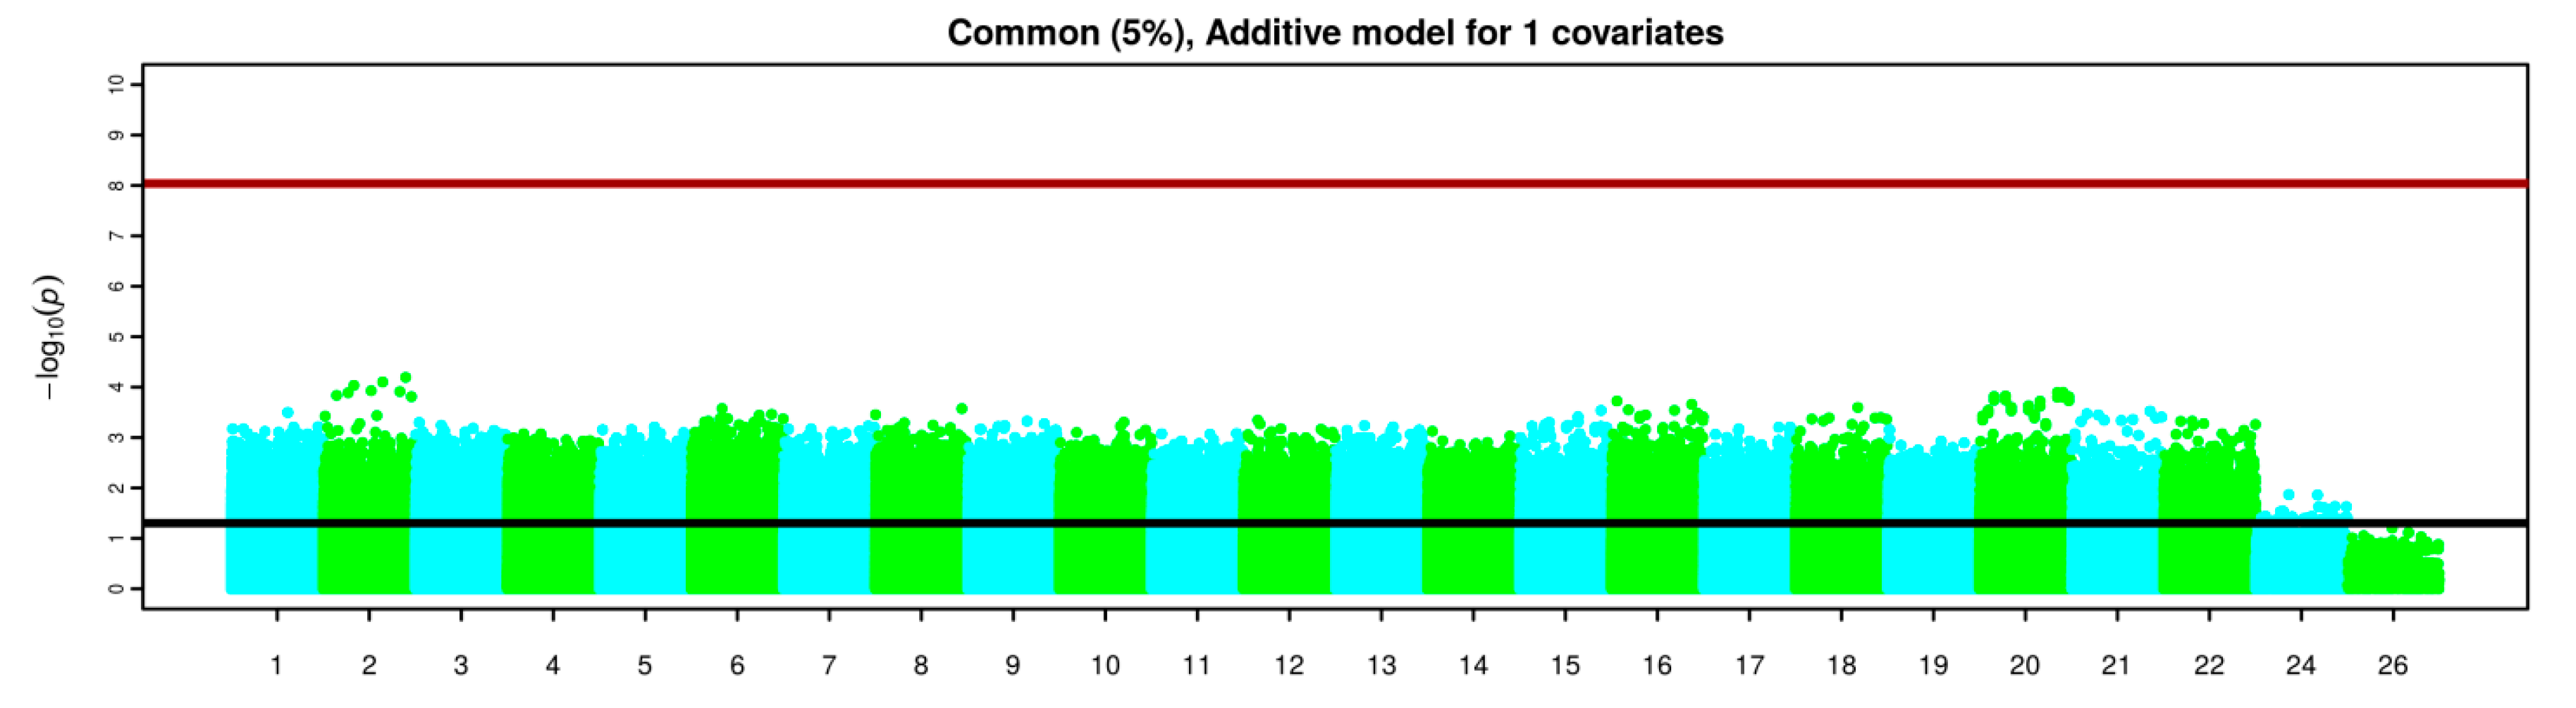
3.3. GWAS Results
4. Discussion
5. Conclusions
Author Contributions
Funding
Acknowledgments
Conflicts of Interest
Appendix A

| SNP | Chr | Pos | Effect Allele | Alternative Allele | F_AI-MD | F_Primary MD | OR | p Value |
|---|---|---|---|---|---|---|---|---|
| rs73250026 | 6 | 165960669 | G | A | 0.35 | 0.01429 | 37.15 | 7.991 × 10⁻⁷ |
| rs12355672 | 10 | 123921288 | A | G | 0.3 | 0 | NA | 0.000001204 |
| rs2602186 | 2 | 159271306 | A | G | 0.3421 | 0.01471 | 34.84 | 0.000001802 |
| rs2245046 | 19 | 47858424 | A | G | 0.3684 | 0.02857 | 19.83 | 0.000002057 |
| rs61955462 | 13 | 21009654 | A | G | 0.45 | 0.07143 | 10.64 | 0.000002643 |
| rs76785029 | 12 | 94882905 | T | C | 0.3421 | 0.02857 | 17.68 | 0.000006816 |
| rs77332950 | 6 | 162137147 | T | C | 0.375 | 0.04412 | 13 | 0.000008363 |
| rs11163044 | 1 | 81002495 | T | C | 0.25 | 0 | NA | 0.00001147 |
| rs61893521 | 11 | 76392642 | A | G | 0.425 | 0.07353 | 9.313 | 0.0000119 |
| rs73124405 | 20 | 20515790 | T | G | 0.3421 | 0.0303 | 16.64 | 0.00001311 |
| rs10839772 | 11 | 1850324 | A | G | 0.55 | 0.1571 | 6.556 | 0.00001524 |
| rs3130531 | 6 | 31206616 | A | G | 0.7105 | 0.2794 | 6.33 | 0.00001749 |
| rs116179105 | 2 | 19494199 | A | G | 0.2895 | 0.01471 | 27.3 | 0.00001855 |
| rs7772901 | 6 | 165959846 | C | A | 0.475 | 0.1143 | 7.012 | 0.00002349 |
| rs28504201 | 3 | 58573163 | A | G | 0.4 | 0.07143 | 8.667 | 0.00002465 |
| rs73115241 | 20 | 38797004 | T | C | 0.425 | 0.08571 | 7.884 | 0.00002561 |
| rs386580033 | 6 | 31091163 | A | G | 0.2 | 0.6176 | 0.1548 | 0.00002629 |
| rs2771040 | 9 | 108152199 | G | A | 0.4737 | 0.1143 | 6.975 | 0.00003021 |
| rs529060937 | 6 | 31091197 | G | A | 0.2105 | 0.6286 | 0.1576 | 0.00003293 |
| rs73485007 | 18 | 74495070 | T | C | 0.2778 | 0.01471 | 25.77 | 0.00003323 |
| SNP | Chr | Pos | Effect Allele | Alternative Allele | F_AI-MD | F_Primary MD | OR | p Value |
|---|---|---|---|---|---|---|---|---|
| rs73250026 | 6 | 165960669 | G | A | 0.35 | 0.01429 | 37.15 | 0.000001416 |
| rs12355672 | 10 | 123921288 | A | G | 0.3 | 0 | NA | 0.000001588 |
| rs2602186 | 2 | 159271306 | A | G | 0.3421 | 0.01471 | 34.84 | 0.000003575 |
| rs2245046 | 19 | 47858424 | A | G | 0.3684 | 0.02857 | 19.83 | 0.000004805 |
| rs61955462 | 13 | 21009654 | A | G | 0.45 | 0.07143 | 10.64 | 0.000005148 |
| rs77332950 | 6 | 162137147 | T | C | 0.375 | 0.04412 | 13 | 0.00001555 |
| rs76785029 | 12 | 94882905 | T | C | 0.3421 | 0.02857 | 17.68 | 0.00001572 |
| rs11163044 | 1 | 81002495 | T | C | 0.25 | 0 | NA | 0.00001807 |
| rs386580033 | 6 | 31091163 | A | G | 0.2 | 0.6176 | 0.1548 | 0.00002548 |
| rs73124405 | 20 | 20515790 | T | G | 0.3421 | 0.0303 | 16.64 | 0.00002572 |
| rs10839772 | 11 | 1850324 | A | G | 0.55 | 0.1571 | 6.556 | 0.00002733 |
| rs61893521 | 11 | 76392642 | A | G | 0.425 | 0.07353 | 9.313 | 0.0000293 |
| rs3130531 | 6 | 31206616 | A | G | 0.7105 | 0.2794 | 6.33 | 0.00003134 |
| rs137916 | 22 | 50491713 | A | G | 0.025 | 0.3529 | 0.04701 | 0.00003637 |
| rs116179105 | 2 | 19494199 | A | G | 0.2895 | 0.01471 | 27.3 | 0.00003841 |
| rs529060937 | 6 | 31091197 | G | A | 0.2105 | 0.6286 | 0.1576 | 0.00004234 |
| rs7772901 | 6 | 165959846 | C | A | 0.475 | 0.1143 | 7.012 | 0.00005108 |
| rs915476 | 17 | 32288009 | C | T | 0 | 0.2857 | 0 | 0.00005113 |
| rs73115241 | 20 | 38797004 | T | C | 0.425 | 0.08571 | 7.884 | 0.00005121 |
| rs17780066 | 13 | 78448090 | T | C | 0.2368 | 0 | NA | 0.00005933 |
| SNP | Chr | Pos | Effect Allele | OR | p Value |
|---|---|---|---|---|---|
| rs73115241 | 20 | 38797004 | T | 14.1 | 0.00008067 |
| rs6028915 | 20 | 38786218 | C | 13.63 | 0.0001002 |
| rs9933149 | 16 | 87226206 | T | 0.06377 | 0.0001541 |
| rs2162380 | 2 | 64556555 | A | 12 | 0.0002039 |
| rs7772901 | 6 | 165959846 | C | 9.49 | 0.0002534 |
| rs2301584 | 22 | 51171497 | A | 11.89 | 0.0003368 |
| rs4876226 | 8 | 2059004 | T | 9.259 | 0.0004704 |
| rs4876226 | 8 | 2059004 | T | 9.259 | 0.0004704 |
| rs4876226 | 8 | 2059004 | T | 9.259 | 0.0004704 |
| rs16843122 | 3 | 135278749 | C | 0.08456 | 0.0005255 |
| rs4765145 | 12 | 124843104 | C | 0.05933 | 0.0005727 |
| rs3130531 | 6 | 31206616 | A | 5.473 | 0.0005918 |
| rs386580033 | 6 | 31091163 | A | 0.1706 | 0.0006138 |
| rs7407243 | 18 | 70010868 | G | 9.425 | 0.000684 |
| rs529060937 | 6 | 31091197 | G | 0.1759 | 0.0007074 |
| rs4913427 | 12 | 68631620 | T | 0.1561 | 0.0007113 |
| rs499691 | 6 | 32194339 | T | 7.06 | 0.0007266 |
| rs1048677 | 17 | 3564716 | G | 7.575 | 0.0007284 |
| rs6046396 | 20 | 19852503 | G | 6.717 | 0.0007339 |
| rs34058147 | 13 | 75567543 | G | 0.1383 | 0.0007866 |
References
- World Health Organization. Global Status Report on Alcohol and Health 2018; Poznyak, V., Rekve, D., Eds.; Licence: CC BY-NC-SA 3.0 IGO; World Health Organization: Geneva, Switzerland, 2018; ISBN 978-92-4-156563-9. [Google Scholar]
- WHO. Depression and Other Common Mental Disorders; WHO: Geneva, Switzerland, 2017. [Google Scholar]
- Davis, L.; Uezato, A.; Newell, J.M.; Frazier, E. Major depression and comorbid substance use disorders. Curr. Opin. Psychiatry 2008, 21, 14–18. [Google Scholar] [CrossRef] [PubMed]
- Zimmerman, M. What should the standard of care for psychiatric diagnostic evaluations be? J. Nerv. Ment. Dis. 2003, 191, 281–286. [Google Scholar] [CrossRef] [PubMed]
- Boschloo, L.; Vogelzangs, N.; Smit, J.H.; Van Den Brink, W.; Veltman, D.J.; Beekman, A.T.F.; Penninx, B.W.J.H. Comorbidity and risk indicators for alcohol use disorders among persons with anxiety and/or depressive disorders Findings from the Netherlands Study of Depression and Anxiety (NESDA). J. Affect. Disord. 2011, 131, 233–242. [Google Scholar] [CrossRef] [PubMed]
- Melartin, T.K.; Rytsala, H.J.; Leskela, U.S.; Lestela-Mielonen, P.S.; Sokero, T.P.; Isometsa, E.T. Current Comorbidity of Psychiatric Disorders Among DSM-IV Major Depressive Disorder Patients in Psychiatric Care in the Vantaa Depression Study. J. Clin. Psychiatry 2002, 63, 126–134. [Google Scholar] [CrossRef] [PubMed]
- Karpyak, V.M.; Geske, J.R.; Hall-Flavin, D.K.; Loukianova, L.L.; Schneekloth, T.D.; Skime, M.K.; Seppala, M.; Dawson, G.; Frye, M.A.; Choi, D.S.; et al. Sex-specific association of depressive disorder and transient emotional states with alcohol consumption in male and female alcoholics. Drug Alcohol Depend. 2019, 196, 31–39. [Google Scholar] [CrossRef]
- Hasin, D.S.; Goodwin, R.D.; Stinson, F.S.; Grant, B.F. Epidemiology of Major Depressive Disorder. Arch. Gen. Psychiatry 2005, 62, 1097. [Google Scholar] [CrossRef]
- Hasin, D.S.; Stinson, F.S.; Ogburn, E.; Grant, B.F. Prevalence, Correlates, Disability, and Comorbidity of DSM-IV Alcohol Abuse and Dependence in the United States. Arch. Gen. Psychiatry 2007, 64, 830. [Google Scholar] [CrossRef]
- Kessler, R.C. The epidemiology of dual diagnosis. Biol. Psychiatry 2004, 56, 730–737. [Google Scholar] [CrossRef]
- Conner, K.R.; Pinquart, M.; Gamble, S.A. Meta-analysis of depression and substance use among individuals with alcohol use disorders. J. Subst. Abuse Treat. 2009, 37, 127–137. [Google Scholar] [CrossRef]
- Ehlers, C.L.; Gilder, D.A.; Gizer, I.R.; Wilhelmsen, K.C. Indexing the ‘dark side of addiction’: Substance-induced affective symptoms and alcohol use disorders. Addiction 2019, 114, 139–149. [Google Scholar] [CrossRef]
- Boden, J.M.; Fergusson, D.M. Alcohol and depression. Addiction 2011, 106, 906–914. [Google Scholar] [CrossRef] [PubMed]
- Lai, H.M.X.; Cleary, M.; Sitharthan, T.; Hunt, G.E. Prevalence of comorbid substance use, anxiety and mood disorders in epidemiological surveys, 1990–2014: A systematic review and meta-analysis. Drug Alcohol Depend. 2015, 154, 1–13. [Google Scholar] [CrossRef] [PubMed]
- McHugh, R.K.; Weiss, R.D. Alcohol Use Disorder and Depressive Disorders. Alcohol Res. 2019, 40. [Google Scholar] [CrossRef] [PubMed]
- Schuckit, M.A. Comorbidity between substance use disorders and psychiatric conditions. Addiction 2006, 101, 76–88. [Google Scholar] [CrossRef]
- Nunes, E.V.; Levin, F.R. Treatment of depression in patients with alcohol or other drug dependence: A meta-analysis. JAMA 2004, 291, 1887–1896. [Google Scholar] [CrossRef]
- Torrens, M.; Fonseca, F.; Mateu, G.; Farré, M. Efficacy of antidepressants in substance use disorders with and without comorbid depression A systematic review and meta-analysis. Drug Alcohol Depend. 2005, 78, 1–22. [Google Scholar] [CrossRef]
- Niciu, M.J.; Chan, G.; Gelernter, J.; Arias, A.J.; Douglas, K.; Weiss, R.; Anton, R.F.; Farrer, L.; Cubells, J.F.; Kranzler, H.R. Subtypes of major depression in substance dependence. Addiction 2009, 104, 1700–1709. [Google Scholar] [CrossRef]
- Samet, S.; Fenton, M.C.; Nunes, E.; Greenstein, E.; Aharonovich, E.; Hasin, D. Effects of independent and substance-induced major depressive disorder on remission and relapse of alcohol, cocaine and heroin dependence. Addiction 2013. [Google Scholar] [CrossRef]
- Magidson, J.F.; Wang, S.; Lejuez, C.W.; Iza, M.; Blanco, C. Prospective study of substance-induced and independent major depressive disorder among individuals with substance use disorders in a nationally representative sample. Depress. Anxiety 2013, 30, 538–545. [Google Scholar] [CrossRef]
- Conner, K.R.; Gamble, S.A.; Bagge, C.L.; He, H.; Swogger, M.T.; Watts, A.; Houston, R.J. Substance-Induced Depression and Independent Depression in Proximal Risk for Suicidal Behavior. J. Stud. Alcohol Drugs 2014, 75, 567–572. [Google Scholar] [CrossRef]
- Foulds, J.A.; Adamson, S.J.; Boden, J.M.; Williman, J.A.; Mulder, R.T. Depression in patients with alcohol use disorders: Systematic review and meta-analysis of outcomes for independent and substance-induced disorders. J. Affect. Disord. 2015, 185, 47–59. [Google Scholar] [CrossRef] [PubMed]
- Preuss, U.W.; Schuckit, M.A.; Smith, T.L.; Danko, G.P.; Dasher, A.C.; Hesselbrock, M.N.; Hesselbrock, V.M.; Nurnberger, J.I. A comparison of alcohol-induced and independent depression in alcoholics with histories of suicide attempts. J. Stud. Alcohol 2002, 63, 498–502. [Google Scholar] [CrossRef] [PubMed]
- Schuckit, M.A.; Tipp, J.E.; Bergman, M.; Reich, W.; Hesselbrock, V.M.; Smith, T.L. Comparison of induced and independent major depressive disorders in 2945 alcoholics. Am. J. Psychiatry 1997, 154, 948–957. [Google Scholar] [CrossRef]
- Schuckit, M.A.; Smith, T.L.; Danko, G.P.; Pierson, J.; Trim, R.; Nurnberger, J.I.; Kramer, J.; Kuperman, S.; Bierut, L.J.; Hesselbrock, V. A comparison of factors associated with substance-induced versus independent depressions. J. Stud. Alcohol Drugs 2007, 68, 805–812. [Google Scholar] [CrossRef] [PubMed][Green Version]
- Cohn, A.M.; Epstein, E.E.; McCrady, B.S.; Jensen, N.; Hunter-Reel, D.; Green, K.E.; Drapkin, M.L. Pretreatment clinical and risk correlates of substance use disorder patients with primary depression. J. Stud. Alcohol Drugs 2011, 72, 151–157. [Google Scholar] [CrossRef] [PubMed]
- Tirado Muñoz, J.; Farré, A.; Mestre-Pintó, J.; Szerman, N.; Torrens, M. Dual diagnosis in Depression: Treatment recommendations. Adicciones 2018, 30, 66–76. [Google Scholar] [CrossRef]
- Raimo, E.B.; Schuckit, M.A. Alcohol dependence and mood disorders. Addict. Behav. 1998, 23, 933–946. [Google Scholar] [CrossRef]
- Muench, C.; Schwandt, M.; Jung, J.; Cortes, C.R.; Momenan, R.; Lohoff, F.W. The major depressive disorder GWAS-supported variant rs10514299 in TMEM161B-MEF2C predicts putamen activation during reward processing in alcohol dependence. Transl. Psychiatry 2018, 8, 131. [Google Scholar] [CrossRef]
- Tawa, E.A.; Hall, S.D.; Lohoff, F.W. Overview of the Genetics of Alcohol Use Disorder. Alcohol Alcohol. 2016, 51, 507–514. [Google Scholar] [CrossRef]
- Lohoff, F.W. Overview of the Genetics of Major Depressive Disorder. Curr. Psychiatry Rep. 2010, 12, 539–546. [Google Scholar] [CrossRef]
- Bland, R.C.; Newman, S.C.; Orn, H. Recurrent and Nonrecurrent Depression. Arch. Gen. Psychiatry 1986, 43, 1085. [Google Scholar] [CrossRef] [PubMed]
- Kendler, K.S.; Kuhn, J.W.; Vittum, J.; Prescott, C.A.; Riley, B. The Interaction of Stressful Life Events and a Serotonin Transporter Polymorphism in the Prediction of Episodes of Major Depression. Arch. Gen. Psychiatry 2005, 62, 529. [Google Scholar] [CrossRef] [PubMed]
- Weissman, M.M. Onset of Major Depression in Early Adulthood. Arch. Gen. Psychiatry 1984, 41, 1136. [Google Scholar] [CrossRef] [PubMed]
- Klein, D.N.; Lewinsohn, P.M.; Rohde, P.; Seeley, J.R.; Durbin, C.E. Clinical features of major depressive disorder in adolescents and their relatives: Impact on familial aggregation, implications for phenotype definition, and specificity of transmission. J. Abnorm. Psychol. 2002, 111, 98–106. [Google Scholar] [CrossRef] [PubMed]
- Lyons, M.J.; Eisen, S.A.; Goldberg, J.; True, W.; Lin, N.; Meyer, J.M.; Toomey, R.; Faraone, S.V.; Merla-Ramos, M.; Tsuang, M.T. A Registry-Based Twin Study of Depression in Men. Arch. Gen. Psychiatry May 1998, 55, 468–472. [Google Scholar] [CrossRef]
- Luo, X.; Kranzler, H.R.; Zuo, L.; Wang, S.; Blumberg, H.P.; Gelernter, J. CHRM2 gene predisposes to alcohol dependence, drug dependence and affective disorders: Results from an extended case–control structured association study. Hum. Mol. Genet. 2005, 14, 2421–2434. [Google Scholar] [CrossRef]
- Wang, J.C.; Hinrichs, A.L.; Stock, H.; Budde, J.; Allen, R.; Bertelsen, S.; Kwon, J.M.; Wu, W.; Dick, D.M.; Rice, J.; et al. Evidence of common and specific genetic effects: Association of the muscarinic acetylcholine receptor M2 (CHRM2) gene with alcohol dependence and major depressive syndrome. Hum. Mol. Genet. 2004, 13, 1903–1911. [Google Scholar] [CrossRef]
- Sjöholm, L.K.; Kovanen, L.; Saarikoski, S.T.; Schalling, M.; Lavebratt, C.; Partonen, T. CLOCK is suggested to associate with comorbid alcohol use and depressive disorders. J. Circadian Rhythm. 2010. [Google Scholar] [CrossRef]
- Tambs, K.; Harris, J.R.; Magnus, P. Genetic and Environmental Contributions to the Correlation Between Alcohol Consumption and Symptoms of Anxiety and Depression. Results from a Bivariate Analysis of Norwegian Twin Data. Behav. Genet. 1997, 27, 241–250. [Google Scholar] [CrossRef]
- Nurnberger, J.I.; Foroud, T.; Flury, L.; Su, J.; Meyer, E.T.; Hu, K.; Crowe, R.; Edenberg, H.; Goate, A.; Bierut, L.; et al. Evidence for a locus on chromosome 1 that influences vulnerability to alcoholism and affective disorder. Am. J. Psychiatry 2001, 158, 718–724. [Google Scholar] [CrossRef]
- Andersen, A.M.; Pietrzak, R.H.; Kranzler, H.R.; Ma, L.; Zhou, H.; Liu, X.; Kramer, J.; Kuperman, S.; Edenberg, H.J.; Nurnberger, J.I.; et al. Polygenic Scores for Major Depressive Disorder and Risk of Alcohol Dependence. JAMA Psychiatry 2017, 74, 1153–1160. [Google Scholar] [CrossRef] [PubMed]
- Gelernter, J.; Kranzler, H.; Sherva, R.; Almasy, L.; Koesterer, R.; Smith, A.; Anton, R.; Preuss, U.; Ridinger, M.; Rujescu, D.; et al. Genome-wide association study of alcohol dependence: Significant findings in African-and European-Americans including novel risk loci. Mol. Psychiatry 2014, 19145, 41–49. [Google Scholar] [CrossRef] [PubMed]
- Treutlein, J.; Cichon, S.; Ridinger, M.; Wodarz, N.; Soyka, M.; Zill, P.; Maier, W.; Moessner, R.; Gaebel, W.; Dahmen, N.; et al. Genome-wide association study of alcohol dependence. Arch. Gen. Psychiatry 2009, 66, 773–784. [Google Scholar] [CrossRef] [PubMed]
- CONVERGE. Consortium Sparse whole genome sequencing identifies two loci for major depressive disorder. Nature 2015, 523, 588–591. [Google Scholar] [CrossRef] [PubMed]
- Okbay, A.; Baselmans, B.M.; De Neve, J.-E.; Turley, P.; Nivard, M.G.; Fontana, M.A.; Meddens, S.F.W.; Linnér, R.K.; Rietveld, C.A.; Derringer, J.; et al. Genetic variants associated with subjective well-being, depressive symptoms and neuroticism identified through genome-wide analyses. Nat. Genet. 2016, 48, 624–633. [Google Scholar] [CrossRef]
- Hyde, C.L.; Nagle, M.W.; Tian, C.; Chen, X.; Paciga, S.; Wendland, J.; Tung, J.; Hinds, D.; Perlis, R.; Winslow, A. Identification of 15 genetic loci associated with risk of major depression in individuals of European descent. Nat. Genet. 2017, 48, 1031–1036. [Google Scholar] [CrossRef]
- Balliet, W.E.; Edwards-Hampton, S.; Borckardt, J.J.; Morgan, K.; Adams, D.; Owczarski, S.; Madan, A.; Galloway, S.K.; Serber, E.R.; Malcolm, R. Depressive symptoms, pain, and quality of life among patients with nonalcohol-related chronic pancreatitis. Pain Res. Treat. 2012. [Google Scholar] [CrossRef]
- Edwards, A.C.; Aliev, F.; Bierut, L.J.; Bucholz, K.K.; Edenberg, H.; Hesselbrock, V.; Kramer, J.; Kuperman, S.; Nurnberger, J.I.; Schuckit, M.A.; et al. Genome-wide association study of comorbid depressive syndrome and alcohol dependence. Psychiatr. Genet. 2012, 22, 31–41. [Google Scholar] [CrossRef]
- Edwards, A.C. Challenges in the Study of Genetic Variants of Comorbid Alcohol Use Disorder and Major Depression. JAMA Psychiatry 2017, 74, 1193–1194. [Google Scholar] [CrossRef]
- Zhou, H.; Polimanti, R.; Yang, B.-Z.; Wang, Q.; Han, S.; Sherva, R.; Nuñez, Y.Z.; Zhao, H.; Farrer, L.A.; Kranzler, H.R.; et al. Genetic Risk Variants Associated With Comorbid Alcohol Dependence and Major Depression. JAMA Psychiatry 2017, 74, 1234–1241. [Google Scholar] [CrossRef]
- American Psychiatric Association. DSM-IV TR. Manual Diagnóstico y Estadístico de los Trastornos Mentales; Masson: Barcelona, Spain, 2002. [Google Scholar]
- Hasin, D.S.; Samet, W.E.; Nunes, J.; Meydan, K.; Matseoane, B.A.R.; Waxman, B.A. Diagnosis of Comorbid Psychiatric Disorders in Substance Users Assessed With the Psychiatric Research Interview for Substance and Mental Disorders for DSM-IV. Am. J. Psychiatry 2006, 163, 689–696. [Google Scholar] [CrossRef] [PubMed]
- Torrens, M.; Serrano, D.; Astals, M.; Pérez-Domínguez, G.; Martín-Santos, R. Diagnosing comorbid psychiatric disorders in substance abusers: Validity of the Spanish versions of the psychiatric research interview for substance and mental disorders and the structured clinical interview for DSM-IV. Am. J. Psychiatry 2004, 161, 1231–1237. [Google Scholar] [CrossRef] [PubMed]
- Lobo, A.; Chamorro, L.; Luque, A.; Dal-Ré, R.; Badia, X.; Baró, E.; Lacámara, C.; González-Castro, G.; Gurrea-Escajedo, A.; Elices-Urbano, N.; et al. Validation of the Spanish versions of the Montgomery-Asberg Depression and Hamilton Anxiety Rating Scales. Med. Clin. 2002, 118, 493–499. [Google Scholar] [CrossRef]
- Bonicatto, S.; Dew, A.M.; Soria, J.J. Analysis of the psychometric properties of the Spanish version of the Beck Depression Inventory in Argentina. Psychiatry Res. 1998, 79, 277–285. [Google Scholar] [CrossRef]
- Beck, A.T.; Kovacs, M.; Weissman, A. Assessment of suicidal intention: The Scale for Suicide Ideation. J. Consult. Clin. Psychol. 1979, 47, 343–352. [Google Scholar] [CrossRef] [PubMed]
- Hamilton, M. The assessment of anxiety states by rating. Br. J. Med. Psychol. 1959, 32, 50–55. [Google Scholar] [CrossRef]
- Spielberger, C.D. Manual for the State-Trait Anxiety Inventory (STAI Form Y). 1983. Available online: https://doi.org/10.1002/9780470479216.corpsy0943 (accessed on 29 April 2020).
- Cloninger, R.C. The Temperament and Character Inventory (TCI): A Guide to Its Development and Use; Center for Psychobiology of Personality, Washington University: St. Louis, MO, USA, 1994; ISBN 978-0-9642917-1-3. [Google Scholar]
- Wolf, J.P.; Kimerling, R. PsycNET Record Display—PsycNET. In Assessing Psychological Trauma and PTSD; Wilson, J.P., John, P., Keane, T.M., Eds.; The Guilford Press: New York, NY, USA, 1997; pp. 192–238. [Google Scholar]
- Kok, T.; De Haan, H.; Van Der Meer, M.; Najavits, L.; De Jong, C. Assessing traumatic experiences in screening for PTSD in substance use disorder patients: What is the gain in addition to PTSD symptoms? Psychiatry Res. 2015, 226, 328–332. [Google Scholar] [CrossRef]
- Enoch, M.-A. The Role of Early Life Stress as a Predictor for Alcohol and Drug Dependence. Psychopharmacology 2011, 214, 17–31. [Google Scholar] [CrossRef]
- Noori, H.R.; Helinski, S.; Spanagel, R. Cluster and meta-analyses on factors influencing stress-induced alcohol drinking and relapse in rodents. Addict. Biol. 2014, 19, 225–232. [Google Scholar] [CrossRef]
- Reilly, M.T.; Noronha, A.; Goldman, D.; Koob, G.F. Genetic studies of alcohol dependence in the context of the addiction cycle. Neuropharmacology 2017, 122, 3–21. [Google Scholar] [CrossRef]
- Gilpin, N.W.; Weiner, J.L. Neurobiology of comorbid post-traumatic stress disorder and alcohol-use disorder. Genes Brain Behav. 2017, 16, 15–43. [Google Scholar] [CrossRef] [PubMed]
- Mannelli, P.; Pae, C.U. Medical comorbidity and alcohol dependence. Curr. Psychiatry Rep. 2007, 9, 217–224. [Google Scholar] [CrossRef] [PubMed]
- American Psychiatric Association. DSM 5. Manual Diagnóstico y Estadístico de Los Trastornos Mentales; Masson: Barcelona, Spain, 2013; ISBN 9788498358100. [Google Scholar]
- Calder, P.C.; Albers, R.; Antoine, J.-M.; Blum, S.; Bourdet-Sicard, R.; Ferns, G.A.; Folkerts, G.; Friedmann, P.S.; Frost, G.S.; Guarner, F.; et al. Inflammatory Disease Processes and Interactions with Nutrition. Br. J. Nutr. 2009, 101, 1–45. [Google Scholar] [CrossRef] [PubMed]
- Swanson, G.R.; Sedghi, S.; Farhadi, A.; Keshavarzian, A. Pattern of Alcohol Consumption and its Effect on Gastrointestinal Symptoms in Inflammatory Bowel Disease. Alcohol 2010, 44, 223–228. [Google Scholar] [CrossRef] [PubMed]
- Alías-Ferri, M.; García-Marchena, N.; Mestre-Pintó, J.I.; Araos, P.; Vergara-Moragues, E.; Fonseca, F.; González-Saiz, F.; Rodríguez de Fonseca, F.; Torrens, M.; Group, N. Trastorno por uso de cocaína y depresión: Cuando el diagnóstico clínico no es suficiente. Adicciones 2020. [Google Scholar] [CrossRef]
- Levchuk, L.A.; Meeder, E.M.G.; Roschina, O.V.; Loonen, A.J.M.; Boiko, A.S.; Michalitskaya, E.V.; Epimakhova, E.V.; Losenkov, I.S.; Simutkin, G.G.; Bokhan, N.A.; et al. Exploring Brain Derived Neurotrophic Factor and Cell Adhesion Molecules as Biomarkers for the Transdiagnostic Symptom Anhedonia in Alcohol Use Disorder and Comorbid Depression. Front. Psychiatry 2020, 11. [Google Scholar] [CrossRef]
- Destoop, M.; Morrens, M.; Coppens, V.; Dom, G. Addiction, Anhedonia, and Comorbid Mood Disorder. A Narrative Review. Front. Psychiatry 2019, 10, 311. [Google Scholar] [CrossRef]
- Batalla, A.; Homberg, J.R.; Lipina, T.V.; Sescousse, G.; Luijten, M.; Ivanova, S.A.; Schellekens, A.F.A.; Loonen, A.J.M. The role of the habenula in the transition from reward to misery in substance use and mood disorders. Neurosci. Biobehav. Rev. 2017, 80, 276–285. [Google Scholar] [CrossRef]
- Becker, A.; Ehret, A.M.; Kirsch, P. From the neurobiological basis of comorbid alcohol dependence and depression to psychological treatment strategies: Study protocol of a randomized controlled trial. BMC Psychiatry 2017, 17. [Google Scholar] [CrossRef]
- Felger, J.C.; Treadway, M.T. Inflammation Effects on Motivation and Motor Activity: Role of Dopamine. Neuropsychopharmacology 2017, 42, 216–241. [Google Scholar] [CrossRef]
- Fuster, D.; Samet, J.H. Alcohol use in patients with chronic liver disease. N. Engl. J. Med. 2018, 379, 1251–1261. [Google Scholar] [CrossRef] [PubMed]
- Le Strat, Y.; Le Foll, B.; Dubertret, C. Major depression and suicide attempts in patients with liver disease in the United States. Liver Int. 2015, 35, 1910–1916. [Google Scholar] [CrossRef] [PubMed]
- Huang, X.; Liu, X.; Yu, Y. Depression and chronic liver diseases: Are there shared underlying mechanisms? Front. Mol. Neurosci. 2017, 10, 134. [Google Scholar] [CrossRef] [PubMed]
- Aoun, E.G.; Lee, M.R.; Haass-Koffler, C.L.; Swift, R.M.; Addolorato, G.; Kenna, G.A.; Leggio, L. Relationship between the thyroid axis and alcohol craving. Alcohol Alcohol. 2015, 50, 24–29. [Google Scholar] [CrossRef] [PubMed]
- Liappas, I.; Piperi, C.; Malitas, P.N.; Tzavellas, E.O.; Zisaki, A.; Liappas, A.I.; Kalofoutis, C.A.; Boufidou, F.; Bagos, P.; Rabavilas, A.; et al. Interrelationship of hepatic function, thyroid activity and mood status in alcohol-dependent individuals. In Vivo 2006, 20, 293–300. [Google Scholar]
- Hermann, D.; Heinz, A.; Mann, K. Dysregulation of the hypothalamic-pituitary-thyroid axis in alcoholism. Addiction 2002, 97, 1369–1381. [Google Scholar] [CrossRef]
- Lee, H.-S.; Lee, A.T.; Criswell, L.A.; Seldin, M.F.; Amos, C.I.; Carulli, J.P.; Navarrete, C.; Remmers, E.F.; Kastner, D.L.; Plenge, R.M.; et al. Several regions in the major histocompatibility complex copnfer risk for anti-CCP-antibody positive rheumatoid arthritis, independent of the DRB1 locus. Mol. Med. 2008, 14, 293–300. [Google Scholar] [CrossRef]
- Nejentsev, S.; Howson, J.M.M.; Walker, N.M.; Szeszko, J.; Field, S.F.; Stevens, H.E.; Reynolds, P.; Hardy, M.; King, E.; Masters, J.; et al. Localization of type 1 diabetes susceptibility to the MHC class I genes HLA-B and HLA-A. Nature 2007, 450, 887–892. [Google Scholar] [CrossRef]
- Farré, A.; Tirado-Muñoz, J.; Torrens, M. Dual Depression: A Sex Perspective. Addict. Disord. Their Treat. 2017, 16, 180–186. [Google Scholar] [CrossRef]
- Labaka, A.; Goñi-Balentziaga, O.; Lebeña, A.; Pérez-Tejada, J. Biological Sex Differences in Depression: A Systematic Review. Biol. Res. Nurs. 2018, 20, 383–392. [Google Scholar] [CrossRef]


| Sample Characteristics | Primary MD | AI-MD | pa |
|---|---|---|---|
| N = 47 (%) | N = 33 (%) | ||
| Age (Mean ± SD) | 49.87 ± 11.32 | 50.39 ± 8.89 | 0.140 b |
| Gender | 0.678 | ||
| Men | 22 (46.8) | 17 (51.5) | |
| Women | 25 (53.2) | 16 (48.5) | |
| Household structure | 0.736 | ||
| Alone | 14 (29.8) | 11(33.3) | |
| With others | 33 (70.2) | 22(66.7) | |
| Education level | 0.041 | ||
| Primary or Secondary education | 20 (42.6) | 21 (65.6) | |
| Upper secondary education | 27(57.4) | 11 (34.4) | |
| Employment situation | 0.271 | ||
| Employed | 16 (34) | 6 (18.8) | |
| Unemployed | 1 (2.1) | 0 | |
| Disability | 27 (57.4) | 25 (78.1) | |
| Retired | 3 (6.4) | 1 (3.1) | |
| Medical comorbidities | |||
| Serious illness (SI) | 14 (29.8) | 18 (54.5) | 0.026 * |
| Hospitalization due to SI c | 14 (100) | 17 (94.4) | 0.370 |
| Current medication d | 46 (100) | 29 (96.7) | 0.213 |
| Family History | |||
| Depression e | 35(79.5) | 17(56.7) | 0.042 * |
| Alcohol use disorder f | 13 (28.3) | 16(53.3) | 0.033 * |
| Substance use disorder g | 4 (8.7) | 10(31.3) | 0.016 * |
| Variables | Primary MD | AI-MD | pa |
|---|---|---|---|
| N = 47 (Mean ± SD/Mean (%)) | N = 33 (Mean ± SD/Mean (%)) | ||
| Age onset depression (years) | 37.64 (13.53) | 39.18 (11.26) | 0.593 |
| HAM-D | 15.64 ± 10.34 | 11.88 ± 7.54 | 0.79 |
| BDI | 22.37 ± 14.65 | 23.41 ± 11.59 | 0.739 |
| SSI | 11.68 ± 8.12 | 12.36 ± 8.48 | 0.156 |
| HAM-A | 25.22 ± 14.32 | 25.67 ± 12 | 0.884 |
| STAI | |||
| STAI- State | 28.17± 13.82 | 27.44 ± 13.78 | 0.817 |
| STAI- Trait | 30.00 ± 13.16 | 32.28 ± 11.17 | 0.425 |
| LSC-R | 9.30 (7.38) | 14.21 (11.35) | 0.021 * |
| Personality Dimensions | |||
| Temperament | |||
| Novelty seeking (NS) | 47.38± 11.07 | 50.84 ± 9.89 | 0.172 |
| Harm avoidance (HA) | 54.60 ± 11.82 | 60.87 ± 11.61 | 0.415 |
| Reward dependence (RD) | 43.57 ± 9.65 | 45.68 ± 10.66 | 0.381 |
| Persistence (PS) | 44.45 ± 9.92 | 47.55 ± 11.62 | 0.224 |
| Character | |||
| Self-directedness (SD) | 42.33 ± 11.92 | 39.61 ± 11.12 | 0.325 |
| Cooperativeness (CO) | 45.14 ± 11.42 | 45 ± 12.22 | 0.959 |
| Self-transcendence (ST) | 48.74 ± 10.57 | 50.35 ± 11.53 | 0.536 |
| Depression Criteria | |||
| Criteria 1: depressed mood | 46 (97.9) | 32 (94.1) | 0.377 |
| Criteria 2: diminished interest or pleasure | 46 (97.9) | 28 (82.4) | 0.014 * |
| Criteria 3: significant unintentional weight loss or gain | 34 (72.3) | 31 (91.2) | 0.036 * |
| Criteria 4: insomnia or sleeping too much | 43 (91.5) | 27 (79.4) | 0.117 |
| Criteria 5: agitation or psychomotor retardation | 34 (72.3) | 22 (64.7) | 0.463 |
| Criteria 6: fatigue | 44 (93.6) | 27 (79.4) | 0.055 |
| Criteria 7 feelings of worthlessness or excessive guilt | 43 (91.5) | 28 (82.4) | 0.217 |
| Criteria 8: diminished ability to think or concentrate | 46 (97.9) | 27 (79.4) | 0.006 * |
| Criteria 9: recurrent thoughts of death | 30 (63.8) | 10 (29.4) | 0.002 * |
| Biochemical Paramaters | Subjects with Abnormal Values * | p | |
|---|---|---|---|
| Primary MD | AI-MD | ||
| (Normal Values) | N (%) | N (%) | |
| TSH a (10–38 mcUI/mL) | 0 | 4 (12.5) | 0.016 ** |
| Bilirubin b (0.2–1.2 mg/dL) | 2 (5) | 4 (12.1) | 0.270 |
| AST c (UI/L) 10–38 UI/L | 4 (9.3) | 17 (51.5) | <0.001 ** |
| ALT d (UI/L) 7–41 UI/L | 14 (32.6) | 26 (76.5) | <0.001 ** |
| ALP e (40–129 UI/L) | 3 (8.6) | 9 (27.3) | 0.043 ** |
| GGT f (8–61 UI/L) | 11 (32.4) | 26 (78.8) | <0.001 ** |
| Cholesterol g (50–129 mg/dL) | 25 (59.5) | 16 (48.5) | 0.340 |
| Triglycerides h (40–150 mg/dL) | 14 (33.3) | 7 (21.9) | 0.279 |
| CRP i (0–0.8 mg/dL) | 13 (31.7) | 15 (57.7) | 0.378 |
| SNP | Gene | Function | Probeset ID | Genotype Category |
|---|---|---|---|---|
| rs3130531 | intergenic | AX-11435435 | PolyHighResolution | |
| rs7772901 | PDE10A | intron variant | AX-11644567 | PolyHighResolution |
| rs73115241 | intergenic | AX-13511810 | PolyHighResolution | |
| rs386580033 | PSORS1C1 | intron variant | AX-35729741 | PolyHighResolution |
| rs529060937 | PSORS1C1 | intron variant | AX-35729743 | PolyHighResolution |
© 2020 by the authors. Licensee MDPI, Basel, Switzerland. This article is an open access article distributed under the terms and conditions of the Creative Commons Attribution (CC BY) license (http://creativecommons.org/licenses/by/4.0/).
Share and Cite
Farré, A.; Tirado, J.; Spataro, N.; Alías-Ferri, M.; Torrens, M.; Fonseca, F. Alcohol Induced Depression: Clinical, Biological and Genetic Features. J. Clin. Med. 2020, 9, 2668. https://doi.org/10.3390/jcm9082668
Farré A, Tirado J, Spataro N, Alías-Ferri M, Torrens M, Fonseca F. Alcohol Induced Depression: Clinical, Biological and Genetic Features. Journal of Clinical Medicine. 2020; 9(8):2668. https://doi.org/10.3390/jcm9082668
Chicago/Turabian StyleFarré, Adriana, Judit Tirado, Nino Spataro, María Alías-Ferri, Marta Torrens, and Francina Fonseca. 2020. "Alcohol Induced Depression: Clinical, Biological and Genetic Features" Journal of Clinical Medicine 9, no. 8: 2668. https://doi.org/10.3390/jcm9082668
APA StyleFarré, A., Tirado, J., Spataro, N., Alías-Ferri, M., Torrens, M., & Fonseca, F. (2020). Alcohol Induced Depression: Clinical, Biological and Genetic Features. Journal of Clinical Medicine, 9(8), 2668. https://doi.org/10.3390/jcm9082668