Article

N2O and CO2 Emissions from Bare Soil: Effect of Fertilizer Management

1
Department of Agricultural Chemistry, Institute of Agriculture, Warsaw University of Life Science-SGGW, Nowoursynowska 159, 02-766 Warsaw, Poland
2
Department of Economics and Organisation of Enterprises, Warsaw University of Life Sciences—SGGW, Nowoursynowska 166, 02-787 Warsaw, Poland
*
Author to whom correspondence should be addressed.
Agriculture 2020, 10(12), 602; https://doi.org/10.3390/agriculture10120602
Submission received: 24 October 2020 / Revised: 1 December 2020 / Accepted: 2 December 2020 / Published: 4 December 2020
(This article belongs to the Special Issue Impact of Climate Change on Agriculture)

Abstract

:
The paper presents the results of a laboratory experiment focused on the assessment of the effect of different methods of application of ammonium nitrate (TD—top dressing and DP—deep placement) on N2O and CO2 emissions from soil without crop cover. Nitrogen application increased soil N2O–N fluxes by 24.3–46.4%, compared to untreated soil (NIL). N2O–N emissions from TD treatment were higher by 12.7%, compared to DP treatment. Soil CO2–C fluxes from DP treatment were significantly higher by 17.2%, compared to those from NIL treatment. Nonetheless, the differences between soil CO2–C fluxes from DP and TD treatments, as well as from TD and NIL treatments, were of no statistical significance. The cumulative greenhouse gas (GHG) emissions (a sum of cumulative soil emissions of CO2–C and N2O–N after conversion to the equivalent of CO2–C) from both N-fertilized soils were similar, and higher by 20% than from untreated soil. The obtained data show that the effect of reduction of N2O–N soil emissions gained by deep placement of nitrogen fertilizer was completely lost through an increase in CO2–C emissions from the soil. This suggests that deep placement of nitrogen fertilizers in sandy soil without crop cover might not lead to a mitigation of soil GHG emissions.

1. Introduction

Compared to conventional fertilization and cultivation, a deep placement of nitrogen fertilizers provides an alternative method of fertilization, allowing for effective plant nutrition in a later grow stage of plants [1]. Deep placement of nitrogen fertilizers seems to be a promising method of mitigation of N2O–N soil emission [2,3]. Gaihre et al. [4] showed that N2O–N emissions from soil with deep-placed urea were lower by up to 80% than from top-dressed soil. Chatterjee et al. [5] argued that deep placement of nitrogen could reduce N2O–N emissions, since a larger fraction of fertilizer nitrogen can be maintained in the soil for a longer period. According to Chapuis-Lardy et al. [6], a reduction of soil N2O–N emission results from N2O microbial consumption. Rutkowska et al. [7] evaluated the effect of deep nitrogen placement on N2O–N soil emissions from C-poor light sandy soils on four experiments conducted in different regions of Poland. In this study, deep fertilizer placement mitigated the soil emission of N2O–N, although the reductions of soil N2O emission were lower than those described in the literature. Adviento-Borbe and Linquist [8] observed no significant differences in N2O–N soil emissions between broadcasting and deep placement of nitrogen in the soil, whereas Linquist et al. [9] reported that nitrogen deep placement promoted N2O–N emissions. These inconsistent results may be explained by differences in the source and amount of N fertilizer and interactions between the soil and weather conditions [10]. N2O–N is formed as a result of microbiological processes: denitrification and nitrification, as well as abiotic chemodenitrification. Denitrification is carried out by heterotrophic bacteria that use nitrate (NO3) or nitrite (NO2) as alternative electron acceptors. Although denitrification is one of the sources of N2O–N in the soil, Ruser et al. [11] explained a decrease in N2O–N emissions by a switch to N2 at high soil moisture conditions. On the other hand, denitrification is limited in well-drained sandy soils. Nitrification is performed under aerobic conditions by chemoautotrophy, using NH3–N as an energy source which can produce N2O–N by nitrifier nitrification, nitrifier denitrification, or nitrification-coupled denitrification [12,13]. According to Sánchez-Martín et al. [14], in C-poor and C-rich soils, respectively, the nitrifier denitrification and coupled nitrification–denitrification constitute the principal sources of N2O–N. Generally, optimum conditions for N2O–N emissions via denitrification occur at water-filled pore space (WFPS) of 70–90%, whereas N2O–N emissions at lower WFPS are caused by nitrification [13].
The divergent assessments of the influence of different ways of nitrogen application on N2O–N soil emissions are probably shaped by extreme weather conditions. Atypical meteorological conditions (long-term and short-term drought/flood) occurring during the growing season constitute manifestations of the global climate change. Floods resulting from heavy rainfall were observed in Central Poland at the turn of May and June 2013 [15], contrary to drought in 2012 [16]. The level of precipitation influences the N cycle in the environment through impacting on the intensity of nitrogen leach from the soil. Prior evaluation evidenced a two-fold elevation of the nitrogen leaching in the year of heavy rainfall, compared to a year with rainfall and multi-year average, notwithstanding the fertilization system [17]. In 2015, the Institute of Soil Science and Plant Cultivation—State Research Institute (IUNG-PIB) reported very low values of climatic water balance in three Polish voivodeships (Mazowieckie, Podlaskie, and Lubelskie—Central and Eastern Poland). However, in 2019, such conditions were found on 57.2% of the arable land in all sixteen Polish voivodeships [18]. In 2020, a long-term drought occurred over the spring. Despite favorable meteorological conditions prior to, or after, the atypical meteorological phenomena, the latter can result in a reduction of yields by up to 40% [18], or even in crop loss. Under these conditions, the soils may be left without plant cover, or low-yielding plants might be unable to uptake the fertilizer nitrogen applied in doses adjusted to a high yielding potential. Therefore, even a large amount of fertilizing nitrogen may remain in the soil during the growing season unused by the plants. It can lead to oversize N2O–N soil emissions or N leaching. Fertilization leads to an increase in CO2–C soil respiration [19,20]. Microbial N cycling processes are associated with enhanced microbial carbon metabolism in the soil [21]; therefore, excessive content of mineral N in the soil could result in elevated CO2–C soil emissions. On the other hand, it could be expected that, in conditions of entire or partial yield loss, soil respiration would be reduced because of reduced root respiration. Relatively low CO2–C soil fluxes over the growing season are observed at the emergence stage, as a consequence of absence of roots [22,23], and over plant maturating and senescence, due to a decrease in plant physiological activity [24].
Atypical weather conditions, which affect the plant growth and yielding, are expected to occur more frequently in the future. Nonetheless, insufficient evidence is published to characterize the impact of different methods of N application on the N2O–N and CO2–C emissions from the soil without crop cover. We hypothesized that deep placement of nitrogen fertilizers might decrease the N2O–N and CO2–C emissions from the soil without crop cover. The aim of this study was to evaluate the effects of deep placement of N-fertilizer on N2O–N and CO2–C soil emissions under the conditions of lacking plant cultivation.

2. Materials and Methods

2.1. Laboratory Experiment

The laboratory experiment was carried out over 51 days in an air-conditioned laboratory at a temperature of 22 °C at the Warsaw University of Life Sciences—SGGW. The soil was collected up to 25 cm depth (ploughing soil layer) from five replications of the experimental treatment of a long-term experiment in Skierniewice (51°96′60″ N, 20°16′63″ E). In the treatment, mineral fertilizers were applied annually at the following rates: 90 kg N ha−1 (ammonium nitrate); 26 kg P ha−1 (triple superphosphate); 91 kg K ha−1 (potassium chloride 50%). In the long-term experiment, since 1923, plants have been cultivated in a five-crop rotation: potatoes (30 t manure ha−1), spring barley, yellow lupine, winter wheat, and rye (the soil was collected in the autumn, after rye). In the long-term experiment, a conventional ploughing soil tillage was used. The soil was loamy sand with the following fractions in the 0–25 cm layer: 87% sand (>0.05 mm), 5% silt (0.002–0.05 mm), and 7% clay (<0.02 mm). The content of soil organic carbon and total nitrogen was as follows: 7.35 g C kg−1 ± 0.15 standard deviation (SD) and 0.71 g N kg−1 ± 0.02 SD, respectively, and soil NO3–N content was 8.50 mg NO3–N kg−1 ± 0.55 SD (the average from five replications). The soil pH in 1 M KCl was 5.8 (with the range between 5.7 and 6.0 pH).
After air-drying and sieving through a mesh of 5 mm, 8 kg of the soil was placed in polyvinyl chloride (PVC) pots. The pots used for the experiment were 20 cm in height with an inside top and bottom diameter of 22 cm and 19 cm, respectively. The pot experiment was conducted in three repetitions, in a fully random system. No plants were cultivated. Over the study period, each pot was weighed daily, and any lost moisture replenished with distilled water to maintain soil moisture content at 60% WFPS. Two days after the first irrigation, the non-fertilized treatment (NIL) and N-fertilized treatments were established. Nitrogen was applied in the fertilized treatments at a dose of 1 g N per pot, in the form of ammonium nitrate (34% N). As we decided to test the nitrogen fertilizer that is most prevalent in Poland, we evaluated the effects of the application of ammonium nitrate, which remains the fertilizer used the most in our agrotechnical and soil conditions, irrespective of a noticeable increase in the urea consumption [25]. The fertilizer was scattered on the surface of soil (top dressing—TD treatment) or applied at a depth of 10 cm (deep placement—DP treatment), which can be extrapolated to 26.31 g N m−2 and 263 kg N ha−1 in field conditions. The extrapolation of the experimental dose of nitrogen to the area of 1 m2 and 1 ha was made assuming that 1 g of N was applied to the pot area of 0.038 m2. Such doses of nitrogen are currently applied in the cultivation of maize on the Polish soil and agricultural conditions. Therefore, we decided to use similarly high nitrogen doses in the laboratory experiment.

2.2. N2O–N and CO2–C Emissions

N2O–N and CO2–C emissions from the soil were measured in situ by means of infrared spectroscopy using a portable FTIR spectrometer, model Alpha (Bruker, Optic GmbH, Ettlingen, Germany). The measurements of N2O–N and CO2–C emission was taken before, and a day after, soil nitrogen fertilization, and were continued weekly for the next 51 days (nine test dates) in all replications of the experimental treatments. The emission of N2O–N and CO2–C (F) from the soil was calculated as an increase in the amount of N2O–N and CO2–C in the measurement chamber (ø = 16 cm, h = 18.5 cm) after 10 min exposure to the soil surface according to the equation presented by Burton et al. [26]:
F = Δ C Δ t · V c   · Mmol A   · Vmol
where: ΔC/Δt is the rate of change in N2O–N or CO2–C concentration inside the chamber, A is the surface area of the chamber, Vc is the total volume of the chamber corrected by temperature, Mmol is molar mass of N2O–N or CO2–C, and Vmol is the molar volume of N2O–N or CO2–C inside the chamber, corrected by air temperature using the ideal gas law. N2O–N and CO2–C emissions from soil were expressed in μg N2O–N m−2 h−1 and mg CO2–C m−2 h−1, respectively. Cumulative emissions of N2O–N and CO2–C (i.e., mg N2O–N m−2 and g CO2–C m−2) were calculated by linear interpolation between two close sampling dates and the numerical integration of the function over time, assuming that fluxes changed linearly among sampling days [27]. The correction for background cumulative N2O–N emissions from nitrogen fertilized treatments were calculated as the difference between the cumulative emissions from the TD or DP and NIL treatments: i.e., cumulative N2O–N emissions from TD—cumulative N2O–N emissions from NIL, and cumulative N2O–N emissions from DP – cumulative N2O–N emissions from NIL.
Carbon dioxide equivalent (CO2eq) for N2O emission was calculated from Global Warming Potential [28], according to the formula: CO2eq = N2O · 298.

2.3. Soil Analysis

Soil NO3–N content was measured at the beginning and (separately in the soil layers: 0–10 cm and 10–20 cm) at the end of the experiment, by means of the Skalar San Plus analyzer (Skalar Analytical BV, Breda, Netherlands), after fresh soil extraction in 0.01 mol CaCl2 dm−3 with a soil/extractant weight ratio of 1:10. The same soil samples were subject to extraction of dissolved organic carbon (DOC) in accordance with the methodologies described by Zsolnay [29]. The soil samples were extracted in 0.01 mol CaCl2 dm−3. The weight ratio of soil to extraction solution was 1:2, and the extraction time was 10 min. Total organic carbon (TOC) content in the soil and soil DOC content were measured by means of the Thermo Electron-C TOC-500 (Shimadzu, Kyoto, Japan). Soil total nitrogen (TN) content was measured using a Vapodest VAP 30 analyzer (Gerhardt, Bonn, Germany).

2.4. Statistical Analysis

To determine statistically significant differences between treatments (at p < 0.05), one-way analysis of variance (ANOVA) was carried out. Homogeneous groups for the examined treatments were determined by Tukey’s (HSD) multiple-comparison test. Data had been previously tested for normality distribution by a Shapiro–Wilk’s test, and for homoscedasticity by Levene’s test. Statistical analyses were carried out with the application of the Statistica PL 13.3 software (Tulsa, OKLA, USA).

3. Results and Discussion

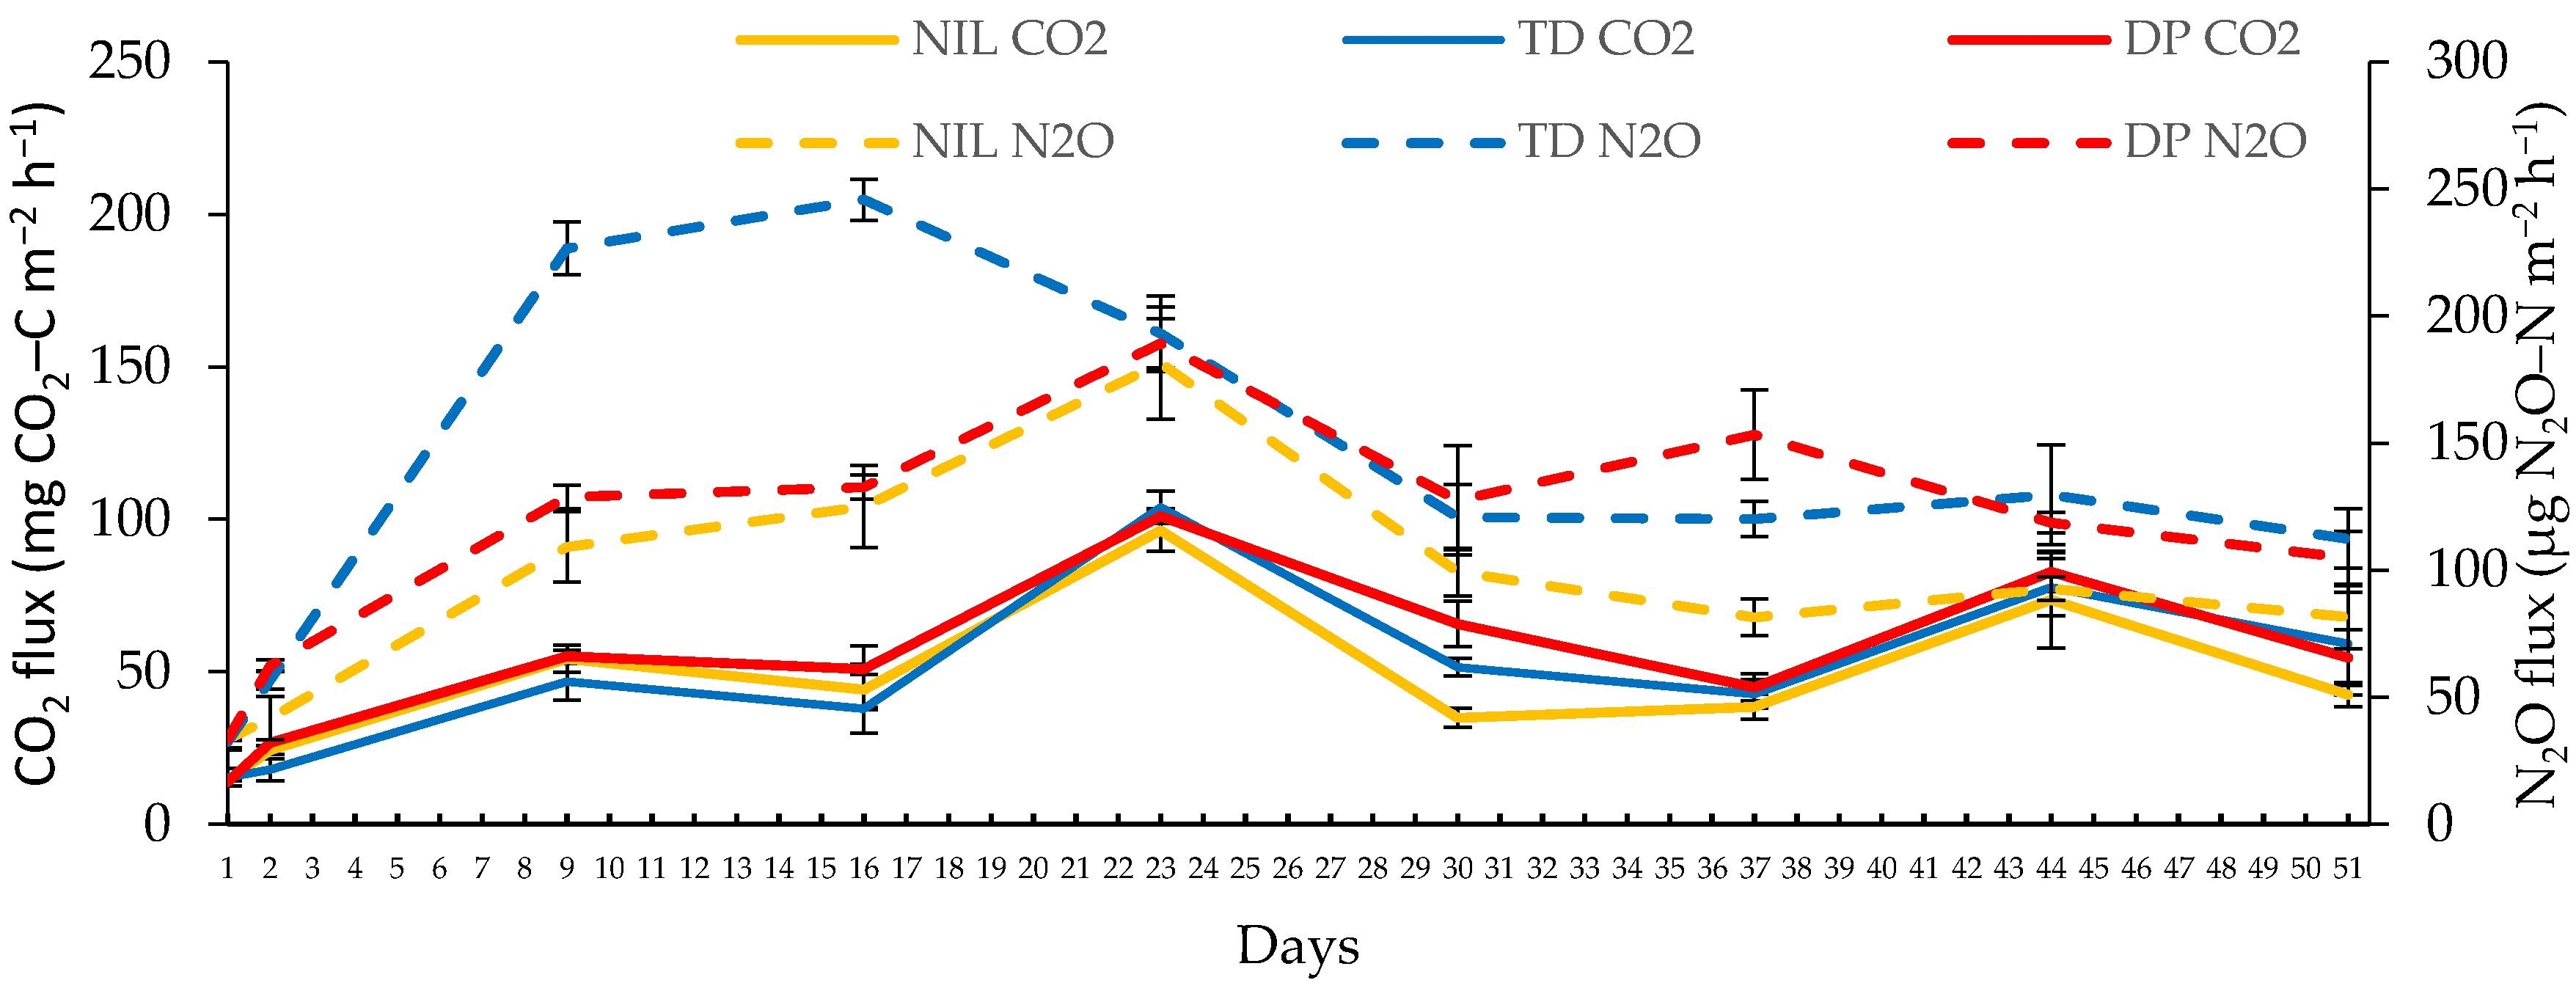
3.1. Soil N2O–N Fluxes

The measured soil N2O–N fluxes over the study period are presented in Figure 1. Soil N2O–N fluxes from all treatments before ammonium nitrate application on the first day (D1) of study were similar. Differences in measured fluxes became noticeable on D2. Compared to NIL treatment and DP treatment, scattering of ammonia nitrate on the soil (TD treatment) resulted in a significant (p < 0.05) increase in the measured soil N2O–N flux as early as on D2. On D9, the measured N2O–N soil flux from TD treatment was more than twofold higher than from NIL treatment, and approximately 76% higher than from DP treatment. A substantial impact of NH4NO3 top dressing on the measured N2O–N soil fluxes was also observed on D16, when soil N2O–N emissions from TD treatment reached a maximum. Soil N2O–N emissions from NIL and DP treatments peaked one week later (D23). That suggests that deep N-fertilizer placement may delay and reduce the N2O–N emissions from the soil. After the peak of N2O–N emissions, the amount of nitrous oxide emitted from both N-fertilized soils showed a decreasing pattern until D30, followed by an increase, which resulted in second, smaller peaks reached by DP and TD treatments on D37 and D44, respectively. The N2O–N emissions from NIL treatment followed a pattern similar to those from TD treatment; however, the measured fluxes from NIL were significantly lower. The observed changes in N2O–N emissions from the tested soils could be caused by an increase in the microbial activity of the soil and, also, to some extent, by changes in natural soil compaction during the experiment.
Measured N2O–N fluxes over the study periods showed a high variability, with a range of 30.2–254.8 µg N m−2 h−1 from TD treatment, 29.5–200.2 µg N m−2 h−1 from DP treatment, and 33.0–206.7 µg N m−2 h−1 from NIL treatment (Table 1). The determined high variability of soil N2O–N emission patterns over the study period seems to be typical of this process [30]. Measured N2O–N fluxes from the soil treated with ammonium nitrate significantly (p < 0.05) exceeded (approximately by 24.3 and 46.4% on the DP and TD treatments, respectively) those from NIL (Table 1). The cumulative soil N2O–N emissions from soils under TD and DP treatments were significantly (p < 0.05) higher, by 26.9% and 42.9%, than those from NIL treatment (Table 1). Several authors indicated that N-fertilization increased N2O–N emissions of the soil [6,31,32,33]. The significant (p < 0.05) impact of ammonium nitrate application on N2O–N emission evidenced in our study is similar to experimental results obtained by Bouwman et al. [34], van Groenigen et al. [35], and Meng et al. [36], who observed a significant increase in N2O–N emissions from the soil, particularly at high doses of nitrogen (200–300 kg N ha−1).
We observed a limited transformation of the fertilizer nitrogen into N2O–N. Corrected for background cumulative soil, N2O–N emissions from TD and DP treatments were low, and accounted for 0.22% and 0.14% of applied N, respectively. In several studies, differing in the soil and atmospheric conditions, plant cover, nitrogen fertilizers, or nitrogen leaching, N2O–N emissions from agricultural soils were found to vary between 0.05% and 15.54% of applied nitrogen [37,38,39,40]. Upon the TD and DP treatments, the measured N2O–N losses from the estimated load of 263 kg N ha−1 equaled, respectively, 0.58 kg and 0.37 kg N ha−1. Our experiment, however, lasted only 51 days, a fraction of the growing period in Central Poland. The emission of N2O–N from TD and DP treatments extrapolated to the full growing period (March to November, i.e., approximately 210–220 days) reached 2.50 kg and 1.59 kg per ha (i.e., 0.6–0.95% of nitrogen applied per ha). Our earlier laboratory experiment showed that N2O–N emission from soil without mineral fertilization was 0.77 kg N2O–N ha−1 [41]. Therefore, it can be expected that the total soil N2O–N emission from the TD and DP treatments during the growing period would reach a maximum of 3.27 kg and 2.36 kg N2O–N ha−1, respectively.
According to Zhu et al. [13], in soils where nitrifier denitrification is the dominant pathway of N2O–N production, application of ammoniacal fertilizer results in higher N2O–N emissions, compared with acidic-forming fertilizers (e.g., NH4NO3). In the experimental conditions of the soil, i.e., soil texture, low content of soil carbon, and moisture at level of 60%, promoted the nitrifier denitrification, rather than denitrification, as the dominant pathway of N2O–N production, resulting in a preferential use of the ammonium ion and retention of nitrate in the soil. Most of the NO3–N remained accumulated in the soil (Table 2). In comparison to the NIL treatment, the application of ammonium nitrate as part of the TD treatment increased the content of NO3–N in the 0–10 cm and 10–20 cm soil layers 23.8-fold and 2.3-fold, respectively. Under the conditions of deep N-fertilizer placement (DP treatment), the nitrate contents in the 0–10 cm and 10–20 cm soil layers were 1.6-fold and 25.6-fold higher, respectively, than on NIL treatments.
The share of N2O–N emitted from NH4NO3 applied in the DP and TD fertilization systems reached merely 21.2% and 30.0% of total cumulative nitrous oxide emissions from the soil (Table 1). This finding is explained by relatively high emissions of N2O–N from the NIL treatment. Prior nitrogen fertilization, as part of the long-term experiment in Skierniewice, which led to an accumulation of various forms of organic and mineral nitrogen in the soil and, possibly, their transformation to N2O–N during the study period, can partly explain the small differences in N2O–N emissions from experimental (fertilized) treatments (TD and DP) and the NIL treatment.
Further consideration needs to be given to the soil reaction. In different soil conditions (soil texture, low content of soil carbon, and moisture), several studies showed that optimum values of soil pH for N2O–N production ranged between pH 3.9 and 7.0 [42,43,44,45]. Although Russow et al. [46] showed that high NH4+–N concentration could facilitate N2O–N emissions in limed soils with pH 7.0–8.1, in this type of soil under aerobic conditions, nitrification is the main pathway of soil N2O–N production [47,48]. In acid soils, approximately 80% of the N2O–N flux results from denitrification. Soil pH of the tested soils (pH 5.8) should be favorable for denitrification. However, we maintained non-variable soil moisture at the level of 60% WFPS, which is unfavorable for denitrification. That was probably the cause of the relatively low N2O–N emissions from the soil treated with NH4NO3 (DP and TD treatments).
Several authors evidenced a reduction of N2O–N emissions from soil after deep N-fertilizer placement [9,49,50]. Liu et al. [3] reported mitigation of N2O–N emission after an application of liquid urea–ammonium-nitrate fertilizer at soil depths of both 10 cm and 15 cm. However, the authors observed no significant differences between N2O–N emissions from soil fertilized on the topsoil and at a depth of 5 cm. Hosen et al. [51] showed that the deep application of urea neither to the 0–10 cm soil layer nor to the 10–20 cm soil layer did reduce the N2O–N emissions. In their opinion, N2O–N emission is more dependent on soil conditions than on the depth of fertilizer application. The level of mitigation of N2O–N emissions recorded in our study was lower than that recorded by Gaihre et al. [4] in field conditions under rice cultivation. Cumulative N2O–N emissions from the soil with top dressing of NH4NO3 application were higher by 12.7%, compared to N2O–N emission from the soil with deep N-fertilizer placement (Table 1). Our results were similar to data obtained by Rutkowska et al. [7]. According to the authors, in the majority of experimental locations, in a year with lower precipitation, deep placement of nitrogen fertilizer in maize cultivation resulted in lower than a 17% reduction of N2O–N soil emissions. However, on numerous measurement dates, N2O–N emissions from soils with deep N-fertilizer placement were similar to, or higher than, those from the conventional top-dressing system of maize fertilization [7]. Chapuis-Lardy et al. [6] hypothesized that conditions interfering with N2O–N diffusion in the soil enhanced the N2O–N consumption and decreased the N2O–N soil emissions as an effect of the longer presence of N2O–N in the soil. Our data confirm that the diffusion of N2O–N between the place of its formation and the soil surface has an important impact on the emissions from the DP treatment.
Among multifactorial impacts, the soil moisture and content of soil organic carbon act as the proximal regulator of N2O–N production in the soil. Both soil moisture and the content of organic carbon regulate the oxygen availability to soil microbes. Zhu et al. [13] showed that oxygen availability regulated pathways of N2O–N formation in the soil. N2O–N production via NH3–N oxidation increased with decreasing O2 concentration from 21% to 0.5% (vol/vol). At low O2 concentrations, the contribution of nitrifier denitrification and heterotrophic denitrification to total N2O–N production ranged between 34% and 66% and between 34% and 50%, respectively. Heterotrophic denitrification was responsible for all N2O–N production at 0% O2. Bateman and Baggs [52] showed that N2O–N was formed during denitrification at 70% WFPS. According to Butterbach-Bahl et al. [12], N2 as the end product of denitrification is formed in the soil at soil moisture higher than 80–90% WFPS. The available organic carbon is also a critical factor in controlling denitrification [53]. Its availability promotes the microsite anaerobiosis as a result of increased respiratory demand for oxygen. Therefore, an increase in the availability of labile carbon would favor complete denitrification to N2. In our study, soil moisture was constantly maintained at 60% WFPS, and the content of dissolved organic carbon (DOC) in the soil at the end of the study period was low (Table 2). Therefore, the possibility of reducing the soil N2O–N emissions from DP treatment as a result of denitrification was limited. The difference in N2O soil emissions between DP and TD treatments shows that, at soil moisture of 60% WFPS and low DOC soil content, there is a limited possibility of higher N2O microbial consumption via denitrification, as an effect of a longer presence of N2O in the light sandy soil.

3.2. Soil CO2–C Fluxes

Measured soil CO2–C fluxes are presented in Figure 1. Soil CO2–C fluxes from all treatments before ammonium nitrate application on D1 were similar. Differences in measured fluxes became perceptible on D2. A gradual increase in the emission of CO2–C from the soil was recorded for all treatments leading to the first (and the least elevated) peak on D9. Subsequently, we observed a drop in the measured CO2–C fluxes, with a first nadir noted for all treatments on D16. This was followed by a substantial rise in the measured CO2–C fluxes resulting, for all treatments, in the second (and the most elevated) peak on D23. Similar emission patterns, with a peak on D23, may have resulted from the short period between the soil irrigation and measurement date, and the soil compaction change. Before the experiment, the soil was dried and sieved. During the experiment, irrigation could have resulted in a change in the soil density. Hence, the observed changes could, to some extent, be driven by factors not evaluated in the experiment. Successively, an extensive decline in the measured CO2–C fluxes occurred under all treatments, with the second nadir seen on D30 for NIL treatment and on D37 for TD and DP treatments. The third peak and third nadir were observed under all treatments on D44 and D51, respectively. Except for D2 and D30, the differences in measured CO2–C fluxes from the studied treatments were not significantly different. On D2, the fluxes for both NIL and DP treatments were significantly higher, as compared with TD treatment. On D30, the measured CO2–C flux from DP was significantly higher than those from TD and NIL treatments, whereas the flux from TD was significantly higher, as compared with NIL treatment. As a consequence of daily fluxes, significantly (p < 0.05) higher cumulative CO2–C soil emissions were recorded from DP treatment than from NIL treatments (Table 3).
Measured soil CO2–C daily fluxes over the study period showed a high variability with a range of 12.7–109.2 mg C m−2 h−1 from TD treatment, 12.9–102.5 mg C m−2 h−1 from DP treatment, and 14.1–100.5 mg C m−2 h−1 from NIL treatment (Table 3).
Depending on the way of experimental fertilization, soil CO2–C fluxes from DP treatment were significantly (p < 0.05) higher by approximately 17.2%, compared to those from NIL treatment. We observed differences between the measured soil CO2–C fluxes from DP and TD treatments, as well as from TD and NIL treatments; however, they were of no statistical significance. CO2–C fluxes recorded over the study period were relatively low, compared to those occurring on sandy light soils in the climatic conditions of Poland [54,55,56]. The relatively low soil CO2–C fluxes recorded in our study with no crop cover were expected. It is generally acknowledged that CO2–C is formed in the soil via both autotrophic and heterotrophic respiration. Adviento-Borbe et al. [23] estimated that autotrophic respiration could account for 36% of total soil respiration in high-yielding maize systems. Rochette et al. [57] evidenced that up to 50% of soil respiration resulted from root respiration and decomposition of root exudates. Amos et al. [24] reported that soil flux of CO2 decreased as plants reached physiological maturity and senescence, due to the absence of root respiration.
The study data suggest that nitrogen fertilization, and the different methods of its application, has an impact on the CO2–C emissions from the soil. Several studies indicated that N-fertilization increased CO2–C emissions from the soil [19,20]. Song and Zhang [20] reported, however, that nitrogen fertilization with 250 kg N ha−1 suppressed soil respiration. In addition, Ding et al. [58] revealed that nitrogen fertilization resulted in a reduction of soil CO2–C flux. The dose of nitrogen applied in our study could result in no differences in CO2–C soil emissions, as exemplified by the lack of differences between the fluxes from TD and NIL treatments (Table 3). DeForest et al. [59] evidenced that CO2–C fluxes could decrease when using high N rates, as a consequence of lower activity of enzymes in the soil. In our study, deep placement of ammonium nitrate resulted in a significant increase in CO2–C emission from the soil, compared to NIL treatment. Our results are consistent with data presented by Pareja-Sánchez et al. [22]. The authors demonstrated that nitrogen fertilization increased the CO2–C soil emissions as a result of different availability of soil nitrogen for decomposers. At the end of our study, the content of NO3–N in the topsoil layer was substantially higher under TD treatment than under DP treatment, which could reduce the soil enzymatic activity. On the other hand, the content of nitrates in the topsoil layer under DP treatment was insignificantly higher than on NIL treatment. Diffusion of NO3–N from deeper soil layers to the topsoil layer on DP treatment probably increased the amount of nitrogen available for decomposers, and resulted in higher CO2–C soil emissions. This may be supported by a higher DOC content in the topsoil layer under DP treatment than NIL treatment (Table 2), a difference which, however, did not reach statistical significance.
Adviento-Borbe et al. [23] showed that seasonal fluctuations in soil CO2–C fluxes depended on soil NO3–N, though to a lesser extent than on the air temperature and soil moisture. Total cumulative soil CO2–C emissions recorded over the study period were correlated only with soil DOC content (Table 4).

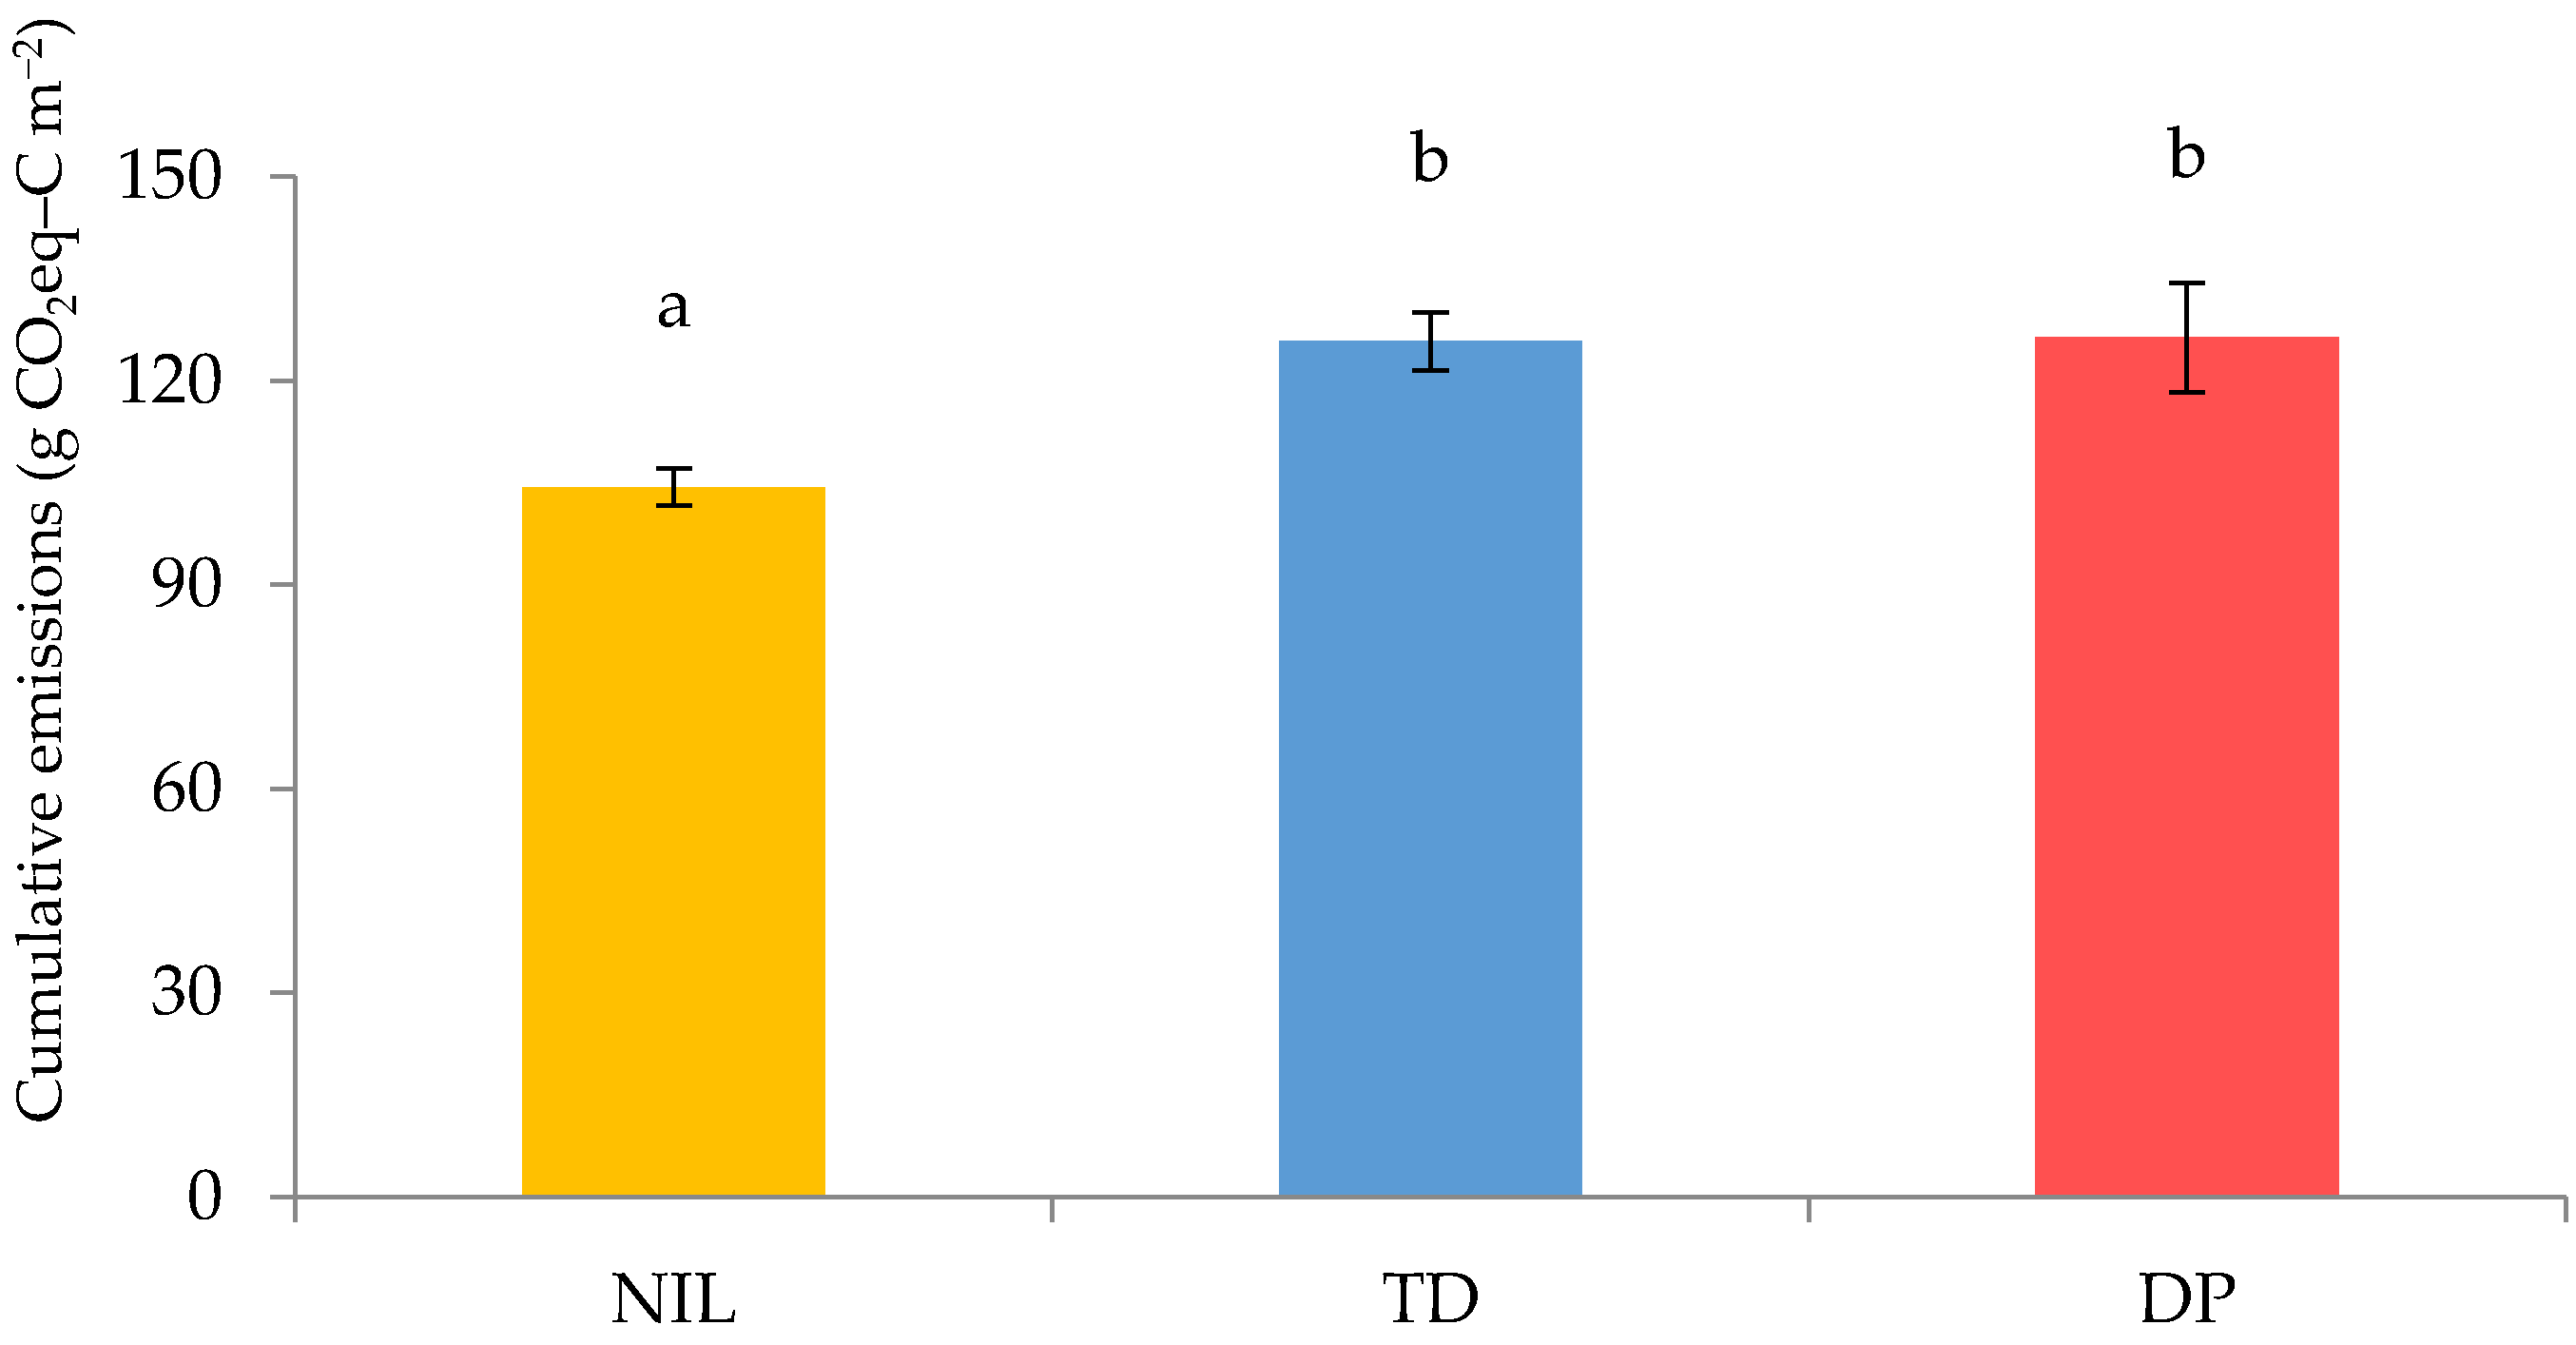
3.3. Cumulative Greenhouse Gas (GHG) Emissions from the Soil

Cumulative greenhouse gas (GHG) emissions from the soil, calculated as a sum of cumulative soil emissions of CO2–C and N2O–N converted to the equivalent of CO2–C, are presented in Figure 2. Irrespective of the method of nitrogen application, the cumulative GHG emissions from TD and DP treated soil (125.82 g CO2eq–C m−2 and 126.40 g CO2eq–C m−2, respectively) were significantly (p < 0.05) higher, by approximately 20%, than from NIL treatment (104.40 CO2eq–C m−2). No significant differences in soil GHG emissions were found between the two systems of N-fertilizer application. Our data demonstrate that an increase in CO2–C emissions from the soil without crop cover counterbalances the reduction of N2O–N soil emissions gained by deep placement of nitrogen fertilizer, leading to the conclusion that deep placement of nitrogen fertilizer in light sandy soils without crop cover might not mitigate the GHG emissions from the soil. Due to a greater energy input required for deep placement of the fertilizer into the soil, the total soil GHG emissions may exceed the GHG emissions from the traditional fertilization and cultivation systems.

4. Conclusions

Nitrogen fertilization increases the N2O–N emissions from the soil. High soil emission of N2O–N from topsoil dressed with ammonium nitrate occurs right after fertilizer application. Deep placement of ammonium nitrate at a depth of 10 cm decreases the soil nitrous oxide emissions by 12.7% and increases the soil CO2–C emissions by 17.2%. The relatively low difference in N2O–N soil emissions between DP and TD treatments shows that, at soil moisture of 60% WFPS and low DOC content in the soil, there is a limited possibility of higher N2O microbial consumption via denitrification as an effect of a longer presence of N2O–N in the light sandy soil.
However, N2O–N diffusion from a deeper soil layer delays and decreases the intensity of soil surface nitrous oxide emissions. An increase in CO2–C emissions from the soil without crop cover counterbalances the reduction of N2O–N soil emissions gained by deep placement of nitrogen. This suggests that deep placement of nitrogen fertilizers in light sandy soils might not lead to the mitigation of GHG emissions from the soil without crop cover. The deep N-fertilizer placement method, however, will be required for better plant nutrition, rather than the possibility of reducing GHG emissions from soil.
This study bridges a notable gap in the published evidence to characterize the impact of different methods of N application on the N2O–N and CO2–C emissions from the soil without crop cover. Such conditions, albeit currently unusual, are expected to occur more frequently in the future as a result of atypical weather conditions, which affect plant growth and yielding loss.

Author Contributions

Conceptualization: T.S.; methodology: T.S.; formal analysis. T.S. and M.S.; writing—original draft preparation: T.S.; writing—review and editing: M.S.; visualization: A.W.; project administration: W.S. All authors have read and agreed to the published version of the manuscript.

Funding

This work was supported by the financial resources for maintaining research equipment or research stand (SPUB) of the Ministry of Science and Higher Education (Decision: No. 89/E-385/SPUB/SP/2019).

Acknowledgments

Special thanks for staff of the Experimental Station in Skierniewice belonging to the Warsaw University of Life Sciences in which since 1923 the long-term experiments have been carried out as the basis for the conducted research.

Conflicts of Interest

The authors declare no conflict of interest.

Abbreviations

NILnon-fertilized treatment
TDtop dressing
DPdeep placement

References

  1. Nkebiwe, M.; Weinmann, M.; Bar-Tal, A.; Müller, T. Fertilizer placement to improve crop nutrient acquisition and yield: A review and meta-analysis. Field Crop Res. 2016, 196, 389–401. [Google Scholar] [CrossRef]
  2. Signor, D.; Cerri, C.E.P.; Conant, R. N2O emissions due to nitrogen fertilizer applications in two regions of sugarcane cultivation in Brazil. Environ. Res. Lett. 2013, 8, 9. [Google Scholar] [CrossRef]
  3. Liu, X.; Mosier, A.R.; Halvorson, A.D.; Zhang, F.S. The impact of nitrogen placement and tillage on NO, N2O, CH4 and CO2 fluxes from a clay loam soil. Plant Soil 2006, 280, 177–188. [Google Scholar] [CrossRef]
  4. Gaihre, Y.K.; Singh, U.; Huda, A.; Islam, S.M.M.; Islam, M.R.; Biswas, J.C.; DeWald, J. Nitrogen use efficiency, crop productivity and environmental impacts of urea deep placement in lowland rice fields. In Proceedings of the 2016 International Nitrogen Initiative Conference, “Solution to Improve Nitrogen use Efficiency for the World”, Melbourne, Australia, 4–8 December 2016; Volume 1, pp. 1–4. [Google Scholar]
  5. Chatterjee, D.; Mohanty, S.; Guru, P.K.; Swain, C.K.; Tripathi, R.; Shahid, M.; Kumar, U.; Kumar, A.; Bhattacharyya, P.; Gautam, P.; et al. Comparative assessment of urea briquette applicators on greenhouse gas emission, N loss and soil enzymatic activities in tropical lowland rice. Agric. Ecosyst. Environ. 2018, 252, 178–190. [Google Scholar] [CrossRef]
  6. Chapuis-Lardy, L.; Wrage, N.; Metay, A.; Bernoux, M. Soils, a sink for N2O? A review. Glob. Chang. Biol. 2006, 13, 1–17. [Google Scholar] [CrossRef]
  7. Rutkowska, B.; Szulc, W.; Szara, E.; Skowrońska, M.; Jadczyszyn, T. Soil N2O emissions under conventional and reduced tillage methods and maize cultivation. Plant Soil Environ. 2017, 63, 242–347. [Google Scholar]
  8. Adviento-Borbe, M.A.A.; Linquist, B. Assessing fertilizer N placement on CH4 and N2O emissions in irrigated rice systems. Geoderma 2016, 266, 40–45. [Google Scholar] [CrossRef]
  9. Linquist, B.A.; Adviento-Borbe, M.A.; Pittelkow, C.M.; van Kessel, C.; van Groenigen, K.J. Fertilizer management practices and greenhouse gas emissions from rice systems: A quantitative review and analysis. Field Crops Res. 2012, 135, 10–21. [Google Scholar] [CrossRef]
  10. Liu, T.Q.; Li, S.H.; Guo, L.G.; Cao, C.G.; Li, C.F.; Zhai, Z.B.; Zhou, J.Y.; Mei, Y.M.; Ke, H.J. Advantages of nitrogen fertilizer deep placement in greenhouse gas emissions and net ecosystem economic benefits from no-tillage paddy fields. J. Clean. Prod. 2020, 263, 121322. [Google Scholar] [CrossRef]
  11. Ruser, R.; Flessa, H.; Russow, R.; Schmidt, G.; Buegger, F.; Munch, J.C. Emission of N2O, N2 and CO2 from soil fertilized with nitrate: Effect of compaction, soil moisture and rewetting. Soil Biol. Biochem. 2006, 38, 263–274. [Google Scholar] [CrossRef]
  12. Butterbach-Bahl, K.; Baggs, E.M.; Dannenmann, M.; Kiese, R.; Zechmeister-Boltenstern, S. Nitrous oxide emissions from soils: How well do we understand the processes and their controls? Phil. Trans. R. Soc. B 2013, 368, 20130122. [Google Scholar] [CrossRef] [PubMed]
  13. Zhu, X.; Burger, M.; Doane, T.A.; Horwath, W.R. Ammonia oxidation pathways and nitrifier denitrification are significant source of N2O and NO under low oxygen availability. Proc. Natl. Acad. Sci. USA 2013, 110, 6328–6333. [Google Scholar] [CrossRef] [PubMed] [Green Version]
  14. Sánchez-Martín, L.; Vallejo, A.; Dick, J.; Skiba, U.M. The influence of soluble carbon and fertilizer nitrogen on nitric oxide and nitrous oxide emissions from two contrasting agricultural soils. Soil Biol. Biochem. 2008, 40, 142–151. [Google Scholar] [CrossRef]
  15. Sosulski, T.; Szara, E.; Stępień, W.; Szymańska, M. Nitrous oxide emissions from the soil under different fertilization systems on a long-term experiment. Plant Soil Environ. 2014, 60, 481–488. [Google Scholar] [CrossRef] [Green Version]
  16. Sosulski, T.; Szymańska, M.; Szara, E. CO2 Emissions from soil under fodder maize cultivation. Agronomy 2020, 10, 1087. [Google Scholar] [CrossRef]
  17. Sosulski, T.; Szara, E.; Stępień, W.; Szymańska, M.; Borowska-Komenda, M. Carbon and nitrogen leaching in long-term experiments and DOC/N-NO3- ratio in drainage water as an indicato of denitrification potential in different fertilization and crop rotation systems. Fresenius Environ. Bull. 2016, 25, 2813–2824. [Google Scholar]
  18. Doroszewski, A.; Pudełko, R.; Żyłowska, K.; Jadczyszyn, J.; Koza, P.; Wróblewska, E.; Nowak, A. Communication Report Regarding the Incidences of Drought Conditions in Poland. 2019. Available online: http://www.susza.iung.pulawy.pl/en/komentarz/2019,08/ (accessed on 8 August 2020).
  19. Zhai, L.; Liu, H.; Zhang, J.; Huang, J.; Wang, B. Long-term application of organic manure and mineral fertilizer on N2O and CO2 emissions in a red soil from cultivated maize-wheat rotation in China. Agric. Sci. China 2011, 10, 1748–1757. [Google Scholar] [CrossRef]
  20. Song, C.; Zhang, J. Effects of soil moisture, temperature, and nitrogen fertilization on soil respiration and nitrous oxide emission during maize growth period in northeast China. Acta Agric. Scand. B 2009, 59, 97–106. [Google Scholar] [CrossRef]
  21. Dai, Z.; Mengjie Yu, M.; Chen, H.; Zhao, H.; Huang, Y.; Su, W.; Xia, F.; Chang, S.X.; Brookes, P.C.; Dahlgren, R.A.; et al. Elevated temperature shifts soil N cycling from microbial immobilization to enhanced mineralization, nitrification and denitrification across global terrestrial ecosystems. Glob. Chang. Biol. 2020, 26, 5267–5276. [Google Scholar] [CrossRef]
  22. Pareja-Sánchez, E.; Cantero-Martinez, C.; Alvaro-Fuentes, J.; Plaza-Bonilla, D. Tillage and nitrogen fertilization in irrigated maize: Key practices to reduce soil CO2 and CH4 emission. Soil Tillage Res. 2019, 191, 29–36. [Google Scholar] [CrossRef]
  23. Adviento-Borbe, M.A.A.; Haddix, M.L.; Binder, D.L.; Walters, D.T.; Dobermann, A. Soil greenhouse gas fluxes and global warming potential in four high-yielding maize systems. Glob. Chang. Biol. 2007, 13, 1972–1988. [Google Scholar] [CrossRef]
  24. Amos, B.; Arkebauer, T.J.; Doran, J.W. Soil surface fluxes of greenhouse gases in an irrigated maize-based agroecosystem. Soil Sci. Soc. Am. J. 2005, 69, 387–395. [Google Scholar] [CrossRef] [Green Version]
  25. Kopiński, J. Diversity of nitrogen management in Polish agriculture. Pol. J. Agron. 2018, 32, 2–16. (In Polish) [Google Scholar]
  26. Burton, D.L.; Zebarth, B.J.; Gillam, K.M.; MacLeod, J.A. Effect of split application of fertilizer nitrogen on N2O emissions from potatoes. Can. J. Soil Sci. 2008, 88, 229–239. [Google Scholar] [CrossRef] [Green Version]
  27. Bosco, S.; Volpi, I.; Antichi, D.; Ragaglini, G.; Frasconi, C. Greenhouse Gas Emissions from Soil Cultivated with Vegetables in Crop Rotation under Integrated, Organic and Organic Conservation Management in a Mediterranean Environment. Agronomy 2019, 9, 446. [Google Scholar] [CrossRef] [Green Version]
  28. Myhre, G.D.; Shindell, F.-M.; Bréon, W.; Collins, J.; Fuglestvedt, J.; Huang, D.; Koch, J.-F.; Lamarque, D.; Lee, B.; Mendoza, T.; et al. Anthropogenic and Natural Radiative Forcing. In Climate Change 2013: The Physical Science Basis. Contribution of Working Group I to the Fifth Assessment Report of the Intergovernmental Panel on Climate Change; Stocker, T.F.D., Qin, G.-K., Plattner, M., Tignor, S.K., Allen, J., Boschung, A., Nauels, Y., Xia, V., Bex, P., Midgley, M., Eds.; Cambridge University Press: Cambridge, UK; New York, NY, USA, 2013; pp. 659–740. [Google Scholar]
  29. Zsolnay, A. Dissolved Humus in Soil Waters. In Humic Substances in Terrestrial Ecosystems; Piccolo, A., Ed.; Elsevier: Amsterdam, The Netherlands, 1996; pp. 171–223. [Google Scholar]
  30. McVicar, K.; Kellman, L. Growing season nitrous oxide fluxes across a 125+ year harvested red spruce forest chronosequence. Biochemistry 2014, 120, 225–238. [Google Scholar] [CrossRef]
  31. McSwiney, C.P.; Robertson, G.P. Nonlinear response of N2O flux to incremental fertilizer addition in a continuous maize (Zea mays L.) cropping system. Glob. Chang. Biol. 2005, 11, 1712–1719. [Google Scholar] [CrossRef]
  32. Kim, S.; Dale, B.E. Effects of nitrogen fertilizer application on greenhouse gas emissions and economics of corn production. Environ. Sci. Technol. 2008, 42, 6028–6033. [Google Scholar] [CrossRef]
  33. Hofstra, N.; Bouwman, A.F. Denitrification in agricultural soils: Summarizing published data and estimating global annual rates. Nutr. Cycl. Agroecosyst. 2005, 72, 267–278. [Google Scholar] [CrossRef]
  34. Bouwman, A.F.; Boumans, L.J.M.; Batjes, N.H. Emissions of N2O and NO from fertilized fields: Summary of available measurement data. Glob. Biogeochem. Cycles 2002, 16, 1–13. [Google Scholar] [CrossRef]
  35. Van Groenigen, J.W.; Velthhof, G.L.; Oenema, O.; Van Groeningen, K.J.; Van Kessel, C. Towards an agronomic assessment of N2O emissions: A case study for arable crops. Eur. J. Soil Sci. 2010, 61, 903–913. [Google Scholar] [CrossRef]
  36. Meng, L.; Ding, W.; Cai, Z. Long-term application of organic manure and nitrogen fertilizer on N2O emissions, soil quality and crop production in a sandy loam soil. Soil Biol. Biochem. 2005, 37, 2037–2045. [Google Scholar] [CrossRef]
  37. Jungkunst, H.F.; Freibauer, A.; Neufeldt, H.; Bareth, G. Nitrous oxide emissions from agricultural land use in German—A synthesis of available annual field data. J. Plant Nutr. Soil Sci. 2006, 169, 341–351. [Google Scholar] [CrossRef]
  38. Rudaz, A.O.; Wälti, E.; Kyburz, G.; Lehmann, P.; Fuhrer, J. Temporal variation in N2O and N2 fluxes from a permanent pasture in Switzerland in relation to management, soil water content and soil temperature. Agric. Ecosyst. Environ. 1999, 73, 83–91. [Google Scholar] [CrossRef]
  39. Kaiser, E.-A.; Kohrs, K.; Kücke, M.; Schnug, E.; Heinemeyer, O.; Munch, J.C. Nitrous oxide release from arable soil: Importance of N-fertilization, crops and temporal variation. Soil Biol. Biochem. 1998, 30, 1553–1563. [Google Scholar] [CrossRef]
  40. Kaiser, E.A.; Heinemeyer, O. Temporal changes in N2O losses from two arable soils. Plant Soil. 1996, 181, 57–63. [Google Scholar] [CrossRef]
  41. Sosulski, T.; Szara, E.; Stępień, W.; Rutkowska, B. The influence of mineral fertilization and legumes cultivation on the N2O soil emissions. Plant Soil Environ. 2015, 61, 529–536. [Google Scholar] [CrossRef]
  42. Morkved, P.T.; Dorsch, P.; Bakken, L.R. The N2O product ratio of nitrification and its dependence on long-term changes in soil pH. Soil Biol. Biochem. 2007, 39, 2048–2057. [Google Scholar] [CrossRef]
  43. Van Den Heuvel, R.N.; Bakker, S.E.; Jetten, M.S.M.; Hefting, M.M. Decreased N2O reduction by low soil pH causes high N2O emissions in a riparian ecosystem. Geobiology 2011, 9, 294–300. [Google Scholar] [CrossRef]
  44. Kesik, M.; Blagodatsky, S.; Papen, H.; Butterbach-Bahl, K. Effect of pH, temperature and substrate on N2O, NO and CO2 production by Alcaligenes faecalis p. J. Appl. Microbiol. 2006, 101, 655–667. [Google Scholar] [CrossRef]
  45. Sosulski, T.; Szara, E.; Stępień, W.; Szymańska, M. Impact of liming management on N2O emissions from arable soils in three long-term fertilization experiments in Central Poland. Fresenius Environ. Bull. 2016, 25, 6111–6119. [Google Scholar]
  46. Russow, R.; Sich, I.; Neue, H.U. The formation of the trace gases NO and N2O in soils by the coupled process of nitrification and denitrification: Results of kinetic 15N tracer investigations. Chemosphere Glob. Chang. Sci. 2000, 2, 359–366. [Google Scholar] [CrossRef]
  47. Vermoesen, A.; de Groot, C.J.; Nollet, L.; Boeckx, P.; van Cleemput, O. Effect of ammonium and nitrate application on the NO and N2O emission out of different soils. Plant Soil 1996, 181, 153–162. [Google Scholar] [CrossRef]
  48. Baggs, E.M.; Smales, C.L.; Bateman, E.J. Changing pH shifts the microbial source as well as the magnitude of N2O emission from soil. Biol. Fertil. Soils 2010, 46, 793–805. [Google Scholar] [CrossRef]
  49. Van Kessel, C.; Venterea, R.; Six, J.; Adviento-Borbe, M.A.; Linquist, B.; van Groenigen, K.J. Climate, duration, and N placement determine N2O emissions in reduced tillage systems: A meta-analysis. Glob. Chang. Biol. 2013, 19, 33–44. [Google Scholar] [CrossRef]
  50. Millar, N.; Doll, J.E.; Robertson, G.P. Management of nitrogen fertilizer to reduce nitrous oxide (N2O) emissions from field crops. In Climate Change and Agriculture Fact Sheet Series—MSU Extension Bulletin, E3152; Michigan State University: East Lansing, MI, USA, November 2014; Volume 5. [Google Scholar]
  51. Hosen, Y.; Paisancharoen, K.; Tsuruta, H. Effects of deep application of urea on NO, N2O emissions from an Andidol. Nutr. Cycl. Agroecosyst. 2002, 63, 197–206. [Google Scholar] [CrossRef]
  52. Bateman, E.J.; Baggs, E.M. Contribution of nitrification and denitrification to N2O emissions from soils at different water-filled pore space. Biol. Fertil. Soils 2005, 41, 379–388. [Google Scholar] [CrossRef]
  53. Wang, L.F.; Cai, Z.C.; Yang, L.F.; Meng, L. Effects of disturbance and glucose addition on nitrous oxide and carbon dioxide emissions from a paddy soil. Soil Tillage Res. 2005, 82, 185–194. [Google Scholar] [CrossRef]
  54. Rutkowska, B.; Szulc, W.; Sosulski, T.; Skowrońska, M.; Szczepaniak, J. Impact of reduced tillage on emission from soil under maize cultivation. Soil Tillage Res. 2018, 180, 21–28. [Google Scholar] [CrossRef]
  55. Włodarczyk, T.; Brzezińska, M.; Borkowska, A.; Kotowska, U.; Nosalewicz, M.; Szarlip, P.; Pazur, M. Carbon dioxide fluxes from arable soils under conventional and reduced tillage methods. Acta Agrophys. 2007, 150, 29–41. (In Polish) [Google Scholar]
  56. Brzezińska, M.; Włodarczyk, T.; Witkowska-Walczak, B.; Sławinski, C.; Borkowska, A.; Kotowska, U.; Nosalewicz, M.; Szarlip, P. Influence of soil moisture and temperature on the concentration and CO2 emissions from arable soils under conventional and reduced tillage methods. Acta Agrophys. 2007, 150, 41–53. (In Polish) [Google Scholar]
  57. Rochette, P.; Flanagan, L.B.; Gregorich, E.G. Separating soil respiration into plant and soil components using analyses of the natural abundance of carbon-13. Biology and Biochemistry. Soil Sci. Soc. Am. J. 1999, 63, 1207–1213. [Google Scholar] [CrossRef]
  58. Ding, W.; Cai, Y.; Cai, Z.; Yagi, K.; Zheng, X. Soil Respiration under Maize Crops: Effects of Water, Temperature, and Nitrogen Fertilization. Soil Biol. Biochem. 2007, 71, 944–951. [Google Scholar] [CrossRef]
  59. DeForest, J.L.; Zak, D.R.; Pregitzer, K.S.; Burton, A.J. Atmospheric nitrate decomposition, microbial community composition, and enzyme activity in Northern Hardwood Forests. Soil Sci. Soc. Am. J. 2004, 68, 132–138. [Google Scholar] [CrossRef] [Green Version]
Figure 1. N2O–N and CO2–C emissions from non-fertilized soil (NIL) and soils fertilized with ammonium nitrate: top dressing (TD) and deep placement (DP).
Agriculture 10 00602 g001
Figure 2. Cumulative greenhouse gas emissions expressed as the CO2–C equivalent (g CO2eq–C m−2) from non-treated soil (NIL) and soils fertilized with ammonium nitrate; top dressing (TD) and deep placement (DP). Different letters (a,b) indicate significant differences (p < 0.05).
Agriculture 10 00602 g002
Table 1. Daily N2O–N soil emissions and cumulative N2O–N emissions from the soil and corrected for background cumulative N2O–N emissions from NH4NO3 in the top dressing (TD) and deep placement (DP) fertilization systems.
TreatmentN2O–N Emissions
DailyCumulative From:
SoilNH4NO3
µg N m−2 h−1mg N m−2
NILmean94.0 a ± 5.6133.5 a ± 6.7-
median93.3137.4-
min–max33.0–206.7125.7–137.4-
TDmean137.5 b ± 3.3190.8 b ± 5.657.3 a ± 7.3
median125.9188.859.8
min–max30.2–254.8186.4–197.249.0–63.1
DPmean116.8 c ± 4.7169.4 b ± 20.235.9 b ± 26.7
median123.5164.727.3
min–max29.5–200.2151.9–191.514.5–65.8
Values followed by the same letters (a–c) in the column are not statistically different (p < 0.05).
Table 2. Effect of different NH4NO3 applications: top dressing (TD) and deep placement (DP) on the content of NO3–N and dissolved organic carbon (DOC) in the soil at the end of study period.
TreatmentSoil Content
NO3–NDOC
0–10 cm10–20 cm0–10 cm10–20 cm
mg N kg−1mg C kg−1
mean6.84 a ± 1.66.27 a ± 1.69.12 ab ± 0.78.03 b ± 0.9
NILmedian5.935.598.998.04
min–max5.90–8.695.13–5.598.52–9.867.15–8.90
mean163.13 b ± 22.514.55 a ± 1.99.54 ab ± 1.411.81 a ± 1.3
TDmedian174.214.469.5611.51
min–max137.2–178.012.74–16.468.18–10.8810.69–13.23
mean10.03 a ± 0.8160.63 b ± 20.412.64 a ± 2.39.78 ab ± 0.9
DPmedian9.76167.213.6110.30
min–max9.45–10.89127.8–176.910.04–14.268.73–10.32
Values followed by the same letters (a,b) in the column are not statistically different (p < 0.05).
Table 3. Daily CO2–C soil emissions and total cumulative CO2–C soil emissions from the soil treated with NH4NO3 in the top dressing (TD) and deep placement (DP) fertilization systems.
TreatmentCO2–C Emissions
DailyCumulative
mg C m−2 h−1g C m−2
NILmean47.0 a ± 25.064.0 a ± 4.0
median40.764.7
min–max14.1–100.559.8–67.6
TDmean50.4 ab ± 27.568.4 ab ± 2.6
median46.468.0
min–max12.7–109.266.0–71.1
DPmean55.1 b ± 25.875.4 b ± 2.6
median52.975.1
min–max12.9–102.571.5–79.42
Values followed by the same letters (a,b) in the column are not statistically different (p < 0.05).
Table 4. Correlation coefficients between cumulative N2O–N and CO2–C (total between 1st and 22nd and 23rd–51st day of experiment) emissions of the soil, and soil content of NO3–N and DOC on 51st day of experiment.
Parameter N2O–NNO3–NDOC
N2O–N1.000.55 *0.57 *
CO2–C0.240.340.44 *
NO3–N0.55 *1.000.03
DOC0.57 *0.031.00
* p < 0.05.
Publisher’s Note: MDPI stays neutral with regard to jurisdictional claims in published maps and institutional affiliations.

