Article

Change of Price Premiums Trend for Organic Food Products: The Example of the Polish Egg Market

Department of Agrotechnology, Agricultural Production Management and Agribusiness, University of Warmia and Mazury in Olsztyn, Oczapowskiego Str. 8, 10-719 Olsztyn, Poland
Agriculture 2020, 10(2), 35; https://doi.org/10.3390/agriculture10020035
Submission received: 11 November 2019 / Revised: 12 January 2020 / Accepted: 27 January 2020 / Published: 1 February 2020

Abstract

:
One of the most rapidly growing areas of the organic agricultural system is egg production. However, the price premium often decreases the affordability of organic foods. In this study, the production and sales of organic eggs in Europe were compared, the prices of organic and conventional eggs in Poland were analyzed, and the price premium on the Polish market was evaluated. This study relied on data of Eurostat, Statistics Poland, Agricultural and Food Quality Inspection and Ministry of Agriculture and Rural Development in Poland. The prices of organic and conventional eggs on the Polish wholesale market were analyzed based on the monthly price registers. The production and sales of organic eggs in Europe were characterized by a steady increase. The nominal and real prices of organic eggs were higher than the prices of conventional eggs throughout the entire analyzed period. The nominal prices of organic eggs tended to decrease. However, an upward trend was observed in the real prices of both organic and conventional eggs. The average price premium for organic eggs exceeded 128% (median of 121%). The price premium was characterized by moderate variation (Vc = 33%). In Poland, the price premium was on a downward trend by around 1% per month in the examined period.

1. Introduction

In recent years, conventional farming and the food processing industry have witnessed several changes, in particular a rapid increase in output and productivity. These processes can be attributed to the introduction of modern technology and the use of artificial fertilizers and pesticides. However, modern agriculture and food production exert growing pressure on natural resources and have a negative impact on the environment. On the other hand, consumers are becoming increasingly aware of the ecological, social and economic consequences of food production, which drives transparency for the food market in line with the sustainable development concept. The strong correlations between public health, a balanced diet and care for the natural environment are important considerations [1,2,3,4]. It should be noted that the greatest changes on the food market have been observed in the segment of foods that are produced traditionally without preservatives or additives. Eating high-quality foods, in particular organic foods, has become an important part of a modern healthy lifestyle [5,6,7].
The demand for organic food continues to increase, but organic foods account for only a small percent of total food consumption in most countries in the world [8,9,10,11,12]. Organic food sales are highest in the most affluent European countries. In Europe, the leading consumer of organic food is Denmark (13.4%), followed by Sweden (13.4%) and Switzerland (9%) [13]. However, price premiums often decrease the affordability of organic foods. Price premiums for organic produce exceed those for conventionally produced food by as much as 5–30% for milk and dairy products, 5–60% for cereal products, 20–82% for eggs, 60% for carrots and onions, and 40% for potatoes [9,14,15,16,17,18]. The organic price premium is higher for processed food than for raw food [9]. In organic fish, price premiums can be as high as 10–60% [19,20]. Consumers are willing to pay very high premiums only in isolated cases. Van Loo et al. [21] found that consumers were willing to pay a price premium of 244% for organic chicken breast certified by the United States Department of Agriculture (USDA). However, price premiums decrease over time as supply increases and organic foods are introduced by supermarkets [9,22]. It should also be noted that not all organic produce is sold at a premium [13]. This trend is particularly visible in less developed Asian markets [23].
Price premiums for organic foods have been rarely investigated in Poland. Statistical data on the prices and sales of conventional foods are widely available, whereas the relevant information is scarce or unavailable in the organic food sector. In 2009, Łuczka-Bakuła and Smoluk-Sikorska [24] analyzed price premiums in 34 retail outlets (10 specialty stores, 7 large-area chain supermarkets and 17 conventional stores offering organic foods) in Poznań, the capital city of the Region of Wielkopolska. The authors analyzed the prices of 57 products, mostly fruit and vegetables, but the relevant data were collected only once, and they did not constitute a time series. Price premiums ranged from 34.3% to 323.9% (the highest premiums were noted for onion), and the average premium exceeded 161%. These findings reflect the characteristics of the Polish market where, despite high potential demand, real demand, which is driven by prices and incomes, is low. Supply is also relatively low, and imported processed foods play the main role on the market [25]. The above can be attributed mainly to relatively high public subsidies for organic farms. The production of organic food is low, but organic farms contribute to the protection of biological diversity [26]. Paradoxically enough, around 80% of Polish organic food is exported [27]. However, the relevant information is scarce or unavailable in the organic food sector. Data relating to organic farming should be collected and analyzed to provide valuable inputs for the institutions responsible for organic farming laws and regulations, as well as for food processing companies, retailers, wholesalers, farmers and researchers or policy makers. Analyses of price premiums can reveal product shortages, excess stock or other changes in the relationship between demand and supply. Price premiums can be monitored to gather information about the pricing strategies of market competitors, in particular foreign businesses.
In the global organic food market, the highest price premiums are charged for dairy products [28] and eggs [17,29]. For this reason, egg production is one of the most rapidly growing segments of the organic food market. The demand for eggs is high both for consumers and by the food processing industry [30]. Eggs are a source of high-quality protein, essential nutrients, vitamins and minerals [31]. Organic egg production systems are based on crop production for farm-made feeds, on organic farmland and permanent grassland, mostly because livestock cannot be raised on organic farms that do not cultivate land. According to regulations, free-range and organic chickens have to be provided with access to extensive green spaces.
Organic eggs are often regarded as the epitome of healthy eating. In many countries, organic egg farms are among the most successful businesses on the retail market. In wealthy West European countries, organic eggs have an 8–30% share of the poultry market. They account for more than 20% of sales on organic food markets in Switzerland and Sweden, and even 30% in Denmark and France [13]. In Poland, organic eggs are in very low supply, and they have a mere 0.2% share of the egg market [32]. Unfortunately, relevant information about price premiums for the global organic egg market are scant [17,33,34], and price premiums for eggs have never been researched in Poland. However, Polish consumers have a growing interest in innovative animal products, in particular eggs, which is a promising trend [31,35]. For this reason, the organic egg market is an ideal candidate for an analysis of price premiums.
According to Millock et al. [9], many researchers focus primarily on price premiums in consumer markets and investigate consumers’ willingness to pay more for organic foods. In this study, wholesale price premiums were analyzed based on an extensive set of data of prices for organic and conventional foods.
The aim of this study was to estimate and determine trends in the price premiums for organic food products on the example of the Polish wholesale egg market. The specific objectives of this study were to contrast Poland’s (1) organic egg production relative to other European countries that have recently increased and (2) organic and conventional egg price differences and subsequent organic price premiums, both of which may have increased.

2. Background

2.1. Organic Farming and the Organic Food Market in the World

The total area under organic farming, including fully converted land and area under conversion, has been increasing steadily around the world. The area of organically cultivated land increased more than four-fold from 15 million hectares in 2000 to 70 million hectares in 2017. However, a decrease in the area under organic agriculture was also noted in two years during the investigated period, relative to the preceding year, in 2005 (by 2.42%) and 2010 (by 1.54%).
The percentage of organically farmed land in total agricultural land is low, but it continues to increase steadily. The share of land under organic agriculture increased nearly two-fold from 0.7% in 2005 to 1.4% in 2017. Based on the available data, organic agricultural areas are likely to increase by around 2.5 million hectares per year (Figure 1).
In 2017, Oceania had the largest area under organic management (35,894,365 ha), which accounted for more than 51% of total organic farmland in the world and around 8.5% of total agricultural land in Australia. Europe had 14,558,246 ha of organic land (25% of total organic farmland in the world), which accounted for a mere 2.9% share of total agricultural land in Europe and 6.8% in the EU-28. Europe was followed by Latin America with 8,000,888 ha of organic farmland (12.3%). In Poland, organic land spanned an area of nearly 495,000 ha (Table 1), including 111,733.31 ha of land transitioning to organic and 383,245.35 ha of fully converted land at the end of 2017, which accounted for over 2.6% of total agricultural area in the country [37]. It should be noted that until 2013 there was an upward trend (area equal to 669,969 ha). However, since 2014 direction has changed. This was caused by changes in regulations related to public subsidies for organic farming.
The number of organic producers, including raw food producers (farmers), food processing companies, food distributors, exporters and importers, also continues to increase around the world. In 2000, there were only 252,000 organic producers in the world, and their number increased by more than 50% in 2001. However, the number of organic food suppliers grew at a slower rate in successive years, and a 10% drop was noted in 2003 relative to the preceding year. The organic market rebounded between 2004 and 2009, but a nearly 14% decrease (highest decrease in the analyzed period) was observed in 2010 relative to the previous year. The number of organic producers continued to increase from 2011 to reach nearly 3 million in 2017. Thus, a nearly 11-fold increase in the number of organic farmers was noted between 2000 and 2017 (Figure 2). However, the share of organic farms of the total number of farms, which is estimated at over 570 million [38,39,40], accounted for only 0.5%. In 2017, the number of organic producers was highest Africa (1,144,263) and Asia (815,070) and lowest in North America (26,750) and Oceania (19,017) (Table 1).
At the end of 2017, there were 21,400 organic producers in Poland (Table 1), and nearly 95% (20,257) of them were farmers. The remaining entities were food processing companies (795), importers of organic products from the European Union (EU) (823), importers of organic products from non-EU countries (161), producers of certified seeds and plant propagation materials (148), apiarists (30), suppliers of herbal plants grown organically in natural habitats (34) and aquaculture and/or algaculture farms (7) [41]. However, as in the case of area under organic farming, a similar direction of changes in the number of organic producers in Poland can be observed. Until 2013, the number of organic producers in Poland increased to 27,093 and has been systematically decreasing since 2014. This phenomenon was also related to the amendment of the regulations on subsidies for organic farms in 2013.
Retail sales of raw and processed organic foods continue to increase in the world. Retail sales topped €15 billion in 2000 and increased more than six-fold in excess of €92 billion in 2017 (in nominal prices). The organic food market is expected to grow in the coming years at an average rate of more than €4 billion per annum (Figure 3).
In 2017, North America was the world’s largest organic food market (nearly 50% of global retail sales) with an estimated value of more than €43 billion (including €39.6 billion in the USA). Europe was the second largest market (over 40%) with combined sales of around €37 billion (Table 1). In Poland, organic food is a niche market worth only around €219.7 million [42]. Organic products account for only 0.3% of the Polish food market, but the organic segment continues to grow at 10–20% per year [43].
The organic farming market is one of the most rapidly growing segments of the food industry in developed countries, despite the fact that it presently accounts for only around 1.4% of agricultural land and 5% of retail sales. In highly developed countries, most consumers buy organic food at least sporadically [44,45]. However, considerable differences in organic food consumption are observed between countries. These variations cannot be explained by consumer preferences and market demand alone, and they also result from market barriers to demand response, including prices, incomes, distribution networks and supply [9,22,46,47]. In 2017, the average consumer spent around €12 on organic food in the world and around €47 in Europe. The highest annual per capita spending was noted in Switzerland (€288), Denmark (€278) and Sweden (€237). American and German consumers spent €122 on organic products on average. In Poland, the average spending on organic produce was only €6. This amount has not changed much for years, but the trend is increasing. The value of organic food purchases was lowest in Bosnia and Herzegovina (€0.1) and in Montenegro (€0.2) (Table 1). Consumer spending on organic produce continues to increase [44,48]. Consumer behaviors can be analyzed based on the tenets of classical economics and the theory of personal budgeting. In the literature, consumers’ propensity to pay more for organic food is explained by Engel’s law, the Veblen effect (a theoretical anomaly in the general law of demand where a higher price makes a product desirable as a status symbol), the snob effect, and prestige-driven consumption trends [49,50,51,52,53].
An increase in demand for raw and processed organic foods is observed mostly in highly developed countries with more affluent and environmentally conscious consumers. These countries are characterized by the highest per capita spending on organic produce [13,42]. On many European markets, consumers are increasingly willing to pay a higher premium for organic food, but demand is not met because of low supply and ineffective distribution networks [7,9,54,55].

2.2. Price Premiums on the Organic Food Market

Many consumers are of the opinion that trendy environmentalism is the main reason behind the high prices of organic foods. Nothing could be further from the truth. The prices of organic foods reflect higher costs of agricultural production and processing. Organic products cost more because the manufacturing process is more expensive, longer and more labor intensive. Organic food prices are also significantly influenced by legal regulations and subsidies [56,57]. Organic food produced from organic raw materials in an organic production process is more expensive, and it is perceived as a luxury good [15,58,59,60]. One of the features of luxury products is the price premium, and producers impose price premiums on luxury products to gain advantage over market competitors [61]. At the same time, a price premium reflects consumers’ willingness to buy a given product regardless of its price [60]. In theoretical economics, a price premium is defined as a high price that generates above-average profits. Therefore, a premium should be regarded as the amount in excess of a “satisfactory” price that is justified by the product’s “real” value. The premium is generally perceived as the amount paid in excess of any additional economic costs of production [62]. Environmentally conscious producers rely on the premium to cover production costs when public subsidies are not available.
The price premium, also referred to as the relative price, is the percentage by which a product’s selling price exceeds (or falls short of) a benchmark price for a similar product or a basket of products [63]. It can be calculated with the use of the following Formula (1):
P r i c e   p r e m i u m   ( % ) = [ B r a n d   A   P r i c e   ( $ ) B e n c h m a r k   P r i c e   ( $ ) ] B e n c h m a r k   P r i c e   ( $ )
The premium applies to prices at which both products (the brand in question and the benchmark product) are in equal demand [64].
Consumers’ propensity to pay a price premium for organic foods encourages new producers to enter the organic market, which increases supply in both physical and economic terms. Many farmers switch from conventional, high-input agriculture to organic farming. In the long term, these processes can decrease the prices and premiums for organic foods, but the decrease in prices can be compensated by higher consumption and retail sales [57]. Producers can thus maintain or even increase their incomes from organic farming, and they can reduce costs due to the effect of economies of scale in processing and distribution systems [65]. Paradoxically enough, consumer trends are rarely taken into account by the producers of raw materials for the food industry. Farmers generally focus on the primary market, and they sell their produce to intermediaries who often drive sales on the food market. Farmers’ participation in agricultural markets is determined by many factors, including popularity, location, market management and subsidies. In turn, consumers’ participation is determined mainly by location because most clients purchase food products in their area of residence [66,67].
Price premiums (in addition to public subsidies) attract producers, facilitate the conversion of conventional farms into organic farms and generate incomes for the existing organic farms. Price premiums can be effectively charged when consumers are able to identify organic products on the retail market (e.g., based on label information) and are willing to pay more for organic foods than conventional products [20]. A price premium also has to be charged by all businesses in the supply chain [19].

3. Materials and Methods

3.1. Data Collection

This study relied primarily on a unique set of secondary data obtained (July 27 2018) from the Ministry of Agriculture and Rural Development (MRiRW). The prices of organic and conventional eggs (in PLN per 100 eggs) on the Polish wholesale market were analyzed based on the monthly price registers in the Integrated Agricultural Market Information System of the Ministry of Agriculture and Rural Development. A total of 156 observations (78 observations for the prices of organic and conventional eggs each) covering the period from 1 February 2010 to 1 July 2016 were analyzed (on 23 September 2016, the “Organic egg market” newsletter published by the Ministry of Agriculture and Rural Development was suspended until further notice due to the small number of producers submitting information on the prices of organic eggs to the Integrated Agricultural Market Information System). Monthly prices of organic and conventional eggs were expressed as median prices in four size categories (large, medium, small and unsorted). This estimator was selected because the median is generally less sensitive to extreme values and outliers, and it is a more reliable statistic than the mean [68,69]. To compensate for the small number of missing values in the dataset (2% for the prices of organic eggs, and 1% for the prices of conventional eggs), the values were estimated by nearest-neighbor value interpolation (on a monthly basis, the month before and the month after the missing observation) [70,71,72].
Data developed by Statistics Poland (GUS), Eurostat and the Agricultural and Food Quality Inspection (IJHARS) were also analyzed in the study. Data relating to organic food production in Europe (2012–2017), the price index of consumer goods and services (adjusted for inflation between February 2010 and July 2016), organic farmland, number of organic producers, total and per capita spending on organic food, population, GDP per capita, total household consumption expenditure and per capita expenditure in European countries (2017) were obtained from Statistics Poland and Eurostat. Unpublished data on the annual production of organic food in Poland were obtained from IJHARS. Prices expressed in PLN were converted to € based on the exchange rates quoted by the National Bank of Poland (NBP). Data were processed and analyzed in the Statistica 13 program.

3.2. Methods

The study was conducted in several stages.

3.2.1. Geographic Variation and Change Trends in Organic Egg production in Poland and the EU

In the first stage of the study, production volume and sales data obtained from Statistic Poland, Eurostat and the Agricultural and Food Quality Inspection were used to determine geographic variation and change trends on organic egg markets in Poland and Europe (EU-28, Norway and Turkey). Descriptive statistics were analyzed, and the coefficient of variation, standard deviation, mean, median, minimum and maximum values were determined to explore changes in the production volume and sales of organic eggs in Poland and other European countries between 2012 and 2017. The coefficient of variation was calculated with the use of Formula (2):
C V % = 100 σ / x ¯
where: CV—coefficient of variation, σ—standard deviation and x ¯ —arithmetic mean.
The coefficient of variation is a measure of the relative dispersion of a variable from the average, and it is more representative than a comparison of standard deviation [73]. The coefficient of variation is expressed in percentage terms, and it is interpreted based on its value. The higher the value of the coefficient of variation, the greater the difference.
Change trends were evaluated by deductive inference based on an analysis of historical data. Historical data were used to present market trends in a linear regression analysis by estimating the value of dependent variable y based on the values of independent variables x (the value of dependent variable “organic egg production” was predicted based on the value of independent variable “year”). Change trends in the time series were determined with the use of a mathematical function (3):
y = β 0 + β 1 x + ξ
where: β0 and β1 are the structural parameters of the regression function, and ξ is the random factor. Parameter β0 in the linear regression equation is the intercept term, and parameter β1 is the coefficient of regression of variable y relative to variable x. Parameter β1 is the directional vector of a linear function that denotes the average change in the value of dependent variable y when the value of independent variable x changes by one unit. A synthetic model was developed on the assumption that the legal regulations applicable to organic farming would not change significantly, organic farming subsidies would be maintained at a similar level, and the prices of raw materials and processed foods would remain fairly constant. The above assumptions were made to limit the effect of random error ξ. The developed model was validated by calculating the coefficient of determination (r2), which denotes the extent to which the model explains changes in the value of variable y. The closer the value of the coefficient of determination is to 1, the better the fit of the model [74,75,76].
The correlations between organic egg production and the variables characterizing organic farming and the performance of European economies in 2017 were analyzed. The analysis relied on Eurostat data on organic farmland, number of organic producers, total retail sales, retail sales per capita, population, GDP per capita, total household consumption expenditure and per capita expenditure in the compared countries. Pearson’s correlation coefficient was calculated with the use of Formula (4) to determine the strength of linear correlations between variables:
r x y = c o v ( x , y ) σ x σ y ,
where: rx,y—Pearson’s correlation coefficient between x and y variables, cov(x,y)—covariance between variables x and y, and σ—standard deviation from the population.

3.2.2. Price Analysis

The median prices in different weight categories (large, medium, small and unsorted) were determined in the next stage. For the sake of simplicity, the median prices will be referred to as “prices” rather than “average prices” in the study. The median prices of organic and conventional eggs were determined based on time-series nominal data and expressed in currency units (in PLN for 100 eggs) at monthly intervals.
In the next step, nominal values were adjusted to real values. Real prices were used to determine real values, which were calculated by adjusting nominal values for changes in egg prices. Real prices for February 2010 were used as the reference to eliminate the effects of inflation. Time-series data adjusted for inflation in the corresponding period and time intervals were developed (monthly inflation between February 2010 and July 2016, where December of the preceding year = 100) [77]. Inflation indicators were converted to chain indicators and, in the following step, into real-based indicators with a given base (usually the beginning of the analyzed time series, i.e., February 2010). The resulting time series of real prices, expressed by prices from the beginning of the analyzed period, were used in further analyses.
The Polish zloty (PLN) is the currency of Poland. To compare the obtained data with other countries, the calculated values were converted to Euro (€) based on the weighted average exchange rate quoted by NBP in each month.

3.2.3. Price Variability

Nominal and real prices were analyzed based on descriptive statistics with the use of the methodology applied in the first stage of the study. Price variability was compared using the coefficient of variation because conventional and organic foods differ in prices and, consequently, mean values. The coefficient of variation was adjusted by calculating the coefficient of determination r2 from linear price regression. Coefficient r2 is a measure of the model’s goodness of fit, and it denotes the extent to which the proportion of the variance in the dependent variable is explained by the independent variable. The coefficient of variation is represented as a value between 0 and 1. The closer the value is to 1, the better the model’s fit.

3.2.4. Comparison of the Prices of Conventional and Organic Eggs

As mentioned before, prices and incomes are the greatest barriers to the demand for and purchase of organic foods. However, consumers who have a preference for organic produce are willing to accept higher prices because they are aware of the health and environmental benefits of organic food. In this case, the price is not a barrier, but it represents the consumers’ willingness to purchase organic produce [7,12,78,79]. According to Würriehausen et al. [80], the prices of conventional and organic foods can be partially interrelated, but they are shaped mainly by independent determinants. For this reason, the study was conducted on the assumption that organic food prices are independent of conventional food prices. The correlations between nominal prices were analyzed to verify the above assumption. The correlation coefficient was r = 0.02650 at p = 0.818, which confirmed the absence of correlations between the nominal prices of organic and conventional eggs.
Based on the assumption that consumers are willing to pay a price premium for products that deliver greater benefits, two mutually independent variables—the prices of organic and conventional eggs—were compared. The hypothesis postulating that variables have normal distribution was tested using the Shapiro–Wilk test. The calculated p-value was less than the significance level of α = 0.05 (price of conventional eggs (€), SW-W = 0.8943, p=0.00001; price of organic eggs (€), SW-W = 0.9303, p=0.00040). Therefore, the null hypothesis was rejected in favor of the alternative hypothesis. In this case, parametric tests cannot be applied to compare two groups of data, and the non-parametric Mann–Whitney U test was applied. Two hypotheses were formulated:
H0: average prices are identical;
H1: the average price of organic eggs is higher than the average price of conventional eggs.

3.2.5. Analysis of Price Premiums

According to Carlson and Jaenicke [17], many food industry analysts regard the price premium as a relative value. Therefore, the premium is the price of an organic product, which is expressed as a percentage of the price of a conventional product [17,63,81]. The price premium was calculated with the use of Formula (5):
P p ( % ) = 100 ( P o P c ) P c ,
where: Pp—price premium, Po—price of the organic product and Pc—price of the conventional product.
Descriptive statistics relating to the price premium in the analyzed period and time-series data modeled with linear regression were calculated.

4. Results

4.1. Egg Markets in European Countries and Poland
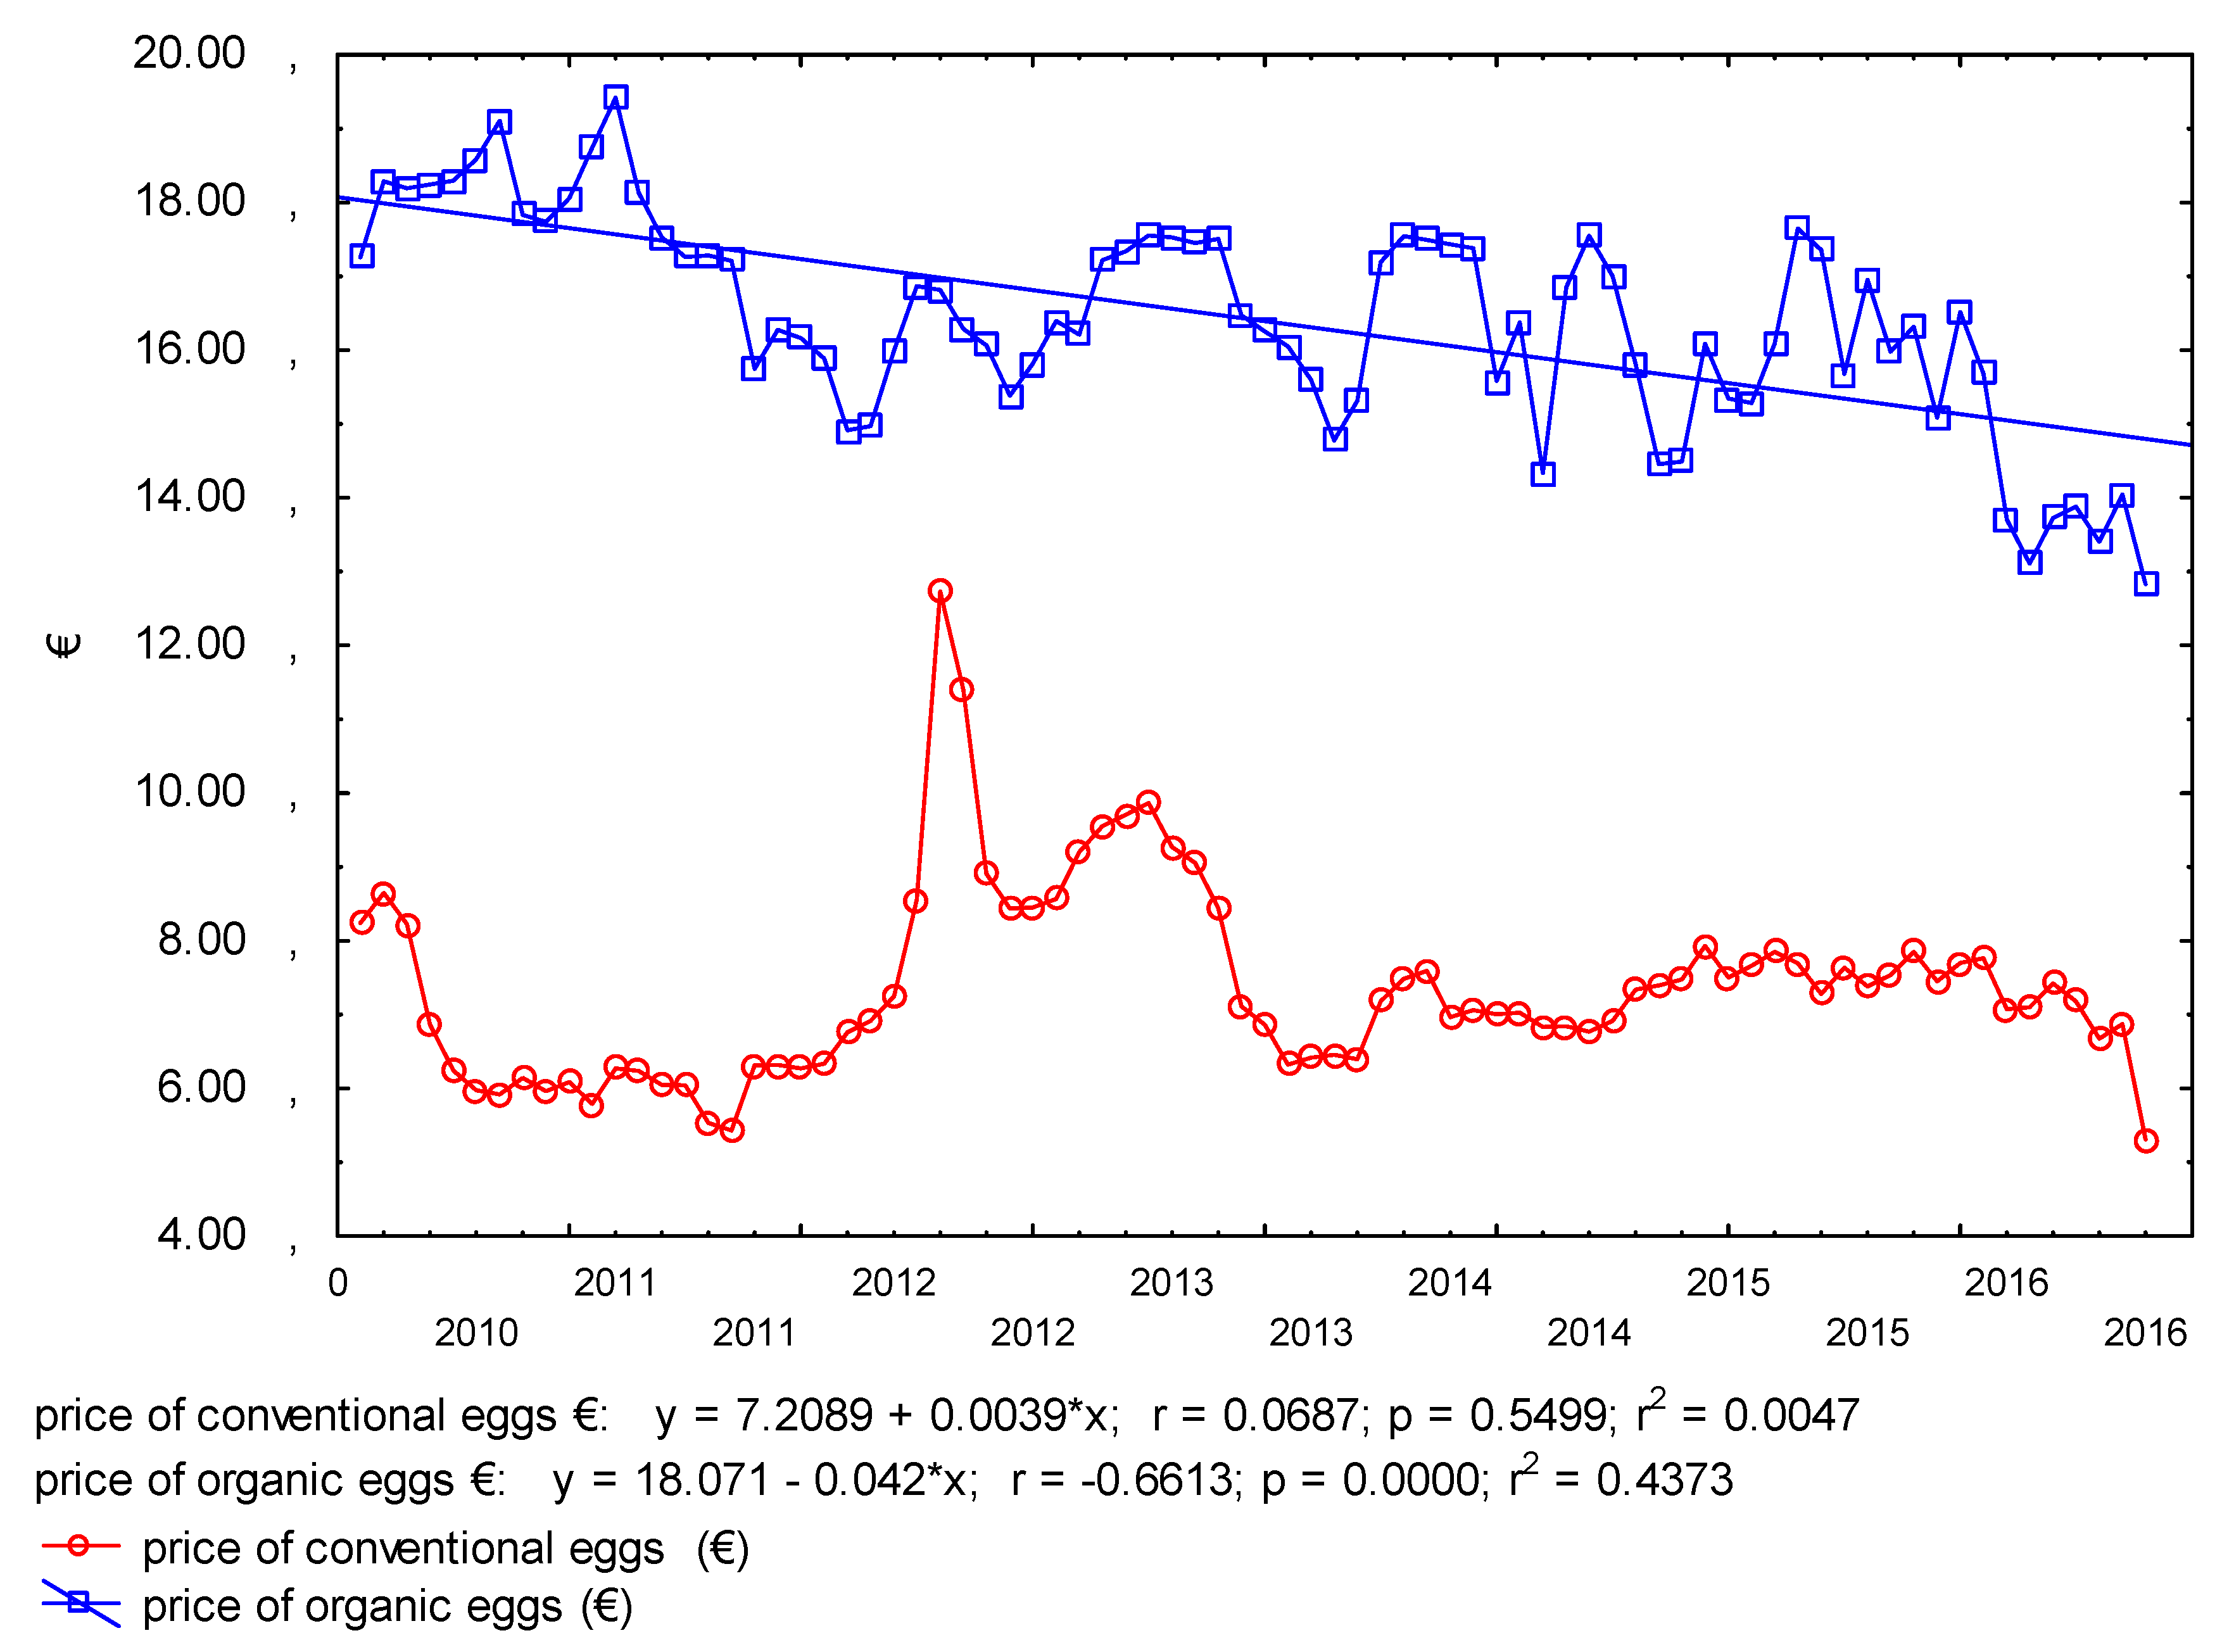
The production and sales of organic eggs continue to increase in Europe. Organic egg sales increased nearly five-fold from more than 1.1 billion eggs in 2012 to 5.2 billion eggs in 2017. The mean annual increase exceeded 800,000 eggs (y = −1.6089E12 + 8.0006E8 × x; p = 0.0001; r2 = 0.9825). The average production in the EU reached 150.5 million eggs in 2016 (median of 19.9 million eggs) and 193.2 million eggs in 2017 (median of 20.3 million eggs). Per capita production in the EU also increased by 1.5 eggs per annum (y = −3159.5024 + 1.5712 × x; p = 0.0001; r2 = 0.9828) (Table 2).
According to Windhorst [82], the organic egg market is characterized by considerable geographic heterogeneity. An analysis of the data in Table 2 confirms the above observation. In 2017, the coefficient of variation reached 196.3%, which points to extreme variability. In 2017, the leading European producers of organic eggs were France (1383 million eggs), Germany (1293.8 million eggs), Netherlands (883.0 million eggs) and Italy (494.6 million eggs). Production was lowest in Montenegro (0.1 million eggs), Serbia (0.2 million eggs), Croatia (0.2 million eggs), Slovakia (0.4 million eggs), Lithuania (1.4 million eggs) and Latvia (1.9 million eggs) (Table 2).
Extreme variations were also noted in the per capita production and sales of organic eggs. The coefficient of variation reached 157.77% in 2016 and 155.60% in 2017. Annual per capita production was highest in the most affluent countries (i.e., Denmark (53 eggs in 2017), the Netherlands (52 eggs in 2017) and Sweden (38 eggs in 2017)). Per capita production was lowest in Serbia (0.03 eggs in 2017), Croatia (0.05 eggs in 2017) and Slovakia (0.07 eggs in 2017) (Table 2).
The correlation analysis revealed a positive correlation between the production volume and sales of organic eggs in Europe vs. household consumption expenditure and population. Production increased with a rise in household expenditure and population. However, the production and sales of organic eggs were also determined by the number of organic food producers, organic farmland (which could be explained by the fact that organic livestock producers are legally obliged to cultivate land) and organic retail sales in the analyzed countries (Table 3).
In Poland, organic egg production was estimated at only 20 million in 2017, and it was very low in comparison with the EU countries (0.35% of total production in the analyzed countries). Per capita production was only 0.53 eggs. These indicators have remained fairly constant over recent years.
According to the unpublished data of the Agricultural and Food Quality Inspection, laying hens and eggs were produced by 3212 organic farms in Poland in 2017. Organic poultry farms accounted for around 15% of all organic farms in Poland. The average annual production per farm exceeded 6300 eggs, which, at the average price of €0.29 per egg (PLN 1.2 per egg based on the exchange rate of €1 = PLN 4.1834), generated only €1,829.57—the average monthly salary in Poland in December 2017 was around € 1,188,92 gross (PLN 4,973.73). About 80% of organic eggs were sold for direct consumption, and 20% were processed in the food industry. The distribution channels on the organic egg market differed considerably.

4.2. Egg Prices

The prices of eggs are susceptible to market shocks, and they can increase by several dozen percent if, for example, undesirable substances are detected in eggs. In 2017, the presence of fipronil, an insecticide with potentially harmful effects for human health and the environment, was detected on many poultry farms in Western Europe [84,85]. The rise in foreign demand for Polish eggs between July and December 2017 increased egg prices on the domestic market by 140%, while the supply of conventional eggs remained constant [86]. Poultry diseases such as avian influenza also pose a problem and have similar consequences [87,88]. In Poland, the decrease in egg production could be attributed to salmonella infections [89]. In 2016, the number of infected adult flocks reached 6%, compared with 2.84% in 2015, which decreased egg supply and increased prices [90].
A clear anomaly in the prices of conventional eggs was observed in March and April 2012. In these months, egg prices increased by approximately 70–80% for two reasons. Firstly, the use of conventional battery cages was prohibited as of 1 January 2012 under the EU legislation on the minimum standards for keeping laying hens. Larger cages were introduced to improve animal welfare (legal basis: Council Directive 1999/74/EC of 19 July 1999 laying down minimum standards for the protection of laying hens). These changes forced poultry breeders to invest heavily in new production systems. Many producers defaulted on bank loans and had to close their business. As a result, egg supply decreased by 20% and prices increased [91]. Secondly, the demand for eggs increased in March and April, before Easter. However, it should be noted that the greatest increase in the demand for eggs is usually observed before Christmas, not Easter [90]. The above events did not affect the prices of organic eggs.
In the analyzed period, the nominal prices of organic eggs exceeded the prices of conventional eggs (Figure 4). Organic eggs were priced at €17.24, and conventional eggs were priced at €8.24 at the beginning of the examined period, and at €12.83 and €5.31, respectively, at the end of the analyzed time series. The average price exceeded €16 for organic eggs and €7 for conventional eggs (Table 4).
An increase in the coefficient of variation and similar values of standard deviation in the analyzed period pointed to greater fluctuations in the nominal prices of conventional than organic eggs. The prices of organic eggs decreased significantly by around €0.04 per month (Figure 4).
In contrast, real prices increased in the analyzed period (Figure 5). The price per 100 organic eggs was determined at €17.26 at the beginning of the examined period, and it peaked in July 2014 at €41.04. The price of organic eggs ranged from €35 to €42 between the end of 2012 and the end of 2015, and it decreased to €28.02 at the end of the analyzed period. The price per 100 conventional eggs reached €8.24 at the beginning of the examined period, it peaked in March 2012 at €22.89 (market anomaly), and it exceeded €11 at the end of the studied period (Table 4). The prices of organic eggs increased by around 80%, and the prices of conventional eggs increased by 102% over the analyzed period, which can be attributed mainly to high prices at the beginning of 2013.
The average real price of organic eggs reached €31 per 100 eggs in the studied period, and it was two times lower for conventional eggs. The values of the coefficient of variation revealed moderate fluctuations in the real prices of both organic (Vc = 22%) and conventional (Vc = 31%) eggs with low standard deviation (Table 4).
Real prices increased by €0.21 for organic eggs and €0.13 for conventional eggs on a monthly basis in the examined period. The developed models were well fitted to the analyzed variables, and they explained more than 42% of variance in the price of conventional eggs and more than 50% of variance in the price of organic eggs (Figure 5).
The results of the Mann–Whitney U test (p < 0.05; U = 66; Z = −10.548; p-value = 0.000; Z adjusted = −10.548; p-value = 0.000; valid N price of conventional eggs (€) = 78; valid N price of organic eggs (€) = 78) supported the rejection of the null hypothesis postulating the absence of differences between the prices of organic and conventional eggs. The differences in the prices of organic and conventional eggs were statistically significant. The distribution of differences between the prices of organic and conventional eggs in the analyzed period is presented in Figure 6. The noted differences were significant, and they increased by around €0.08 on a monthly basis. The results in Table 4 indicate that the average difference between the prices of organic and conventional eggs on the Polish market was around €17 with a similar median. The coefficient of variation points to moderate variation in the analyzed variable (Vc = 23%) and low standard deviation.

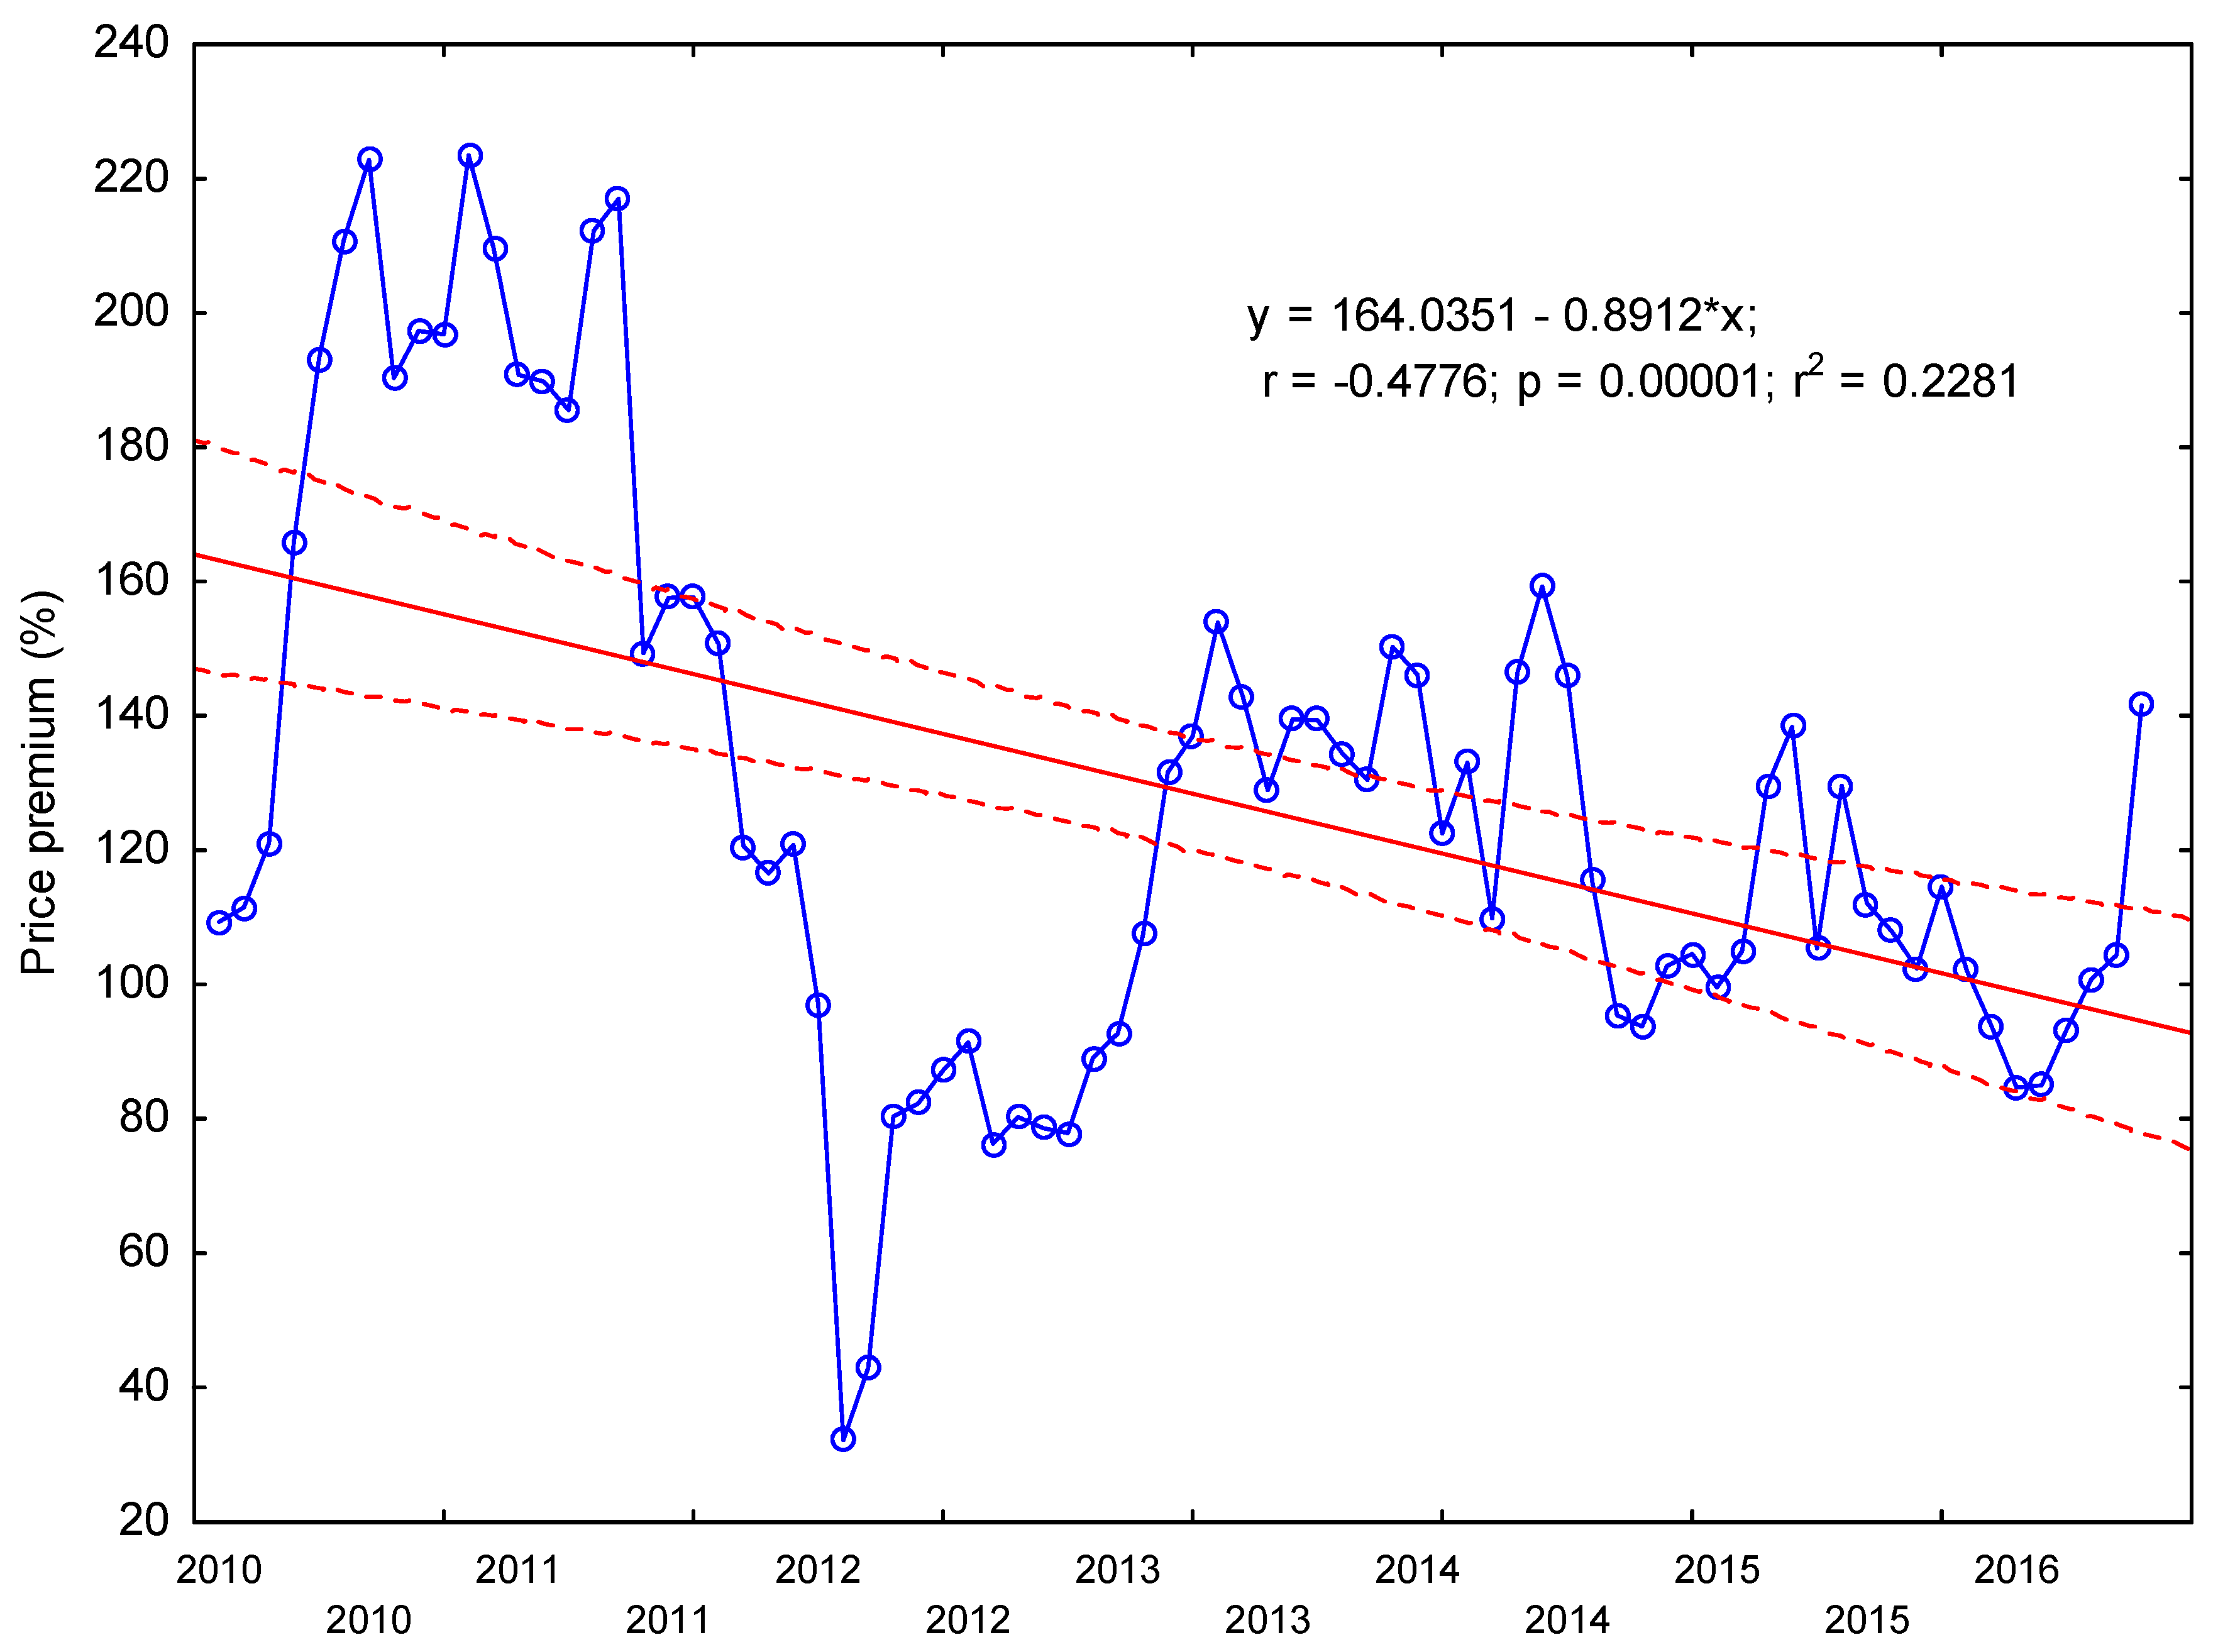
4.3. Price Premium on the Organic Egg Market

The average difference in the price premiums for organic and conventional eggs exceeded 128%, and the median reached 121%. The difference in the compared price premiums was also characterized by moderate variation in the analyzed period. The coefficient of variation reached nearly 33% (Table 4).
The distribution of price premiums in the examined period is presented in Figure 7. These data point to a decreasing trend. The price premium was estimated at 109% at the beginning of the studied period, and it increased rapidly in the following months to exceed 200% in mid-2011. The analyzed variable then decreased steadily and was determined at less than 30% at the beginning of 2012. When the market regained balance, the price premium began to increase and reached 130–150% in mid-2013. Another decrease in the examined variable was noted in 2014–2015. However, the price premium increased rapidly towards the end of the studied period, and it topped 141% in the last month of the analyzed period.
A decrease in the average price premium can be attributed to an increase in supply and sales, including in supermarket chains [9,22,54,92,93,94]. In Poland, the average price premium decreased by nearly 1% on a monthly basis, but the developed model explained only 23% of variance in the original dependent variable. Despite the above, the premium for the price of organic eggs was high enough to compensate for the decrease in supply [92,95]. According to Wier et al. [54], research shows that price premiums have to decrease below 20–30% before organic foods lose their niche status.

5. Discussion

The aim of this study was to determine and analyses variation in price premiums for organic foods on the example of the Polish egg market. The production and sales of organic eggs in Europe was compared, the prices of organic and conventional eggs were analyzed, and the price premium on the Polish market was evaluated. Variation in the price premium for eggs was determined in the analyzed period. The first stage of the analysis relied on the assumption that the production of organic eggs in Poland continues to increase relative to other European countries and that organic egg production varies across the EU. The analysis revealed that the production and sales of organic eggs in Poland continued to increase until 2015 when it exceeded 22 million eggs, with a transient peak of nearly 34 million eggs in 2013. In 2016, production decreased significantly below the 2012 value, and a steady increase was noted in successive years. Therefore, considerable variation in the production of organic eggs in Poland was noted in the studied period. In contrast, organic egg production increased steadily by more than 800,000 eggs per annum in the compared European countries. France, Germany, Netherlands, Italy, Sweden, Denmark and the United Kingdom are the leading producers of organic eggs in Europe. For those markets, organic eggs have an 8–30% share of poultry production [13]. In Poland, despite the growing demand for healthy organic products [31], organic eggs accounted for only 0.2% of total egg production [32]. In the future, the demand for organic eggs on the Polish market could increase with a further rise in incomes, growing awareness about health and the environment and changes in the market structure on the supply side. As a result, high prices will cease to inhibit the growth of the organic food market. A positive correlation between organic egg production and household consumption expenditure was noted in European countries. An even stronger correlation was observed between egg production and retail organic sales.
The European egg market is characterized by significant geographic variation. The value of the coefficient of variation decreased in 2012–2017, but it was still high at 196.3% in 2017. These differences can be attributed mainly to demand, which is influenced by population and household consumption expenditure. Population and household expenditure were bound by a strong, positive correlation with demand. The supply side of the market represented by farmers, processing companies and distributors also plays a significant role. Organic egg production was bound by a positive correlation with the number of organic farms and organic agricultural land.
In the next stage of the study, the nominal and real prices of organic and conventional eggs were analyzed between February 2010 and July 2016 in Poland. The nominal and real prices of organic eggs were higher than the prices of conventional eggs throughout the entire analyzed period. The average nominal price was determined at €16 (median of €16.38), and the average real price exceeded €31 (median of €33.11) for organic eggs. The corresponding values for conventional eggs were €7.36 (median of €7.14) and €14.3 (median of €15.99). The results of the Mann–Whitney U test revealed significant differences between the prices of organic and conventional eggs. The average difference in real prices was estimated at €17, and it tended to increase by €0.8 on a monthly basis in the analyzed period. The nominal prices of organic eggs tended to decrease by €0.4, on average, on a monthly basis. No significant differences were found in the nominal prices of conventional eggs.
An upward trend was observed in the real prices of both organic and conventional eggs. Real prices increased by €0.21 for organic eggs and by €0.12 for conventional eggs. An increase in purchasing power drove up the price of 100 eggs from more than €17 for organic eggs and €8 for conventional eggs at the beginning of the analyzed period to more than €28 and €11, respectively, at the end of the examined period.
The premium on the wholesale price of organic eggs in Poland was determined in the next stage of the study. This variable peaked at 223.5% at the beginning of the studied period, and it reached the minimum value of 32.1% in February and March 2012. Interestingly, the minimal price premium for organic eggs was noted during a shortage of conventional eggs on the domestic market.
The average price premium for organic eggs exceeded 128% (median of 121%). This can be attributed to the characteristics of the Polish market, where potential demand is high, but real demand is low because of high prices and low incomes. The supply of organic eggs is also relatively low because of low production, scarcity of the relevant data and the leading role of imported products [25]. The existing barriers can considerably hamper the growth of the organic egg market in Poland.
The price premium was characterized by moderate variation (Vc = 33%, i.e., low fluctuations) in the analyzed period. Similar trends have been reported by other researchers investigating organic foods [9,22,54,92,93,94]. In Poland, the price premium for organic eggs decreased by around 1% per month in the examined period.

6. Conclusions

The Polish organic food market does not fulfill two of the three important considerations for a well-functioning market proposed by Michelsen [22]. Firstly, organic foods are sold in small quantities, mainly in specialty shops [24]. Organic farmers have a small base of potential clients, and they often sell their produce as conventional food, which undermines the stability of organic supplies [96,97]. Large retail chains have developed an interest in organic food only recently, but most of them carry imported products. The second consideration has been met for the Polish market, which has an effective labeling and certification system [98,99]. The third requirement has not been fulfilled. The price premiums for most organic products are very high, and similar observations were made for the market of organic eggs. At present, the average difference between the prices of organic and conventional products is not acceptable to most Polish consumers. Demand is driven by non-price determinants, and organic food is purchased mainly by young consumers with relatively high incomes and high levels of health and environmental awareness.
This is the first ever study to analyze the price premiums of organic products in Poland. The research relied primarily on a unique set of secondary data that has not been used elsewhere. The results can provide valuable inputs for similar analyses of other market segments and countries. In the future, the key determinants of price premiums on the Polish organic market could also be analyzed with the use of a survey questionnaire. The results of the survey could be used to determine whether an increase in supply contributes to a decrease in prices, and whether an increase in production compensates for the drop in prices. Do market mechanisms support premium pricing on both agricultural and consumer markets? Price premiums have to be charged by all entities in the supply chain. How would the market respond if subsidies for organic farming were to be discontinued in Europe? The main limitation of the present study is the scarcity of data on the Polish market. Statistical data on the production and prices of conventional foods, cultivated area, animal production and productivity are widely available, whereas the relevant information is scarce or unavailable in the organic food sector. Data relating to organic farming should be collected and analyzed to provide valuable inputs for the institutions responsible for organic farming laws and regulations, as well as for food processing companies, retailers, wholesalers, farmers and researchers or policy makers. Analyses of price premiums can reveal product shortages, excess stock or other changes in the relationship between demand and supply. Price premiums can be monitored to gather information about the pricing strategies of market competitors, in particular foreign businesses.

Funding

The results presented in this paper were obtained as part of a comprehensive study financed by the University of Warmia and Mazury in Olsztyn (grant No. 20.610.006-110). Project financially supported by Minister of Science and Higher Education in the range of the program entitled “Regional Initiative of Excellence” for the years 2019-2022, Project No. 010/RID/2018/19, amount of funding 12.000.000 PLN.

Acknowledgments

I would like to express my thanks to the editor and the reviewers for their valuable comments and for the detailed suggestions they made on how to improve the paper.

Conflicts of Interest

The author declares no conflict of interest. The funders had no role in the design of the study; in the collection, analyses, or interpretation of data; in the writing of the manuscript, or in the decision to publish the results.

References

  1. Williams, P.R.D.; Hammitt, J.K. Perceived risks of conventional and organic produce: Pesticides, pathogens, and natural toxins. Risk Anal. 2001, 21, 319–330. [Google Scholar] [CrossRef] [PubMed]
  2. Truong, T.T.; Yap, M.H.T.; Ineson, E.M. Potential Vietnamese consumers’ perceptions of organic foods. Br. Food J. 2012, 114, 529–543. [Google Scholar] [CrossRef]
  3. Goetzke, B.; Nitzko, S.; Spiller, A. Consumption of organic and functional food. A matter of well-being and health? Appetite 2014, 77, 96–105. [Google Scholar] [CrossRef] [PubMed]
  4. Zhang, B.; Zetian, F.; Jian, H.; Jieqiong, W.; Shuyao, X.; Lingxian, Z. Consumers’ perceptions, purchase intention, and willingness to pay a premium price for safe vegetables: A case study of Beijing, China. J. Clean. Prod. 2018, 197, 1498–1507. [Google Scholar] [CrossRef]
  5. Bryła, P. Organic food consumption in Poland: Motives and barriers. Appetite 2016, 105, 737–746. [Google Scholar] [CrossRef]
  6. McKay, S.M. Understanding Organic Prices: An Analysis of Organic Price Risk and Premiums. In Masters Theses; Virginia Polytechnic Institute and State University: Blacksburg, VA, USA, 2016; p. 59. [Google Scholar]
  7. Rana, J.; Paul, J. Consumer behavior and purchase intention for organic food: A review and research agenda. J. Retail. Consum. Serv. 2017, 38, 157–165. [Google Scholar] [CrossRef]
  8. Thompson, G.D. Consumer demand for organic foods: What we know and what we need to know. Am. J. Agric. Econ. 1998, 80, 1113–1118. [Google Scholar] [CrossRef]
  9. Millock, K.; Hansen, L.G.; Wier, M.; Mørch Andersen, L. Willingness to Pay for Organic Foods: A Comparison between Survey Data and Panel Data from Denmark. In Proceedings of the 12th Annual EAERE Conference, Monterey, CA, USA, 4–27 June 2002; p. 23. [Google Scholar]
  10. Zhou, Y.; Thøgersen, J.; Ruan, Y.; Huang, G. The moderating role of human values in planned behavior: The case of Chinese consumers’ intention to buy organic food. J. Consum. Mark. 2013, 30, 335–344. [Google Scholar] [CrossRef]
  11. Gelski, J. Sales Growth of Organic Foods Slips to 6.4% in 2017. Available online: https://www.foodbusinessnews.net/articles/11853-sales-growth-of-organic-foods-slips-to-64-in-2017 (accessed on 13 March 2019).
  12. Sultan, P.; Wong, H.Y.; Sigala, M. Segmenting the Australian organic food consumer market. Asia Pac. J. Mark. Logist. 2018, 30, 163–181. [Google Scholar] [CrossRef]
  13. Willer, H.; Schaack, D.; Lernoud, J. Organic farming and market development in Europe and the European Union. In The World of Organic Agriculture. Statistics and Emerging Trends 2019; Willer, H., Lernoud, J., Eds.; Research Institute of Organic Agriculture FiBL, IFOAM-Organics International: Bonn, Germany, 2019; pp. 217–254. [Google Scholar]
  14. Oberholtzer, L.; Dimitri, C.; Greene, C. Price Premiums Hold on as US Organic Produce Market Expands; US Department of Agriculture, Economic Research Service: Washington, DC, USA, 2005; p. 22.
  15. Poulston, J.; Yiu, A.Y.K. Profit or principles: Why do restaurants serve organic food? Int. J. Hosp. Manag. 2011, 30, 184–191. [Google Scholar] [CrossRef]
  16. Loke, M.K.; Xu, X.; Leung, P. Estimating organic, local, and other price premiums in the Hawaii fluid milk market. J. Dairy Sci. 2015, 98, 2824–2830. [Google Scholar] [CrossRef] [Green Version]
  17. Carlson, A.; Jaenicke, E. Changes in Retail Organic Price Premiums from 2004 to 2010; United States Department of Agriculture: Washington, DC, USA, 2016; p. 38.
  18. Jeong, E.; Jang, S. Price premiums for organic menus at restaurants: What is an acceptable level? Int. J. Hosp. Manag. 2019, 77, 117–127. [Google Scholar] [CrossRef]
  19. Asche, F.; Larsen, T.A.; Smith, M.D.; Sogn-Grundvåg, G.; Young, J.A. Pricing of eco-labels with retailer heterogeneity. Food Policy 2015, 53, 82–93. [Google Scholar] [CrossRef]
  20. Ankamah-Yeboah, I.; Nielsen, M.; Nielsen, R. Price premium of organic salmon in Danish retail sale. Ecol. Econ. 2016, 122, 54–60. [Google Scholar] [CrossRef]
  21. Van Loo, E.J.; Caputo, V.; Nayga Jr, R.M.; Meullenet, J.-F.; Ricke, S.C. Consumers’ willingness to pay for organic chicken breast: Evidence from choice experiment. Food Qual. Prefer. 2011, 22, 603–613. [Google Scholar] [CrossRef]
  22. Michelsen, J.; Hamm, U.; Wynen, E.; Roth, E. The European Market for Organic Products: Growth and Development; Universität Hohenheim: Stuttgart, Germany, 1999; Volume 7, p. 199. [Google Scholar]
  23. Mapusua, K. The Pacific Islands. In The World of Organic Agriculture. Statistics and Emerging Trends 2019; Willer, H., Lernoud, J., Eds.; Research Institute of Organic Agriculture FiBL; IFOAM-Organics International: Bonn, Germany, 2019; pp. 307–312. [Google Scholar]
  24. Łuczka-Bakuła, W.; Smoluk-Sikorska, J. Poziom cen ekologicznych owoców i warzyw a rozwój rynku żywności ekologicznej (The organic fruit and vegetables price level and the development of organic food market). J. Res. Appl. Agric. Eng. 2010, 55, 12–14. [Google Scholar]
  25. Pawlewicz, A.; Szamrowski, P. Funkcjonowanie i rozwój rynku ekologicznych surowców żywnościowych w nowej perspektywie finansowej w latach 2014–2020 (The Functioning and Development of the Organic Food Raw Materials Market under the New Financial Plan for 2014–2020). Wieś I Rol. 2014, 3, 175–188. [Google Scholar]
  26. Brodzińska, K. Problems of Biodiversity Conservation in Polish Agriculture. Agroecol. Sustain. Food Syst. 2015, 39, 155–169. [Google Scholar] [CrossRef]
  27. Szymona, J. Szanse i Zagrożenia Polskiego Rolnictwa Ekologicznego w Perspektywie lat 2014-2020 (Chances and Threats to Polish Organic Farming in the Perspective of 2014–2020); Dokumentacji, Z., Ed.; Kancelaria Senatu RP: Warszawa, Poland, 2013; Volume OE-210, p. 9. [Google Scholar]
  28. Chintakayala, P.K.; Young, W.; Barkemeyer, R.; Morris, M.A. Breaking niche sustainable products into the mainstream: Organic milk and free-range eggs. Bus. Strategy Environ. 2018, 27, 1039–1051. [Google Scholar] [CrossRef] [Green Version]
  29. Rakonjac, S.; Bogosavljevic-Boskovic, S.; Pavlovski, Z.; Skrbic, Z.; Doskovic, V.; Petrovic, M.D.; Petricevic, V. Laying hen rearing systems: A review of major production results and egg quality traits. Worlds Poult. Sci. J. 2014, 70, 93–104. [Google Scholar] [CrossRef]
  30. Oberholtzer, L.; Greene, C.; Lopez, E. Organic Poultry and Eggs Capture High Price Premiums and Growing Share of Specialty Markets; US Department of Agriculture, Economic Research Service: Washington, DC, USA, 2006; p. 18.
  31. Żakowska-Biemans, S.; Tekień, A. Free Range, Organic? Polish Consumers Preferences Regarding Information on Farming System and Nutritional Enhancement of Eggs: A Discrete Choice Based Experiment. Sustainability 2017, 9, 1999. [Google Scholar] [CrossRef] [Green Version]
  32. KIPDiP. W Strukturze Chowu Jaj W Polsce Zajdą Zmiany, ale Nie Tak duże Jak Chcieliby Ekolodzy (There will be Changes in the Structure of Egg Farming in Poland, but not as Big as Environmentalists would Like). Available online: http://www.portalspozywczy.pl/mieso/wiadomosci/kipdip-w-strukturze-chowu-jaj-w-polsce-zajda-zmiany-ale-nie-tak-duze-jak-chcieliby-ekolodzy,155886.html (accessed on 13 March 2019).
  33. Chang, J.B.; Lusk, J.L.; Norwood, F.B. The Price of Happy Hens: A Hedonic Analysis of Retail Egg Prices. J. Agric. Resour. Econ. 2010, 35, 406–423. [Google Scholar]
  34. Andersen, L.M. Animal Welfare and Eggs–Cheap Talk or Money on the Counter? J. Agric. Econ. 2011, 62, 565–584. [Google Scholar] [CrossRef] [Green Version]
  35. Kowalczuk, I.; Gutkowska, K.; Sajdakowska, M.; Zakowska-Biemans, S.; Kozlowska, A.; Olewnik-Mikolajewska, A. Innowacyjny konsument żywności pochodzenia zwierzęcego (Innovative Consumer of Food of Animal Origin). Żywność Nauka Technol. Jakość 2013, 20. [Google Scholar]
  36. FiBL. European and Global Organic Farming Statistics 2000–2017; The Statistics.FiBL.org website maintained by the Research Institute of Organic Agriculture (FiBL): Frick, Switzerland; Available online: https://statistics.fibl.org/ (accessed on 31 March 2019).
  37. IJHARS. Powierzchnia Ekologicznych Użytków Rolnych w Polsce w 2017 r. (The Area of Organic Farmland in Poland in 2017). Available online: https://ijhars.gov.pl/raporty-i-analizy.html (accessed on 27 July 2019).
  38. Lowder, S.K.; Skoet, J.; Singh, S. What do We Really Know about the Number and Distribution of Farms and Family Farms in the World; FAO: Rome, Italy, 2014; Volume 14, p. 45. [Google Scholar]
  39. Graeub, B.E.; Chappell, M.J.; Wittman, H.; Ledermann, S.; Kerr, R.B.; Gemmill-Herren, B. The state of family farms in the world. World Dev. 2016, 87, 1–15. [Google Scholar] [CrossRef] [Green Version]
  40. Lowder, S.K.; Skoet, J.; Raney, T. The number, size, and distribution of farms, smallholder farms, and family farms worldwide. World Dev. 2016, 87, 16–29. [Google Scholar] [CrossRef] [Green Version]
  41. IJHARS. Liczba Producentów Ekologicznych w Polsce, wg Stanu na 31 grudnia 2017 r. (The Number of Organic Producers in Poland, as at 31 December 2017). Available online: https://ijhars.gov.pl/raporty-i-analizy.html (accessed on 27 July 2019).
  42. Pawlewicz, A. Regional diversity of organic food sales in the European Union. In Proceedings of the Economic Science for Rural Development, Jelgava, Latvia, 9–10 May 2019; pp. 360–366. [Google Scholar]
  43. DH. Rynek żywności Ekologicznej w Polsce to 0,3 Proc. Rynku Spożywczego (The Organic Food Market in Poland is 0.3 Percent. Food Market). Available online: http://www.dlahandlu.pl/e-commerce/wiadomosci/rynek-zywnosci-ekologicznej-w-polsce-to-0-3-proc-rynku-spozywczego,69178.html (accessed on 27 July 2019).
  44. Lernoud, J.; Willer, H. Current Statistics on Organic Agriculture Worldwide:Area, Operators, and Market. In The World of Organic Agriculture. Statistics and Emerging Trends 2019; Willer, H., Lernoud, J., Eds.; Research Institute of Organic Agriculture FiBL; IFOAM-Organics International: Bonn, Germany, 2019; pp. 34–128. [Google Scholar]
  45. Seufert, V.; Ramankutty, N.; Mayerhofer, T. What is this thing called organic? – How organic farming is codified in regulations. Food Policy 2017, 68, 10–20. [Google Scholar] [CrossRef] [Green Version]
  46. Wier, M.; Hansen, L.G.; Andersen, L.M.; Millock, K. Consumer preferences for organic foods. In Organic Agriculture: Sustainability, Markets and Policies; OECD: Paris, France, 2003; pp. 257–271. [Google Scholar]
  47. Torjusen, H.; Sangstad, L.; O’Doherty Jensen, K.; Kjærnes, U. European Consumers’ Conceptions of Organic Food: A Review of Available Research; National institute for consumer research: Oslo, Norway, 2004; p. 147. [Google Scholar]
  48. Dunn, J.W.; Bórawski, P.; Pawlewicz, A. Development of Organic Farming in the USA. Acta Sci. Pol. Oeconomia 2014, 13, 55–68. [Google Scholar]
  49. McCullough, E.B.; Pingali, P.L.; Stamoulis, K.G. Small farms and the transformation of food systems: An overview. In Looking East, Looking West: Organic and Quality Food Marketing in Asia and Europe; Haas, R., Canavari, M., Slee, B., Tong, C., Anurugsa, B., Eds.; Wageningen Academic Publishers: Wageningen, The Netherlands, 2010; pp. 47–83. [Google Scholar]
  50. Kaus, W. Beyond Engel’s law-A cross-country analysis. J. Socio-Econ. 2013, 47, 118–134. [Google Scholar] [CrossRef]
  51. Kim, S.-W.; Lusk, J.L.; Brorsen, B.W. “Look at Me, I’m Buying Organic”: The Effects of Social Pressure on Organic Food Purchases. J. Agric. Resour. Econ. 2018, 43, 364–387. [Google Scholar] [CrossRef]
  52. Amfo, B.; Ansah, I.G.K.; Donkoh, S.A. The effects of income and food safety perception on vegetable expenditure in the Tamale metropolis, Ghana. J. Agribus. Dev. Emerg. Econ. 2019, 9, 276–293. [Google Scholar] [CrossRef]
  53. Kiatkawsin, K.; Han, H. What drives customers’ willingness to pay price premiums for luxury gastronomic experiences at michelin-starred restaurants? Int. J. Hosp. Manag. 2019, 82, 209–219. [Google Scholar] [CrossRef]
  54. Wier, M.; Jensen, K.O.D.; Andersen, L.M.; Millock, K. The character of demand in mature organic food markets: Great Britain and Denmark compared. Food Policy 2008, 33, 406–421. [Google Scholar] [CrossRef] [Green Version]
  55. Golijan, J.; Popović, A. Basic characteristics of the organic agriculture market. In Proceedings of the Fifth International Conference Competitiveness of Agro-Food and Environmental Economy, Bucharest, Romania, 10–11 November 2016; pp. 236–244. [Google Scholar]
  56. Napolitano, F.; Braghieri, A.; Piasentier, E.; Favotto, S.; Naspetti, S.; Zanoli, R. Effect of information about organic production on beef liking and consumer willingness to pay. Food Qual. Prefer. 2010, 21, 207–212. [Google Scholar] [CrossRef] [Green Version]
  57. Ricke, S.C.; Van Loo, E.J.; Johnson, M.G.; O’Bryan, C.A. Organic Meat Production and Processing; John Wiley & Sons: Hoboken, NJ, USA, 2012; Volume 53, p. 446. [Google Scholar]
  58. Van der Veen, M. When is food a luxury? World Archaeol. 2003, 34, 405–427. [Google Scholar] [CrossRef]
  59. Halberg, N.; Peramaiyan, P.; Walaga, C. Is organic farming an unjustified luxury in a world with too many hungry people? In The World of Organic Agriculture. Statistics & Emerging Trends 2009; FiBL and IFOAM: Frick, Switzerland, 2009; pp. 95–100. [Google Scholar]
  60. Zhang, B.; Kim, J.-H. Luxury fashion consumption in China: Factors affecting attitude and purchase intent. J. Retail. Consum. Serv. 2013, 20, 68–79. [Google Scholar] [CrossRef]
  61. Salem, S.F.; Chaichi, K. Investigating causes and consequences of purchase intention of luxury fashion. Manag. Sci. Lett. 2018, 8, 1259–1272. [Google Scholar] [CrossRef]
  62. Rao, A.R.; Bergen, M.E. Price premium variations as a consequence of buyers’ lack of information. J. Consum. Res. 1992, 19, 412–423. [Google Scholar] [CrossRef]
  63. Farris, P.W.; Bendle, N.T.; Pfeifer, P.E.; Reibstein, D.J. Marketing Metrics: The Definitive Guide to Measuring Marketing Performance; Pearson Education, Inc.: Upper Saddle River, NJ, USA, 2010; p. 416. [Google Scholar]
  64. Macias, W.; Rodriguez, K. Brand Valuation by Price Premium: Theoretical Explanation and Practical Application Using Conjoint Analysis. Knowl. Manag. Int. J. 2018, 17, 13–27. [Google Scholar] [CrossRef]
  65. Siderer, Y.; Maquetb, A.; Anklam, E. Need for research to support consumer confidence in the growing organic food market. Trends Food Sci. Technol. 2005, 16, 332–343. [Google Scholar] [CrossRef]
  66. Brown, C.; Sperow, M. Examining the cost of an all-organic diet. J. Food Distrib. Res. 2005, 36, 20. [Google Scholar]
  67. Kremen, A.; Greene, C.; Hanson, J. Organic Produce, Price Premiums, and Eco-Labeling in US Farmers’ Markets; Nova Science Publishers, Inc.: Hauppauge, NY, USA, 2010; pp. 191–202. [Google Scholar]
  68. Hatch, E.M.; Lazaraton, A. The Research Manual: Design and Statistics for Applied Linguistics; Newbury House Publishers: New York, NY, USA, 1991. [Google Scholar]
  69. Mishra, S.K. Median as a weighted arithmetic mean of all sample observations. SSRN Electron. J. 2004, 6. [Google Scholar] [CrossRef] [Green Version]
  70. Nowak, E. Metody Taksonomiczne W Klasyfikacji Obiektów SpołEczno-Gospodarczych (Taxonomic Methods in the Classification of Socio-Economic Objects); Państwowe Wydaw. Ekonomiczne: Wrocław, Poland, 1990. [Google Scholar]
  71. Walczak, B.; Massart, D.L. Dealing with missing data: Part I. Chemom. Intell. Lab. Syst. 2001, 58, 15–27. [Google Scholar] [CrossRef]
  72. Twisk, J.; de Vente, W. Attrition in longitudinal studies: How to deal with missing data. J. Clin. Epidemiol. 2002, 55, 329–337. [Google Scholar] [CrossRef]
  73. Brown, C.E. Coefficient of variation. In Applied Multivariate Statistics in Geohydrology and Related Sciences; Springer: Berlin, Germany, 1998; pp. 155–157. [Google Scholar]
  74. Sobczyk, M. Jednorównaniowe modele ekonometryczne w prognozowaniu (Single equation econometric models in forecasting). In Prognozowaniegospodarcze. Metody, Modele, Zastosowania, Przykłady; Nowak, E., Ed.; Agencja Wydawnicza Placet: Warszawa, Poland, 1998; pp. 97–119. [Google Scholar]
  75. Kuropka, I. Prognozowanie na podstawie modelu ekonometrycznego (Forecasting based on an econometric model). In Prognozowanie Gospodarcze. Metody i Zastosowanie; Cieślik, M., Ed.; PWN: Warszawa, Poland, 2001; pp. 104–139. [Google Scholar]
  76. Kuszewski, T.; Tomczyk, E. Jednorównaniowy liniowy model ekonometryczny. Metoda najmniejszych kwadratów (Single equation linear econometric model. Least squares method). In Ekonometria i Badania Operacyjne: Podręcznik dla Studiów Licencjackich; Gruszczyński, M., Kuszewski, T., Podgórska, M., Eds.; PWN: Warszawa, Poland, 2009; pp. 13–49. [Google Scholar]
  77. GUS. Miesięczne Wskaźniki cen Towarów i Usług Konsumpcyjnych od 1982 Roku (Monthly Price Indices of Consumer Goods and Services Since 1982). Available online: https://stat.gov.pl/obszary-tematyczne/ceny-handel/wskazniki-cen/wskazniki-cen-towarow-i-uslug-konsumpcyjnych-pot-inflacja-/miesieczne-wskazniki-cen-towarow-i-uslug-konsumpcyjnych-od-1982-roku/ (accessed on 31 March 2019).
  78. Jang, Y.J.; Kim, W.G.; Bonn, M.A. Generation Y consumers’ selection attributes and behavioral intentions concerning green restaurants. Int. J. Hosp. Manag. 2011, 30, 803–811. [Google Scholar] [CrossRef]
  79. Moser, A.K. Thinking green, buying green? Drivers of pro-environmental purchasing behavior. J. Consum. Mark. 2015, 32, 167–175. [Google Scholar] [CrossRef]
  80. Würriehausen, N.; Ihle, R.; Lakner, S. Price relationships between qualitatively differentiated agricultural products: Organic and conventional wheat in Germany. Agric. Econ. 2015, 46, 195–209. [Google Scholar] [CrossRef]
  81. Łuczka-Bakuła, W. Rynek żywności Ekologicznej: Wyznaczniki i Uwarunkowania Rozwoju (Organic Food Market: Determinants and Conditions for Development); PWE: Warszawa, Poland, 2007. [Google Scholar]
  82. Windhorst, H.-W. Development of Organic Egg Production and Marketing in the EU. Worlds Poult. Sci. J. 2005, 61, 451–462. [Google Scholar] [CrossRef]
  83. Eurostat. Organic Farming Statistics. Available online: http://ec.europa.eu/eurostat/statistics-explained/index.php/Organic_farming_statistics (accessed on 31 March 2019).
  84. Pavlicevic, A.; Yoon, J.; Pavlović, I. The fipronil affair, pesticides in eggs-why it happened and can it be prevented from happening again. Invent. J. Res. Technol. Eng. Manag. 2018, 2, 30–35. [Google Scholar]
  85. Stafford, E.G.; Tell, L.A.; Lin, Z.; Davis, J.L.; Vickroy, T.W.; Riviere, J.E.; Baynes, R.E. Consequences of fipronil exposure in egg-laying hens. J. Am. Vet. Med Assoc. 2018, 253, 57–60. [Google Scholar] [CrossRef] [PubMed] [Green Version]
  86. BIP. Jaja Tanieją (The Eggs are Cheaper). Available online: https://businessinsider.com.pl/finanse/handel/jaja-ceny-i-prognoza-na-2018-rok/ttln9tq (accessed on 13 March 2019).
  87. Burgos, S.; Burgos, S.A. Avian influenza outbreaks in southeast Asia affects prices, markets and trade: A short case study. Int. J. Poult. Sci. 2007, 6, 1006–1009. [Google Scholar] [CrossRef] [Green Version]
  88. Paukett, M.R.; Dharmasena, S.; Bessler, D. Revenue Impacts of the 2015 Avian Influenza Virus Outbreak on the United States Table Egg Wholesalers. Ssrn Electron. J. 2018, 1–43. [Google Scholar] [CrossRef] [Green Version]
  89. Pijnacker, R.; Dallman, T.J.; Tijsma, A.S.L.; Hawkins, G.; Larkin, L.; Kotila, S.M.; Amore, G.; Amato, E.; Suzuki, P.M.; Denayer, S.; et al. An international outbreak of Salmonella enterica serotype Enteritidis linked to eggs from Poland: A microbiological and epidemiological study. Lancet Infect. Dis. 2019, 19, 778–786. [Google Scholar] [CrossRef]
  90. Polityka. Ceny Jaj Gwałtownie Rosną (Egg Prices are Rising Rapidly). Available online: https://www.polityka.pl/tygodnikpolityka/rynek/1725600,1,ceny-jaj-gwaltownie-rosna-z-trzech-powodow.read (accessed on 31 March 2019).
  91. Okoniewska, E. Wielkanoc 2012: Wzrosła Cena Jaj (Easter 2012: The Price of Eggs has Increased). Available online: https://dziennikbaltycki.pl/wielkanoc-2012-wzrosla-cena-jaj-ile-trzeba-zaplacic-za-jedno-jajko/ar/533513 (accessed on 31 March 2019).
  92. Butler, G.; Newton, H.; Bourlakis, M.; Leifert, C. Factors influencing supply and demand for organic foods. Food Supply Chain Manag. (Blackwell Publ. Oxf.) 2004, 199–210. [Google Scholar] [CrossRef]
  93. Giraud, G. Consumer perception and marketing of origin and organic labelled food products in Europe. In Marketing Trends for Organic Food in the 21st Century; World Scientific: Singapore, 2004; pp. 191–203. [Google Scholar]
  94. Ankamah-Yeboah, I.; Nielsen, M.; Nielsen, R. Does Organic Supply Growth Lead to Reduced Price Premiums? The Case of Salmonids in Denmark. Mar. Resour. Econ. 2019, 34, 105–121. [Google Scholar] [CrossRef]
  95. Next Generation Organics; No price (spiral); Datamonitor Europe: New York, NY, USA; London, UK, 2001.
  96. Brodzińska, K.H. Determinanty środowiskowe i Gospodarcze Wdrażania Programu Rolnośrodowiskowego (Environmental and Economic Determinants for Implementation of the Agri-Environmental Programme); Wyd. UWM: Olsztyn, Poland, 2013. [Google Scholar]
  97. Pawlewicz, A. Importance of Horizontal Integration in Organic Farming. Econ. Sci. Rural Dev. Prod. Co-Oper. Agric. 2014, 112–120. [Google Scholar]
  98. Gadomska, J.; Sadowski, T.; Buczkowska, M. Ekologiczna żywność jako czynnik sprzyjający zdrowiu (Ecological food as a health-promoting factor). Probl. Hig. I Epidemiol. 2014, 95, 556–560. [Google Scholar]
  99. Mickiewicz, A.; Mickiewicz, B.; Prus, P.; Wawrzyniak, B.M. Miejsce i rola jednostek certyfikujących oraz inspektorów w systemie rolnictwa ekologicznego w Polsce (The place and role of certifying authorities and inspectors in the organic farming system). Zagadnienia Doradz. Rol. 2015, 3, 42–61. [Google Scholar]
Figure 1. Organic agricultural area, rate of change and share of total agricultural land in the world in 2000–2017. Source: author’s calculations based on [36].
Agriculture 10 00035 g001
Figure 2. Number of organic producers and the rate of changes around the world in 2000–2017. Source: author’s calculations based on [36].
Agriculture 10 00035 g002
Figure 3. Organic retail sales and the rate of changes in 2000–2017 (in nominal prices). Source: author’s calculations based on [36].
Agriculture 10 00035 g003
Figure 4. Nominal prices of organic and conventional eggs (price in € for 100 eggs; period—month).
Agriculture 10 00035 g004
Figure 5. Real prices of conventional and organic eggs (fixed process in February 2010; price in € for 100 eggs; period—month).
Agriculture 10 00035 g005
Figure 6. Differences between the prices of organic and conventional eggs (period—month).
Agriculture 10 00035 g006
Figure 7. Price premiums for organic eggs on the Polish market in the analyzed period.
Agriculture 10 00035 g007
Table 1. Organic farming and the organic food market in the world and in Poland in 2017.
RegionOrganic Agr. LandShareShare of Total Agri. LandNumbers of ProducersRetail SalesPer Capita Consumption
ha%%noMillion €
Africa2,056,5713.120.41,144,26316-
Asia6,116,8348.470.3815,07096012.1
Europe14,558,24623.362.9455,74937,35147 *
Latin America8,000,88812.341,1397,5098101.3
North America3,223,0575.410.826,75043,012119.1
Oceania35,894,36547.308.519,017129331.8
World69,845,2431001,42,858,35892,07412,2
Poland494,9790.712.621,400219.76
* EU—€67.2; Source: author’s calculations based on [13,36].
Table 2. Geographic variation and descriptive statistics relating to total and per capita production of organic eggs in Europe in 2012–2017 (in millions of eggs and eggs per capita).
20122013201420152016201720162017
million eggsper capita
Belgium 97.2121.98.5910.74
Czechia3.03.52.33.43.33.70.320.35
Denmark170.4175.0196.1233.4269.9307.947.2853.57
Germany 1293.81293.815.7415.68
Estonia1.41.62.52.52.83.42.132.60
Ireland 17.319.620.923.64.434.93
Greece25.78.213.613.213.113.11.221.22
Spain11.217.616.248.346.376.11.001.64
France 700.0900.01285.41383.019.2920.70
Croatia0.00.10.10.10.20.20.060.05
Italy 209.5461.9494.6494.68.158.16
Cyprus 0.71.20.91.52.31.762.64
Latvia0.60.6 1.21.51.90.760.96
Lithuania0.4 0.60.61.21.40.420.51
Luxembourg2.53.02.82.83.93.96.776.67
Hungary3.53.35.55.12.75.10.270.52
Netherlands583.0574.6628.4708.0773.1883.045.5351.69
Austria 78.277.7105.2131.712.1015.02
Poland20.733.921.822.619.920.30.530.53
Romania13.2 14.522.712.314.90.620.76
Slovenia3.74.14.66.36.98.73.364.19
Slovakia 0.90.20.40.030.07
Finland 42.347.152.255.564.710.1211.76
Sweden 265.1263.6328.7394.9380.140.0838.03
United Kingdom238.3219.6225.9237.0250.1255.73.823.88
Norway32.535.544.850.252.365.910.0312.52
Montenegro 0.10.190.19
Serbia 0.00.1 0.30.20.040.03
Turkey 48.064.958.9147.6161.31.872.02
Total1,109,950,5881,388,675,2362,496,657,5383,199,013,7573,915,325,3955,053,904,046
per capita2.222.774.966.347.749.96
Descriptive statisticsper capita
Valid N1619242529292929
% N55.265.582.886.2100100100100
CV (%)220.6191.5178.0181.1194.4196.3157.77155.60
Arithmetic mean69.475.6106.7130.3150.5193.28.509.37
Median7.48.216.822.619.920.32.132.64
Minimum0.00.00.10.10.20.10.030.03
Maximum583.0574.6700.0900.01285.41383.047.2853.57
SD153.0144.8190.0236.1292.6379.113.4114.57
CI of the SD (-95%)113.0109.4147.7184.3230.4298.610.6411.57
CI of the SD (95%)236.8214.2266.5328.4401.0519.618.1419.71
Source: author’s calculations based on [83].
Table 3. Correlations between organic egg production and the variables characterizing organic farming and the economic performance of the compared countries in 2017.
Rp-Value
Number of all organic operators (registered at the end of the year)* 0.574p = 0.002
Total fully converted and under conversion to organic farming (ha)** 0.5143p = 0.007
Area under organic farming (% of utilized agricultural area (UAA))−0.0641p = 0.756
Retail sales (Million €)* 0.9189p = 0.000
Retail sales (€ per capita)0.3655p = 0.066
Population* 0.7255p = 0.000
Main GDP aggregates per capita (€ per capita)0.1922p = 0.347
Final consumption expenditure of households (Million €)* 0.7553p = 0.000
Final consumption expenditure of households (€ per capita)0.3341p = 0.095
* Indicates significance at 1%; ** Indicates significance at 5%. Source: author’s calculations based on [83].
Table 4. Descriptive statistics for nominal and real wholesale prices of organic and conventional eggs and price premiums (price in € for 100 eggs).
SpecificationNominal PricesReal PricesDifference at Real Prices (€)Price Premium (%)
Price of Conventional Eggs (€)Price of Organic Eggs (€)Price of Conventional Eggs (€)Price of Organic Eggs (€)
Arithmetic mean7.36316.41314.30831.23116.923128.831
Median7.14716.38415.99533.11416.286120.936
Minimum5.31112.8306.52917.2567.35132.118
Maximum12.72719.42122.88841.03625.210223.499
SD1.2831.4394.3856.8313.87942.289
CV (%)17.4308.76530.64721.87222.92332.825

