4.2. Experiment Design
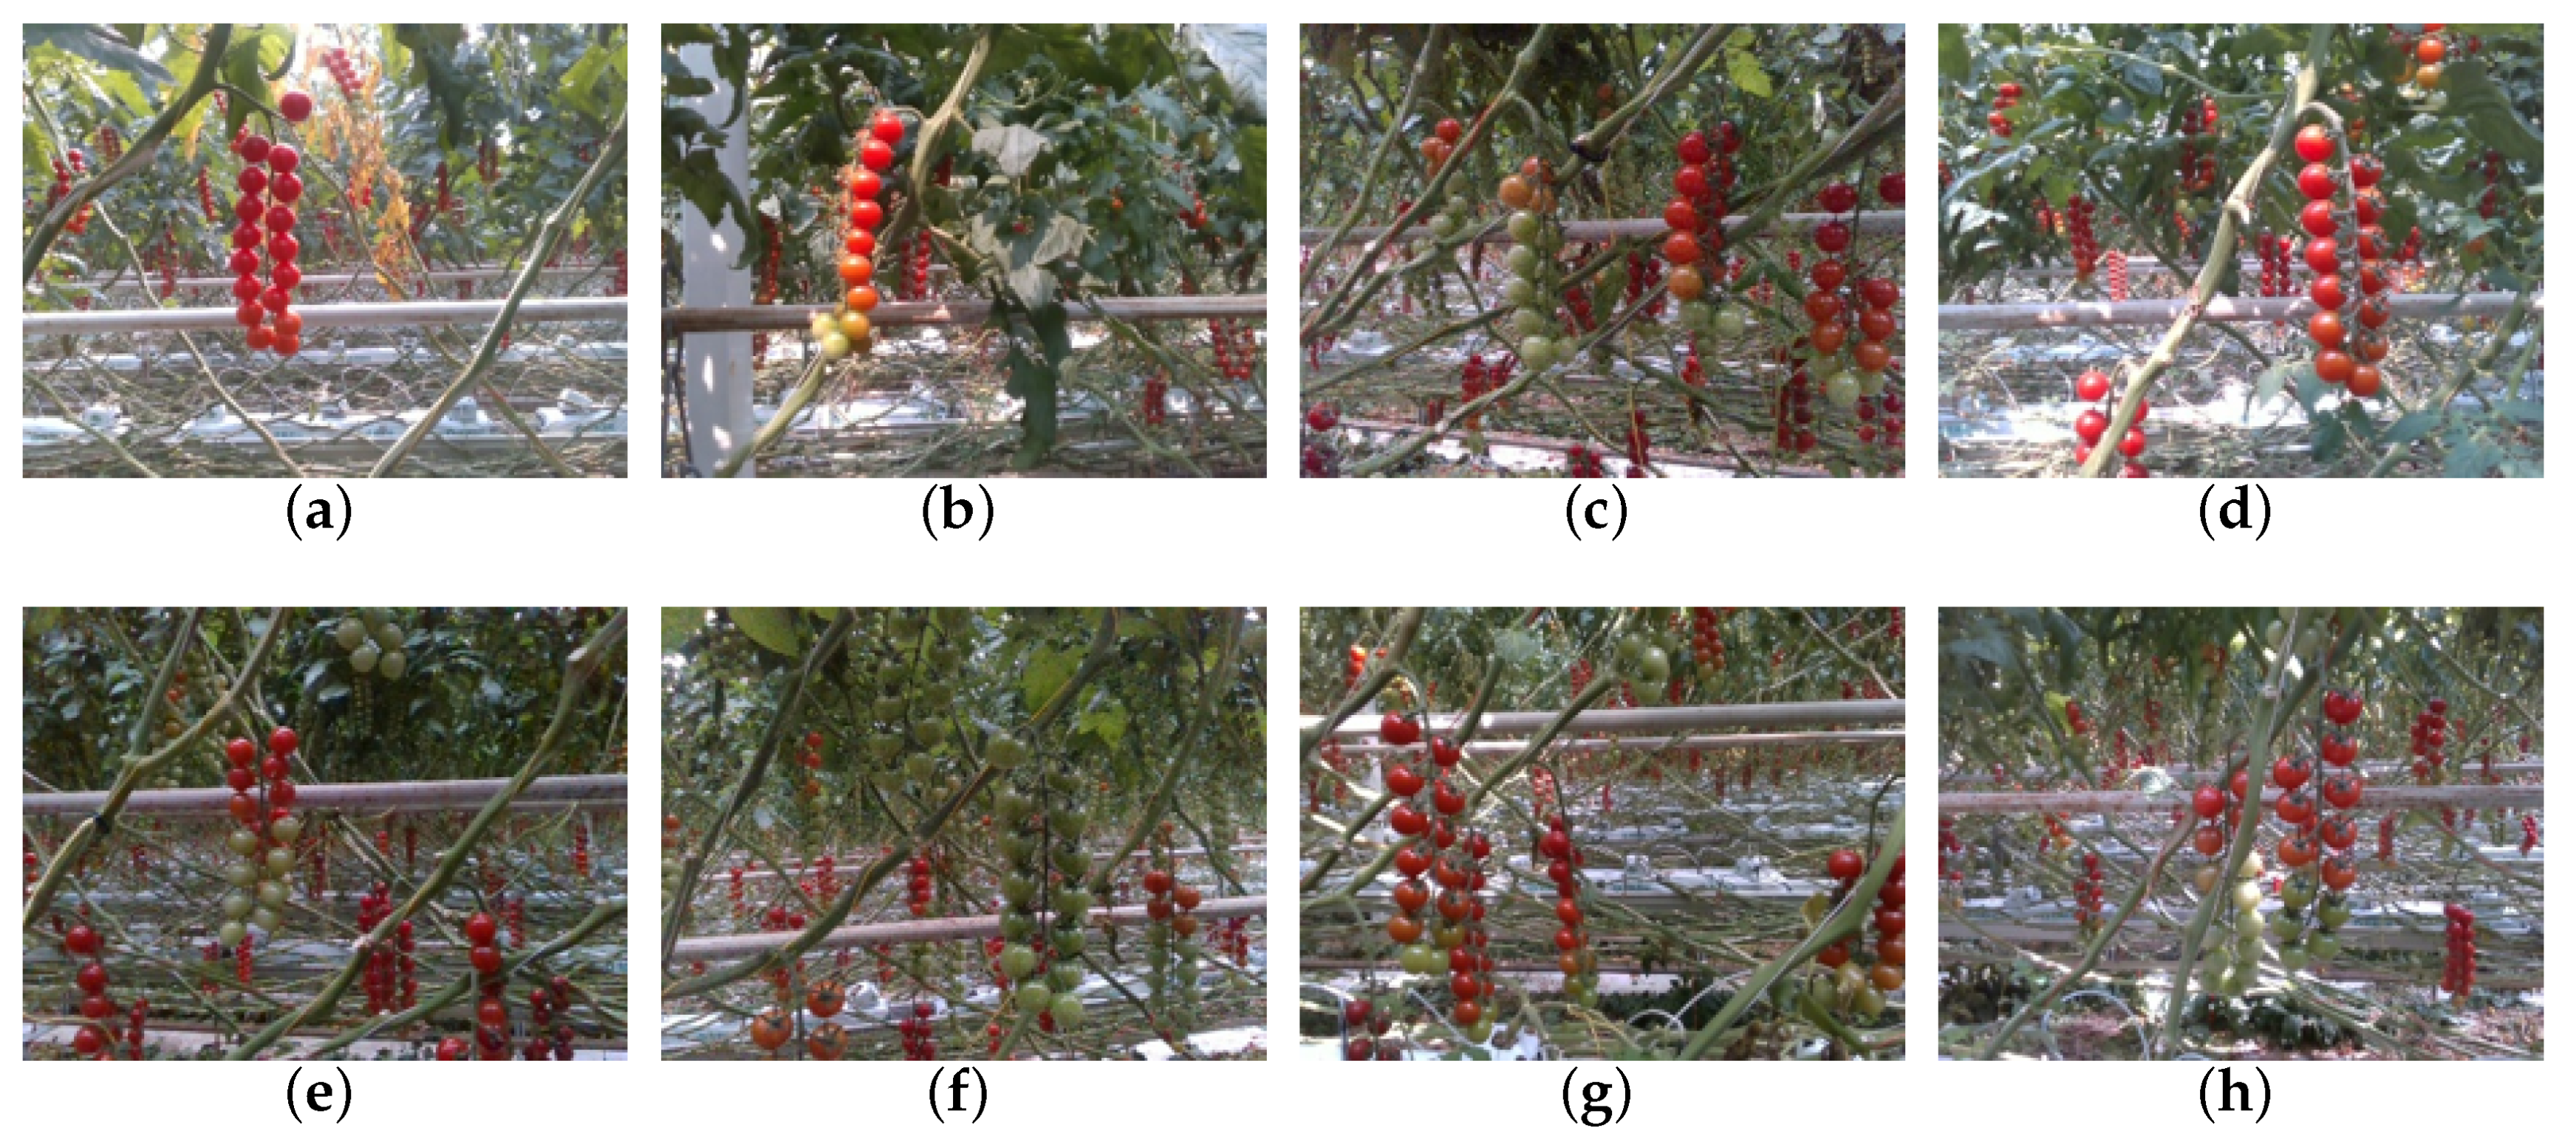
The experimental sample images include various growth status and lighting conditions of cherry tomatoes in the greenhouse scene, such as sunny or uneven illumination and separated, occlusion, shadow, side-grown, and overlapped cherry tomatoes. The separated cherry tomatoes mean that fruit are independent and without any obstruction. The number of such cherry tomatoes accounts for more than 85% of the total number, which will greatly affect the detection accuracy rate of cherry tomatoes. The occlusion cherry tomatoes means tomatoes are obscured by the main stems, while the overlapped cherry tomatoes mean two or more bunches of tomatoes stacked on each other in the image. Some cherry tomatoes can be covered more than 50% of the whole bunch area, or several conditions arise in one bunch of cherry tomatoes, which increase the difficulty of tomato detection. In the comparative experiments, the sample images were divided into six categories: separated, occlusion, sunny or uneven illumination, shadow, side-grown and overlapped.
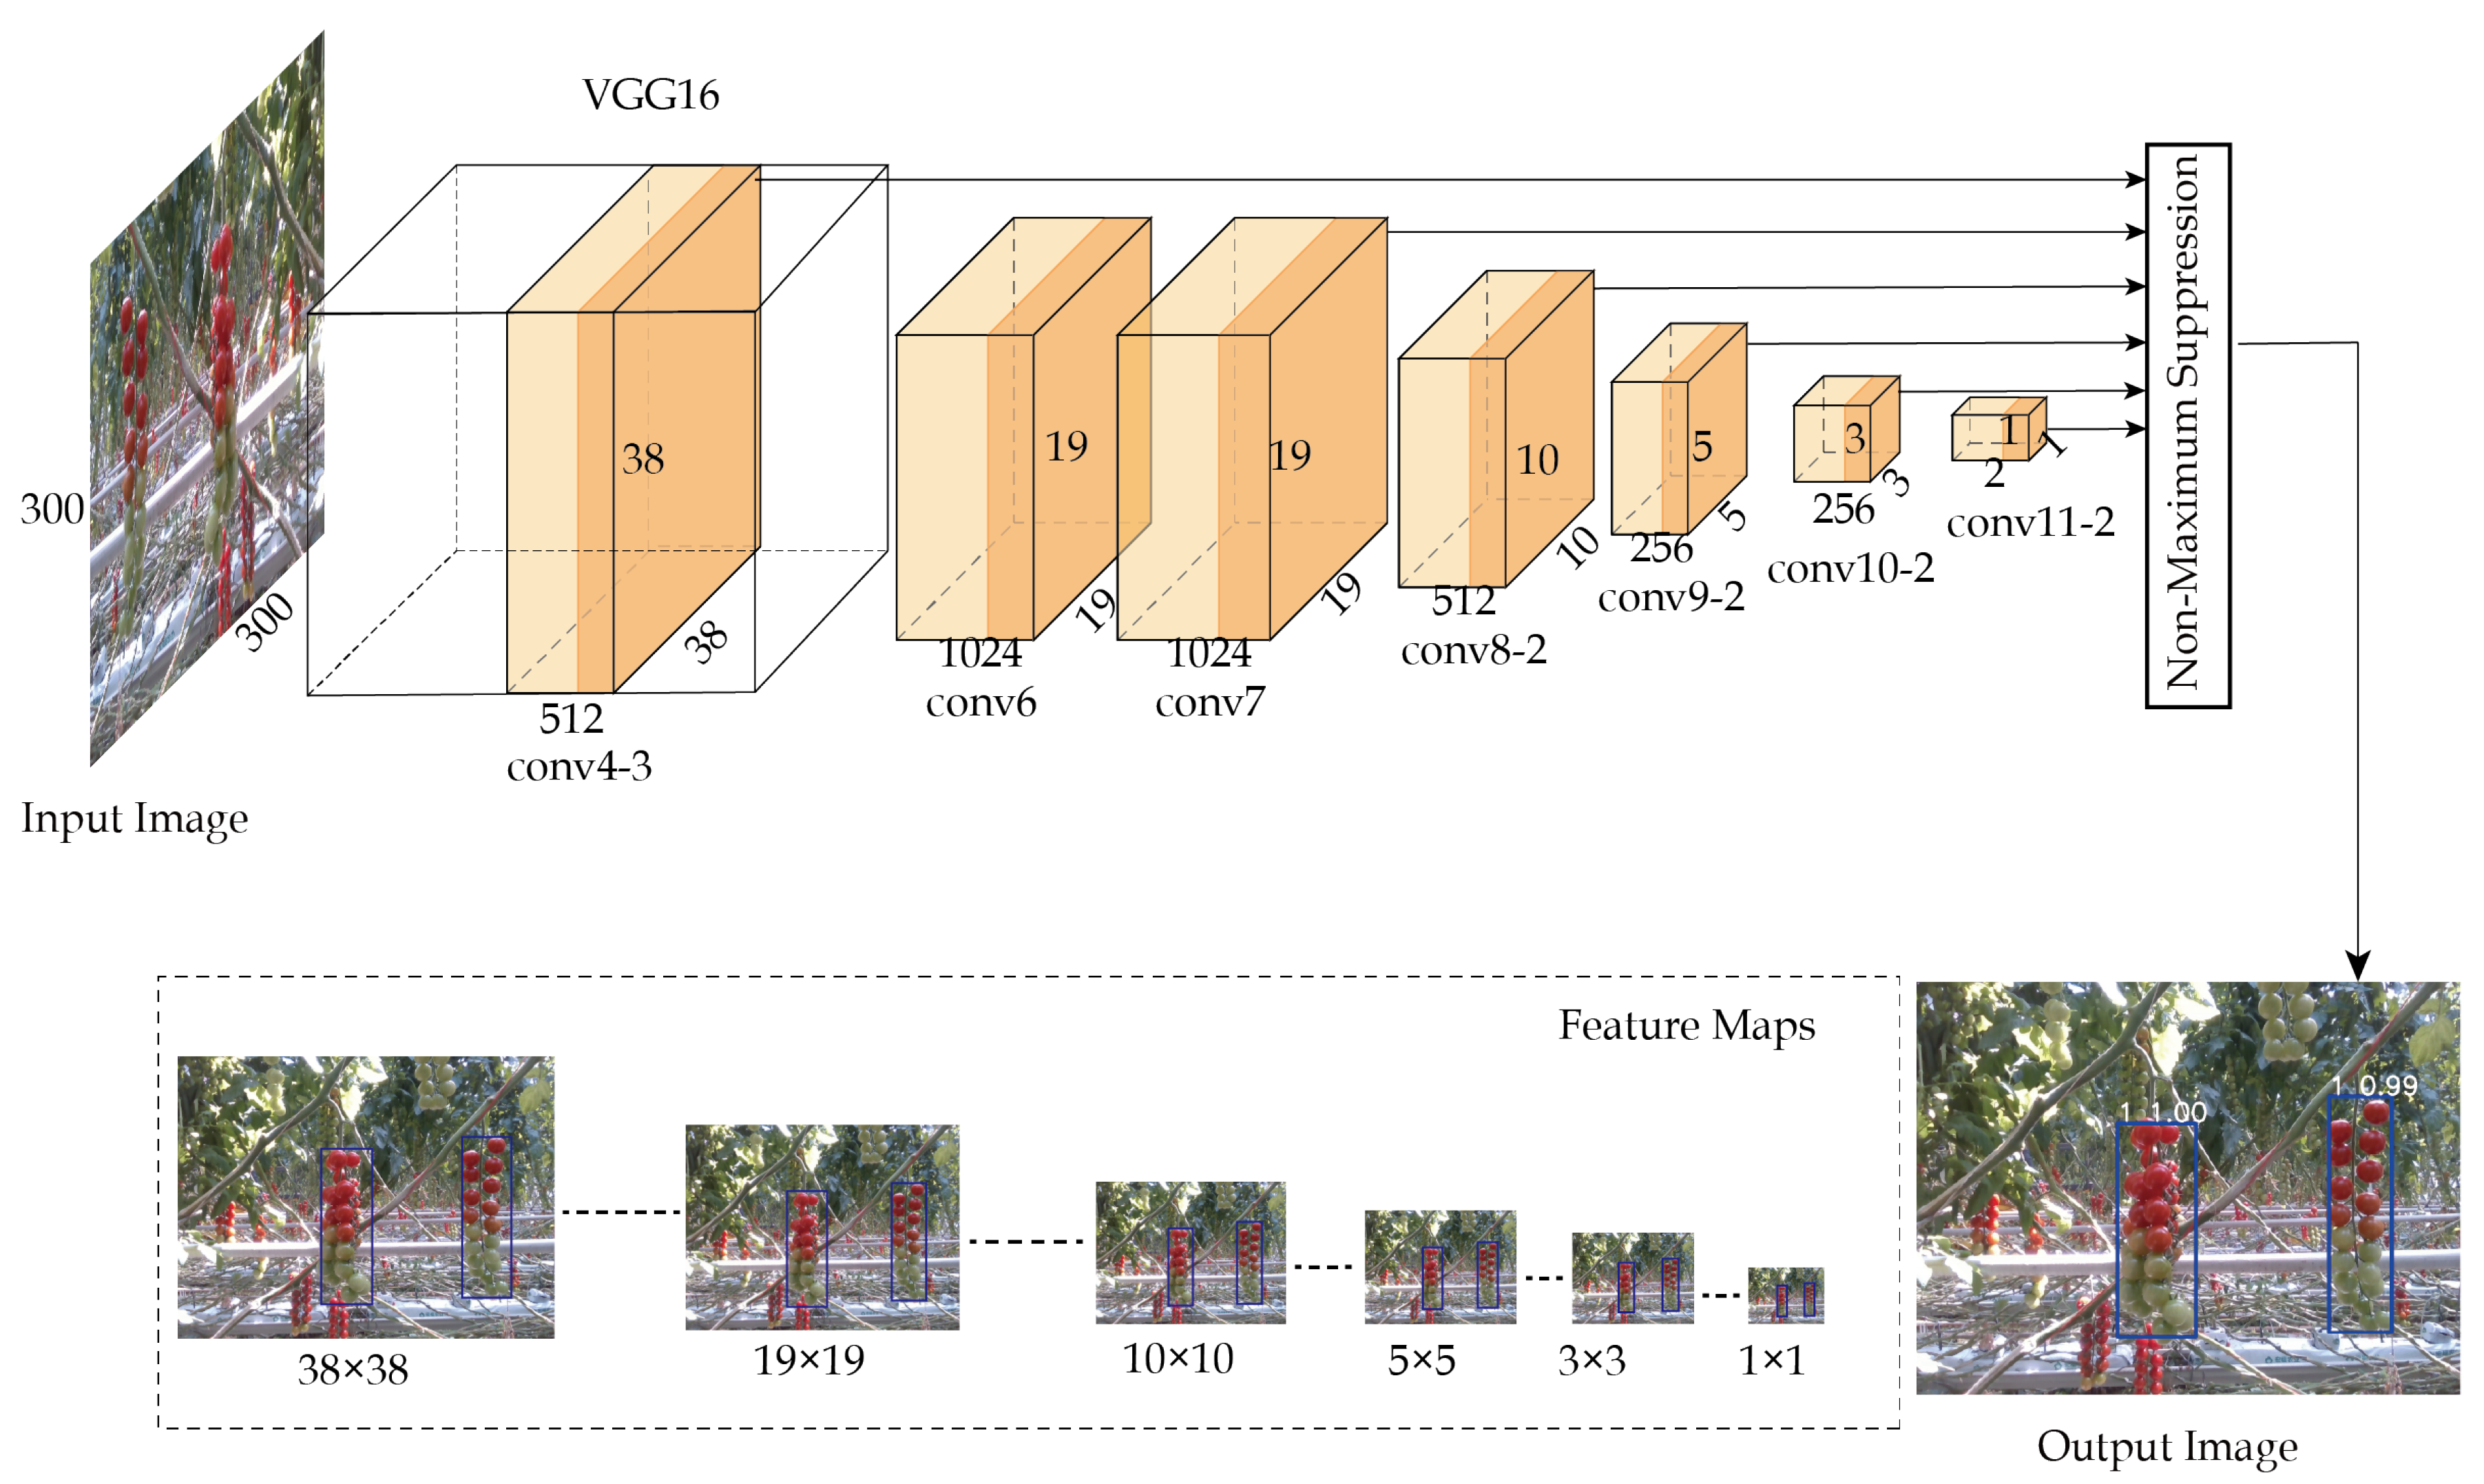
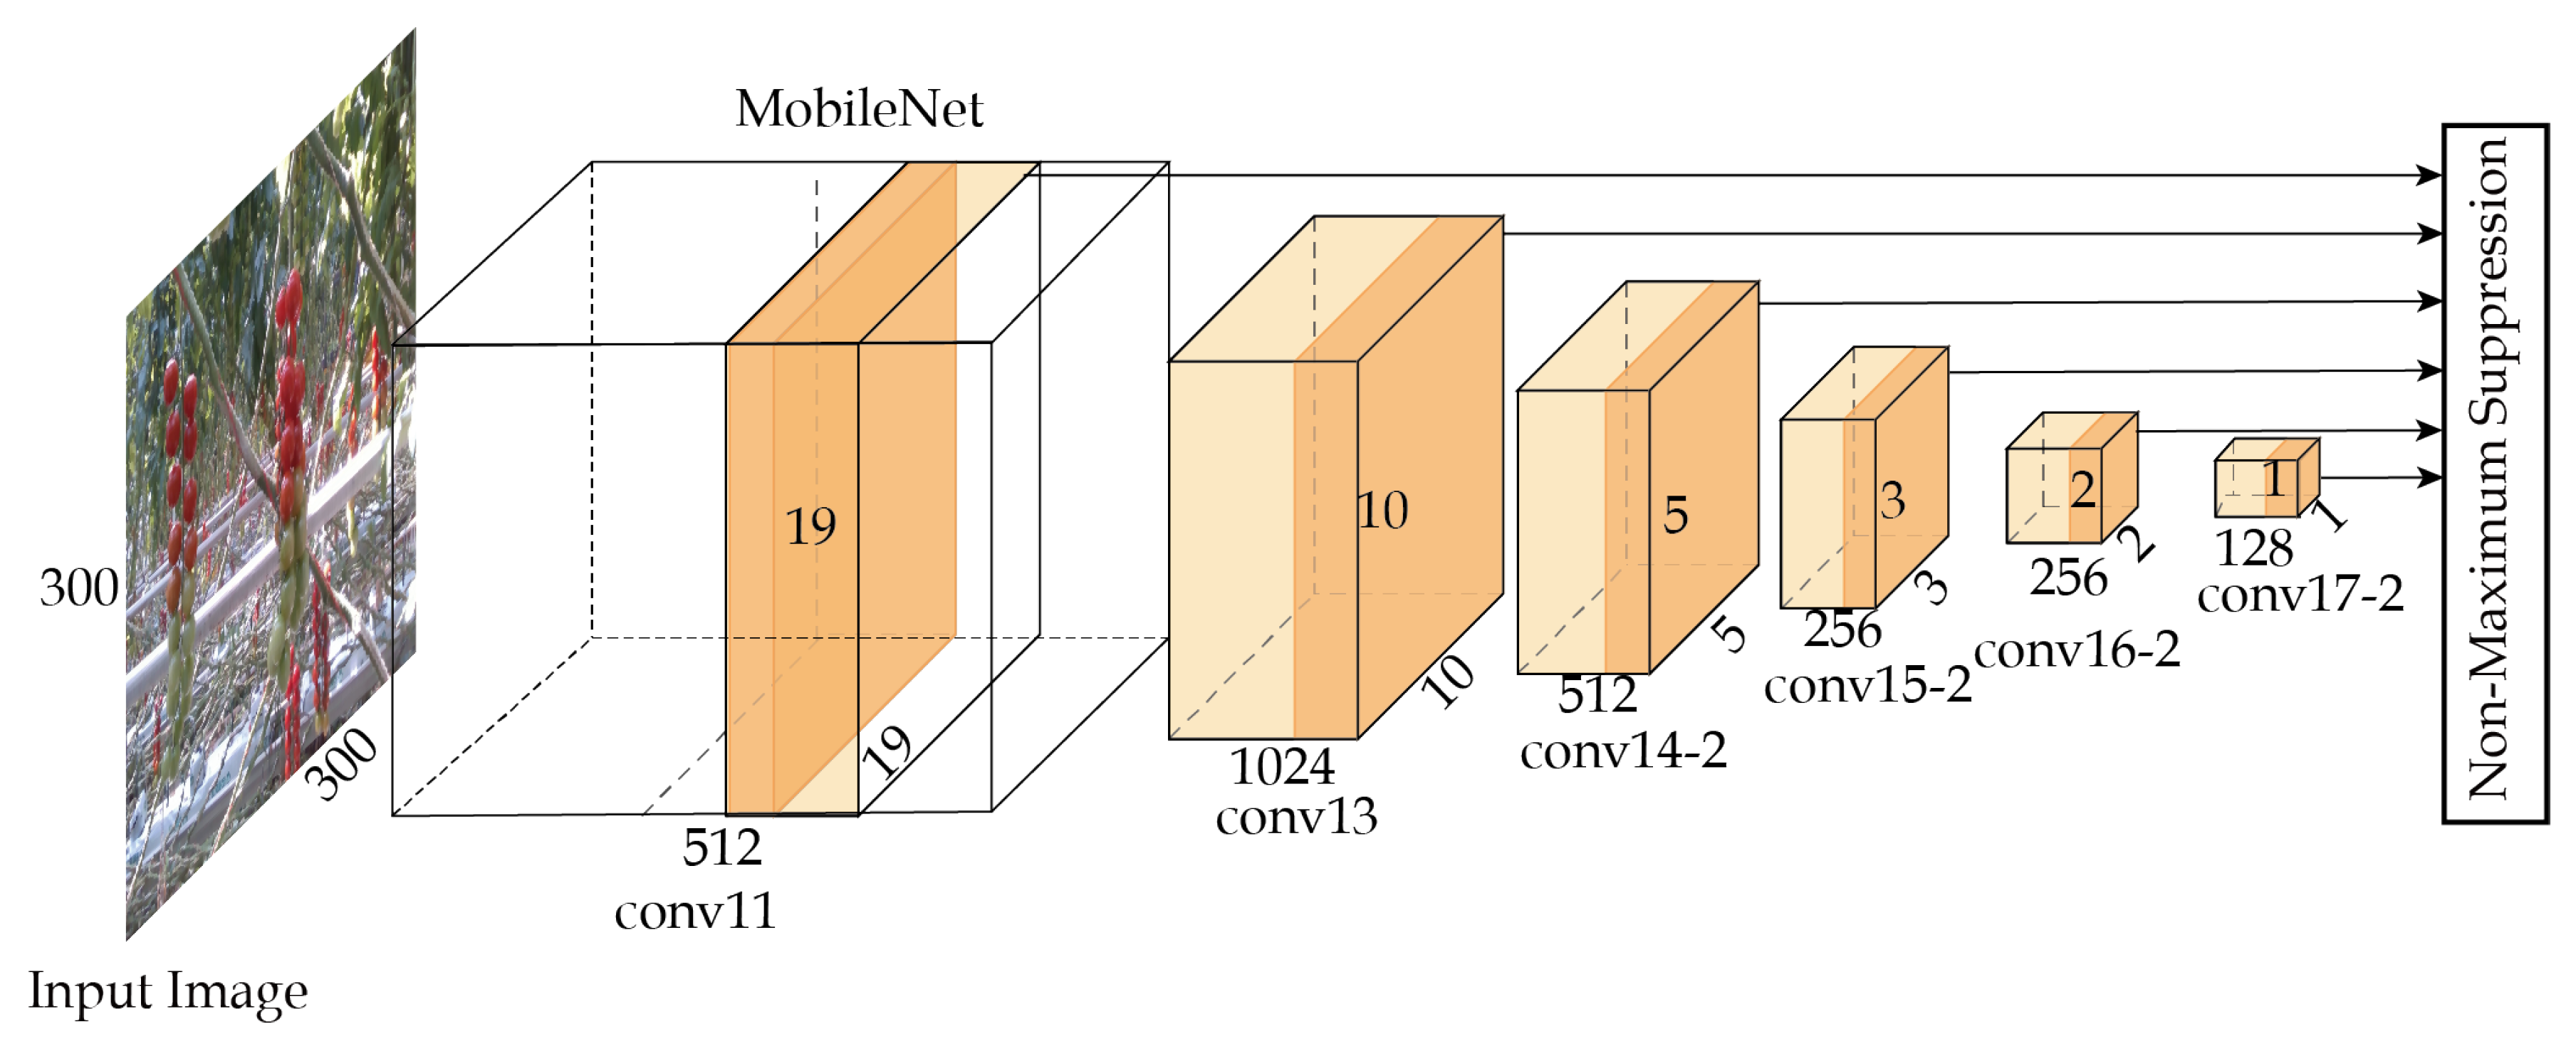
Four different SSD convolutional neural network models were compared to verify their performance in this paper. Firstly, different feature extractors of the SSD classical network were applied by changing network parameters and network depths, which directly affect detection time and effect of cherry tomatoes. In the tests, VGG16, MobileNet and Inception V2 were used as feature extractors to be discussed. Secondly, since the size of the network input images was sensitive to the small detection objects, the networks of SSD300 and SSD512 with the input image sizes of 300 × 300 pixels and 512 × 512 pixels were selected respectively in the tests.
4.2.1. Experiment Parameters
To reduce training time and save training resources, transfer learning was used to train the training sample set based on COCO dataset. SSD300 and SSD512 networks used Adam as gradient descent algorithm, while SSD_MobileNet and SSD_Inception V2 networks used RMS props as gradient descent algorithm. The batch size was set to 4. The momentum and the weight decay were set to 0.9 and 0.0005 respectively. Used 10 learning rate for 70 K iterations and continue training for 10 K iterations with 10.
4.2.2. Evaluation Standard
Three indexes were applied to evaluate the performance of the proposed algorithm and developed algorithms: precision (P), false negative rate (F), and Intersection over Union (IOU). Among them, precision and false negative rate are used as evaluation index under different conditions in the test set, and IOU are used as the evaluation index of the detection result of a single object.
In the case that the default box was determined, the default box with the largest IOU and the default box which IOU is greater than 0.5 are defined as positive sample. False positive means that the samples that are actually positive samples but divided into negative samples. Precision refers to the proportion of positive samples of predicted samples among all positive samples, as an evaluation of the accuracy of the detection result. False negative rate refers to the proportion of misclassified positive samples of predicted samples among all positive samples. Precision and false negative rate are defined by Equations (
5) and (
6):
where
,
,
are truth positive, false positive, false negative, respectively.
IOU refers to the ratio of the intersection to union of the area between the predicted box and the ground truth box as a symbol of the accuracy of the target location.
AP (average precision) as an evaluation index of detection precision on the entire test dataset, which is a criterion for evaluating the sensitivity of network to object. AP value is related to the precision and recall rate(R). The recall rate represents the proportion of the predicted correct boxes in all ground truth boxes, that means the completeness of a result. The precision and recall rate are defined by Equations (
5) and (
7):
AP is calculated by the integral of precision-recall curve. The higher the value of AP, the better the model performs. AP is defined by Equation (
8):
4.3. Experiment Results Analysis
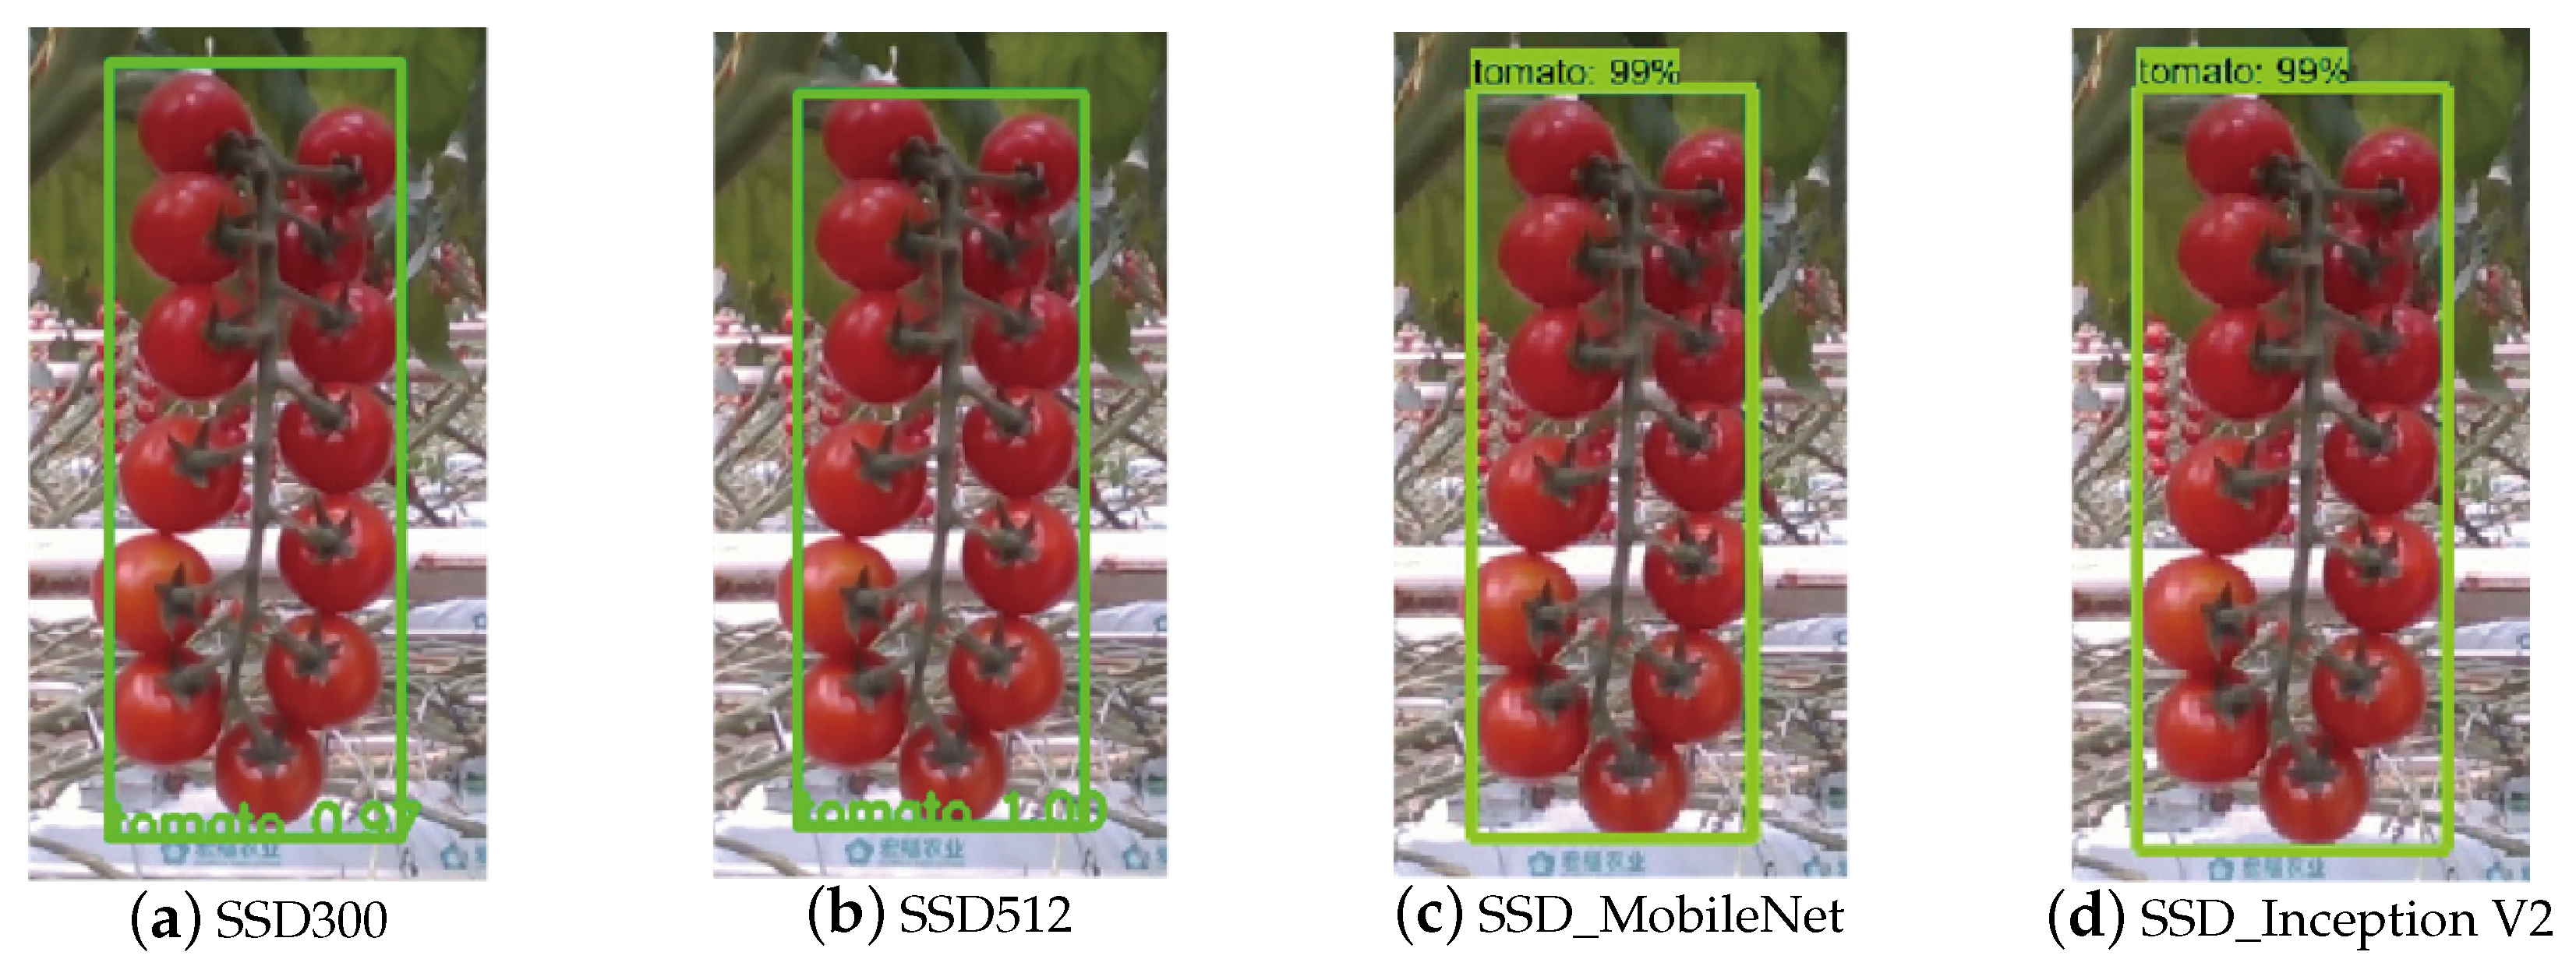
The performance of the proposed four network models (SSD300, SSD512, SSD_MobileNet, and SSD_Inception V2) were evaluated using 50 bunches of randomly selected separated cherry tomatoes. Just test set was used, and the results are shown in
Table 2. The precision of the test set were 88%, 92%, 92%, and 94% respectively, which shows that SSD_Inception V2 model is more effective for separated cherry tomato detection. Some image examples of the results are shown in
Figure 5. Because of integrated features, all the tomatoes were correctly detected under the separated conditions as expected. The IOU of four different models were 0.896, 0.865, 0.853 and 0.972 respectively. It can be observed that the SSD_Inception V2 model not only has the largest IOU, but also has the highest detection accuracy.
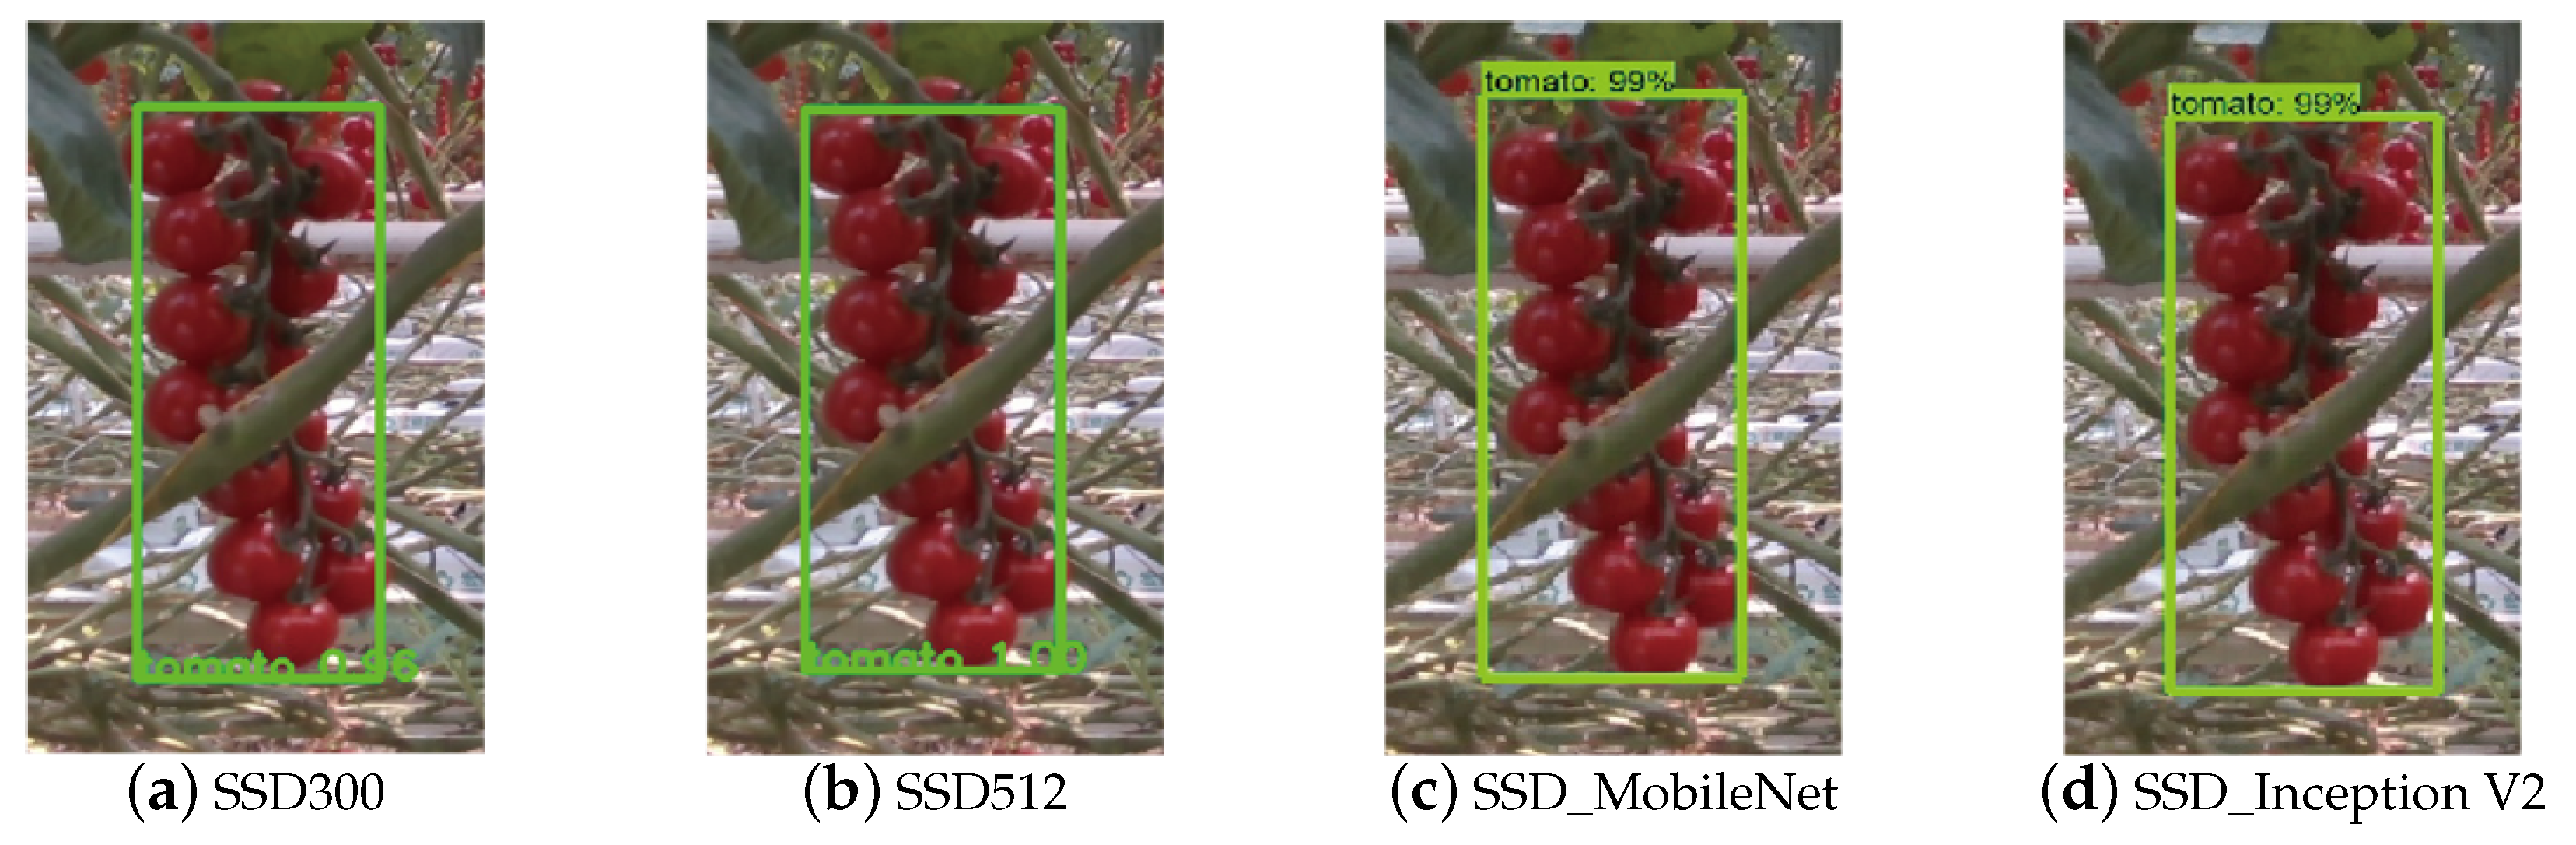
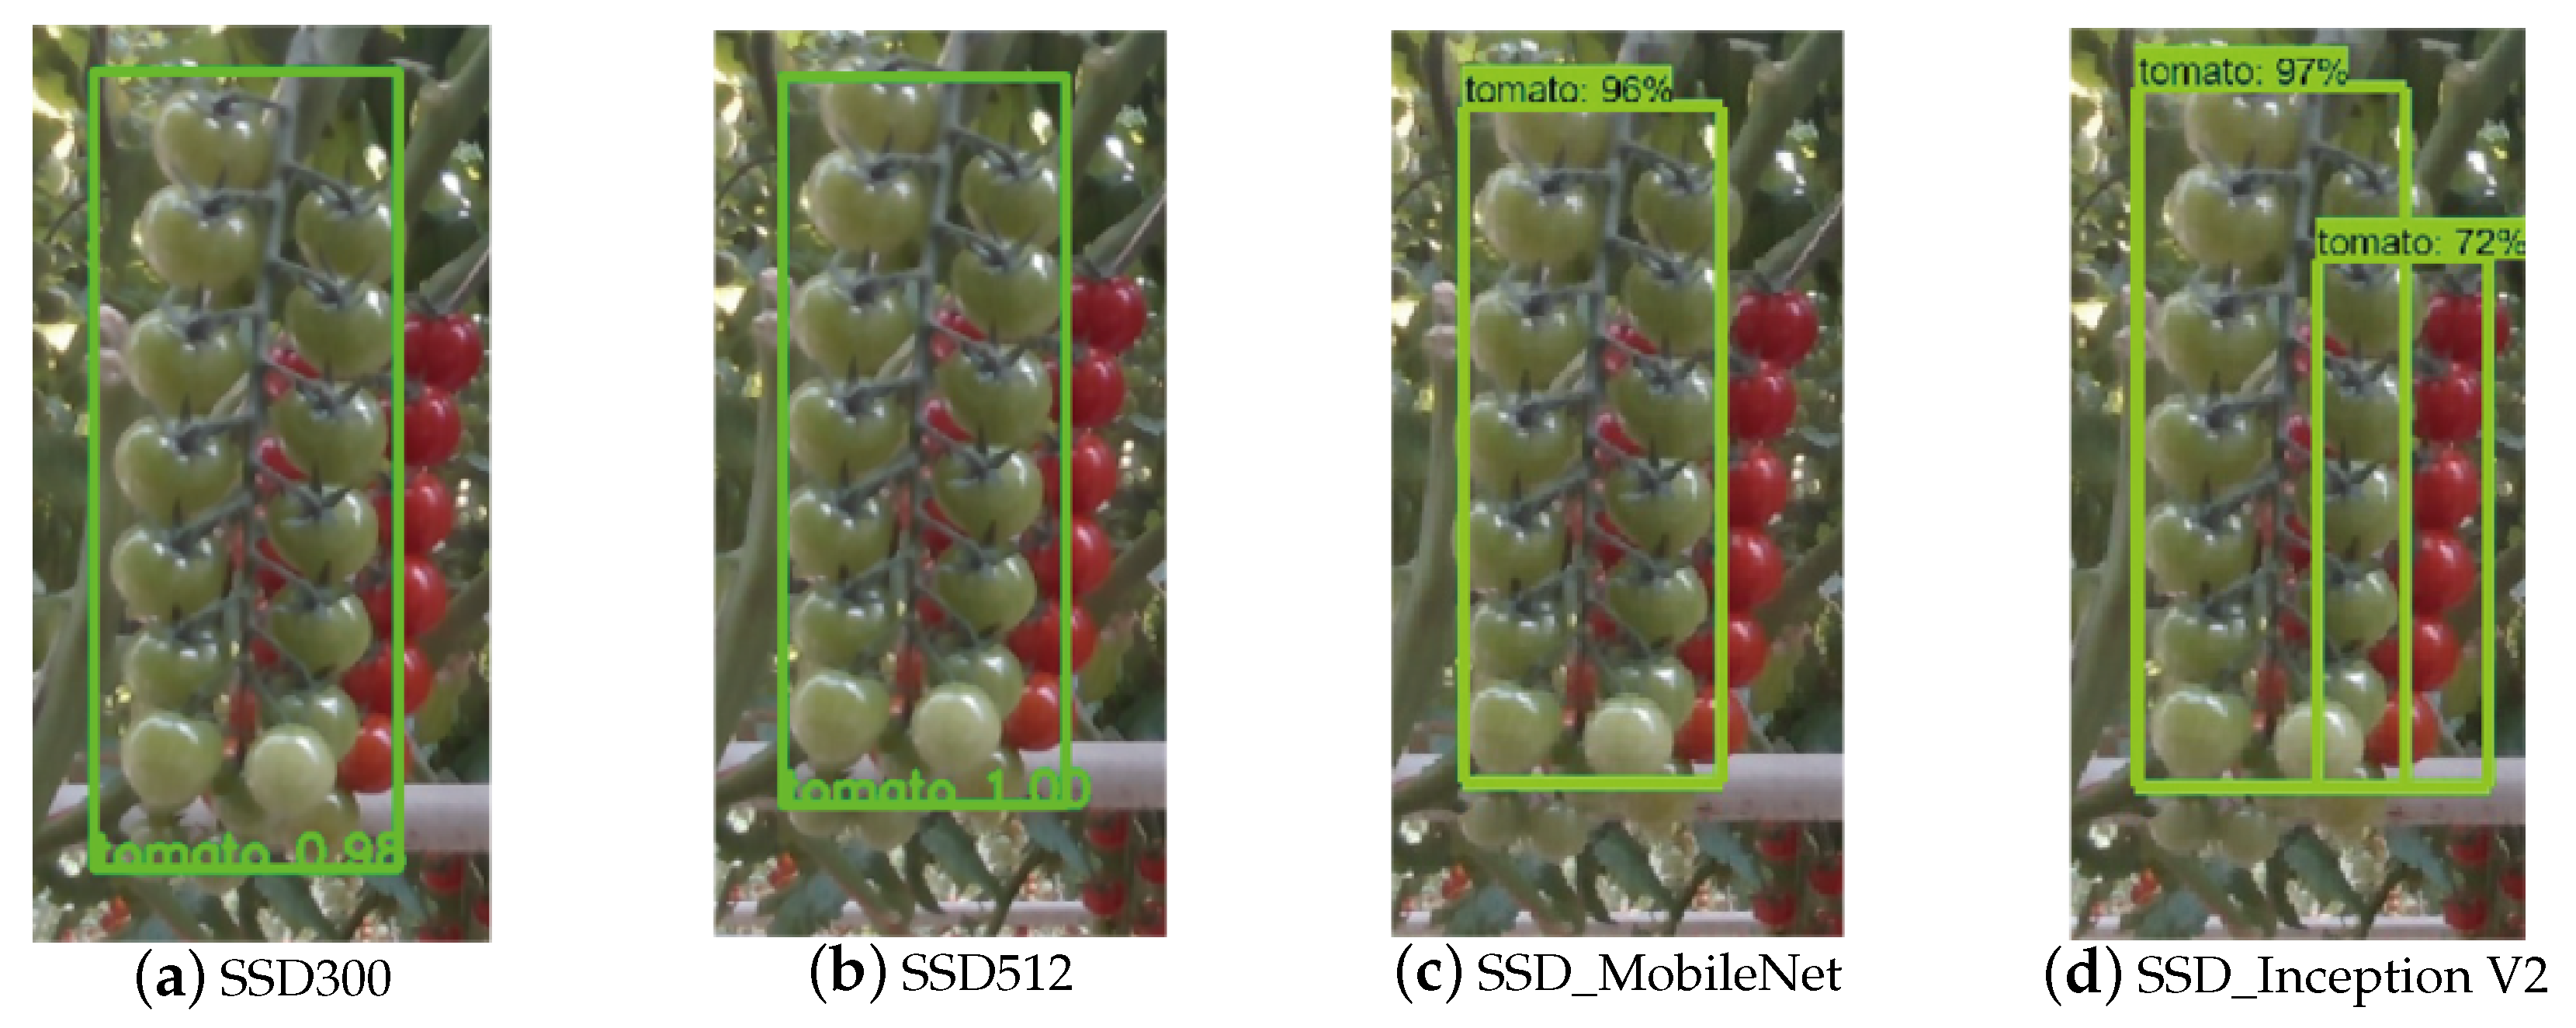
Some cherry tomatoes are obscured by the main stems, which visually causes the target to be divided into two parts. The performance of the proposed network models were evaluated using 50 bunches of randomly selected cherry tomatoes covered by the main stem. The detection results are shown in
Table 3. The precision of the test set were 60%, 90%, 94%, and 92%, respectively. Examples of cherry tomatoes obscured by the main stem are shown in
Figure 6. In general, although the area covered by the main stem is less than 10% of the total cherry tomatoes area, it is easy to be missed or failed due to the interference of the main stem. The main causes of missed detection or wrong detection were that the severe deformation of the cherry tomatoes and the obstruction cherry tomatoes mistakenly identified as two separated bunches.
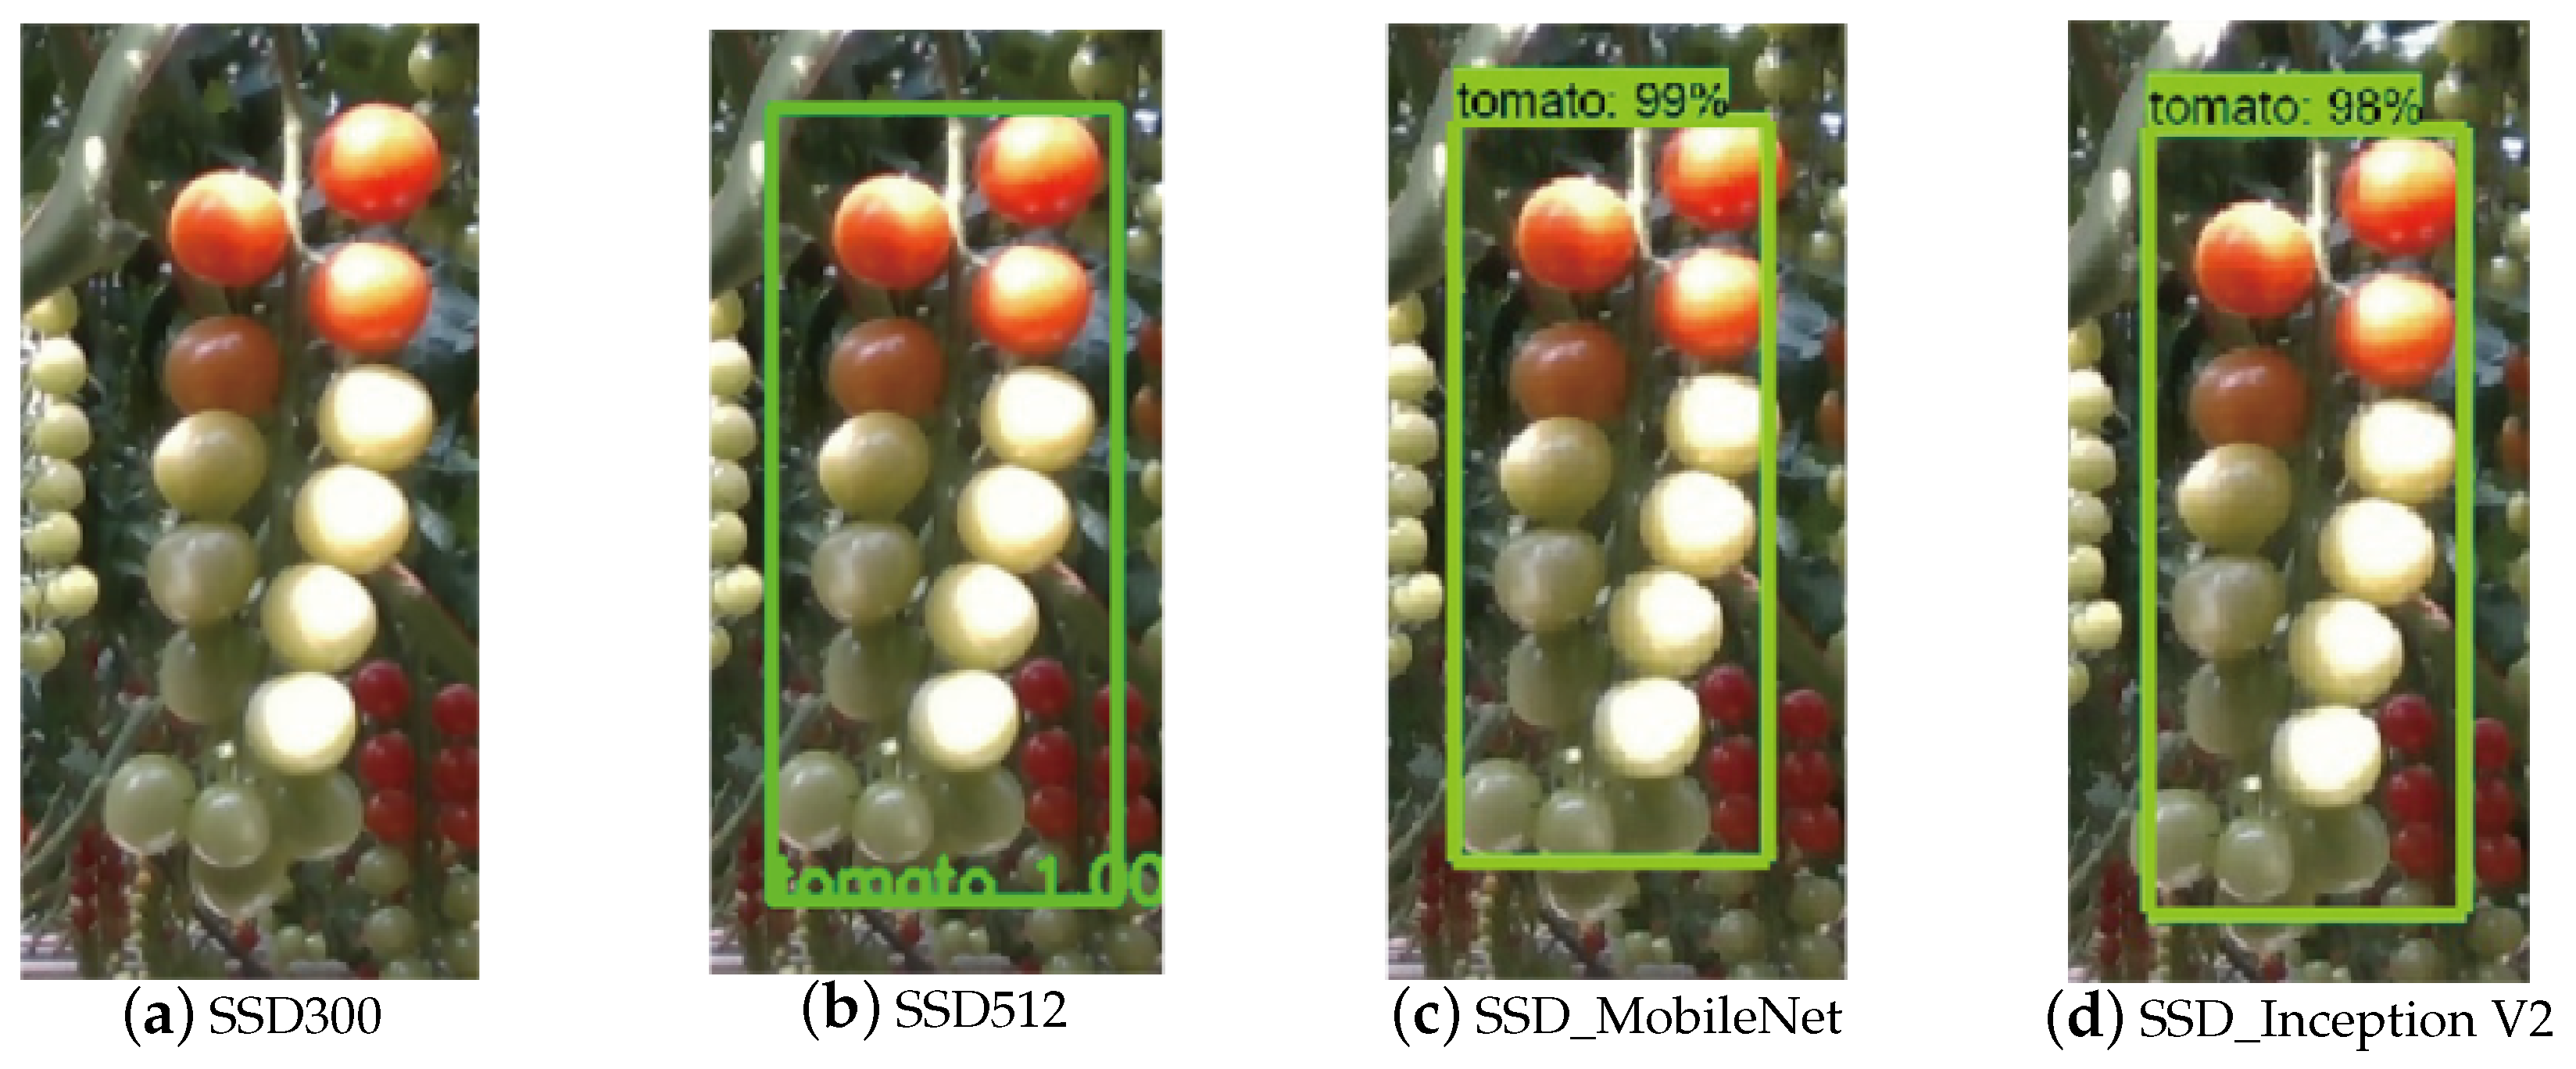
Halations on the fruit surface which were caused by uneven illumination seriously affect tomato detection. 50 bunches of cherry tomatoes in direct sunlight or uneven light conditions and 50 bunches in shaded conditions were tested by the proposed four models. The results are shown in
Table 4. The precision of the test set under direct sunlight or uneven light conditions were 40%, 90%, 92%, and 96% respectively. Relatively the precision of the test set under shadow conditions were 80%, 96%, 96% and 98% respectively. The test results proved that the three models except SSD300 were insensitive to illumination variation in the greenhouse environment. This is mainly due to excellent feature extraction function of network and data augmentation.
Some examples of cherry tomatoes with uneven illumination are shown in
Figure 7. Some fruit surfaces have white spots due to excessively strong illumination. Except for the SSD300 missed detection, the other three models are correctly detected tomatoes. The IOU of four different models were 0, 0.913, 0.735 and 0.921 respectively. It reveals that SSD_Inception V2 model has the best performance.
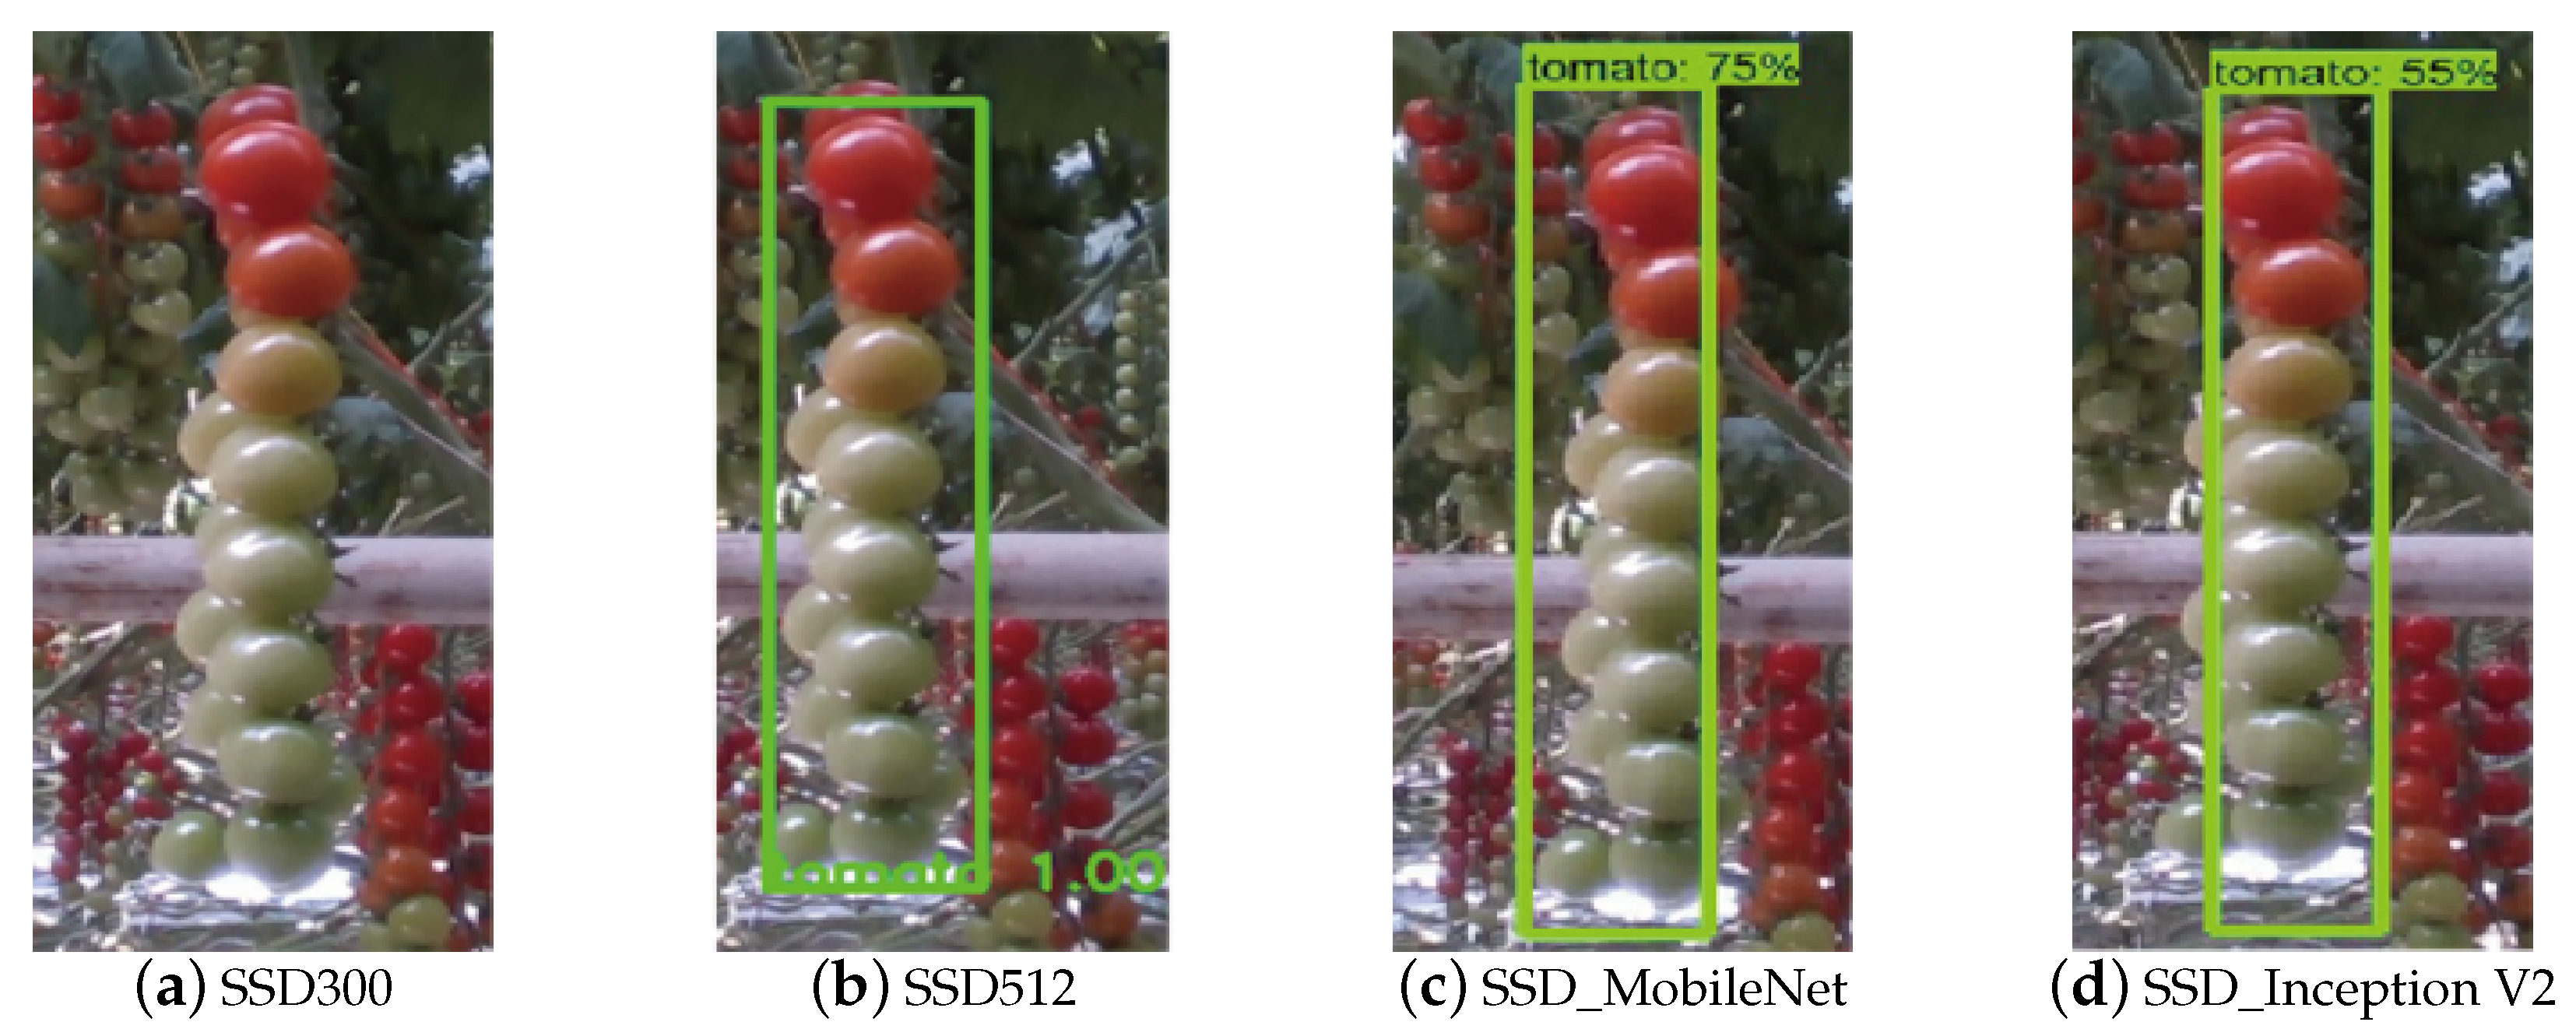
Because the growth posture of cherry tomatoes is uncontrollable, the different postures of cherry tomatoes are roughly divided into two categories: front-grown and side-grown. The cherry tomatoes growing on the front are shown in
Figure 5. In this state, the characteristics of cherry tomatoes are complete. However, only half of the number of fruit can be seen in side-grown cherry tomatoes. As shown in
Figure 8, side-grown and front-grown tomatoes have the same length but the varying width. The shape features of side-grown are not exactly same as those of the front-growth. So traditional methods of only using shape features cannot primely detect tomatoes. The performance of the proposed methods were evaluated using 50 bunches side-grown cherry tomatoes. The results are shown in
Table 5. The precision on the test set under side-grown condition was respectively of 30%, 86%, 76%, 74%. Some examples are shown in
Figure 8. It also shows that the three models except SSD300 can correctly detect cherry tomatoes. Due to larger input image size of network, SSD512 behaved best in detecting small objects; in particular, some cherry tomatoes located at the edge of the image with only part of the fruit will be detected as a whole bunch of fruit.
For cherry tomatoes under overlapped conditions, there are considerable overlapping areas, posing challenges to tomato detection.
Figure 9 shows two bunches of cherry tomatoes numbered I, II from front to back.Tomatoes I is easy to detect due to the complete characteristics, but tomatoes II was almost half covered. In
Figure 9d, two tomatoes were both correctly detected, while only tomato I was correctly detected in
Figure 9a–c. As for robotic picking, all cherry tomatoes identified at one shoot will considerably reduce the picking time.
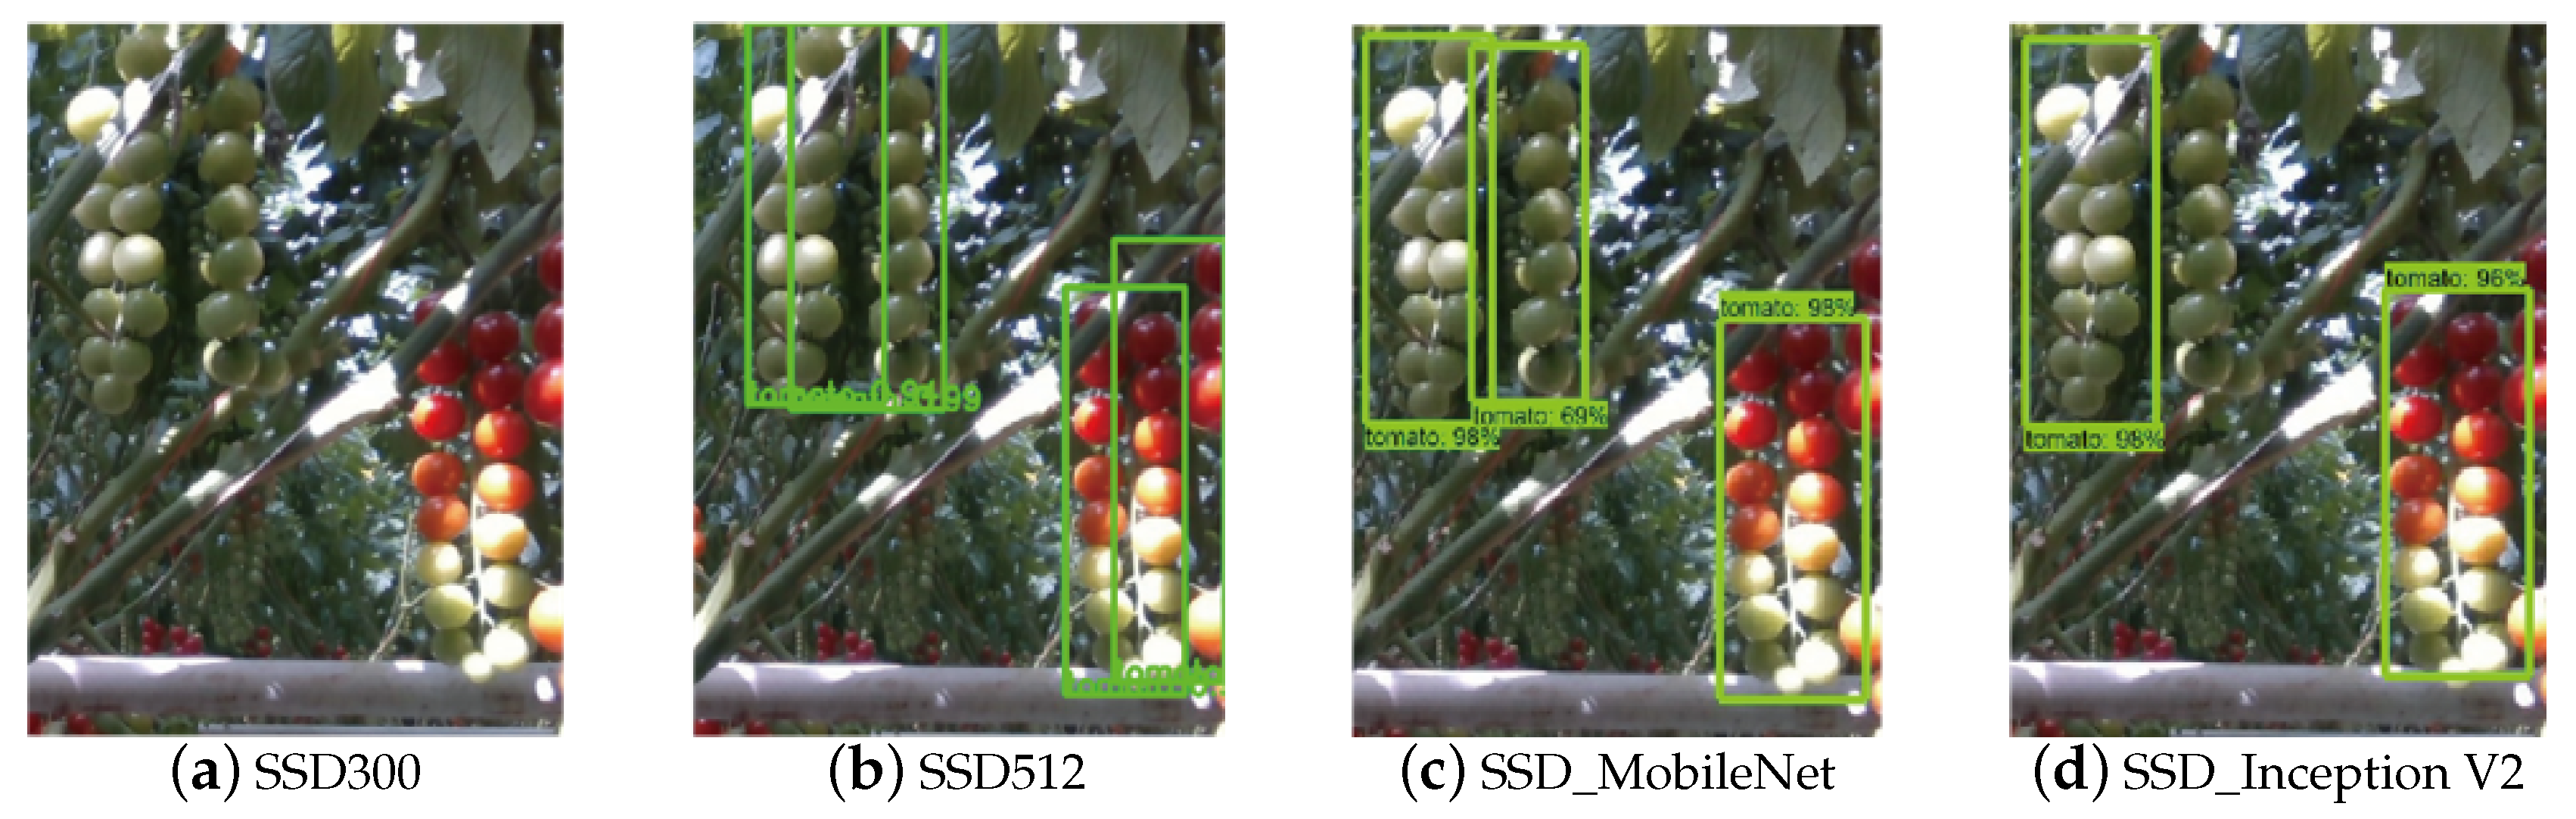
As shown in
Figure 10, there are three bunches of cherry tomatoes in the image, numbered with I, II, and III from left to right. The tomatoes I presents the condition of immature tomatoes with light spots blocked by the main stem. The tomatoes II which shows the condition of side-grown is close to the tomatoes I. The tomatoes III shows the condition of half-ripe tomatoes with large-area light spots blocked by the main stem. Besides, there is an interference of another cherry tomatoes on the right side of tomatoes III.
As seen in
Figure 10a, the SSD300 model failed to detect tomatoes. Although there are four prediction boxes in
Figure 10b, just two of them were correctly detected. Some part of the tomatoes I was identified as a part of tomatoes II, so the output box of tomatoes II is larger than the ground truth box. That means, SSD512 model cannot separate those closing bunches. The tomatoes III was correctly detected but some part of the tomatoes III was mistaken for another tomatoes because of interference. Therefore, SSD512 model cannot provide an accurate picking position reference for automatic picking. Unlike SSD300 and SSD512, SSD_MobileNet correctly detects tomatoes III as shown in
Figure 10c, but the output box of tomatoes II is larger than the ground truth box similarly. As shown in
Figure 10d, tomatoes were correctly detected except tomatoes II.
Above all, it can be seen that SSD300 is not suitable for the conditions of uneven illumination, side-grown and closely, and SSD512 is sensitive to interference from other tomatoes and easily causes false detection. In addition, SSD_MobileNet easily causes false detection with relatively low rate of IOU compared with other three models under the separated conditions. Although in some conditions SSD_Inception V2 is not the model with the highest detection accuracy rate, it is the model with the lowest rate of false detection. As for uneven lighting, side-grown and nearly conditions, SSD_Inception V2 is more suitable to provide backstopping for automatic picking and avoid the problem of picking failure caused by false detection.
Table 6 shows the AP values of different SSD network models. Based on the above analysis, it can be observed that the accuracy of SSD300 model is relatively lower than others, and the performance of conditions such as uneven illumination, occlusion and overlapped, etc. are not effective. SSD512 has a great advantage in the detection of side-grown tomatoes. However, SSD512 is easy to cause false detection by the interference of adjacent tomato bunches. SSD_MobileNet is similar to SSD512 in false detection problem. Although the location loss is much less than SSD512, it still causes some damages to the fruit in the process of picking. SSD_Inception V2 with the detection accuracy of the lowest false detection rate as shown in
Figure 10. If the results of SSD_Inception V2 are used as the reference position will greatly reduce the rate of fruit damage and the probability of repeated detection in the same location. Also it is very robust to different conditions of cherry tomatoes in greenhouse environment. It is shows that SSD_Inception V2 model had the highest accuracy, which demonstrated that the method was effective and could be applied for the detection of cherry tomatoes in greenhouse environment.


