Article

Potato Phosphorus Response in Soils with High Value of Phosphorus

1
Department of Ecology and Environmental Sciences, University of Maine, Orono, ME 04469, USA
2
Soil and Water Science Department, University of Florida, Gainesville, FL 32611, USA
3
Deparetment of Agroecology, University of Florida, Gainesville, FL 32611, USA
4
Aroostook Research Station, University of Maine, Presque Isle, ME 04769, USA
5
Department of Biology, University of Maine, Orono, ME 04469, USA
*
Author to whom correspondence should be addressed.
Agriculture 2020, 10(7), 264; https://doi.org/10.3390/agriculture10070264
Submission received: 15 May 2020 / Revised: 24 June 2020 / Accepted: 26 June 2020 / Published: 3 July 2020
(This article belongs to the Section Crop Production)

Abstract

:
Phosphorus (P) is an element that is potatoes require in large amounts. Soil pH is a crucial factor impacting phosphorus availability in potato production. This study was conducted to evaluate the influence of P application rates on the P efficiency for tuber yield, specific gravity, and P uptake. Additionally, the relationship between soil pH and total potato tuber yield was determined. Six rates of P fertilization (0–280 kg P ha−1) were applied at twelve different sites across Northern Maine. Yield parameters were not responsive to P application rates. However, regression analysis showed that soil pH was significantly correlated with total potato tuber yield(R2 = 0.38). Sites with soil pH values < 6 had total tuber yields, marketable tuber yields, tuber numbers per plant, and total tuber mean weights that were all higher than these same parameters at sites with soil pH ≥ 6. All sites with soil pH< 6 showed a highly correlated relationship between P uptake and petiole dry weight (R2 = 0.76). The P application rate of 56 kg P ha−1 was the best at sites with a soil pH < 6, but 0–56 kg P ha−1 was the best at sites with soil pH ≥ 6.

1. Introduction

Potato (Solanum tuberosum L.) is a major vegetable crop worldwide, including the United States of America (USA) [1]. The USA accounts for 11.4% of the total world potato production [2]. Maine (ME) is ranked ninth in terms of the area that is devoted to potato production [3]. The worldwide potato production was appraised at 388,191,000 Mg ha−1 in 2018 [2]. In Maine, potato production increased from 1704 Mg ha−1 in 2017 to 1720 Mg ha−1 in 2018, i.e., 0.9% [3]. The potato crop demands high phosphorus (P) levels [1,4,5,6], due to its shallow roots, low root density, minimal root hairs, and high P demand in the shoots [1,7]. P is the most critical major nutrient limiting potato growth after nitrogen and potassium in soils. P is typically taken up as either HPO42− or H2PO42−, depending on the soil pH [1,6]. Potato may also absorb nucleic acids and soluble organic phosphates [8].
Potato is a high-value vegetable, and farmers apply P fertilization at high rates despite high soil P availability [9]. Even under high P applications, the total P uptake by potato varieties remains between 6.6 to 8 kg P ha−1 [1,5,7]. These results indicate that it is possible to apply P at lower rates in soils with high P soil amounts without reducing yields [10], although some P fertilizer may need to be applied even at high soil test P levels [1,5,6]. Often, P deficiency results in early vine death and hastening maturity [11]. The response of potatoes to P applications even in the soils with high soil P test values [1,4] questions the methodology of the P recommendations in the potato-growing states in the USA. P fertilization and applications of manure with high P concentrations represent a potential source of P input into water bodies [4,12]. P is a relatively slow-moving element in the soils, and it has a high tendency to stay in the soil for a more extended period as legacy P.
P also plays a fundamental role in crop and vegetable physiology. Energy storage and transfer are the most important functions of P in plants [13,14]. The ample plant P concentration will form and generate adequate amounts of adenosine triphosphate (ATP) and adenosine diphosphate (ADP) that are involved in energy-transforming processes [4,8,14]. P is the most crucial element in the structural component of phospholipids, phosphoproteins, coenzymes, nucleic acids, and nucleotides [8,14,15]. P is highly correlated with increased root development; when H2PO4 increases in the soil, plant roots can spread extensively [9,16,17]. Thus, roots proliferate, which leads to an enhanced exploration of the soil for water and nutrients. The yield quality is enhanced and disease resistance improved with appropriate P availability [10,18,19]. According to [14], total P in most plant tissue ranges from 0.1 to 1%. Typical crops may contain approximately 0.13% as inorganic P, 0.03% as lipids, 0.004% as DNA, 0.04% as RNA, and 0.02% as an ester. The total P concentration in potato changes based on the growth stage; sufficient P concentration can be around 0.2–0.4% at mid-growth, 0.38–0.45% at tuber initiation, and 0.14–0.17% when tubers mature [14].
The P deficiency suppresses and delays potato growth and maturity [1]. The plants that are grown under P stress are generally stunted, with darker green-colored leaves. When the P deficiency is exacerbated, the dark green color changes to grayish-green or bluish-green [20]. Eventually, the P-deficient leaves turn purple. The purple color occurs due to the accumulation of sugars that produce anthocyanin (plant pigments) in the leaf [21]. Thus, deficiencies of P are common at early growth stages and at the reproductive stage [22]. P deficiency might also appear in crops that are grown under cool, wet conditions, even where there is sufficient soil P availability [23]. The P deficiency symptoms might occur due to reduced P diffusion in cool soils with limited root development in young plants [23]. Initial P fertilization can decrease early season P stress [22].
The P availability in the soil is closely related to soil pH, soil temperature, and soil iron (Fe)/aluminum (Al) content [24]. The ideal pH range for P availability is between 6–7 [24]. Regardless of where potatoes are grown, as a winter crop for tropical places and a summer crop for temperate places, potato planting happens when the soil temperature is on the lower side, resulting in low P availability and a reason for growers in the region to apply P to potatoes [24]. Moreover, the available Fe and Al under a low soil pH fix the available P, and that results in low P availability in the potato production system [24,25]. In acidic soils, P might react with aluminum (Al) and iron (Fe), with the formation of a lack of soluble phosphate under low soil pH conditions [12].
This experiment was carried out to evaluate the impact of P application rates on the P efficiency for tuber yield, specific gravity, and P uptake. Additionally, to investigate the impact of soil pH on potato P availability in the studied soils.

2. Materials and Methods

2.1. Site Description

Two years of study were undertaken in 2018 and 2019 at twelve sites in Aroostook County, Maine, USA. Precipitation (mm) and temperature (°C) data during the growing season are shown in Figure 1. Site properties are provided in Table 1.

2.2. Experimental Design

On all sites, in both the years 2018 and 2019, the experimental design was a randomized complete block with six P fertilization rates (0, 56, 112, 168, 224, and 280 kg P ha−1 applied as triple superphosphate (TSP) (46% P2O5), with four replications. Nitrogen (N) was applied as urea (46% N) in 2018 and as ammonium nitrate (33% N) in 2019 at the rates of 161 kg N ha−1 and 179 kg N ha−1, respectively. Potassium (K) was applied in both years as potassium chloride (K2O 60%) at 224 kg K ha−1. Sulfur (S) was applied in both years as calcium sulfate (24% S) at 18 kg S ha−1. The N, P, K, and S were banded 5 cm underneath the potato seed on the planting days. In 2018, the dimensions of the experimental units were 9.1 m by 3.6 m, accommodating four potato rows spaced at 0.9 m. In 2019, the dimensions were 6.1 m by 3.6 m accommodating two potato rows spaced at 0.9 m. Potato tubers were planted in rows at the inter-potato seed spacing of 0.3 m. Three potato varieties were grown in the study area (Table 1).

2.3. Soil Sample Analysis

Soil samples were taken from each experimental site to a depth of 0–30 cm before potato planting, and through the growing season at the early stage (tuber initiation; 60 days after potato planting day), and after harvest(120 days after potato planting day). At an early stage in 2018, soil samples were collected from two sites, and in 2019, soil samples were taken from five sites. At potato harvest in 2018, soil samples were taken from four sites, and in 2019, soil samples were collected from five sites. Soil samples were air-dried, ground, and then passed through a 2 mm mesh sieve. The P and K were determined by Modified Morgan Extraction (MME) using Inductively Coupled Plasma-atomic emission spectrometer (ICP-AES) (Make: Spectro Genesis; company is HQ in Kleve, Germany) [27]. The P extracted by MME (P-MME) was evaluated as a high to very high soil P concentration and ranged between 10.1 to 23.8 mg P kg−1, this was stated based on [28], who reported P-MME ranges were: low P: 0–4 mg P kg−1 soil, optimum P: 4–7 mg P kg−1 soil, high P: 7–20 mg P kg−1 soil, and very high P: >20 mg P kg−1 soil. For the Mehlich 3 (P-M3), soil test P samples were analyzed using ICP-AES [29]. In this study, the P-M3 ranged from 257 to 586 mg P kg−1 soil (Table 2). This range is considered as a very high soil P concentration based on [28] who reported P-M3 ranges are: low P: 0–15 mg P kg−1 soil, optimum P: 15–31 mg P kg−1 soil, high P: 24–31 mg P kg−1 soil, and very high P: >31 mg P kg−1 soil. Soil pH was estimated using a 1:1 soil: deionized water solution method, then measured by a pH meter with the electrode(pH robot is a labfit AS3000; company HQ is in Perth, Australia) [30]; the organic matter was determined using the loss of weight on ignition method [31]. The N-NO3 was measured by using an automated ion analyzer [32]. The N-NH4+ was measured by using KCl extractions [33].

2.4. Plant Sampling and Analysis

Four petioles and leaflets were collected from four plants in each sub-plot for P analysis. The petioles and leaflets were chosen from the fourth and fifth fully expanded leaves from the plant top [34]. The petioles and leaflets were washed with deionized water. All petioles and leaflets were dried in an oven with air circulation at 65 °C for 96 h and then ground. The ground petioles were ashed at 550 °C for 5 h in a muffle furnace [35]. The ash was dissolved in 50% HCl on a hot plate and analyzed using ICP [35,36].

2.5. Potato Yield Components and Measurements

The tubers were dug using the two-row digger from each experimental site and then handpicked from a 5.5 m2 central area per plot. Fresh tubers were graded, counted, and weighed to calculate total tuber yield per hectare (ha) and per plant, and the number of tubers per plant was determined based on fresh tuber grades. The total yield was calculated by summing all potato tuber grades. The marketable tuber potato yield was obtained by summing all grades where the tuber size was more than 65 g, except the undersized tubers (the tuber weight mean that was equal or lower than 65 g on average); undersized tubers refer to the unmarketable potato tuber yield.
A random sampling of four potato tubers was collected from each of the grade numbers over 65 g to determine specific gravity. Specific gravity was obtained with a composite of potato tubers according to [37]:
Specific Gravity (SG) = Tuber weight in air/(tuber weight in the air − tuber weight in water).

2.6. Statistical Analysis

All data were tested for normality before analysis and the least significant difference (LSD) test at a statistical significance level of P < 0.05. Tukey’s test was performed on the data using SAS. The statistical analysis was implemented for all yield components, measurements, and plant tissue analysis using Microsoft Excel (Microsoft Corporation, USA) and JMP 14.1 statistical software from SAS. The analysis of variance (ANOVA) was accomplished separately for each variety using PROC MIXED of SAS version 9.4 [38] with blocks as a random effect and the P application rates as fixed effects.

3. Results

3.1. Correlation of Total Potato Yield with Soil pH

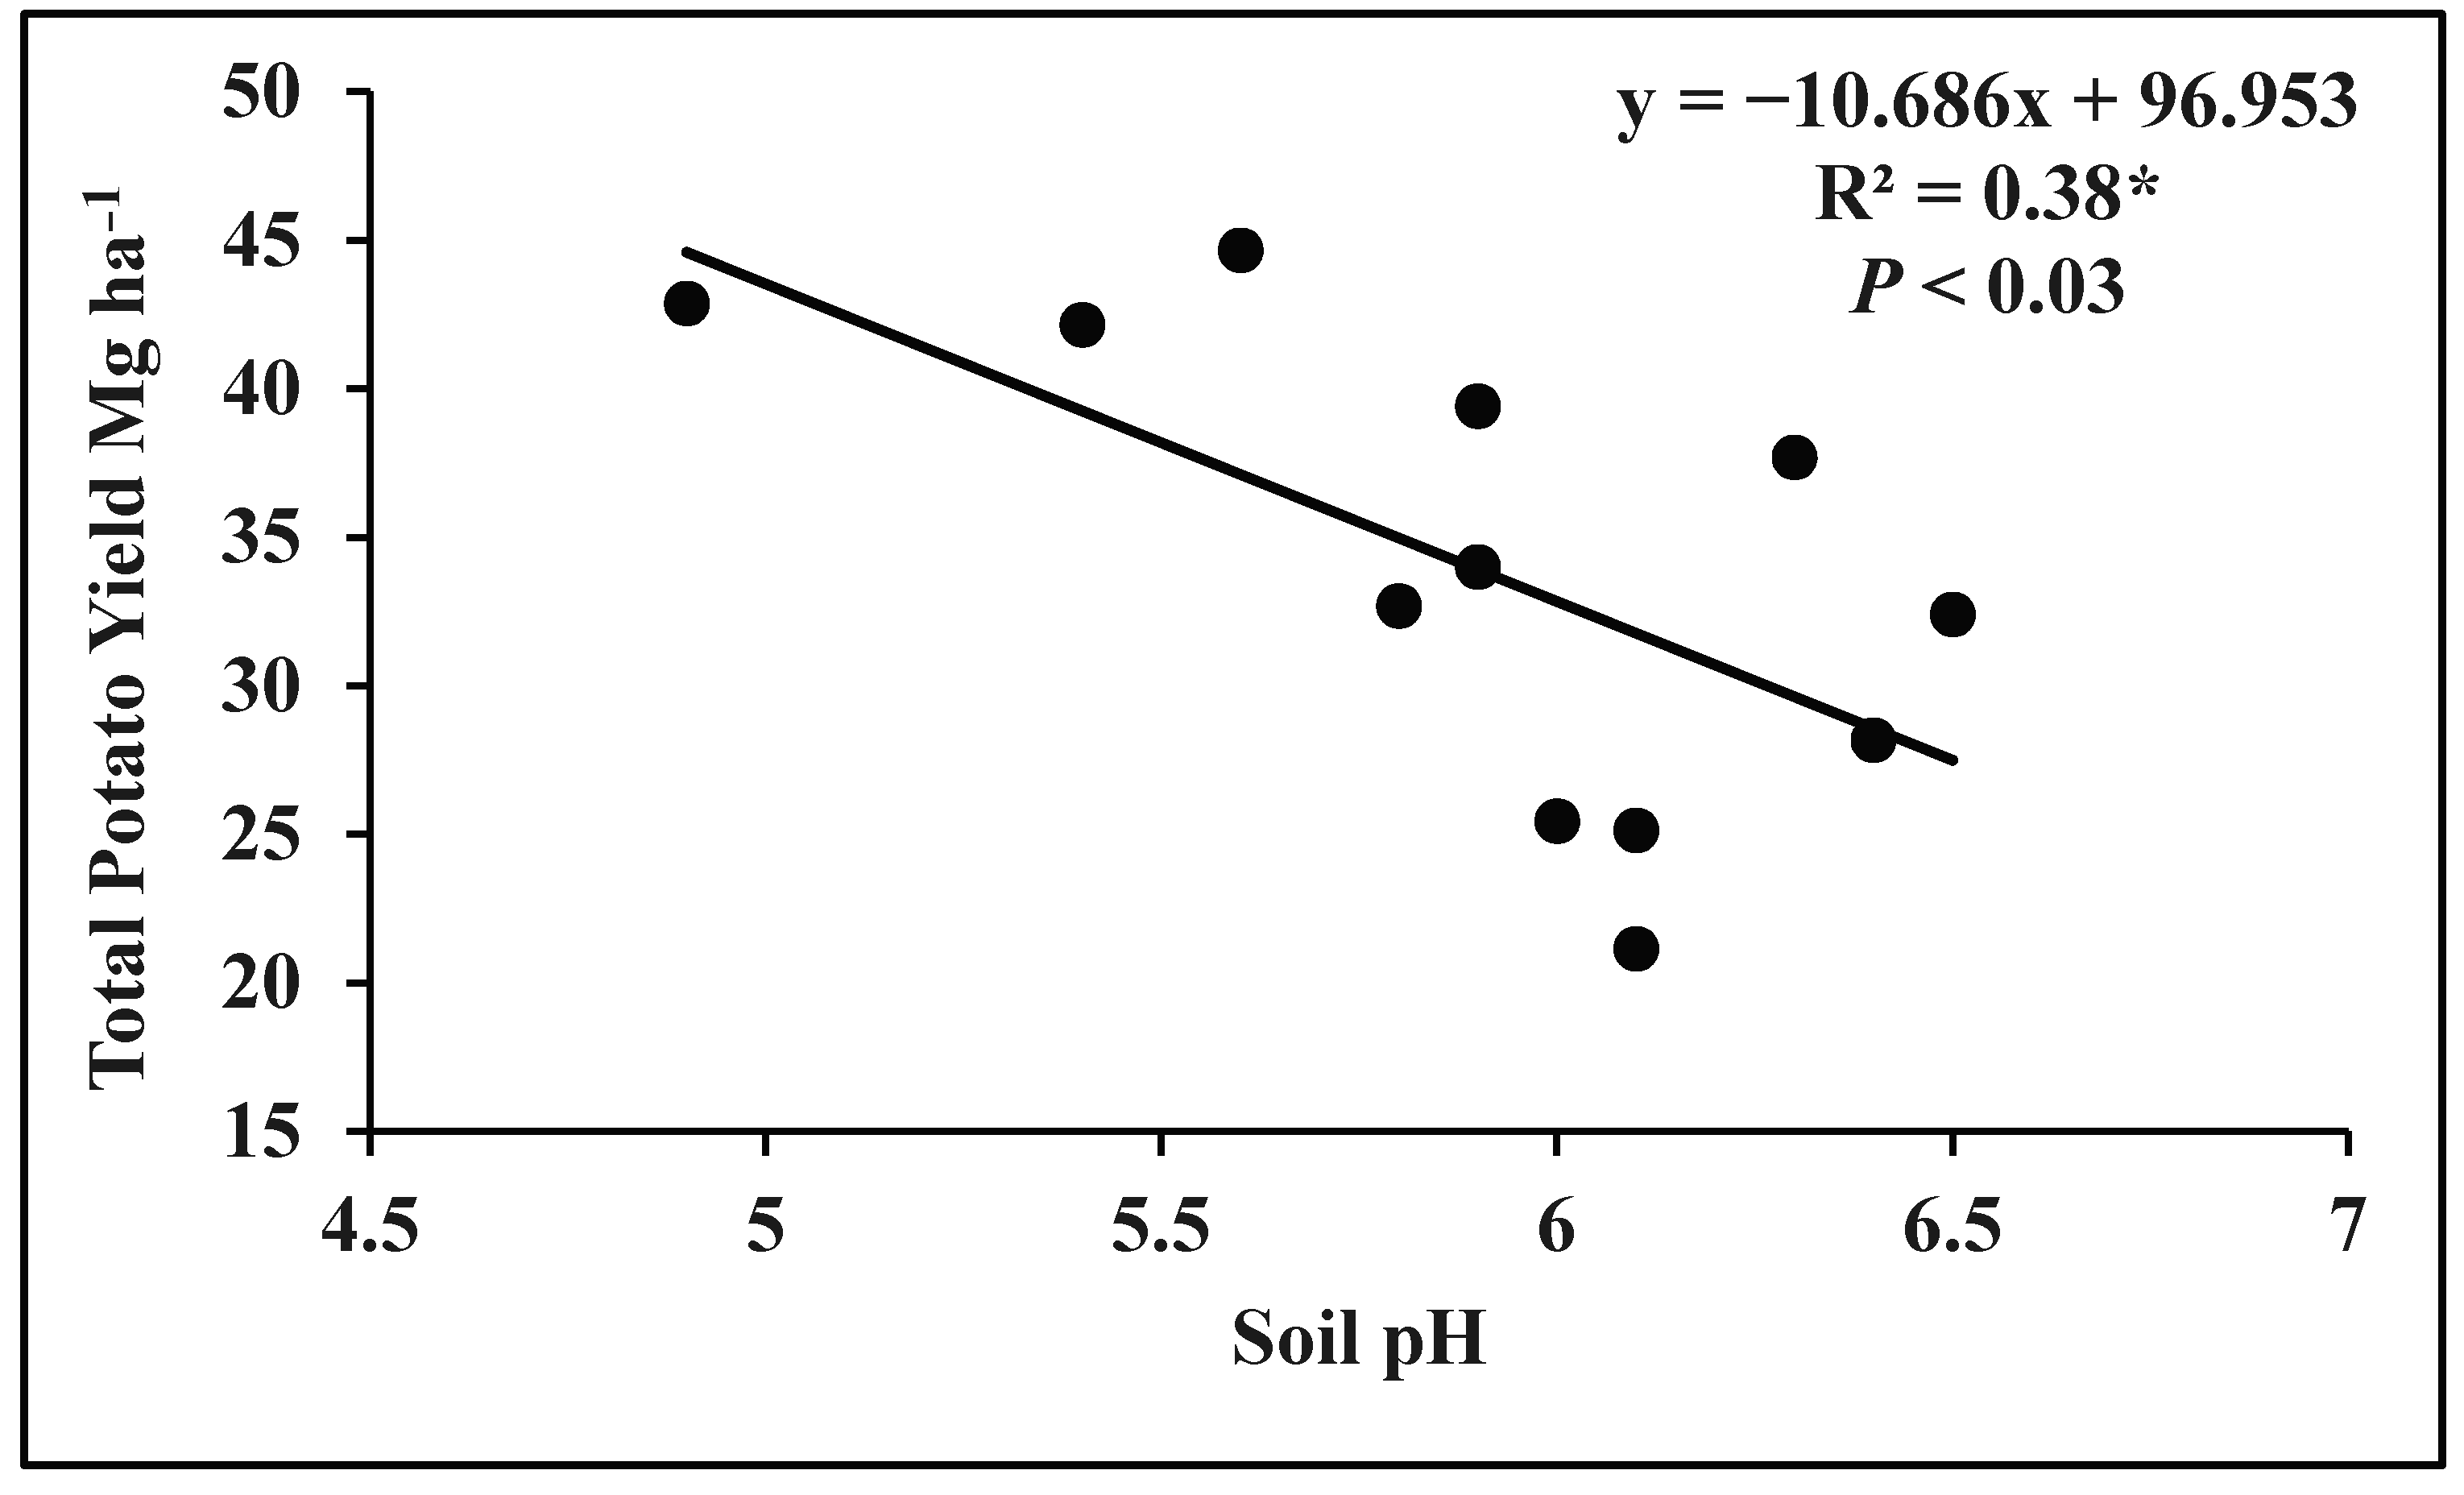
One of our objectives was to determine the relationship between potato yield and soil pH. Figure 2 shows the significant relationship between soil pH and total potato tuber yield. P = 0.03 showed a significant relationship. The highest total potato tuber yield was obtained for the acidic soil pH values, whereas the lower total potato yield was observed at near natural soil pH values. Subsequently, the 12 experimental sites were split into groups with soil pH values either ≥ 6 or < 6. In this study, sites were categorized into two groups: (a) a group with high pH values that are soil pH ≥ 6, which included the AF1, AF2, AF3, AF4, CA1, and CA3 sites and (b) a group with corresponding low soil pH values < 6, which included the WL, NS1, NS2, FV, CA2, and LM sites.
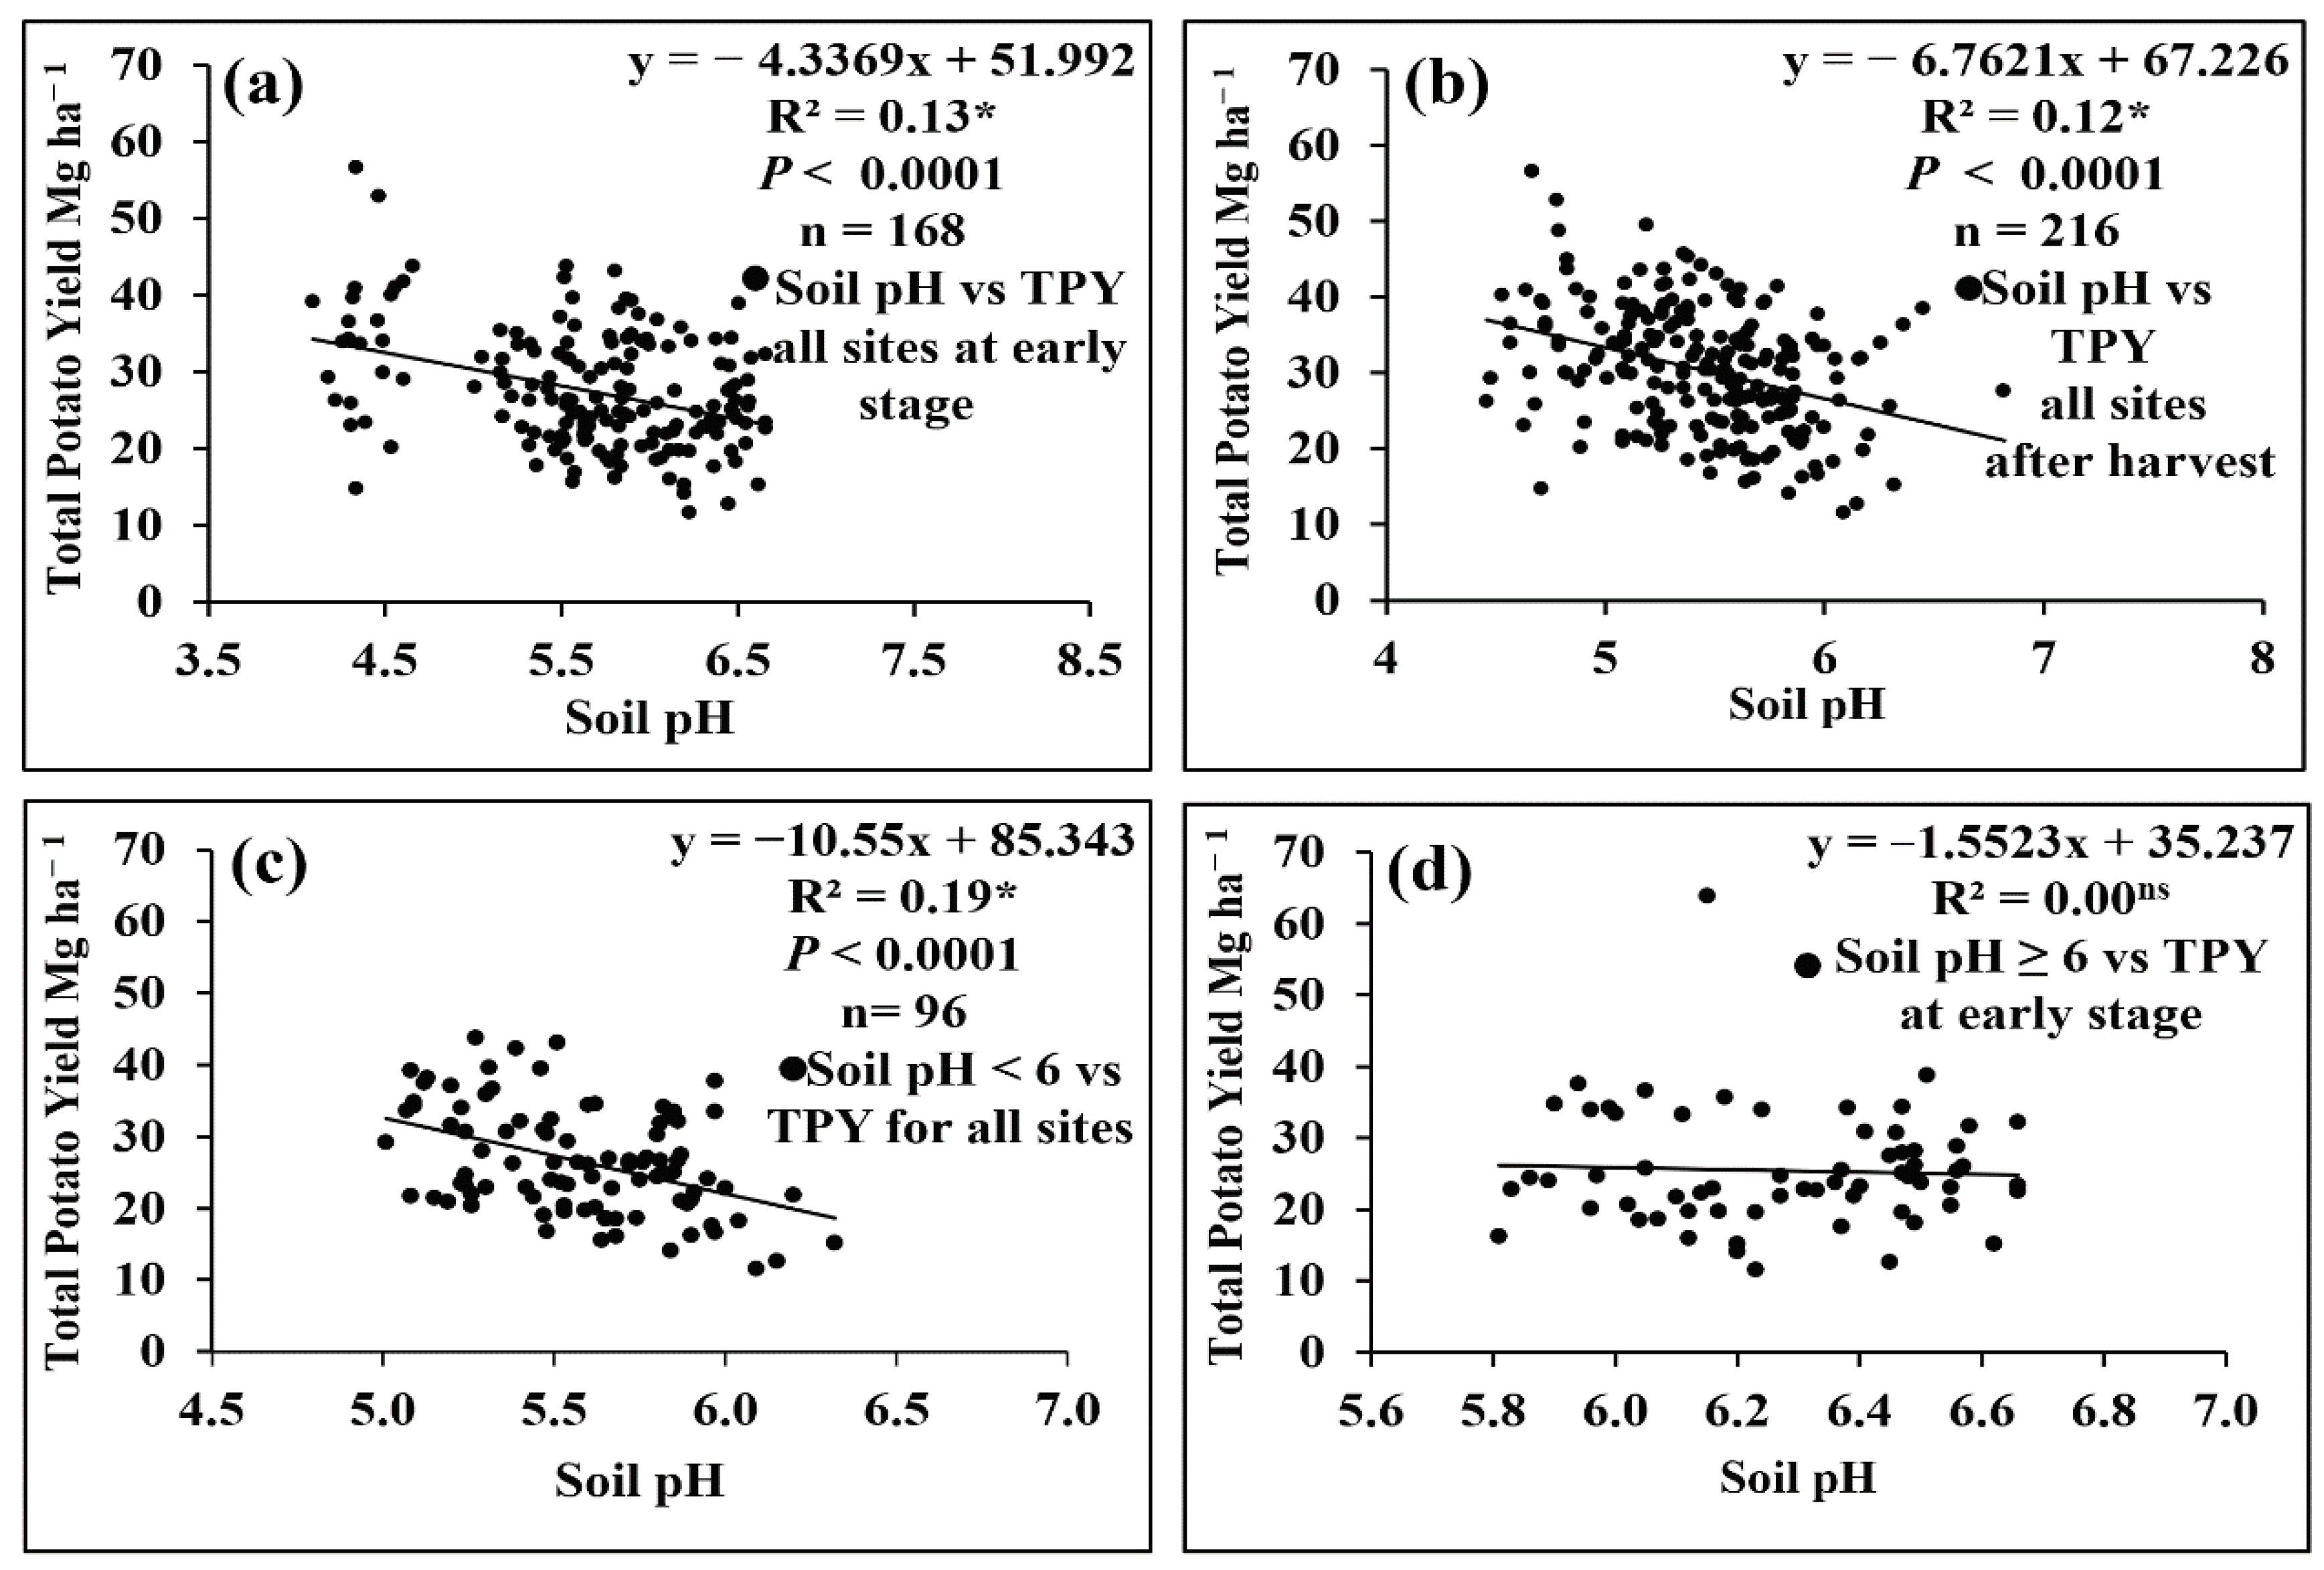
There was a significant effect from soil pH on the potato yield (Figure 3a,b). The difference between the yield–soil pH relationships for each growing stage is detailed in Figure 3a,b. There was a significant negative impact of soil pH on total potato yield. Thus, the coefficient of determination (R2 = 0.19) was achieved for all sites at harvest with soil pH < 6, and this relationship was significantly correlated with total potato yield (Figure 3c). There was no clear relationship between soil pH and total potato yield for all sites (soil pH > 6) (Figure 3d).

3.2. Phosphorus Effects on Potato Tuber Yield Parameters

3.2.1. The Effect of Phosphorus on Total Potato Tuber Yield, Specific Gravity, Marketable, and Unmarketable Tuber Yield

The main effect of the P application rate on total tuber yield, specific gravity, marketable, and unmarketable tuber yield was not statistically significant (P < 0.05; Figure 4a–k). For all combined sites, the P application did not show a significant impact on total tuber yield, specific gravity, marketable and unmarketable tuber yield (Figure 4a,d,f,i). The total tuber yields ranged from 28.8 to 32.0 Mg ha−1 at all combined sites (Figure 4a) and ranged from 24.3 to 27.5 Mg ha−1 at all sites combined at soil pH ≥ 6 (Figure 4b). The total tuber yield ranged from 33.3 to 36.8 Mg ha−1 at all sites combined at soil pH < 6 (Figure 4c). Increasing the P application rate from 0 to 168 Kg P ha−1 increased the total tuber yield at all combined sites and all sites combined at soil pH < 6 by about 6.3% and 9.5%, respectively (Figure 4a,c), with no significant difference among the total tuber yields obtained at the remaining P application rates. By contrast, the total tuber yield decreased by 2.0% due to increased P application rate from 0 to 168 Kg P ha−1 (Figure 4b). However, total tuber yield did not respond to P application rates from 0 to 280 Kg P ha−1. The main effect of the P application rate on specific gravity was not statistically significant (Figure 4d,e). Similarly, the marketable tuber yield was not statistically significant (Figure 4f–h). The 168 Kg P ha−1 rate of P application increased the marketable tuber yield by about 3.0% compared to 0 Kg P ha−1 at all combined sites (Figure 4f), with no significant difference in marketable tuber yield obtained among the remaining P application rates. By contrast, the marketable tuber yield decreased by 4.6% due to an increased P application rate from 0 to 168 Kg P ha−1 at all sites combined at soil pH ≥ 6 (Figure 4g). Marketable tuber yield ranged from 29.1 to 32.3 Mg ha−1 (Figure 4h). For all sites at soil Ph < 6, the P application rate did not show a significant impact on marketable tuber yield, even though, results showed the highest marketable tuber yield (32.3 Mg ha−1 ) achieved at 168 Kg P ha−1 rate of P application compared to 0 Kg P ha−1 rate (Figure 4h). The main effect of the P application rate on unmarketable tuber yield was not statistically significant (P < 0.05, according to Tuke’s test; Figure 4i–k). All combined site results showed that the highest unmarketable tuber yield (4.9 Mg ha−1) was not significantly different among the P application 0 Kg P ha−1 rate, where the unmarketable tuber yield increased by about 11.4% (Figure 4i). For all site combined treatments at soil pH ≥ 6, the P application rate did not show a significant impact on the unmarketable tuber yield (Figure 4j). However, increasing the P application rate from 0 to 112 Kg P ha−1 increased the unmarketable tuber yield by about 14.6%, even though it was statistically insignificant compared to the unmarketable tuber yield at the other P application rates (Figure 4j). Similarly, the unmarketable tuber yield treatments were not statistically significant at all sites at soil pH< 6 (Figure 4k).

3.2.2. The Effect of Phosphorus on Tuber Number per Plant and Total Tuber Mean Weight

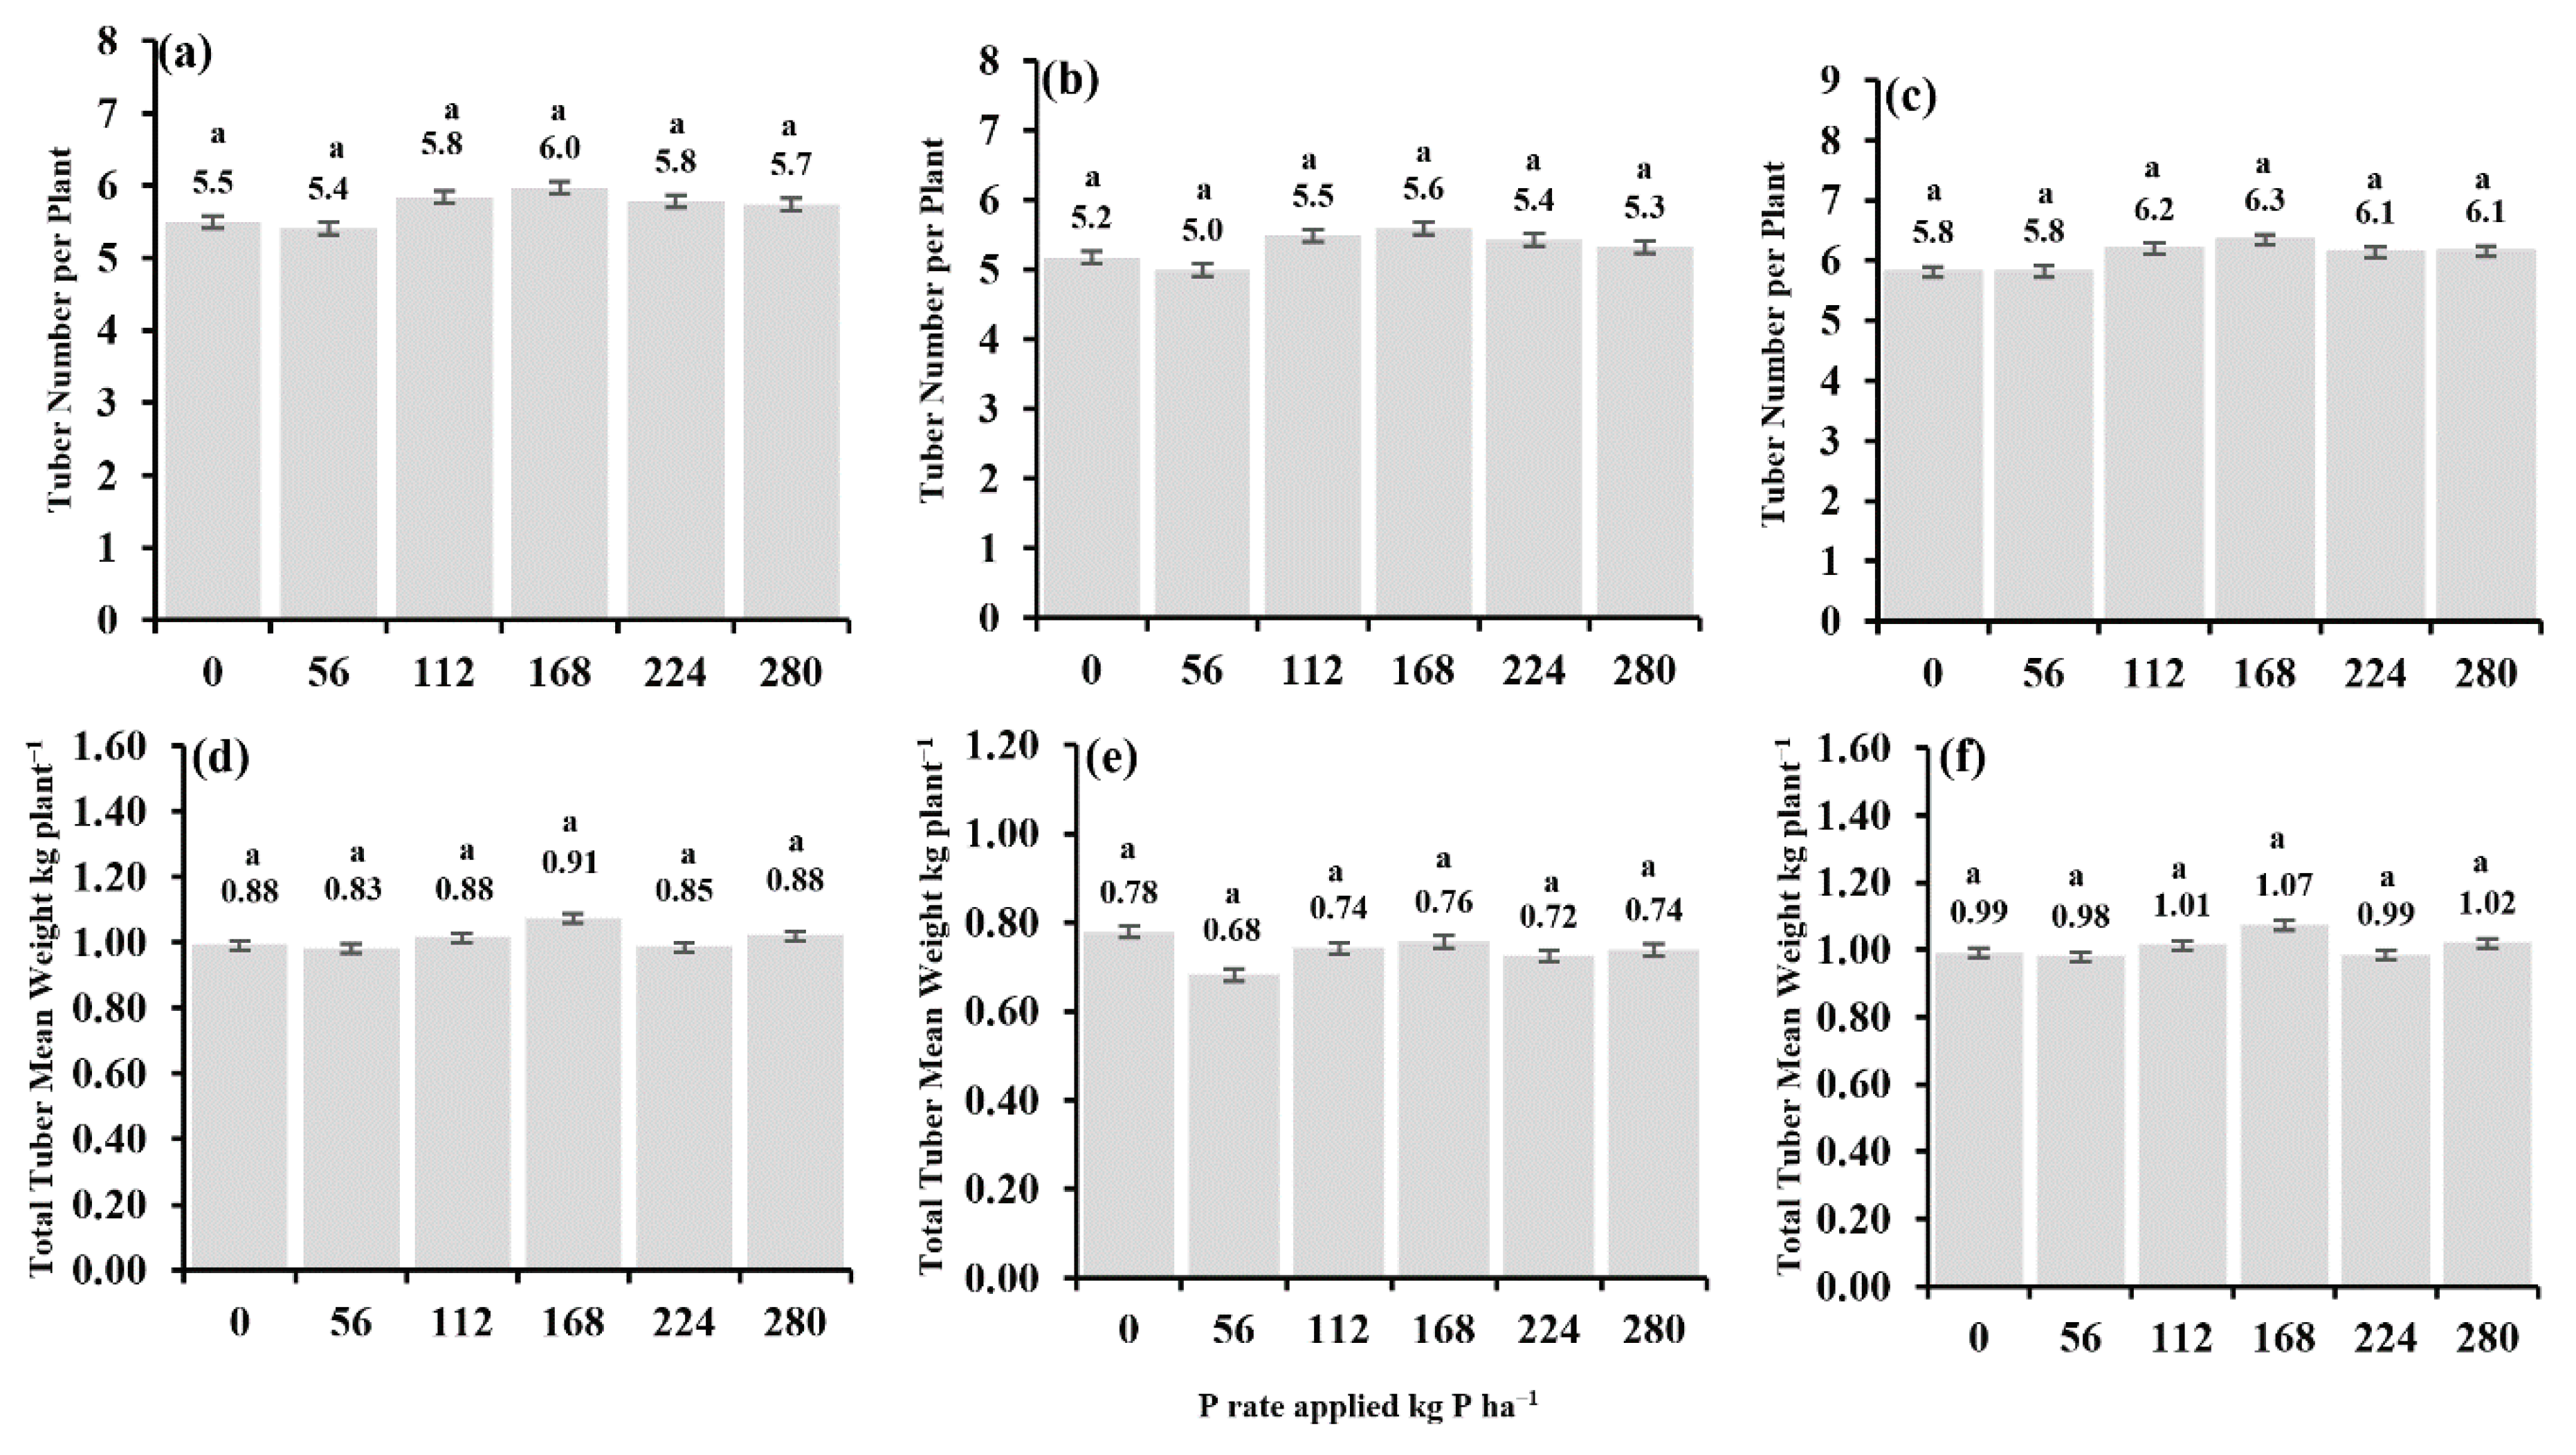
The main effect of the P application rate on tuber number per plant was not statistically significant ( P< 0.05 according to the Tukey’s test) (Figure 5a–f). For all sites combined, from 0 to 168 Kg P ha−1 rate of P application increased the tuber number per plant from 5.5 to 6, and the tuber number per plant at 168 Kg P ha−1 rate increased by about 9.1% compared to that at 0 Kg P ha−1 (5.5 tubers per plant), with no significant difference among tuber numbers per plant obtained at the remaining P application rates (Figure 5a). For all sites combined at soil pH ≥ 6, the P application rate did not show a significant impact on tuber number per plant (Figure 5b). However, increasing the p application rate from 0 to 168 Kg P ha−1 increased the tuber number per by about 7.7%, even though it was statistically insignificant compared to the tuber number per plant at the other P application rates (Figure 5b). For all sites at soil pH < 6, the 168 Kg P ha−1 rate of P application increased the tuber number per plant (6.3 tubers per plant) by about 8.2 % compared to application of 0 Kg P ha−1 (5.8 tubers per plant), with no significant difference among the tuber number per plant obtained at the remaining P application rates (Figure 5c). Similarly, total tuber means weight was not statistically significant (Figure 5d–f). Total tuber mean weight ranged from 0.83 to 0.91 Kg plant−1 (Figure 5d), the highest total tuber mean weight (0.91 kg plant−1) was observed at 168 Kg P ha−1, and the lowest total tuber mean weight (0.83 Kg plant−1) was obtained at 56 Kg P ha−1 (Figure 5d). For all sites combined at soil pH ≥ 6, P application rates did not show a significant impact on total tuber mean weight (Figure 5e). For all sites at soil pH < 6, increasing the P application rate from 0 to 168 Kg P ha−1 increased the total tuber mean weight by about 8.1%, even though it was statistically insignificant compared to the total tuner mean weight at the other P application rates.

3.3. Petiole P Concentration and its Uptake

The relationship between P concentration and the unmarketable tuber yield at combined ≥ 6 soil pH sites is illustrated in Figure 6a. The coefficient of determination (R2) showed a good correlation between the explanatory variable (P concentration) and the response variable (unmarketable tuber yield), which demonstrated a high correlation at R2 = 0.26. This relationship showed that when P concentration was increased, this led to decreased unmarketable tuber yield (Figure 6a). The relationship between P concentration and petiole dry weight for the ‘Shepody’ variety at soil pH ≥ 6 was highly correlated at R2 = 0.31 and showed a positive correlation between the P concentration as a predictor and petiole dry weight as a response variable (Figure 6b). A positive correlation (R2 = 0.18) was found between P concentration and petiole dry weight for ‘Superior’ variety at ≥ 6 soil pH (Figure 6c). The most robust relationships between P uptake and petiole dry weight at combined sites at ≥ 6 soil pH, with R2 = 0.75, showed a positive correlation (Figure 6d).
Another strong relationship was observed between the explanatory variable (P uptake) and the response variable (petioles dry weight) for ‘Shepody’ variety at soil pH ≥ 6, which was highly correlated at R2 = 0.96 (Figure 6e). All combined sites at < 6 soil pH were highly correlated at R2 = 0.76 in terms of the relationship between the predictor (P uptake) and the response (petioles dry weight). The logarithmic pattern showed petiole dry weight increased because of increased P uptake (Figure 6e).

4. Discussion

Potato yield could be responsive to P application in acidic soils, even at very high soil test P levels, these data are in agreement with many others [1,4,5,6]. In our study, maximum P solubility occurs at near-natural pH values. The P solubility increased as soil pH changed from acid to neutral pH [1,13,39]. Potato production is tolerant of acid soil as long as the Al concentration is low [40]. In the present study, it is best to apply P to soils with pH values ranging between 4.8 and 5.9 [5,6]. Although, there is a negative correlation between total potato yield and soil pH at sites with soil pH < 6, however, it is better than the relation at soil pH > 6 and sites combined. Moreover, potato yield declines when soil pH > 6,this could occur to the soil pH changes from low to slightly acidic or natural, which decreased Al and Fe soil concentration and increased P availability in the soil. Consequently, the potato yield cannot respond to P fertilization when soil pH is larger than 6 [5,6,13,41]. The application of 168 kg P ha−1 tended to increase the total tuber yield at all sites with combined < 6 soil pH; this was attributed to increasing the P concentration in the shoot system to the optimal range, as reported by [7]. However, the P application rates did not increase the total tuber yield, because P did not affect the number or weight of the potato tubers. These data confirm that potato tuber yield is not responsive to P fertilization when grown in soils with high P availability (Table 2). Other studies have found that the highest responses in total potato yield occurred at lower P application rates [1,18,41,42].
Our results showed that the differences among sites with respect to the total tuber yield were clearly related to their soil pH and P soil concentrations (Table 2). The total tuber yields at sites with < 6 soil pH was higher than the total tuber yields at sites with ≥ 6 soil pH, which confirms our statement that the tuber yield decreased when the soil pH increased above 6.
The P application rates did not affect specific gravity at all sites combined (≥ 6 < soil pH). These results were attributed to the high P concentrations at all sites (Table 2). These findings are similar to the report by [1,43], who found that where soil P concentration was at more than the optimum level or excessive P applications had occurred, relatively little influence on specific gravity resulted. The specific gravity results are corroborated by other researchers’ findings, which showed weak, insignificant relationships among soil P concentration, P application rates, and specific gravity [11,16,43]. Investigation of these results shows that where soil P is at more than the optimum level (Table 2; Mehlich 3 and Modified Morgan soil test P methodology), some phosphate might decrease in solids, and for many of the responsive sites, the higher rate of P applications minimized the specific gravity levels [44]. Similarly, increasing mineral fertilizer leads to the reduction of specific gravity. In contrast to this study, some researchers’ results revealed a rise in the specific gravity of tubers in response to high P application rates [1,45].
In response to increased P rate application from 0 to 280 kg P ha−1 at all sites combined ≥ 6 < soil pH for all potato varieties cultivated in this project, there was an insignificant increase in the marketable tuber yield. The marketable tuber yield results are corroborated by the findings of [1], who reported that the effect of P application rates were not significant on marketable tuber yield. This scarcity of difference was attributed to the high soil test phosphorus at both soil pH group values in both years (Table 2). A balanced approach to P applications ensures an appropriate P supply for optimum marketable tuber yield while impeding excessive accumulation of soil P and increasing potato responsiveness to P application [28].
Concerning the unmarketable potato tuber yield, there were no significant differences in amounts of small, unmarketable tubers (less than 65 g) in the P treatments. These results are confirmed by [46], who recommended that P application rates without organic manure were not statistically significant with regard to the unmarketable tuber yield. The same data were observed [47], who reported that P application rates did not significantly affect the unmarketable tuber yield. In our study, regardless of the significant differences, the unmarketable tuber yield was higher at all combined sites at ≥ 6 soil pH than at all combined sites at soil pH < 6. The P rate application 112 kg P ha−1 obtained the highest unmarketable tuber yield, and 224 kg P ha−1 resulted in the lowest unmarketable tuber yield at combined sites with ≥ 6 soil pH. The results showed that the lowest unmarketable tuber yield at all combined sites with < 6 soil pH was obtained at 56 kg P ha−1. These results are corroborated by the findings of [18]. Overall, the unmarketable tuber yield of potatoes at all combined sites at < 6 soil pH was lower than all combined sites at ≥ 6 soil pH. This ocuured because an unmarketable tuber was categorized as a rotten, diseased, insect-attacked, and small-weight tuber. In turn, lower soil pH can reduce disease incidence [18].
However, the number of tubers per plant values did not differ statistically among the P application rates. These results are corroborated by the findings of [7,42]. The P application might play an important role in increasing the number of tubers, which occurs because P plays an essential role in photosynthesis, cellular energy transfer, and respiration. In turn, P is important for processes related to carbohydrate structure and storage in tubers [11,14].
The combined sites at < 6 soil pH achieved higher total tuber mean weights compared to the combined sites at ≥ 6 soil pH. These results are confirmed by [48], who reported that as P application rates increased, the tuber mean weight increased, and there was a positive impact of P rates on the tuber mean weight. This was ascribed to P functions in the potato plant. The P plays an indispensable role as a component in phosphorylated sugars, nucleic acids, nucleotide, and phospholipids; in turn, it is crucial to tuber carbohydrate formation and structure [8,14,15,48].
The relationship between unmarketable tuber yield and P concentration at all combined sites at ≥ 6 soil pH was a negative correlation; this means that the petiole P concentration increased, which led to decreased unmarketable tuber yields. This attributed to increasing the marketable yield as a result of P application rate; in turn, P petioles concentration increased, and this will be reflected in the tuber yield. Increasing P will deter insect attacks, diseases, and small tuber sizes by increasing the starch and carbohydrate conformation in tubers [7,8,14,18,47,49]. The ‘Shepody’ and ‘Superior’ varieties at ≥ 6 soil pH results had their petiole dry weights increased as a response to P concentration increase. This is because P is the most critical element in the structural component of phospholipids, phosphoproteins, coenzymes, nucleic acids, and nucleotides. In turn, RNA is essential in crops and vegetables to make proteins and other compounds fundamental for crop structure, genetic transfer, and seed yield [8,14,49,50]. The P uptake was strongly correlated with petiole dry weight, R2 = 0.75 and 0.76, for all combined sites at ≥ 6 < soil pH, respectively. This suggests that the impact of P fertilizer was substantial early in the growing season during the tuber initiation stage. Besides, adequate P management improves root growth, and in turn, P uptake will be increased [11]. The P applications may have improved petiole dry weights due to the ability of soil pH at optimal ranges (5–6) to provide and enhance P uptake, and due to the catalytic role, it is important in enhancing dissolution and P uptake from the soil. ‘Shepody’ has been more responsive to P applications or the availability in the soil under field experiments [49]. The P uptake could be linked with preferable root geometry, potatoes’ ability to uptake sufficient P from lower or subsoil concentrations, potatoes’ ability to make soluble nutrients in the rhizosphere zone, distribution and utilization within crops, transport, and balanced source–sink relations [8,14]. The sorption and desorption properties of the soil govern the P uptake by potatoes. For example, acidic soils rich in Al and Fe ions would mainly fix and precipitate P as an Al-Fe-P component [5,6].

5. Conclusions

The study objectives were to evaluate the effect of P rates on the P adequacy for total potato yield, specific gravity, and petioles P uptake in acidic soils in Northern Maine, USA.The results of this study suggest and support new strategies that must theorize different vulnerability of potato varieties to high soil P levels as well as site-specific properties of P availability, specifically, the soil pH assessment for better chemical and soil P availability. At medium and high P levels, yield parameters were inefficient and non-responsive to P application rates. Combined sites with < 6 soil pH had some of the better yield parameters compared to all combined sites ≥ 6 soil pH with P application rates between (56 kg P ha−1), and for all combined sites ≥ 6 soil pH, the best P rates were 0–56 kg ha−1, even though the 56 kg p ha−1 rate was P-efficient and non-responsive. As a starter fertilizer for all combined sites with ≥ 6 soil pH, farmers might apply P at a rate of 56 kg ha-1 at the beginning of the growing season due to the cold weather, with the result that p mineralization would be a very slow process and potato roots would not develop. We recommend that farmers need to test the soil every 2–3 years to determine soil P availability and soil pH.

Author Contributions

The paper is the result of the collaboration among all authors; however, A.J., L.K.S., A.A. and S.K.B. contributed to all sections. A.Z. and A.B. contributed to the section of soil, plant, and harvest. L.K.S. and A.A. funding acquisition. All authors have read and agreed to the published version of the manuscript.

Funding

This research was funded by Maine Department of Agriculture program of USDA, Specialty Crop Block Grant contract number: (RFP#201703055).

Conflicts of Interest

The authors declare no conflict of interest.

References

  1. Hopkins, B.G.; Hansen, N.C. Phosphorus Management in High-Yield Systems. J. Environ. Qual. 2019, 48, 1265–1280. [Google Scholar] [CrossRef] [PubMed] [Green Version]
  2. FAOSTAT. FAO, R. Food and Agriculture Organization. 2019. Available online: http://www.fao.org/faostat/en/#data (accessed on 9 December 2019).
  3. United States Department of Agriculture National Resources Conservation Service. The PLANTS Database; National Plant Data Center: Baton Rouge, LA, USA, 2018. Available online: https://plants.sc.egov.usda.gov/java/ (accessed on 10 November 2019).
  4. Rosen, C.J.; Kelling, K.A.; Stark, J.C.; Porter, G.A. Optimizing phosphorus fertilizer management in potato production. Am. J. Potato Res. 2014, 91, 145–160. [Google Scholar] [CrossRef]
  5. Fixen, P.E.; Bruulsema, T.W. Potato management challenges created by phosphorus chemistry and plant roots. Am. J. Potato Res. 2014, 91, 121–131. [Google Scholar] [CrossRef]
  6. Hopkins, B.G.; Fernelius, K.J.; Hansen, N.C.; Eggett, D.L. AVAIL phosphorus fertilizer enhancer: Meta-analysis of 503 field evaluations. Agron. J. 2018, 110, 389–398. [Google Scholar] [CrossRef] [Green Version]
  7. Fernandes, A.M.; Soratto, R.P. Response of potato cultivars to phosphate fertilization in tropical soils with different phosphorus availabilities. Potato Res. 2016, 59, 259–278. [Google Scholar] [CrossRef] [Green Version]
  8. Havlin, J.L.; Tisdale, S.L.; Nelson, W.L.; Beaton, J.D. Soil Fertility and Fertilizers; Pearson Education India: New Delhi, India, 2016. [Google Scholar]
  9. Faucon, M.-P.; Houben, D.; Reynoird, J.-P.; Mercadal-Dulaurent, A.-M.; Armand, R.; Lambers, H. Advances and Perspectives to Improve the Phosphorus Availability in Cropping Systems for Agroecological Phosphorus Management. In Advances in Agronomy; Elsevier: Amsterdam, The Netherlands, 2015; Volume 134, pp. 51–79. [Google Scholar] [CrossRef]
  10. Ruark, M.D.; Kelling, K.A.; Good, L.W. Environmental concerns of phosphorus management in potato production. Am. J. Potato Res. 2014, 91, 132–144. [Google Scholar] [CrossRef]
  11. Soratto, R.P.; Pilon, C.; Fernandes, A.M.; Moreno, L.A. Phosphorus uptake, use efficiency, and response of potato cultivars to phosphorus levels. Potato Res. 2015, 58, 121–134. [Google Scholar] [CrossRef]
  12. Reinhardt, R.L.; Norton, S.A.; Handley, M.; Amirbahman, A. Dynamics of P, Al, and Fe During High Discharge episodic Acidification at the Bear Brook Watershed in Maine, USA. In Biogeochemical Investigations of Terrestrial, Freshwater, and Wetland Ecosystems across the Globe; Springer: Dordrecht, The Netherlands, 2004; pp. 311–323. [Google Scholar] [CrossRef]
  13. Bruulsema, T.W.; Peterson, H.M.; Prochnow, L.I. The science of 4R nutrient stewardship for phosphorus management across latitudes. J. Environ. Qual. 2019, 48, 1295–1299. [Google Scholar] [CrossRef] [Green Version]
  14. Hopkins, G.B. Phosphorus. In Handbook of Plant Nutrition, 2nd ed.; Barker, A.V., Pilbeam, D.J., Eds.; CRC Press: Boca Raton, FL, USA, 2015; pp. 66–111. Available online: https://www.routledgehandbooks.com/doi/10.1201/b18458-6 (accessed on 18 December 2018).
  15. Taiz, L.; Zeiger, E. Plant Physiology (2002); Sinauer Associates Inc.: Sunderland, MA, USA, 2002; Volume 3, Available online: https://academic.oup.com/aob/article/91/6/750/211033 (accessed on 20 September 2019).
  16. Balemi, T. Effect of phosphorus nutrition on growth of potato genotypes with contrasting phosphorus effeciency. Afr. Crop Sci. J. 2009, 17. [Google Scholar] [CrossRef]
  17. Hailu, G.; Nigussie, D.; Ali, M.; Derbew, B. Nitrogen and phosphorus use efficiency in improved potato (Solanum tuberosum L.) cultivars in southern Ethiopia. Am. J. Potato Res. 2017, 94, 617–631. [Google Scholar] [CrossRef]
  18. Rosen, C.J.; Bierman, P.M. Potato yield and tuber set as affected by phosphorus fertilization. Am. J. Potato Res. 2008, 85, 110–120. [Google Scholar] [CrossRef]
  19. Fernandes, A.M.; Soratto, R.P.; Souza, E.d.F.C.d.; Job, A.L.G. Nutrient uptake and removal by potato cultivars as affected by phosphate fertilization of soils with different levels of phosphorus availability. Rev. Bras. de Ciência do Solo 2017, 41. [Google Scholar] [CrossRef] [Green Version]
  20. Chalker-Scott, L. Environmental significance of anthocyanins in plant stress responses. Photochem. Photobiol. 1999, 70, 1–9. [Google Scholar] [CrossRef]
  21. Cassagne, N.; Remaury, M.; Gauquelin, T.; Fabre, A. Forms and profile distribution of soil phosphorus in alpine Inceptisols and Spodosols (Pyrenees, France). Geoderma 2000, 95, 161–172. [Google Scholar] [CrossRef]
  22. Grant, C.; Flaten, D.; Tomasiewicz, D.; Sheppard, S. The importance of early season phosphorus nutrition. Can. J. Plant Sci. 2001, 81, 211–224. [Google Scholar] [CrossRef]
  23. Hodges, S.C. Soil Fertility Basics. In Soil Science Extension; North Carolina State University: Raleigh, NC, USA, 2010; Available online: http://www2.mans.edu.eg/projects/heepf/ilppp/cources/12/pdf%20course/38/Nutrient%20Management%20for%20CCA.pdf (accessed on 12 October 2019).
  24. Sharma, L.K.; Bali, S.K.; Zaeen, A.A. A case study of potential reasons of increased soil phosphorus levels in the Northeast United States. Agronomy 2017, 7, 85. [Google Scholar] [CrossRef] [Green Version]
  25. Buob, T.E.; Rochette, E.A. Status of phosphorus in soils of the Connecticut river watershed in New Hampshire. Commun. Soil Sci. Plant Anal. 2003, 34, 1177–1192. [Google Scholar] [CrossRef]
  26. NOAA National Oceanic and Atmospheric Administration, USA. 2019. Available online: https://www.ncdc.noaa.gov/cdoweb/datasets/GHCND/stations/GHCND:USW00014607/detail (accessed on 15 December 2019).
  27. McIntosh, J.L. Bray and Morgan Soil Extractants Modified for Testing Acid Soils from Different Parent Materials 1. Agron. J. 1969, 61, 259–265. [Google Scholar] [CrossRef]
  28. Magdoff, F.; Van Es, H. Building Soils for Better Crops; Sustainable Agriculture Network Beltsville: Brentwood, MD, USA, 2009; Available online: https://www.sare.org/Learning-Center/Books/Building-Soils-for-Better-Crops-3rd-Edition (accessed on 16 June 2019).
  29. Mehlich, A. Mehlich 3 soil test extractant: A modification of Mehlich 2 extractant. Commun. Soil Sci. Plant Anal. 1984, 15, 1409–1416. [Google Scholar] [CrossRef]
  30. McLean, E. Soil pH and lime requirement. Methods Soil Anal. Part 2 Chem. Microbiol. Prop. 1983, 9, 199–224. [Google Scholar]
  31. Storer, D.A. A simple high sample volume ashing procedure for determination of soil organic matter. Commun. Soil Sci. Plant Anal. 1984, 15, 759–772. [Google Scholar] [CrossRef]
  32. Page, A.; Miller, R.; Keeney, D. Methods of Soil Analysis. Part 2. American Society of Agronomy; Soil Science Society of America: Madison, WI, USA, 1982; Available online: https://acsess.onlinelibrary.wiley.com/doi/pdf/10.2134/agronmonogr9.2.2ed.frontmatter (accessed on 15 October 2019).
  33. Dahnke, W.C.; Whitney, D.A. Measurement of soil salinity. Recomm. Chem. Soil Test Proced. North Cent. Reg. 1988, 499, 32–34. [Google Scholar]
  34. Westermann, D.; Kleinkopf, G. Phosphorus Relationships in Potato Plants 1. Agron. J. 1985, 77, 490–494. [Google Scholar] [CrossRef]
  35. Kalra, Y.P.; Maynard, D.G. Methods Manual for Forest Soil and Plant Analysis; Minister of Supply and Services Canada 1991; Canadian Forest Service: Edmonton, AB, Canada, 1991; Volume 319. Available online: https://cfs.nrcan.gc.ca/pubwarehouse/pdfs/11845.pdf (accessed on 5 April 2019).
  36. Chapman, H.D.; Pratt, P.F. Methods of analysis for soils, plants and waters. Soil Sci. 1962, 93, 68. [Google Scholar] [CrossRef] [Green Version]
  37. Kleinschmidt, G.; Kleinkopf, G.; Westermann, D.; Zalewski, J. Specific Gravity of Potatoes (CIS 609); University of Idaho: Moscow, Russia, 1984; Available online: https://scholar.google.com/scholar?hl=en&as_sdt=0%2C20&q=Kleinschmidt%2C+G.%3B+Kleinkopf%2C+G.%3B+Westermann%2C+D.%3B+Zalewski%2C+J.%2C+Specific+gravity+of+potatoes+%28CIS+609%29.+Moscow%3A+University+of+Idaho+1984.&btnG= (accessed on 21 October 2018).
  38. SAS. Base SAS 9.4 Procedures Guide; SAS Institute: Cary, NC, USA, 2015; Available online: https://support.sas.com/documentation/cdl/en/procstat/66703/PDF/default/procstat.pdf (accessed on 10 February 2019).
  39. Sposito, G. The Chemistry of Soils; Oxford University Press: Oxford, UK, 2008; Available online: https://scholar.google.com/scholar?q=Sposito,+G.,+The+chemistry+of+soils.+Oxford+university+press:+2008.&hl=en&as_sdt=0&as_vis=1&oi=scholart (accessed on 18 January 2018).
  40. Pehrson, L.; Mahler, R.; Bechinski, E.; Williams, C. Nutrient management practices used in potato production in Idaho. Commun. Soil Sci. Plant Anal. 2011, 42, 871–882. [Google Scholar] [CrossRef]
  41. Luz, J.M.Q.; Queiroz, A.A.; Borges, M.; Oliveira, R.C.; Leite, S.S.; Cardoso, R.R. Influence of phosphate fertilization on phosphorus levels in foliage and tuber yield of the potato cv. Ágata. Semin. Ciências Agrárias 2013, 34, 649–656. [Google Scholar] [CrossRef] [Green Version]
  42. Fernandes, A.M.; Soratto, R.P.; Gonsales, J.R. Root morphology and phosphorus uptake by potato cultivars grown under deficient and sufficient phosphorus supply. Sci. Hortic. 2014, 180, 190–198. [Google Scholar] [CrossRef]
  43. Laboski, C.A.; Kelling, K.A. Influence of fertilizer management and soil fertility on tuber specific gravity: A review. Am. J. Potato Res. 2007, 84, 283–290. [Google Scholar] [CrossRef]
  44. Stark, J.C.; Love, S. Tuber Quality. In Potato Production Systems; Stark, J.C., Love, S.L., Eds.; Univ of Idaho Extension: Moscow, ID, Russia, 2003; Available online: https://www.extension.uidaho.edu/detail.aspx?IDnum=1636 (accessed on 21 June 2019).
  45. Human, J. The Effect of Fertilizer Levels on Yield and Specific Gravity of Potatoes; Holetta Guenet Research Station Progress Report; IAR (Institute of Agricultural Research): Addis Ababa, Ethiopia, 1961; p. 278.
  46. Shibabaw, A.; Alemayehu, G.; Adgo, E.; Asch, F.; Freyer, B. Effects of organic manure and crop rotation system on potato (Solanum tuberosum L.) tuber yield in the highlands of Awi Zone. Ethiop. J. Sci. Technol. 2018, 11, 1–18. [Google Scholar] [CrossRef] [Green Version]
  47. Zelalem, A.; Tekalign, T.; Nigussie, D. Response of potato (Solanum tuberosum L.) to different rates of nitrogen and phosphorus fertilization on vertisols at Debre Berhan, in the central highlands of Ethiopia. Afr. J. Plant Sci. 2009, 3, 16–24. [Google Scholar]
  48. Fernandes, A.M.; Soratto, R.P. Phosphorus fertilizer rate for fresh market potato cultivars grown in tropical soil with low phosphorus availability. Am. J. Potato Res. 2016, 93, 404–414. [Google Scholar] [CrossRef] [Green Version]
  49. Benjannet, R.; Nyiraneza, J.; Khiari, L.; Fuller, K.; Bizimungu, B.; Savoie, D.; Jiang, Y.; Rodd, V.; Mills, A. An Agro-Environmental Phosphorus Model for Potato in the Canadian Maritime Provinces. Agron. J. 2018, 110, 2566–2575. [Google Scholar] [CrossRef]
  50. Parsad, R.; Power, J.F. Soil Fertility Management for Sustainable Agriculture; CRC Press: Boca Raton, FL, USA, 1997; Available online: https://www.google.com/books/edition/_/otAyc8tJGbwC?hl=en&gbpv=1 (accessed on 11 September 2019).
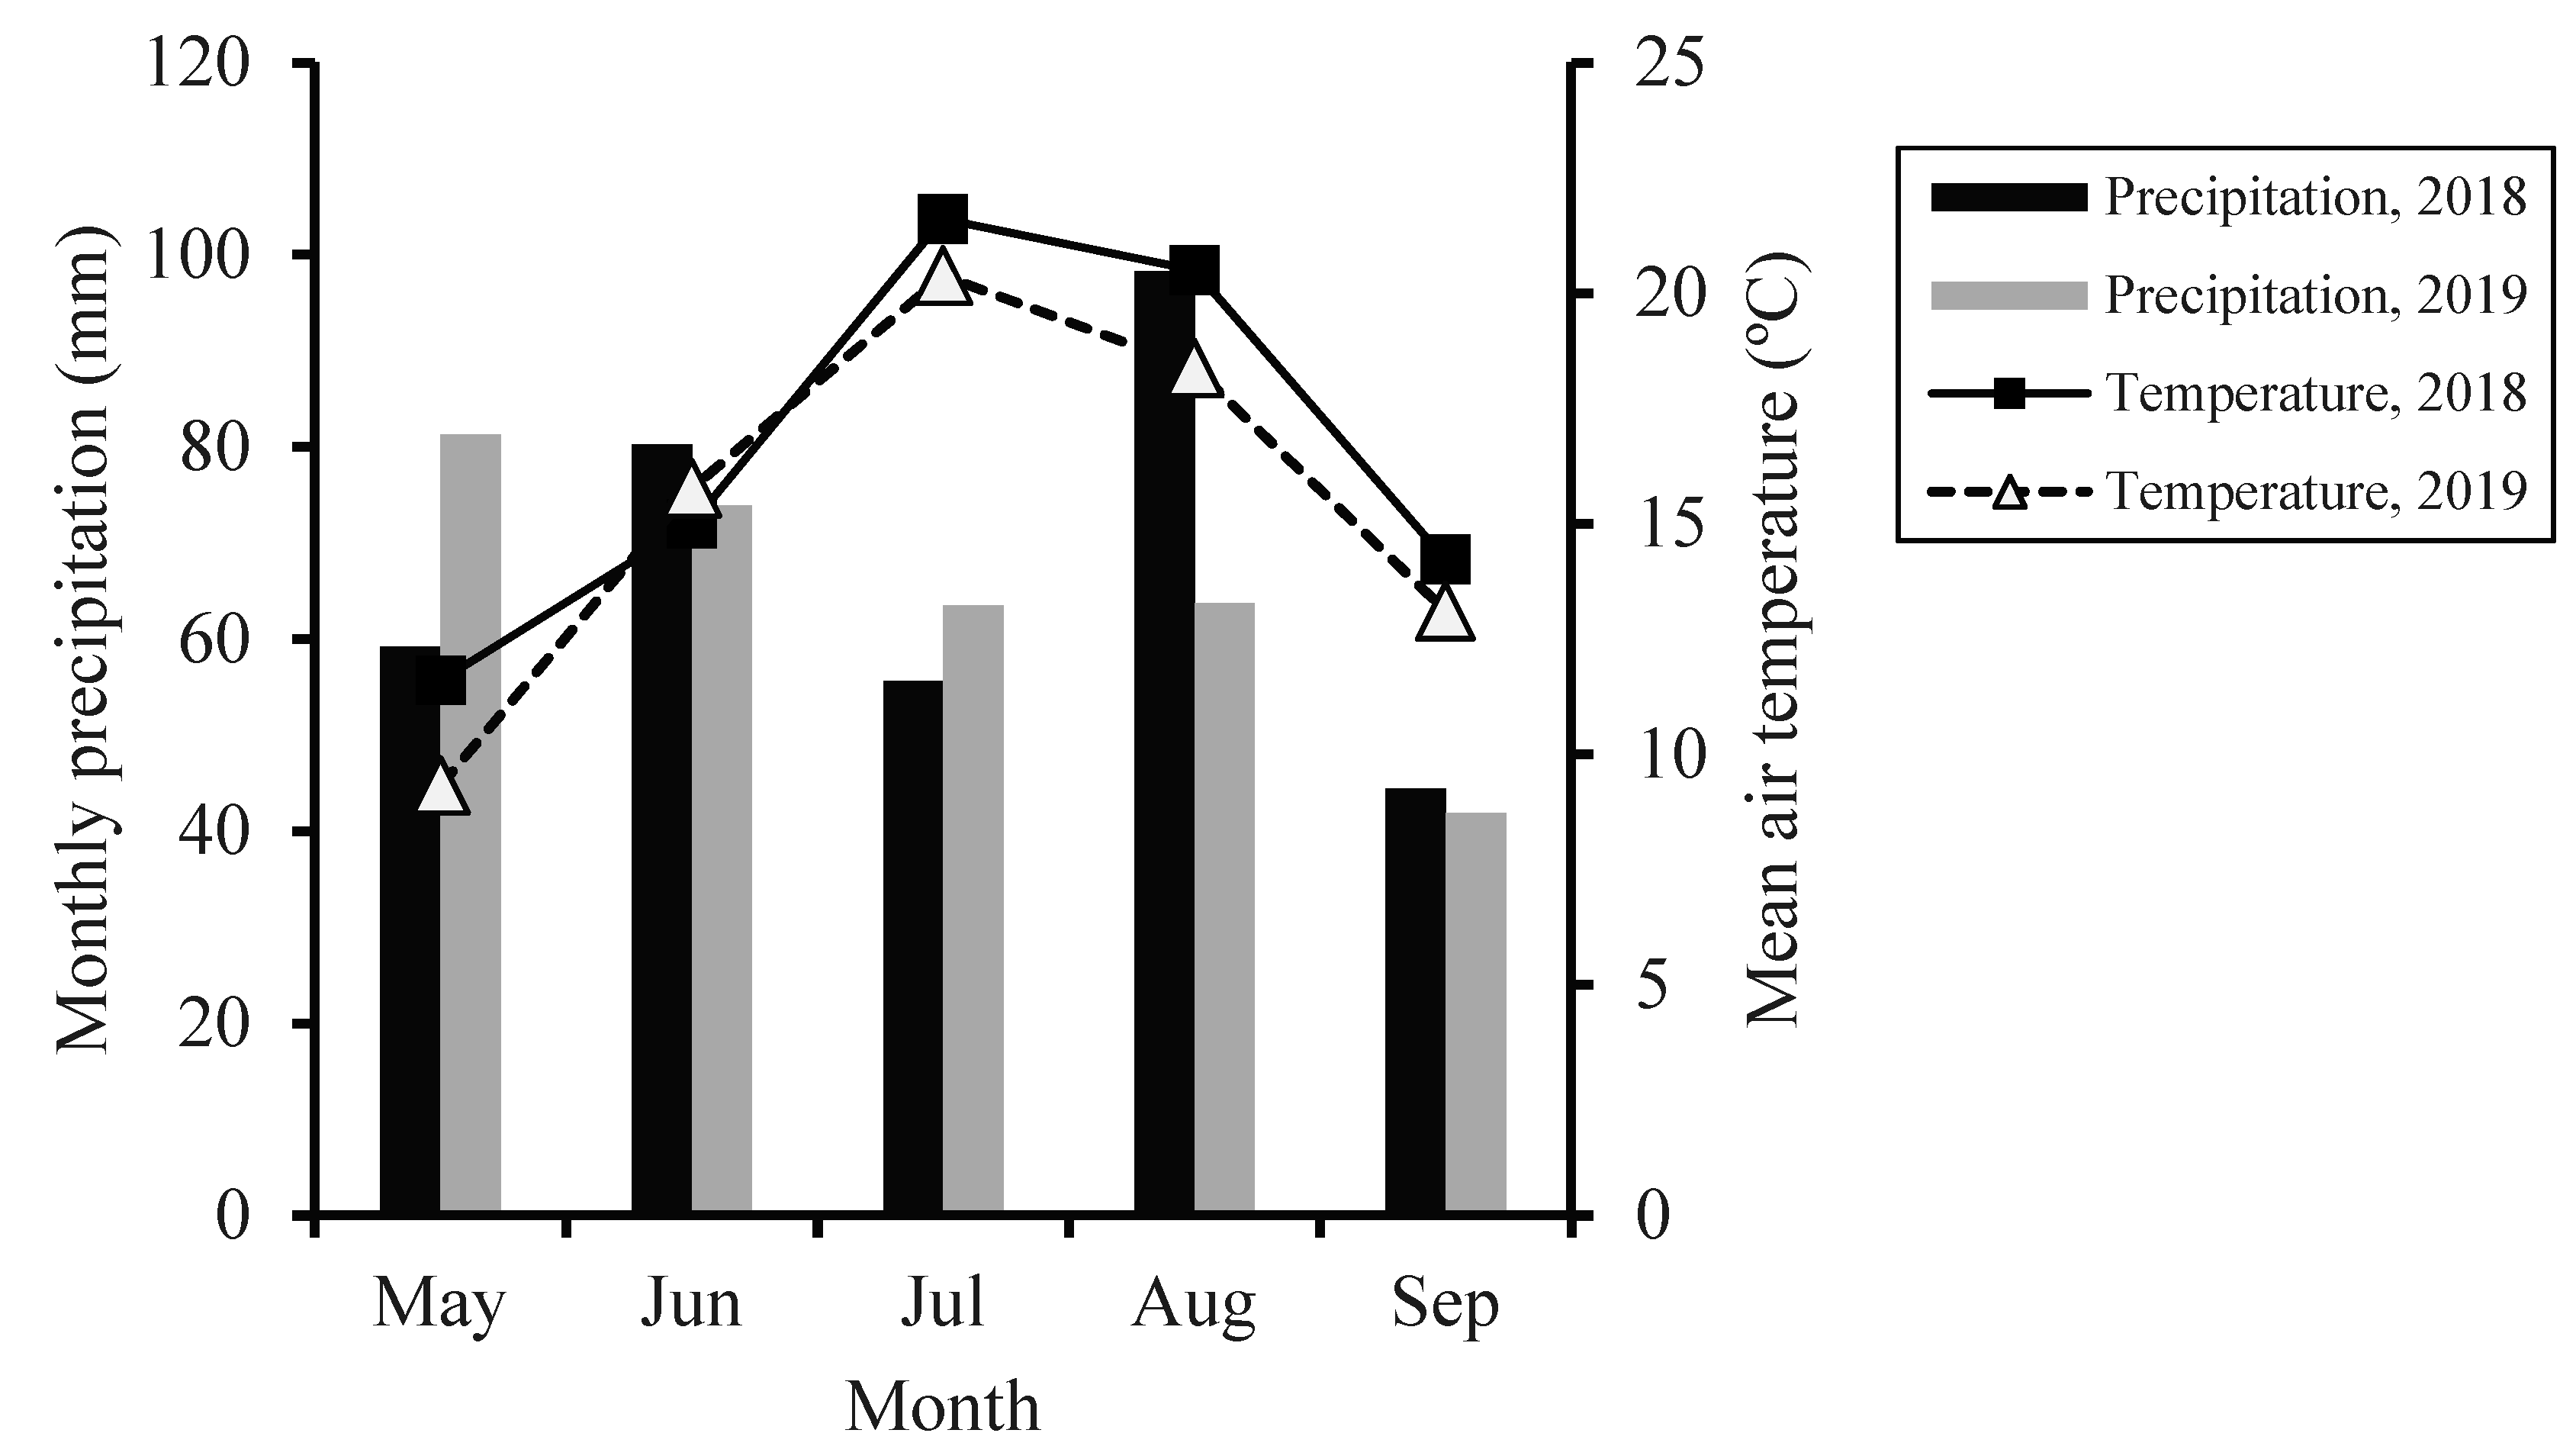
Figure 1. Climate data during the potato-growing season: a monthly temperature average (°C) and precipitation (mm). Source: National Oceanic and Atmospheric Administration, USA [26].
Agriculture 10 00264 g001
Figure 2. Correlation between the highest total potato tuber yield value (Mg ha−1) at each site and soil pH (pre-planted soil samples).* Significantly different at P < 0.05.
Agriculture 10 00264 g002
Figure 3. Relationships between soil pH and total potato yield (a) all sites at the early potato stage for 2018 and 2019 (b) all sites after harvest for years 2018 and 2019 (c) all sites (soil pH < 6) at potato harvest, (d) all sites (soil pH ≥ 6) at early potato stage. * Significantly different at P < 0.05. TPY: Total potato yield. ns: Nonsignificant.
Agriculture 10 00264 g003
Figure 4. Effect of P rates on total tuber yield at all sites combined (a), all sites combined at soil pH ≥ 6 (b), all sites at soil pH < 6 (c), specific gravity at all sites combined at soil pH ≥ 6 (d), all sites at soil pH < 6 (e), marketable tuber yield at all sites combined (f), all sites combined at soil pH ≥ 6 (g), all sites at soil pH < 6 (h), and unmarketable tuber yield at all sites combined(i), all sites combined at soil pH ≥ 6 (j), all sites at soil pH< 6 (k). Means connected by the same letter are not significantly different (Tuckey’s test P < 0.05).
Agriculture 10 00264 g004
Figure 5. Effect of P rates on tuber number per plant at all sites combined(a), all sites combined at soil pH ≥ 6 (b), all sites at soil pH< 6 (c), tuber mean weight at all sites combined(d), all sites combined at soil pH ≥ 6 (e), all sites at soil pH< 6 (f). Means connected by the same letter are not significantly different (Tuckey’s test P < 0.05).
Agriculture 10 00264 g005
Figure 6. Relationships between phosphorus concentration and unmarketable tuber yield at combined sites ≥ 6 soil pH (a), petiole dry weight for ‘Shepody’ (≥ 6 soil pH) (b), and petiole dry weight for ‘Superior’ variety (≥ 6 soil pH) (c), and the relationships between phosphorus uptake and petiole dry weight at combined sites with ≥ 6 soil pH (d), and the ‘Shepody’ variety at soil pH ≥ 6 (e), and all combined sites < 6 soil pH (f). * Significantly different at P < 0.05.
Agriculture 10 00264 g006
Table 1. Sites information.
SiteYearLatitudeLongitude† Soil TypeSlopePlanting DateHarvest DateVarieties
Frenchville (FV)201847.2170080−68.4112920Coarse-loamy, isotic, frigid Oxyaquic Haplorthods2–8%22 May12 SeptemberRB
New Sweden-1 (NS1)201846.9511590−68.1479550Fine-loamy, mixed, frigid Typic Haplorthods2–8%29 May15 OctoberRB
New Sweden-2 (NS2)201846.9529336−68.1454612Fine-loamy, mixed, frigid Aquic Haplorthods2–8%30 May15 OctoberRB
WoodLand (WL)201846.8850498−68.1256605Fine-loamy, mixed, frigid Typic Haplorthods2–8%15 May01 OctoberRB
Caribou-1 (CA1)201846.8842966−68.0292126Fine-loamy, mixed, frigid Typic Haplorthods2–8%17 May13 SeptemberRB
Aroostook Farm-1 (AF1)201846.6601582−68.0216085Fine-loamy, mixed, frigid Typic Haplorthods2–8%24 May14 SeptemberSH
Aroostook Farm-2 (AF2)201846.6619155−68.0209886Fine-loamy, mixed, frigid Typic Haplorthods2–8%24 May14 SeptemberRB
Aroostook Farm-3 (AF3)201946.66011944−68.02125Fine-loamy, mixed, frigid Typic Haplorthods2–8%31 May20 SeptemberSP
Aroostook Farm-4 (AF4)201946.46.6601694−68.01650278Fine-loamy, mixed, frigid Typic Haplorthods2–8%31 May20 SeptemberRB
Caribou -2 (CA2)201946.89628611−68.07754722Fine-loamy, mixed, frigid Typic Haplorthods2–8%14 May30 SeptemberRB
Caribou-3 (CA3)201946.89180556−68.04066667Fine-loamy, mixed, frigid Typic Haplorthods2–15%28 May30 SeptemberRB
Limestone (LM)201946.96186944−67.83323056Fine-loamy, mixed, frigid Typic Haplorthods2–8%29 May01 OctoberRB
RB: Russet Burbank, SP: Superior, SH: Shepody. † information collected from Web Soil Survey, 2019.
Table 2. Relevant soil analysis of data.
Site FVNS1NS2WLCA1AF1AF2AF3AF4CA2CA3LM
Growing Years 20182019
pH 5.94.95.65.86.56.16.46.06.15.46.35.9
Organic Matter%4.93.15.34.13.72.64.02.33.12.63.31.6
P-MMEmg nutrient kg−1 soil201210162113211117182418
P-M3379469257356421440421341423586537558
N-NO3562215641256873
N-NH4+128255115174610719
K-M3237221151256376300225234160348292230
Modified Morgan Extraction (MME); P extracted by MME (P-MME); Mehlich 3 (M3); Mehlich 3 soil test P (P-M3); K extracted by M3 (K-M3).