Abstract
Understanding the impacts of agricultural practices on carbon stocks and CO2 emission is imperative in order to recommend low emission strategies. The objective of this study was to investigate the effects of tillage, crop rotation, and residue management on soil CO2 fluxes, carbon stock, soil temperature, and moisture in the semi-arid conditions in the Eastern Cape of South Africa. The field trial was laid out as a split-split-plot design replicated three times. The main plots were tillage viz conventional tillage (CT) and no-till (NT). The sub-plots were allocated to crop rotations viz maize–fallow–maize (MFM), maize–oat–maize (MOM), and maize–vetch–maize (MVM). Crop residue management was in the sub-sub plots, viz retention (R+), removal (R−), and biochar (B). There were no significant interactions (p > 0.05) with respect to the cumulative CO2 fluxes, soil moisture, and soil temperature. Crop residue retention significantly increased the soil moisture content relative to residue removal, but was not different to biochar application. Soil tilling increased the CO2 fluxes by approximately 26.3% relative to the NT. The carbon dioxide fluxes were significantly lower in R− (2.04 µmoL m−2 s−1) relative to the R+ (2.32 µmoL m−2 s−1) and B treatments (2.36 µmoL m−2 s−1). The carbon dioxide fluxes were higher in the summer (October–February) months compared to the winter period (May–July), irrespective of treatment factors. No tillage had a significantly higher carbon stock at the 0-5 cm depth relative to CT. Amending the soils with biochar resulted in significantly lower total carbon stock relative to both R+ and R−. The results of the study show that NT can potentially reduce CO2 fluxes. In the short term, amending soils with biochar did not reduce the CO2 fluxes compared to R+, however the soil moisture increases were comparable.
1. Introduction
Twenty percent of the global atmospheric CO2 concentration is emitted from agricultural lands on approximately 37% of the earth land surface [1]. In Africa, South Africa contributes the most to greenhouse gas (GHG) emissions [2], with agriculture alone contributing 9.3% of the emissions [3]. Conventional farming practices such as residue removal and/or burning, continuous tillage with heavy use of machinery, and too much fertilizer usage are responsible for the loss of half of the soil organic carbon (SOC) and contribute about 25% of the total anthropogenic CO2 emissions [4,5]. The continued increase in the atmospheric CO2 concentration is responsible for unpredictable and extreme rainfall events and temperatures [6] and, subsequently, crop and soil productivity loss and food insecurity. Therefore, it is important to identify suitable agricultural practices that help to effectively adapt and mitigate these detrimental global environmental effects [7].
Conservation agriculture (CA) is increasingly being promoted as a climate-smart strategy that can help arrest or reverse the processes of soil degradation, promote water conservation, and mitigate climate change [8]. Implementing CA practices can potentially increase biomass production [9]. Furthermore, CA influences rainwater partitioning by increasing the water use efficiency (increased infiltration, reduced runoff, and soil evaporation) [10] and nutrient availability [11]. The mitigation potential of CA is in the conservation of soil and water, through the interaction and contribution of each of its principles to SOC [12]. Soil organic carbon is the most important factor component in maintaining soil quality [13]. Sustainable agricultural management practices found in CA can potentially sequester up-to 1 Pg C year−1 worldwide [14]. Soil C stocks results from a balance between carbon (C) inputs and outputs [13]. Conservation agriculture increases the SOC storage by increasing the residue input rates and reducing the turnover rate [15]. No-till (NT) reduces the decomposition rate of SOM and hence leads to the sequestration of soil C and soil structure improvements [16]. Conversely, conventional tillage (CT) increases the decomposition rate of SOM due to increased soil–residue contacts and higher soil temperatures [17]. Further, tilling the soil increases the aeration and exposure of aggregate-associated SOM to microbial attack, which results in the increased oxidation of soil C to CO2 [18,19]. Even though evidence suggests that CA can potentially lead to improvements in soil C; the extent of the improvement still varies widely and warrants further evaluation [19]. Giller et al. [20] reported the existence of the uncertainties of CA systems in increasing soil C stocks. Additionally, inconsistent results were reported about the effect of CA on GHG. For example, various studies have reported that NT reduced [21,22], increased [23], or did not affect [24] the CO2 emission from the soil, compared to CT. Furthermore, GHG emissions are influenced by climate and soil type, therefore it is important to evaluate the effects of CA on CO2 fluxes in South Africa for informed eco-specific recommendations. The quantification of C inputs and outputs and the SOC contents are crucial for understanding and tracking SOC changes [13].
The Eastern Cape Province is formerly the homelands, Ciskei, and Transkei and occupies about 13.9% of South Africa (SA) [25,26]. Most soils in the province are young, medium-textured, and have a low SOM content (<10 g C kg−1) [27], which exposes them to land degradation and productivity loss. The majority of farmers in the Eastern Cape Province are smallholder farmers which are in crop–livestock farming systems [28,29]. Studies on CA conducted in the province show its potential in increasing biomass output [9,30,31,32]; however, very rapid crop residue mineralization severely limits the agricultural management options to raise soil C contents, which are a requisite to increase crop and soil productivity [33]. Additionally, due to the crop residue management trade-offs in mixed crop–livestock farming systems, few residues are left in the field to significantly cover the soil. When farmers decide to retain residues in the field, free-roaming livestock feed on it [9]. In that regard, it is essential to explore other crop residue management strategies that can potentially boost climate-smart agriculture in the central Eastern Cape Province, South Africa.
Amending soils with biochar is an alternative mechanism for C fixation [9,34], improving the soil structure and bulk density and hence the soil water-holding capacity [35,36]. Biochar is a carbon stable compound derived from the thermal conversion of biomass feed-stocks in the absence of oxygen or with limited oxygen supply [35]. Biochar can potentially be used to offset the adverse effects of surface residue retention, which have been attributed to nitrogen immobilization, waterlogging, high degradation rates, and hence increased CO2 emission and reduced soil temperature, as has been reported in some environments [37]. However, CO2 emission from biochar-amended soils depends on the biochar feedstock and the texture of the soils amended [33].
Most studies on CO2 fluxes have focused mainly on the influence of tillage systems, overlooking crop rotations and crop residue management [19,38,39,40]. Furthermore, most reports are from incubation studies under controlled conditions [41]. Carbon dioxide flux measurements are not easily generalized because of the site-specific context, management, soil type, and climate [42]. Soil carbon stock and soil CO2 flux are generally the major components of the carbon budget and carbon cycle in the different terrestrial ecosystems of the world. Therefore, any detailed information on soil carbon stock and soil CO2 flux and its controlling factors will also provide critical information for understanding the response of soils to changing land use and global climate change. The objective of this study was to investigate the effects of tillage, crop rotation, and residue management, including biochar, on soil CO2 fluxes, carbon stock, soil temperature, and moisture in the semi-arid conditions of the Eastern Cape Province.
2. Materials and Methods
2.1. Site Selection
The study was conducted at the University of Fort Hare research farm (latitude 32°46′ S and longitude 26°50′ E) which is in a warm temperate climate. The site receives an average annual rainfall of 575 mm and a mean annual temperature of 18.1 °C. According to the International Union of Soil Sciences working group [43], the soils are classified as Haplic Cambisol.
2.2. Daily Rainfall and Air Temperature
The daily air temperature and rainfall data were collected using an automatic weather station (Weather Link, Davis Instruments Corp, California, USA) located at the University of Fort Hare research farm. The daily average air temperature and daily total rainfall for the duration of the study are presented in Figure 1 and Figure 2, respectively. The highest daily mean air temperature was in the summer season in January (29.8 °C), and the lowest was observed in the winter season (6.5 °C) in July. Rainfall was received throughout the year, but it fluctuated. The highest daily average rainfall was recorded in March (45.4 mm).
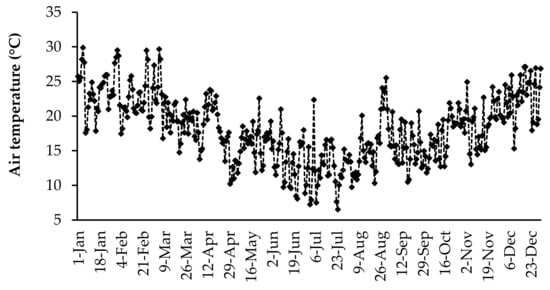
Figure 1.
Daily mean temperature for 2017 at the University of Fort Hare research farm.
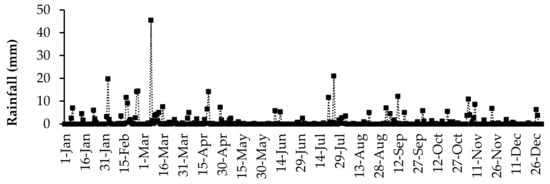
Figure 2.
Daily rainfall received in 2017 at the University of Fort Hare research farm for the duration of the experiment.
2.3. Treatments and Experimental Design
The experiment was initiated in the 2015 winter season and continued for six seasons until the 2018/2019 summer season, when it was terminated. It investigated three factors—tillage, crop rotation, and residue management in factorial combination—and was laid out as a split–split plot design, replicated three times. Tillage with two levels (no-tillage (NT) and conventional tillage (CT)) were allocated to the main plots. The subplots were allocated to rotations that were at three levels (maize–fallow–maize (MFM), maize–vetch–maize (MVM), and maize–oat–maize (MOM)). Sub-subplots were allocated to the residue management strategies at three levels (residue removal (R−)9, crop residue retention (R+), and biochar (B)). The main plots measured 17.75 × 15 m2, the subplots were 5.25 × 15 m2, and the sub-subplots were 5.25 × 5 m2. The total area of the trial was 36.5 × 55 m2. The gross plot measured 5.25 × 5 m2, and the net plot was 2.25 × 4 m2. The CT plots were ploughed to a depth of 30 cm once at the beginning of each season—April for winter planting and October for summer planting—using a tractor-drawn disk plough, and then harrowed to make a fine tilth. Crop residue management treatments were conducted at the end of each season—i.e., residues were retained, removed, or converted into biochar. In plots with the biochar treatment, all the crop residues obtained in both the summer and winter seasons were pyrolyzed, as described by Nyambo et al. [36]. After cooling, the biochar was crushed and passed through a 2 mm sieve before being applied to the respective plots.
2.4. Management of Non-Experimental Variables
Oat (Avena sativa cv. Sederbrg) and grazing vetch (Vicia dasycarpa cv. Max) cover crops were planted in the winter season at the recommended seed rates of 90 and 35 kg ha-l, respectively. Planting in both the NT and CT plots was done by making small furrows opened using hoes. For both crops, a compound fertilizer (6.7% N; 10% P; 13.3% K) was applied at planting as a basal fertilizer at 10 kg P ha−1. Grazing vetch was inoculated using the Rhizobium leguminosarium biovar viciae at planting. The cover crops were terminated just before flowering using Glyphosate (N-[phosphono-methyl] glycine, 360 g L−1), applied at 5 L ha−1. When the crops dried, the crop residues were retained, removed, or converted into biochar.
During the summer period, a yellow open pollinated maize variety (Okavango) popular with smallholder farmers in the central Eastern Cape was planted. The maize rows were spaced at a distance of 0.75 m and 0.33 m to give a planting density of 44,444 plants ha−1. The maize rows were made by making small furrows opened using hoes. Fertilizer was applied in all the plots at a rate of 90 kg N ha−1, 45 kg P ha−1, and 60 kg K ha−1. A compound fertilizer (6.7 % N; 10 % P; 13.3 % K, +0.5 % Zn) was used to supply a third of the N and all the P and K needed by the maize crop [9]. The remaining nitrogen was side dressed at six weeks after planting as Lime ammonium nitrate (LAN). Pests were controlled in the maize and oat crops using Cylam 50EC (Lambda-cyhalothrin (pyrethroid), 50 g L−1).
2.5. Soil Sampling and Analysis
Soils samples were obtained from 0–5 cm and 5–10 cm depths. Visible organic material was removed before taking three random samples per plot. These samples were used to measure the SOC and total organic carbon.
2.6. Carbon Stocks
Soil C stocks (Mg C ha−1) were determined for the 0–5 cm and 5–10 cm soil depths using the following equation [44]:
where BD = bulk density, and C (%) is the percentage of carbon. Carbon stocks from the two depths were added for each treatment to determine the total carbon stock in the 0–10 cm soil depth. Bulk density was determined at the end each season using the core method outlined in Okalebo et al. [45], while the modified Walkley–Black method was used to determine the SOC following AgriLASA (2004) [46].
2.7. Carbon Dioxide Fluxes, Soil Temperature and Moisture
Carbon dioxide measurements were taken in the field on the 10th of each month in every plot in the year in 2017. The 8100A, an automated soil CO2 flux system from LI-COR, was used to take measurements (LI-COR, Lincoln, Nebraska, USA). The LI-8100A is a fully automated chamber system including a multiplexer, analyzer Control Unit equipped with the infrared gas analyzer (IRGA) to measure the change in CO2, and H2O vapor concentration and flux calculation software. The Li-COR uses the rate of CO2 increase in the flow through system with the chamber and connecting housing to measure the flux of CO2 from the soil surface into the atmosphere. The CO2 flux (µmoL m−2·s−1) and soil temperature (°C) data collected by the LI-COR 8100A were stored in the instrument’s flash memory and transferred to a computer. Each of the 16 chambers allowed for the connection of probes for soil temperature determination to a maximum 5 cm depth. Chamber anchors were installed to more than 10 cm into the ground and extended no more than 5 cm above the surface. The chambers were permanently installed in the field.
The soil water content from a 20 cm depth was measured using a Hydro Sense II moisture probe (Campbell Scientific, Inc. Logan, Utah, UT 84321-1784, USA), with a total of three measurements across each plot at each time of sampling. Carbon dioxide flux, soil moisture, and temperature measurements were taken between 9 am and 12 noon to minimize the diurnal variation in gas measurement and to reflect the mean daily temperature [47].
2.8. Statistical Analysis
An analysis of variance (ANOVA) was performed on all the variables and statistical calculations were performed using the JMP statistical package version 14 (SAS Institute Inc., Cary, NC, USA). Mean CO2 fluxes, soil temperature, and soil moisture were calculated by dividing the cumulative value of the parameters (collected over the experimental period) by the number of sampling times. Means were separated using the least significance difference (LSD) at the 5 % probability level.
3. Results
3.1. Soil Temperature and Moisture Content
No significant tillage × crop rotation × crop residue management effects (p > 0.05) were observed with respect to the soil temperature and moisture content. Two-way interactions of tillage x crop rotation, tillage x crop residue management, and crop rotation x crop residue management did not affect either the soil temperature and moisture content. The main effect of residue management (p < 0.05) had a significant effect only on the soil moisture content. The soil moisture content was 8.2% and 4.2% higher in R+ and B, respectively, compared to the R− treatments (Figure 3).
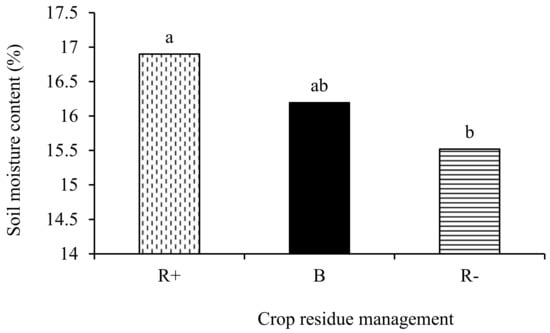
Figure 3.
Effect of retention (R+), biochar (B), and crop residue removal (R−) on the soil moisture content. Different letters indicate significant differences amongst the treatments.
3.2. Carbon Dioxide Fluxes
The three-way interaction of tillage × crop rotation × crop residue management did not influence (p > 0.05) the mean CO2 fluxes. Similarly, all the two-way interactions were not significant (p > 0.05) for the mean CO2 fluxes in the same period. Tillage (p < 0.001) and crop residue management (p < 0.01) significantly influenced the mean CO2 fluxes. The average CO2 fluxes were 26.3% higher in CT relative to NT in 2017 (Figure 4a). The biochar (2.36 µmoL m−2 s−1) and R+ (2.32 µmoL m−2 s−1) treatments had significantly higher CO2 fluxes compared to the R− (2.04 µmoL m−2 s−1) treatments (Figure 4b).
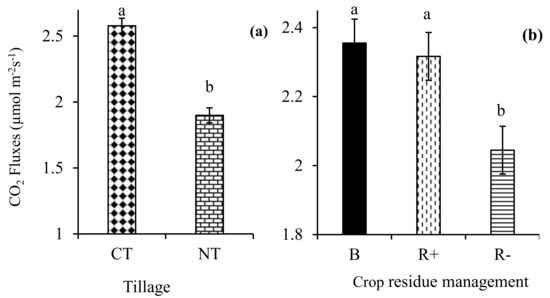
Figure 4.
Effects of (a) no-till (NT) and conventional tillage (CT); and (b) retention (R+), biochar (B), and crop residue removal (R−) on the CO2 fluxes.
Generally, the CO2 fluxes were higher in the summer (October–February) compared to the winter months (May–July), irrespective of the treatment factors (Figure 5). The carbon dioxide fluxes were significantly higher in CT relative to NT in the month of October (Figure 5a). In contrast, significantly higher fluxes were observed under NT in June and January. In February, the MFM treatments had 30% and 23% higher CO2 fluxes relative to the MOM and MVM treatments, respectively, (Figure 5b), while in November the CO2 fluxes recorded in the MFM were 35% and 31% lower relative to the MOM and MVM treatments. The crop residue removals (3.13 µmoL m−2 s−1) resulted in significantly higher CO2 fluxes relative to both the B (2.57 µmoL m−2 s−1) and R+ (2.62 µmoL m−2 s−1) treatments in January (Figure 5c). In June, R+ (2.58 µmoL m−2 s−1) had significantly higher CO2 fluxes compared to both the B (1.78 µmoL m−2 s−1) and R− (1.93 µmoL m−2 s−1) treatments (Figure 5c). Significantly low CO2 flux emissions were recorded during the winter season compared to the summer period (Figure 5d).
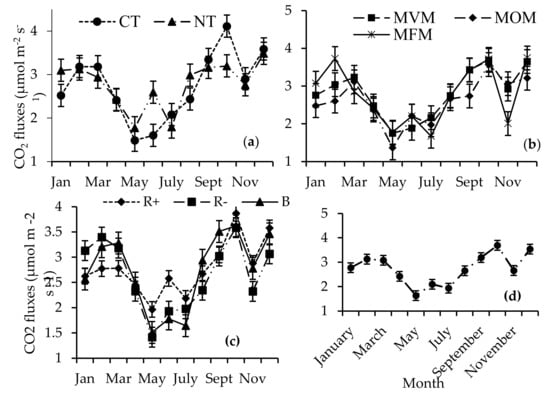
Figure 5.
Interaction of time by (a) tillage (no-till (NT) and conventional tillage (CT)) (b) crop rotation (maize–fallow–maize (MFM), maize–oat–maize (MOM), and maize–vetch–maize (MVM)) and (c) crop residue management (retention (R+), biochar (B), and crop residue removal (R−)) on the CO2 fluxes, (d) effect of time on CO2 fluxes.
3.3. Carbon Stocks
The fouR−way interaction of depth × tillage × crop rotation × residue management was not significant (p > 0.05) with respect to the carbon stock. Similarly, the three-way interactions were not observed with respect to the carbon stock. Only the two-way interaction of depth x tillage significantly (p < 0.001) influenced the carbon stock. The main effect of depth (p < 0.001), tillage (p < 0.001), and residue management (p < 0.05) had a significant effect on (p < 0.001) the carbon stock. No tillage had a significantly higher carbon stock at the 0-5 cm depth relative to CT (Figure 6a). Retaining crop residues significantly increased the carbon stock compared to both B and R− (Figure 6b). Amending the soils with biochar resulted in a significantly lower total carbon stock in the 0–10 cm depth relative to both R+ and R− (Figure 7a). The total carbon stocks were 23 % higher under NT compared to CT (Figure 7b).
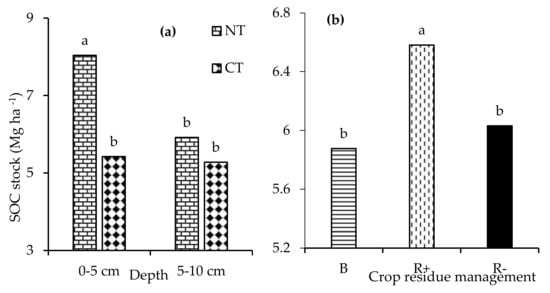
Figure 6.
The (a) interaction of depth x tillage (no-till (NT) and conventional tillage (CT)) and (b) the effects of retention (R+), biochar (B), and crop residue removal (R−) on the carbon stock. Different letters indicate significant differences amongst the treatments.
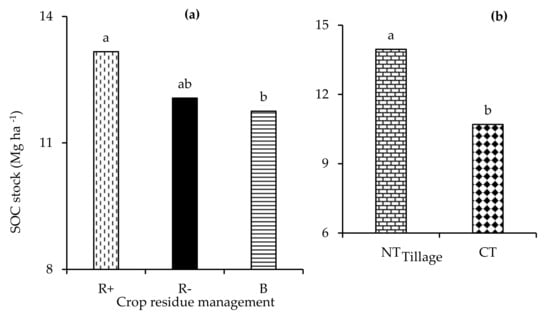
Figure 7.
The effect of (a) retention (R+), biochar (B), and crop residue removal (R−) and (b) no-till (NT) and conventional tillage (CT) on the total SOC stock. Different letters indicate significant differences amongst the treatments.
4. Discussion
4.1. Soil Temperature and Moisture Content
The significantly high moisture content in the R+ treatment can be attributed to the mulching effect of the crop residues. The retained crop residues act as mulch, which absorbs the power of raindrops, allows water to infiltrate, and reduces evaporation by stopping the direct impact of the sunlight on soil [48]. Biochar, on the other hand, can retain soil moisture by increasing the soil porosity and hydraulic conductivity [49]. Biochar’s high specific surface area and its internal porosity are also responsible for increasing the water holding capacity, hence the improved soil moisture content [36].
4.2. Carbon Dioxide Fluxes
The higher CO2 fluxes in CT were possibly due to the increased decomposition of crop residues and aggregate protected OM when the soil was turned during tillage operations. Tillage stimulates soil microbial activity due to increased soil aeration [50]. According to Mangalassery et al. [51], tilling the soil affects the soil properties. which in turn influence the emission of GHGs. The same authors further state that NT reduces the soil porosity by up to 33%, while CT increases the porosity, which favors the respiration of aerobic organisms by improving water and air movement through the soil. The results of this study agree with those of Dendooven et al. [52] and Angers et al. [50], who reported significantly high CO2 fluxes under CT compared to NT. The range of CO2 fluxes (1.4 to 4.1 µmoL m−2 s−1) falls within reported ranges under similar semi-arid and/or sub-humid temperate climates [53].
Higher CO2 fluxes under R+ relative to R− treatments can be attributed to the availability of easily decomposable organic matter under R+, which tends to stimulate microbial activity and CO2 production [54]. Several authors have reported that crop residues stimulated and increased CO2 emissions [55,56]. Even though fluxes were higher under R+ relative to R−, they did not result in a net loss in soil C sequestration. This is shown by the significantly higher SOC stock in R+ compared to both the B and R− treatments (Figure 6b and Figure 7a). In this study, the increased CO2 emission in plots with biochar can be possibly due to the increase in the decomposition of SOM fractions. Biochar addition to the soil causes fluctuations in the SOC, microbial activity, and dissolved organic C, which can impact the mineralization of soil C [36,57,58]. The results agree with Sagrilo et al. [59] and Cross and Sohi [60], who reported that short-term surges in CO2 emissions are common after biochar amendment, despite its inherently low biodegradability. Furthermore, the decomposition of the labile fractions of the biochar could possibly be the reason for the initial increase in the CO2 fluxes. In a study on a silty sand soil formed from river sand deposits, Haider et al. [61] reported an initial increase in CO2 fluxes under biochar treatments. The authors attributed it to the responses of biochar to labile organic carbon fractions from volatiles adsorbed on biochar surfaces during a condensation period after pyrolysis. In contrast, in a long-term field study on silty loam soils in the semi-arid conditions in China, Shen et al. [62] reported that the cumulative CO2 emissions decreased substantially after the field application of biochar because it suppressed soil respiration during the maize growing season, while in the short-term incubation study the biochar addition had no effect on CO2 emissions without additional nitrogen amendment. The significantly higher fluxes in the B and R+ treatments relative to R− could be as a result of the high soil moisture content in the B and R+ treatment.
The lower fluxes in the winter season are possibly due to the low temperatures in winter. Temperature directly increases metabolic rates and biochemical processes [63], and thus it increases soil respiration and CO2 emission [64]. According to Almagro et al. [64], a reduction in both heterotrophic and autotrophic respiration due to low winter temperatures causes low CO2 emission. Additionally, several studies have come up with the similar conclusion that soil temperature is a major variable affecting soil CO2 emissions, while soil moisture has little to no effect [65,66]. According to Dilekoglu and Sakin [67], CO2 emission is positively correlated to soil temperature; the same authors reported that 0.091 g C is emitted for each 1 °C increase in soil temperature.
4.3. Carbon Stocks
The results of this study show that switching from CT to CA in the Eastern Cape Province changes the vertical distribution of SOC in the soil profile, resulting in a decrease in the SOC with depth. Less or minimum soil disturbances under NT reduces SOC decomposition, leading to SOC storage in the top soil layer in this study (Figure 6a). Tilling the soil increases the aeration and exposure of the SOM to microbial attack, which results in reduced C storage in the lower soil depth [19]. Similar observations under the same soil and conditions were reported by Dube et al. [30]. In their study, the authors reported increases in the total SOM from about 10 g kg−1 to above 20 g kg−1 after four years of CA. In a study in a subtropical monsoonal humid climate in China, Xu et al. [68] also reported higher carbon stocks in NT relative to CT. The continued input of biomass to the soil surface in the current study can be attributed to the increased SOC stock under R+ treatments. According to Nyambo et al. [9], the presence of crop residues on the soil surface increases the SOC, which also controls erosion, water infiltration, and conservation of nutrients, and is related with the soil quality.
In this study, the low SOC stocks under B treatments relative to R+ can be attributed to the quantities applied. The total quantity of biochar applied at the current stage of the study range from 9.4 to 16.7 Mg ha−1 under NT+MFM and NT+MOM treatments respectively [9]. Biochar application rates that are less than 20 t ha−1 do not results in any significant soil improvements [69]. The low biochar quantities applied in this study and, as previously discussed, the decomposition of the labile C fractions of biochar quickly could also explain the low SOC stocks under B treatments. However, it is important to note that the remaining C is more stable compared to the stocks in R+ and R− treatments and will persist in the soil much longer. Furthermore, the low SOC content in B treatments can possibly be explained by the lateral and vertical migration of biochar along the soil profile [70]. The increase in the SOC storage under NT and R+ in the study is a key indicator of increased sustainability of the system.
5. Conclusions
This study provided insights into the impact of CA on CO2 fluxes from semiarid climatic conditions in South Africa. Biochar application resulted in a high soil moisture content comparable to R+ treatments. The fluxes were significantly higher in CT compared to NT. Additionally, the biochar and R+ treatments had significantly higher CO2 fluxes compared to the R− treatments. The results of this study show that switching from CT to CA in the Eastern Cape Province changes the vertical distribution of SOC in the soil profile. This paper therefore contributes to the evidence that, in the short term, R+ and B increase CO2 fluxes while improving the soil moisture content. Further studies that focus on CO2 measurements after every rainfall and tillage events are needed in order to recommend full-scale successive CA application. Long-term studies are also required for better recommendations.
Author Contributions
P.N. designed, set up, collected data, analyzed data, and wrote the manuscript. C.C. designed, set up, collected data, analyzed data, and wrote the manuscript. T.A. designed, set up, collected data, analyzed data, and wrote the manuscript. All authors have read and agreed to the published version of the manuscript.
Funding
This research was funded by National Research Foundation (NRF) of South grant number [CSUR14080586821] and the APC was funded by the Govan Mbeki Research and Development Centre (GMRDC), University of Fort Hare.
Conflicts of Interest
The authors declare no conflict of interest.
References
- Li, X.; Liu, L.; Yang, H.; Li, Y. Relationships between carbon fluxes and environmental factors in a drip-irrigated, film-mulched cotton field in arid region. PLoS ONE 2018, 13. [Google Scholar] [CrossRef] [PubMed]
- Stats, S.A. Millennium Development Goals Country Report; Statistics SA: Pretoria, South Africa, 2013. [Google Scholar]
- Greenhouse Gas Inventory South Africa, 2009 Greenhouse Gas Inventory South Africa; National Inventory Report 1990–2000; Department of Environmental Affairs and Tourism: Pretoria, South Africa, 2009.
- Christian, T.; Wall, P.C. Effects of conservation agriculture techniques on infiltration and soil water content in Zambia and Zimbabwe. Soil Tillage Res. 2009, 105, 217–227. [Google Scholar]
- The Intergovernmental Panel on Climate Change (IPCC). Summary for Policymakers. Climate Change 2014 Impacts, Adaptation, and Vulnerability. Part A: Global and Sectoral Aspects; Working Group II Contribution to the Fifth Assessment Report of the Intergovernmental Panel on Climate Change; Cambridge University Press: Cambridge, UK; New York, NY, USA, 2014. [Google Scholar]
- Dyer, L.A.; Richards, L.A.; Short, S.A.; Dodson, C.D. Effects of CO2 and temperature on tritrophic interactions. PLoS ONE 2013, 8, e62528. [Google Scholar] [CrossRef] [PubMed]
- Hernandez-Ramirez, G.; Hatfield, J.L.; Parkin, T.B.; Sauer, T.J.; Prueger, J.H. Carbon dioxide fluxes in corn–soybean rotation in the Midwestern U.S.: Inter- and intra-annual variations, and biophysical controls. Publications from USDA-ARS/UNL Faculty. Agric. For. Meteorol. 2011. [Google Scholar] [CrossRef]
- Cheesman, S.; Thierfelder, C.; Eash, N.S.; Kassie, G.T.; Frossard, E. Soil carbon stocks in conservation agriculture systems of Southern Africa. Soil Tillage Res. 2016, 156, 99–109. [Google Scholar] [CrossRef]
- Nyambo, P.; Chiduza, C.; Araya, T. Carbon input and maize productivity as influenced by tillage, crop rotation, residue management and biochar in a semiarid region in South Africa. Agronomy 2020, 10, 705. [Google Scholar] [CrossRef]
- Rockström, J. On-Farm Agrohydrological Analysis of the Sahelian Yield Crisis: Rainfall Partitioning, Soil Nutrients and Water Use Efficiency of Pearl Millet. Ph.D. Thesis, Stockholms Universitet, Stockholm, Sweden, 1997. [Google Scholar]
- Hobbs, P.R.; Sayre, K.; Gupta, R. The role of conservation agriculture in sustainable agriculture. Philos. Trans. R. Soc. B Biol. Sci. 2008, 363, 543–555. [Google Scholar] [CrossRef]
- Delgado, A.J.; Groffman, P.M.; Nearing, M.A.; Goddard, T.; Reicosky, D.; Lal, R.; Kitchen, N.R.; Rice, C.W.; Towery, D.; Salon, P. Conservation practices to mitigate and adapt to climate change. J. Soil Water Conserv. 2011, 66, 118A–129A. [Google Scholar] [CrossRef]
- Morell, F.J.; Cantero-Martínez, C.; Lampurlanés, J.; Plaza-Bonilla, D.; Álvaro-Fuentes, J. Soil carbon dioxide flux and organic carbon content: Effects of tillage and nitrogen fertilization. Soil Sci. Soc. Am. J. 2011, 75, 1874–1884. [Google Scholar] [CrossRef]
- Lal, R.; Bruce, J.P. The potential of world cropland soils to sequester C and mitigate the greenhouse effect. Environ. Sci. Policy 1999, 2, 177–185. [Google Scholar] [CrossRef]
- Stockle, C.; Higgins, S.; Kemanian, A.; Nelson, R.; Huggins, D.; Marcos, J.; Collins, H. Carbon storage and nitrous oxide emissions of cropping systems in Eastern Washington: A simulation study. J. Soil Water Conserv. 2012, 67, 365–377. [Google Scholar] [CrossRef]
- Zuber, S.M.; Behnke, G.D.; Nafziger, E.D.; Villamil, M.B. Carbon and nitrogen content of soil organic matter and microbial biomass under long-term crop rotation and tillage in Illinois, USA. Agriculture 2018, 8, 37. [Google Scholar] [CrossRef]
- Campbell, B.; Chen, L.; Dygert, C.; Dick, W. Tillage and crop rotation impacts on greenhouse gas fluxes from soil at two long-term agronomic experimental sites in Ohio. J. Soil Water Conserv. 2014, 69, 543–552. [Google Scholar] [CrossRef]
- Cambardella, C.A.; Elliott, E.T. Particulate soil organic-matter changes across a grassland cultivation sequence. Soil Sci. Soc. Am. J. 1992, 56, 777–783. [Google Scholar] [CrossRef]
- Curtin, D.; Wang, H.; Selles, F.; McConkey, B.G.; Campbell, C.A. Tillage effects on carbon fluxes in continuous wheat and fallow–wheat rotations. Soil Sci. Soc. Am. J. 2000, 64, 2080–2086. [Google Scholar] [CrossRef]
- Giller, K.E.; Witter, E.; Corbeels, M.; Tittonell, P. Conservation agriculture and smallholder farming in Africa: The heretics’ view. Field Crops Res. 2009, 114, 23–34. [Google Scholar] [CrossRef]
- Abdalla, K.; Chivenge, P.; Ciais, P.; Chaplot, V. No-tillage lessens soil CO2 emissions the most under arid and sandy soil conditions: Results from a meta-analysis. Biogeosciences 2016, 13, 3619–3633. [Google Scholar] [CrossRef]
- Behnke, G.D.; Zuber, S.M.; Pittelkow, C.M.; Nafziger, E.D.; Villamil, M.B. Long-term crop rotation and tillage effects on soil greenhouse gas emissions and crop production in Illinois, USA. Agric. Ecosyst. Environ. 2018, 261, 62–70. [Google Scholar] [CrossRef]
- Oorts, K.; Merckx, R.; Gréhan, E.; Labreuche, J.; Nicolardot, B. Determinants of annual fluxes of CO2 and N2O in long-term no-tillage and conventional tillage systems in Northern France. Soil Tillage Res. 2007, 95, 133–148. [Google Scholar] [CrossRef]
- Abdalla, M.; Hastings, A.; Helmy, M.; Prescher, A.; Osborne, B.; Lanigan, G.; Forristal, D.; Killi, D.; Maratha, P.; Williams, M.; et al. Assessing the combined use of reduced tillage and cover crops for mitigating greenhouse gas emissions from arable ecosystem. Geoderma 2014, 223, 9–20. [Google Scholar] [CrossRef]
- Hamann, M.; Tuinder, V. Introducing the Eastern Cape: A Quick Guide to Its History, Diversity and Future Challenges; Stockholm Resilience Centre, Stockholm University: Stockholm, Sweden, 2012. [Google Scholar]
- STATS SA. Mid-Year Population Estimates; Document No P0302; Statistics South Africa: Pretoria, South Africa, 2015. [Google Scholar]
- Mandiringana, O.T.; Mnkeni, P.N.S.; Mkile, Z.; van Averbeke, W.; van Ranst, E.; Verplancke, H. Mineralogy and fertility status of selected soils of the Eastern Cape Province, South Africa. Commun. Soil Sci. Plant Anal. 2005, 36, 2431–2446. [Google Scholar] [CrossRef]
- Nyambo, P.; Wakindiki, I.I.C. Water footprint of growing vegetables in selected smallholder irrigation schemes in South Africa. Water SA 2015, 41, 571–578. [Google Scholar] [CrossRef]
- Muzangwa, L.; Mnkeni, P.N.; Chiduza, C. Assessment of conservation agriculture practices by smallholder farmers in the Eastern Cape Province of South Africa. Agronomy 2017, 7, 46. [Google Scholar] [CrossRef]
- Dube, E.; Chiduza, C.; Muchaonyerwa, P. Conservation agriculture effects on soil organic matter on a haplic cambisol after four years of maize–oat and maize–grazing vetch rotations in South Africa. Soil Tillage Res. 2012, 123, 21–28. [Google Scholar] [CrossRef]
- Muzangwa, L.; Chiduza, C.; Muchaonyerwa, P. Biomass production, weed suppression, nitrogen and phosphorus uptake in white oat (Avena sativa L.) and grazing vetch (Vicia dasycarpa L.) cover crop bicultures under an irrigated no-tillage system. South Afr. J. Plant Soil 2012, 29, 135–141. [Google Scholar] [CrossRef]
- Chiduza, C.; Dube, E. Maize Production Challenges in High Biomass Input Smallholder Farmer Conservation Agriculture Systems: A Practical Research Experience from South Africa. Afr. Crop Sci. Conf. Proc. 2013, 11, 23–27. [Google Scholar]
- Novak, M.J.; Busscher, W.J.; Watts, D.W.; Laird, D.A.; Ahmedna, M.A.; Niandou, M.A.S. Short-term CO2 mineralization after additions of biochar and switchgrass to a typic kandiudult. Geoderma 2010, 154, 281–288. [Google Scholar] [CrossRef]
- Mukherjee, A.; Lal, R.; Zimmerman, A.R. Effects of biochar and other amendments on the physical properties and greenhouse gas emissions of an artificially degraded soil. Sci. Total Environ. 2014, 487, 26–36. [Google Scholar] [CrossRef]
- Lehmann, J.; Gaunt, J.; Rondon, M. Bio-char sequestration in terrestrial ecosystems—A review. Mitig. Adapt. Strateg. Glob. Chang. 2006, 11, 403–427. [Google Scholar] [CrossRef]
- Nyambo, P.; Taeni, T.; Chiduza, C.; Araya, T. Effects of maize residue biochar amendments on soil properties and soil loss on acidic hutton soil. Agronomy 2018, 8, 256. [Google Scholar] [CrossRef]
- Turmel, M.-S.; Speratti, A.; Baudron, F.; Verhulst, N.; Govaerts, B. Crop residue management and soil health: A systems analysis. Agric. Syst. 2015, 134, 6–16. [Google Scholar] [CrossRef]
- Almaraz, J.J.; Zhou, X.; Mabood, F.; Madramootoo, C.; Rochette, P.; Ma, B.; Smith, D.L. Greenhouse gas fluxes associated with soybean production under two tillage systems in Southwestern Quebec. Soil Tillage Res. 2009, 104, 134–139. [Google Scholar] [CrossRef]
- Tongwane, M.; Mdlambuzi, T.; Moeletsi, M.; Tsubo, M.; Mliswa, V.; Grootboom, L. Greenhouse gas emissions from different crop production and management practices in South Africa. Environ. Dev. 2016, 19, 23–35. [Google Scholar] [CrossRef]
- Dutta, J.; Gokhale, S. Field investigation of Carbon Dioxide (CO2) fluxes and organic carbon from a conserved paddy field of North–East India. Int. Soil Water Conserv. Res. 2017, 5, 325–334. [Google Scholar] [CrossRef]
- Cochran, R.L.; Collins, H.P.; Kennedy, A.; Bezdicek, D.F. Soil Carbon Pools and Fluxes Following Land Conversion to Irrigated Agriculture in a Semi-Arid Shrub-Steppe Ecosystem; CSANR Research Report 2010-001; Climate Friendly Farming, CSANR, Washington State University: Washington, DC, USA.
- Alikhani, H.A.; Karbin, S.; Zadeh, B.M. Conservation agriculture effects on soil greenhouse gas fluxes: An overview. Preprints 2018. [Google Scholar] [CrossRef]
- IUSS Working Group; WRB. World Reference Base for Soil Resources; World Soil Resources Report 103; IUSS Working Group, FAO: Rome, Italy, 2006. [Google Scholar]
- Haile, G.; Lemenhi, M.; Itanna, F.; Senbeta, F. Impacts of land uses changes on soil fertility, carbon and nitrogen stock under smallholder farmers in central highlands of ethiopia: Implication for sustainable agricultural landscape management around Butajira area. N. Y. Sci. J. 2014, 7, 27–44. [Google Scholar]
- Okalebo, J.R.; Gathua, K.W.; Woomer, P.L. (Eds.) Laboratory Methods of Soil and Plant Analysis: A Working Manual, 2nd ed.; Sacred Africa: Nairobi, Kenya, 2002; Volume 21. [Google Scholar]
- Agri Laboratory Association of Southern Africa (AgriLASA). Soil Handbook; Agri Laboratory Association of Southern Africa: Pretoria, South Africa, 2004. [Google Scholar]
- Parkin, T.B.; Venterea, R.T. Chamber-based trace gas flux measurements [Chapter 3]. In Sampling Protocols; Follett, R.F., Ed.; US Department of Agriculture, Agricultural Research Service: Washington, DC, USA, 2010; pp. 3-1–3-39. [Google Scholar]
- Baker, C.J.; Saxton, K.E.; Ritchie, W.R.; Chamen WC, T.; Reicosky, D.C.; Ribeiro MF, S.; Justice, S.E.; Hobbs, P.R. 2006 No-Tillage Seeding in Conservation Agriculture, 2nd ed.; CAB International; FAO: Oxford, UK, 2007. [Google Scholar]
- Jien, S.; Wang, C. Effects of biochar on soil properties and erosion potential in a highly weathered soil. Catena 2013, 110, 225–233. [Google Scholar] [CrossRef]
- Angers, D.A.; Bissonnette, N.; Legere, A.; Samson, N. Microbial and biochemical changes induced by rotation and tillage in a soil under barley production. Can. J. Soil Sci. 1993, 73, 39–50. [Google Scholar] [CrossRef]
- Mangalassery, S.; Sjögersten, S.; Sparkes, D.L.; Sturrock, C.J.; Craigon, J.; Mooney, S.J. To what extent can zero tillage lead to a reduction in greenhouse gas emissions from temperate soils? Sci. Rep. 2014, 4, 1–8. [Google Scholar] [CrossRef]
- Dendooven, L.; Patiño-Zúñiga, L.; Verhulst, N.; Luna-Guido, M.; Marsch, R.; Govaerts, B. Global warming potential of agricultural systems with contrasting tillage and residue management in the central highlands of Mexico. Agric. Ecosyst. Environ. 2012, 152, 50–58. [Google Scholar] [CrossRef]
- Wang, W.; Peng, S.; Wang, T.; Fang, J. Winter soil CO2 efflux and its contribution to annual soil respiration in different ecosystems of a forest-steppe ecotone, North China. Soil Biol. Biochem. 2010, 42, 451–458. [Google Scholar] [CrossRef]
- Dyer, L.; Oelbermann, M.; Echarte, L. Soil carbon dioxide and nitrous oxide emissions during the growing season from temperate maize soybean intercrops. J. Plant Nutr. Soil Sci. 2012, 175, 394–400. [Google Scholar] [CrossRef]
- Lian, T.; Wang, G.; Yu, Z.; Li, Y.; Liu, X.; Jin, J. Carbon input from 13 C-Labelled soybean residues in particulate organic carbon fractions in a mollisol. Biol. Fertil. Soils 2016, 52, 331–339. [Google Scholar] [CrossRef]
- Badagliacca, G.; Ruisi, P.; Rees, R.M.; Saia, S. An assessment of factors controlling N2O and CO2 emissions from crop residues using different measurement approaches. Biol. Fertil. Soils 2017, 53, 547–561. [Google Scholar] [CrossRef] [PubMed]
- Fernández, J.M.; Nieto, M.A.; López-de-Sá, E.G.; Gascó, G.; Méndez, A.; Plaza, C. Carbon dioxide emissions from semi-arid soils amended with biochar alone or combined with mineral and organic fertilizers. Sci. Total Environ. 2014, 482, 1–7. [Google Scholar] [CrossRef]
- Stavi, I.; Lal, R. Agroforestry and biochar to offset climate change: A review. Agron. Sustain. Dev. 2013, 33, 81–96. [Google Scholar] [CrossRef]
- Sagrilo, E.; Jeffery, S.; Hoffland, E.; Kuyper, T.W. Emission of CO2 from biochar-amended soils and implications for soil organic carbon. GCB Bioenergy 2015, 7, 1294–1304. [Google Scholar] [CrossRef]
- Cross, A.; Sohi, S.P. The priming potential of biochar products in relation to labile carbon contents and soil organic matter status. Soil Biol. Biochem. 2011, 43, 2127–2134. [Google Scholar] [CrossRef]
- Haider, G.; Steffens, D.; Moser, G.; Müller, C.; Kammann, C.I. Biochar reduced nitrate leaching and improved soil moisture content without yield improvements in a four-year field study. Agric. Ecosyst. Environ. 2017, 237, 80–94. [Google Scholar] [CrossRef]
- Shen, Y.; Zhu, L.; Cheng, H.; Yue, S.; Li, S. Effects of biochar application on CO2 emissions from a cultivated soil under semiarid climate conditions in Northwest China. Sustainability 2017, 9, 1482. [Google Scholar] [CrossRef]
- Zhou, J.; Deng, Y.; Shen, L.; Wen, C.; Yan, Q.; Ning, D.; Qin, Y.; Xue, K.; Wu, L.; He, Z.; et al. Temperature mediates continental-scale diversity of microbes in forest soils. Nat. Commun. 2016, 7, 12083. [Google Scholar] [CrossRef] [PubMed]
- Almagro, M.; López, J.; Querejeta, J.I.; Martínez-Mena, M. Temperature dependence of soil CO2 efflux is strongly modulated by seasonal patterns of moisture availability in a mediterranean ecosystem. Soil Biol. Biochem. 2009, 41, 594–605. [Google Scholar] [CrossRef]
- Bajracharya, R.M.; Lal, R.; Kimble, J.M. Diurnal and seasonal CO2–C flux from soil as related to erosion phases in Central Ohio. Soil Sci. Soc. Am. J. 2000, 64, 286–293. [Google Scholar] [CrossRef]
- Frank, A.B.; Liebig, M.A.; Tanaka, D.L. Management effects on soil CO2 efflux in northern semiarid grassland and cropland. Soil Tillage Res. 2006, 89, 78–85. [Google Scholar] [CrossRef]
- Dilekoglu, M.F.; Sakin, E. Effect of temperature and humidity in soil carbon dioxide emission. J. Anim. Plant Sci. 2017, 27, 1596–1603. [Google Scholar]
- Xu, S.; Zhang, M.; Zhang, H.; Chen, F.; Yang, G.; Xiao, X. Soil organic carbon stocks as affected by tillage systems in a double-cropped rice field. Pedosphere 2013, 23, 696–704. [Google Scholar] [CrossRef]
- Monnie, F. Effect of Biochar on Soil Physical Properties, Water Use Efficiency, and Growth of Maize in a Sandy Loam Soil. Ph.D. Thesis, University of Ghana, Accra, Ghana, 2016. [Google Scholar]
- Katterer, T.; Roobroeck, D.; Andrén, O.; Kimutai, G.; Karltun, E.; Kirchmann, H.; Nyberg, G.; Vanlauwe, B.; de Nowina, K.R. Biochar addition persistently increased soil fertility and yields in maize-soybean rotations over 10 years in sub-humid regions of Kenya. Field Crop. Res. 2019, 235, 18–26. [Google Scholar] [CrossRef]


© 2020 by the authors. Licensee MDPI, Basel, Switzerland. This article is an open access article distributed under the terms and conditions of the Creative Commons Attribution (CC BY) license (http://creativecommons.org/licenses/by/4.0/).