Article

Change in Maize Final Leaf Numbers and Its Effects on Biomass and Grain Yield across China

1
Key Laboratory of Oasis Eco-Agriculture, Xinjiang Production and Construction Group, College of Agronomy, Shihezi University, Shihezi 832000, Xinjiang, China
2
Key Laboratory of Crop Physiology and Ecology, Institute of Crop Sciences, Chinese Academy of Agricultural Sciences, Ministry of Agriculture and Rural Affairs, Beijing 100081, China
*
Author to whom correspondence should be addressed.
Agriculture 2020, 10(9), 411; https://doi.org/10.3390/agriculture10090411
Submission received: 14 August 2020 / Revised: 14 September 2020 / Accepted: 14 September 2020 / Published: 16 September 2020

Abstract

:
The final leaf number is an important morphological characteristic of maize (Zea mays L.) and is therefore an important input parameter in some maize crop models. In this study, field experiments were conducted from 2013 to 2016 at 23 sites across China, which were located between latitudes of 26°30′ and 46°45′ N, focusing on five modern maize cultivars, in order to determine the amplitude of variation in mean leaf numbers between each cultivar, identify differences between the mean leaf numbers of cultivars under different climatic conditions, and clarify the effects of the differences in final leaf numbers on aboveground dry matter (DM) and grain yield. The results showed that the mean final leaf numbers increased in the order of XY335 < NH101 < ZD909 < ZD958 < DH11 among the five cultivars, with the wide distribution ranges of final leaf numbers being 17.0–23.3 (DH11), 16.7–22.3 (ZD958), 16.7–22.0 (ZD909), 16.7–22.3 (NH101), and 17.0–22.0 (XY335) across all locations. In addition, leaf numbers above and below the primary ear showed the same trends with the mean final leaf numbers for the same cultivars. Many climatic factors were found to significantly affect the final leaf numbers across four maize-growing regions in China, and the result of stepwise regression indicated that the influences of photoperiod and temperature, in particular, were greater than other climatic factors for these cultivars. Finally, there were found to be significant and positive relationships between the final leaf number and (1) the maximum leaf area index (LAImax), (2) DM at both silking and physiological maturity, and (3) grain yield for the same cultivars across all locations. The results of this study are of great importance for guiding future trans-regional maize cultivation and further model calibration.

1. Introduction

Maize is one of the most important foods and feed crops in the world [1,2], and is widely cultivated throughout the world from tropical to temperate climatic zones within latitudes of approximately 45° S to 50° N and at elevations from 0 to over 3800 m above sea level [3,4]. However, the variation in environmental conditions between different regions, especially climatic factors [5,6], results in regional differences in maize growth and development [7,8]. Therefore, several morphological characteristics of maize (i.e., final leaf number, plant height, ear height, and leaf area) which reflect plant growth and development vary in different environmental conditions, even for the same cultivar [9].
The final leaf number is the total leaf number produced by the maize plant recorded at silking. Besides agronomic practices [10,11], the final leaf numbers of maize are mainly affected by climatic factors. Many previous studies found that photoperiod and temperature may affect the final leaf numbers of maize [7,12,13]. Many of these studies showed the final leaf number increased with an increasing photoperiod [14,15,16]. However, when different maize cultivars were compared for a wide range of photoperiods, the response of final leaf numbers was not very consistent [17]. The final leaf numbers of tropical cultivars have been shown to be more sensitive to photoperiod than those of temperate cultivars [15]. Regarding the response of final leaf number to temperature, some previous studies demonstrated an overall increase in final leaf number with increasing mean temperature [13,18]. However, Warrington and Kanemasu [14] found that the maize final leaf number increased first and then decreased with increasing average temperature; the turning point for the average temperature was 18 °C. Some other studies have reported the impact of other factors on the leaf number, such as the incidence of photosynthetic photon flux density (PPFD) [19], accumulated solar radiation [20], and latitude [8]. Drought or water deficiency can also affect the leaf area index (LAI) and yield by maize leaf number [11,21]. Additionally, the final leaf number varies among different cultivars [15,16]. Allen et al. (1973) [20] reported that the final leaf numbers of 16 hybrids varied from 14.4 to 18.0 under the same growing conditions in Pennsylvania. In summary, changes in maize final leaf numbers presented different results in previous studies, and most of these works were factorial studies conducted in controlled environment (e.g., growth cabinets or greenhouses) two decades ago, and were confined to limited areas with old cultivars, Therefore, few studies have reported how the final leaf number differs under large ecological environments for the same modern maize cultivar and responds to climatic factors under non-water and fertilizer stress.
The final leaf number is the sum of the leaf numbers above and below the primary ear. The distribution of the leaf numbers above and below the primary ears in plants determines plant architecture and population canopy structure in maize [22]. Differences in the leaf numbers above and below the primary ear can lead to spatial differences in the leaf area index (LAI) of plants and thus affect the amount of light intercepted, the uniformity of light distribution, and the photosynthesis activity in the canopy [23,24]. However, most previous studies focused on the leaf number above the primary ear due to the fact that they are more conducive to grain filling [25,26,27]. However, very few attempts have been made to systematically investigate the relationships between the final leaf number and the leaf numbers above and below the primary ear under different natural environments using the same modern hybrids.
The final leaf number per plant can affect the leaf area per plant and thus influence the leaf area index (LAI), which is the key basis for the formation of dry matter (DM) and grain yield in maize [24]. Therefore, the final leaf number can indirectly affect both DM and grain yields. Several studies have shown that leafy maize obtained greater DM and grain yields compared to normal hybrids [27,28]. Dwyer et al. [29] and Andrews et al. [30] also reported that maize grain yields increased with increasing final leaf numbers but not significantly, because of the limited variation in final leaf numbers. Previous studies only compared the differences in yield among maize cultivars with different leaf numbers using specific genotype experiments and specific on-site field experiments. However, the relationships between the final leaf number and DM and grain yields were poorly documented, especially at a large spatial scale. If the variation in final leaf number significantly affects maize DM and yield, the simulation results of crop models should be considered carefully because the final leaf number is used as a genotype-specific coefficient (i.e., a constant for the same cultivar) in some crop models [31,32] to simulate maize ontogeny and yield. In recent years, the application scale of crop simulation models has gradually expanded from a regional scale to a national and even global scale in order to simulate yield change against the background of global climate change [24,33,34]. Therefore, it is necessary to know how the spatial variation of maize leaf numbers finally affects DM and grain yields under large ecological environments for the same modern maize cultivar.
Maize, as the largest cereal crop in China, is widely cultivated in different locations and regions where meteoro-ecological conditions are significantly different and complicated [35,36] compared with regions where crop production and meteoro-ecological conditions are more homogeneous (e.g., North and Central America; Leff et al. [3]). In light of the above, we carried out multi-year and multi-site field experiments at 23 locations covering the four largest maize-growing regions from 2013 to 2016 in China. The objectives of this study were (i) to systematically determine the amplitude of variation in mean final leaf numbers for the same cultivars and the differences in mean final leaf numbers between cultivars; (ii) to determine the main climatic factors influencing final leaf numbers of modern hybrids in temperate regions; (iii) to clarify the effects of both leaf numbers above and below the primary ear on the final leaf number across China; (iv) to reveal the effects of the variation of final leaf numbers on maize DM and grain yields using a mass of field data. The results are expected to provide a theoretical basis for the study of the ecological adaptability of maize and the validation of future crop models on larger simulation scales.

2. Materials and Methods

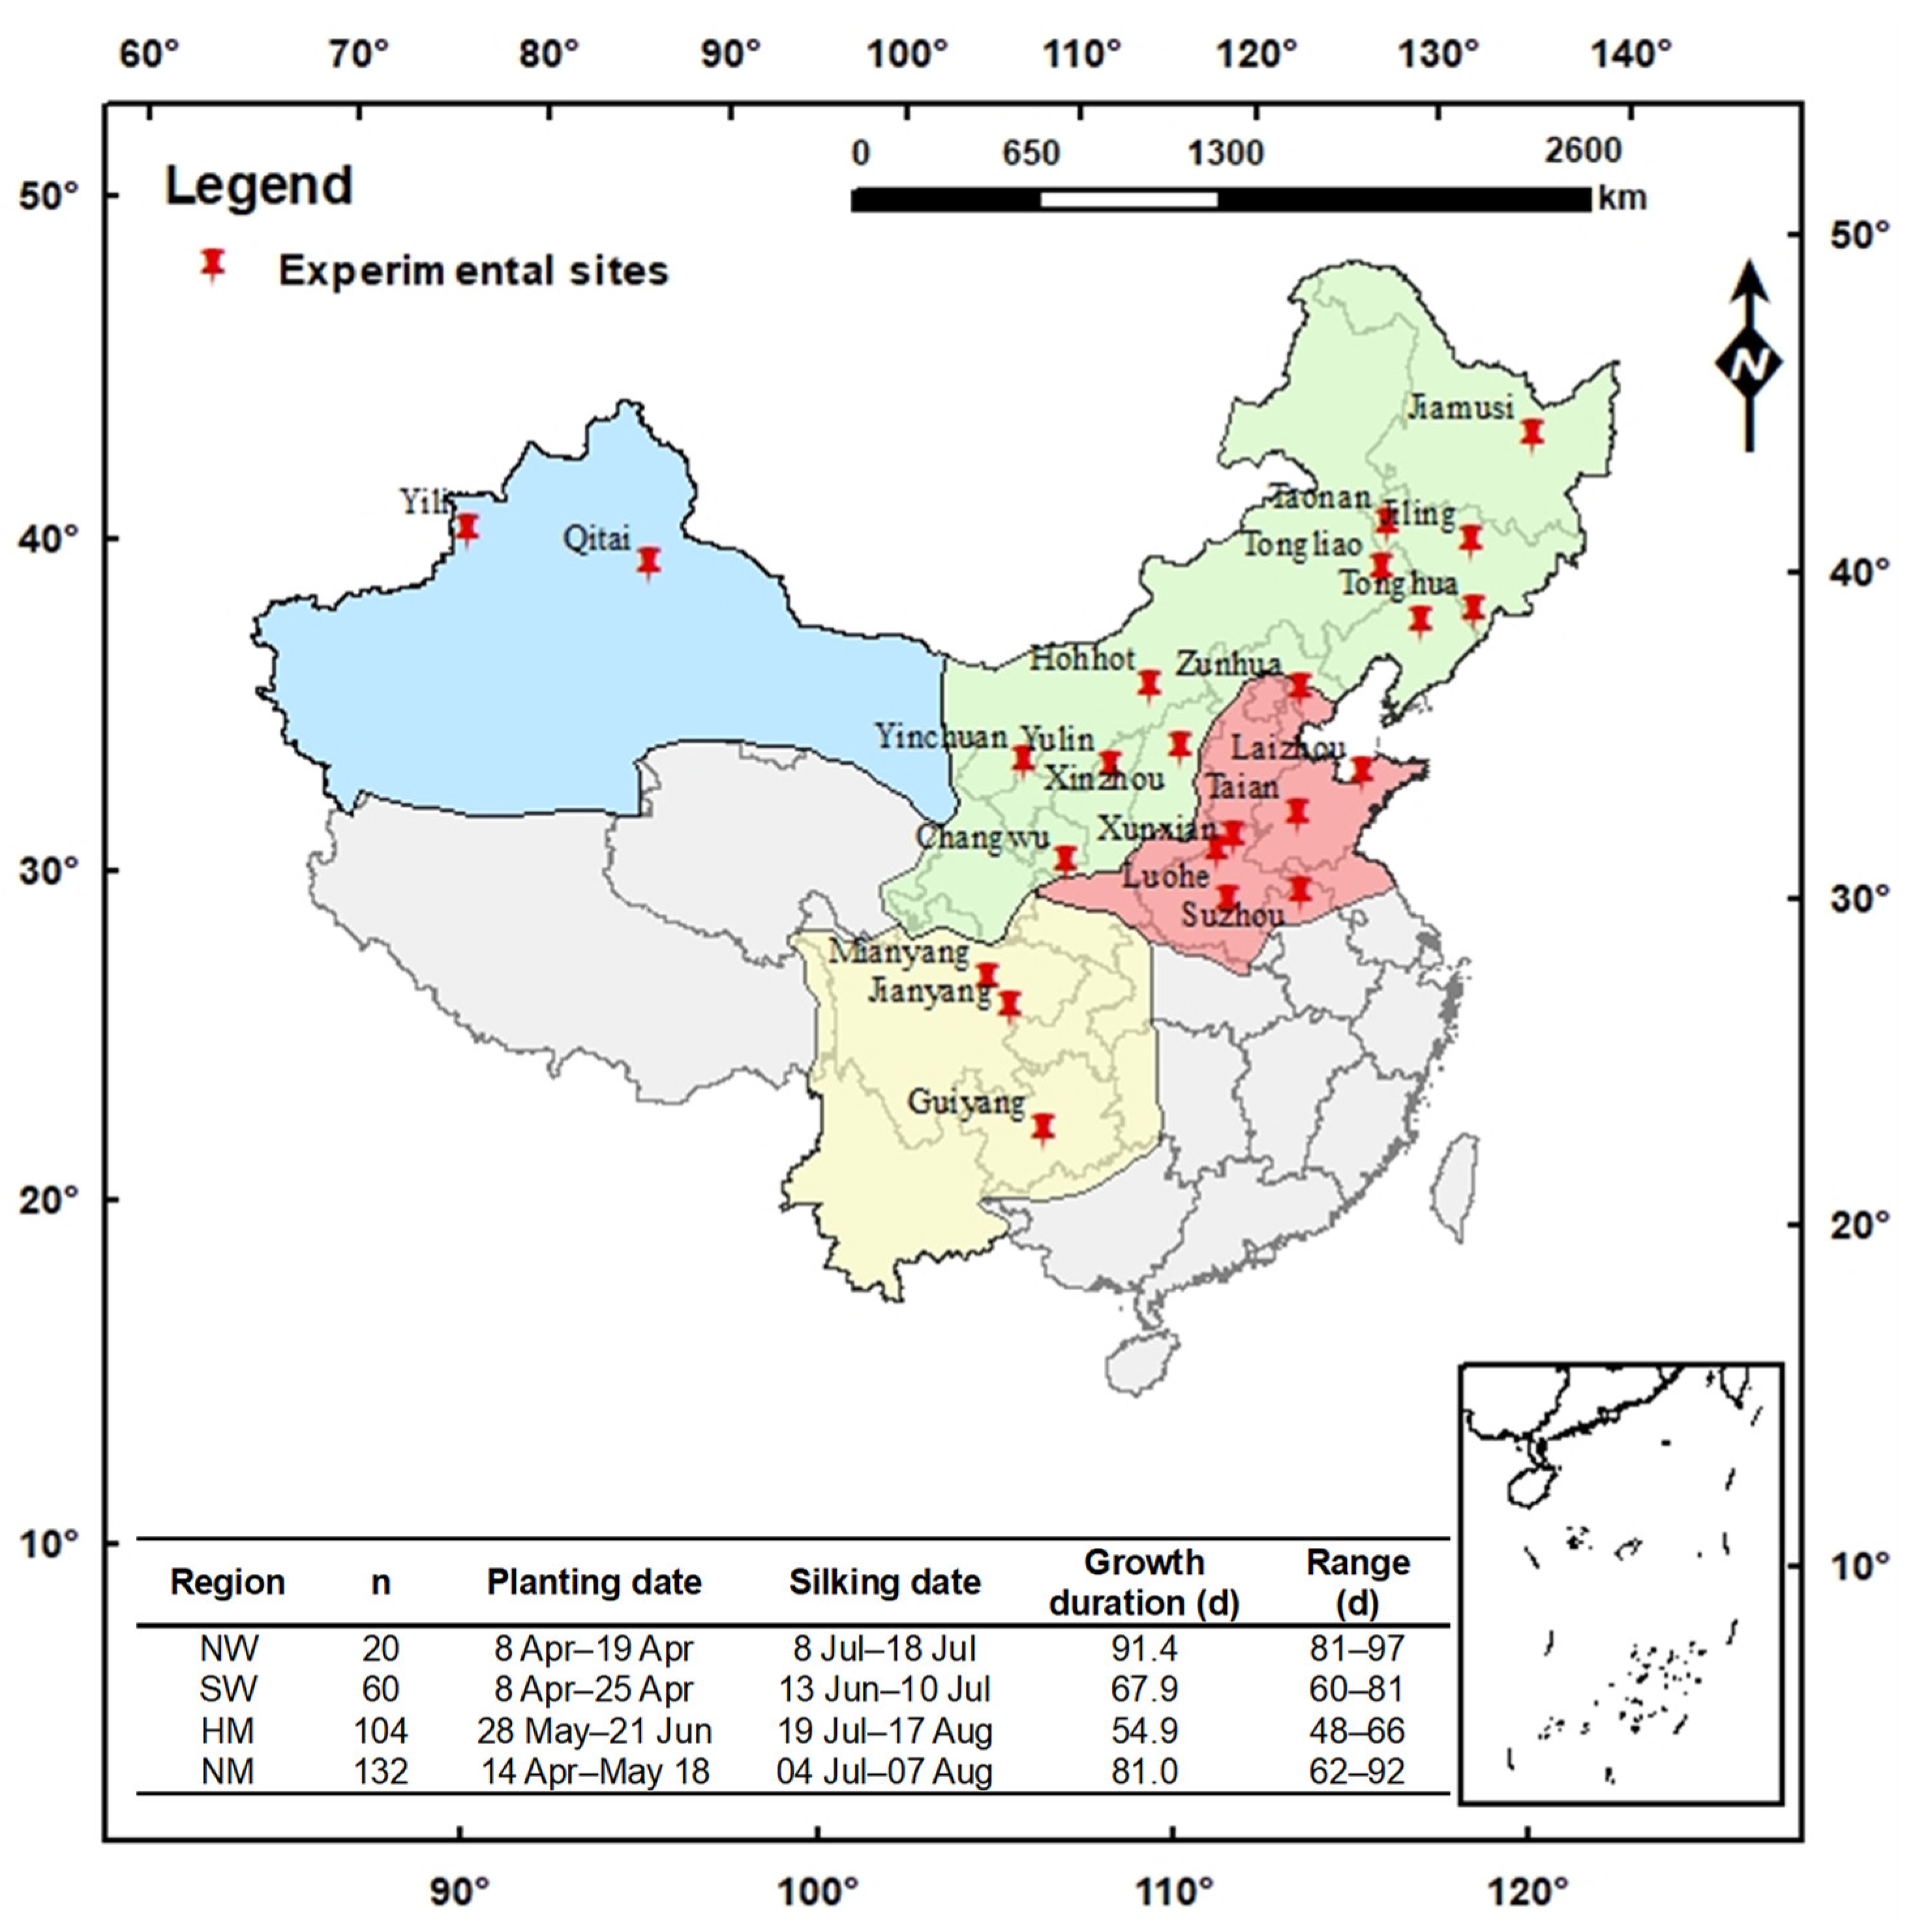
2.1. Site Description and Experimental Design

Field experiments were conducted in 2013, 2014, 2015, and 2016 at 23 locations between latitudes of 26°30′ and 46°45′ N. These locations covered the four largest maize-growing regions in China, namely the northwestern maize region (NW), the northern spring maize region (NM), the Huanghuaihai maize region (HM), and the southwestern maize region (SW) (Figure 1). The NM region is the largest maize-growing region in China. In this region, the annual ≥10 °C accumulated temperature ranges from 2000 to 3600 °C·day, and the annual total precipitation varies from 400 to 800 mm per year, of which about 60% occurs between July and September. The HM region is the second largest maize-growing region in China, with an annual total precipitation and ≥10 °C accumulated temperature of 500–800 mm and 3600–4700 °C·day, respectively. In the SW region, some areas have tropical or sub-tropical climates; the annual total precipitation interval is between 800 and 1200 mm and the annual ≥10 °C accumulated temperature ranges from 4500 to 5500 °C·day. The NW region has an annual total precipitation of 300–400 mm and ≥10 °C accumulated temperature of 2500–3600 °C·day [35,36,37]. The average climatic conditions for each region during the vegetative growth stage in the study years are shown in Table 1.
Five modern single-cross maize cultivars were planted in all of the experimental sites, namely zhengdan958 (ZD958), xianyu335 (XY335), denghai11 (DH11), nonghua101 (NH101), and zhongdan909 (ZD909). These cultivars are all widely cultivated in the four study regions, and each has a medium growing period. Seeds were sown in a randomized complete block with four replications at each experimental site with the same planting density of 6.0 × 10⁴ plants ha−1, which is a suitable planting density for these maize cultivars in China [38]. At every experimental site, each plot was 15 m in length and 6.5 m in width, and consisted of 10 rows with a row spacing of 0.65 m. In NW and NM, where maize was planted in one season per year, the seeds were sown by hand at a soil depth of about 5 cm from early April to early May and the plants were harvested from late September to early October. In HM, the maize was double-cropped with winter wheat for one year, planted in mid-June, and harvested from late September to early October. In SW, the seeds were sown in early April and the plants were harvested around mid-August. In order to avoid nutrient stress, fertilizer was applied at rates of 126–500 kg N ha−1, 0–207 kg P2O5 ha−1, and 0–112 kg K2O ha−1 across these regions; these application amounts referred to recommendations of our previous studies, which were based on soil test [38,39,40,41]. To avoid water stress, irrigation was applied according to the field soil moisture at locations with low precipitation, including two sites in NW (Qitai and Yili), three sites in SW (Mianyang, Jianyang and Guiyang), six sites in HM (Taian, Laizhou, Xinxiang, Luohe, Xunxian and Suzhou), and seven sites in NM (Taonan, Huhehot, Tongliao, Yulin, Changwu, Xinzhou and Yinchuan), and the average irrigation amount is shown in Table 1. Weeds, diseases, and insect pests were well controlled at all locations. Figure 2 shows the maize growing in the fields at some of the experimental sites in different regions.

2.2. Sampling and Measurements

The sowing, silking, and maturity dates of the maize at each location were recorded; silking was recorded when 60% of the ears showed silk emergence, while maturity was recorded when kernels had reached physiological maturity as the black layer appeared. Five plants with uniform growth per plot were selected at random to investigate the final leaf numbers at the silking stage during the study period (2013–2016). The fifth and tenth leaves were marked by painting a dot on the leaf tip as a reference, thus ensuring that the final leaf number was accurately counted after the lower leaves had senesced [7,16]. Furthermore, the leaf numbers above and below the primary ear were obtained during 2015 and 2016. Leaves at ear position were included in the leaf number below the primary ear in this study. The leaf number below the primary ear was calculated by subtracting the leaf number above the primary ear from the final leaf number. DM was measured at both silking and physiological maturity using five randomly selected consecutive plants with uniform growth from each plot with border rows removed. The plants were separated into the stem, leaf, sheath, tassel, bract, kernel, and cob fractions and dried at 85 °C to a constant weight. The length (L) and maximum leaf width (Wmax) of each live leaf was measured, and the leaf area was calculated according to the formula of leaf area = L × Wmax × 0.75 [42,43]. The total leaf area per plant at silking maturity was defined as the maximum leaf area, which was measured for five plants per plot at the silking stage; the maximum leaf area index (LAImax) was calculated as follows: LAImax = total leaf area per plant × N/S, where N is the number of plants within a unit area of ground and S is the unit area of ground [41,43]. After physiological maturity, all plants in the central four rows of each plot, representing an area of 13 m2, were harvested manually to measure the grain yield. The grain yield was determined at 14% moisture content, as tested using a portable moisture meter (PM8188, Kett Electric Laboratory, Tokyo, Japan).
Annual meteorological data for the experimental locations during the vegetative stage (from sowing to silking)—namely mean daily temperature, mean daily maximum temperature, mean daily minimum temperature, and mean daily solar radiation—were obtained for all study years from the website of the National Meteorological Information Center [44] of the China Meteorological Administration (CMA). The distance between the meteorological stations and the experimental sites ranged from 3 to 39 km. The ≥10 °C accumulated temperature was calculated as the sum of the mean daily temperatures during the vegetative stage on days when the mean daily temperature exceeded 10 °C [45]. The natural photoperiod in each experimental location was calculated, using the method outlined in Jones and Kiniry [46], at two weeks after seedling emergence, as was performed in other studies [8,31].

2.3. Statistical Analysis

All statistical analyses were performed using SPSS 18.0 software (SPSS Inc., Chicago, IL, USA), and tables and figures were produced using Sigma-Plot 12.5 software (Systat Software Inc., San Jose, CA, USA). Analysis of variance (ANOVA) was performed to test for significance in final leaf numbers, leaf numbers above the primary ear, and leaf numbers below the primary ear, for each cultivar between the four regions. Means were compared using Fisher’s least significant difference tests at a p < 0.05 level (LSD0.05). Correlation and linear regression analyses were applied to examine the relationships between the final leaf numbers and other variables (i.e., leaf numbers both above and below the primary ear, climatic factors, LAImax, DM at both silking and physiological and yield). The stepwise regression analysis model was adjusted to determine the major climatic factors which influenced the final leaf numbers across the four regions. Independent variables were entered into the model when p < 0.05 and were removed when p > 0.10 [47].

3. Results

3.1. Difference in Final Leaf Number between Cultivars across All Locations

The mean value of the mean final leaf number was 19.6 (range: 16.7–23.3) across all locations and cultivars (n = 316), with 6.7% variation (Table 2). The ANOVA results showed that mean final leaf numbers increased in the order of XY335 (19.2, n = 60) < NH101 (19.2, n = 69) < ZD909 (19.7, n = 58) < ZD958 (19.7, n = 69) < DH11 (20.4, n = 58) across all locations. The mean final leaf number of DH11 was significantly higher than that of all of the other cultivars, while the mean final leaf numbers of ZD958 and ZD909 were almost the same as each other and were both significantly higher than those of NH101 and XY335. For the five cultivars, the ranges in final leaf numbers were 6.3, 5.6, 5.3, 5.6, and 5.0 leaves for DH11, ZD958, ZD909, NH101, and XY335, respectively. The highest coefficients of variation were obtained for ZD958 and NH101, with values of 7.1 and 6.5%, respectively, while values of 6.1, 6.0, and 6.0% were obtained for DH11, ZD909, and XY335, respectively (Table 2). These results suggest that the final leaf numbers for ZD958 and NH101 were more sensitive to environmental variation than those of the other three cultivars. The results of the interactive analysis showed that final leaf number was not significantly affected by the year or the year × cultivar interaction, and there was only significant difference in the mean final leaf numbers between the cultivars (p < 0.01).

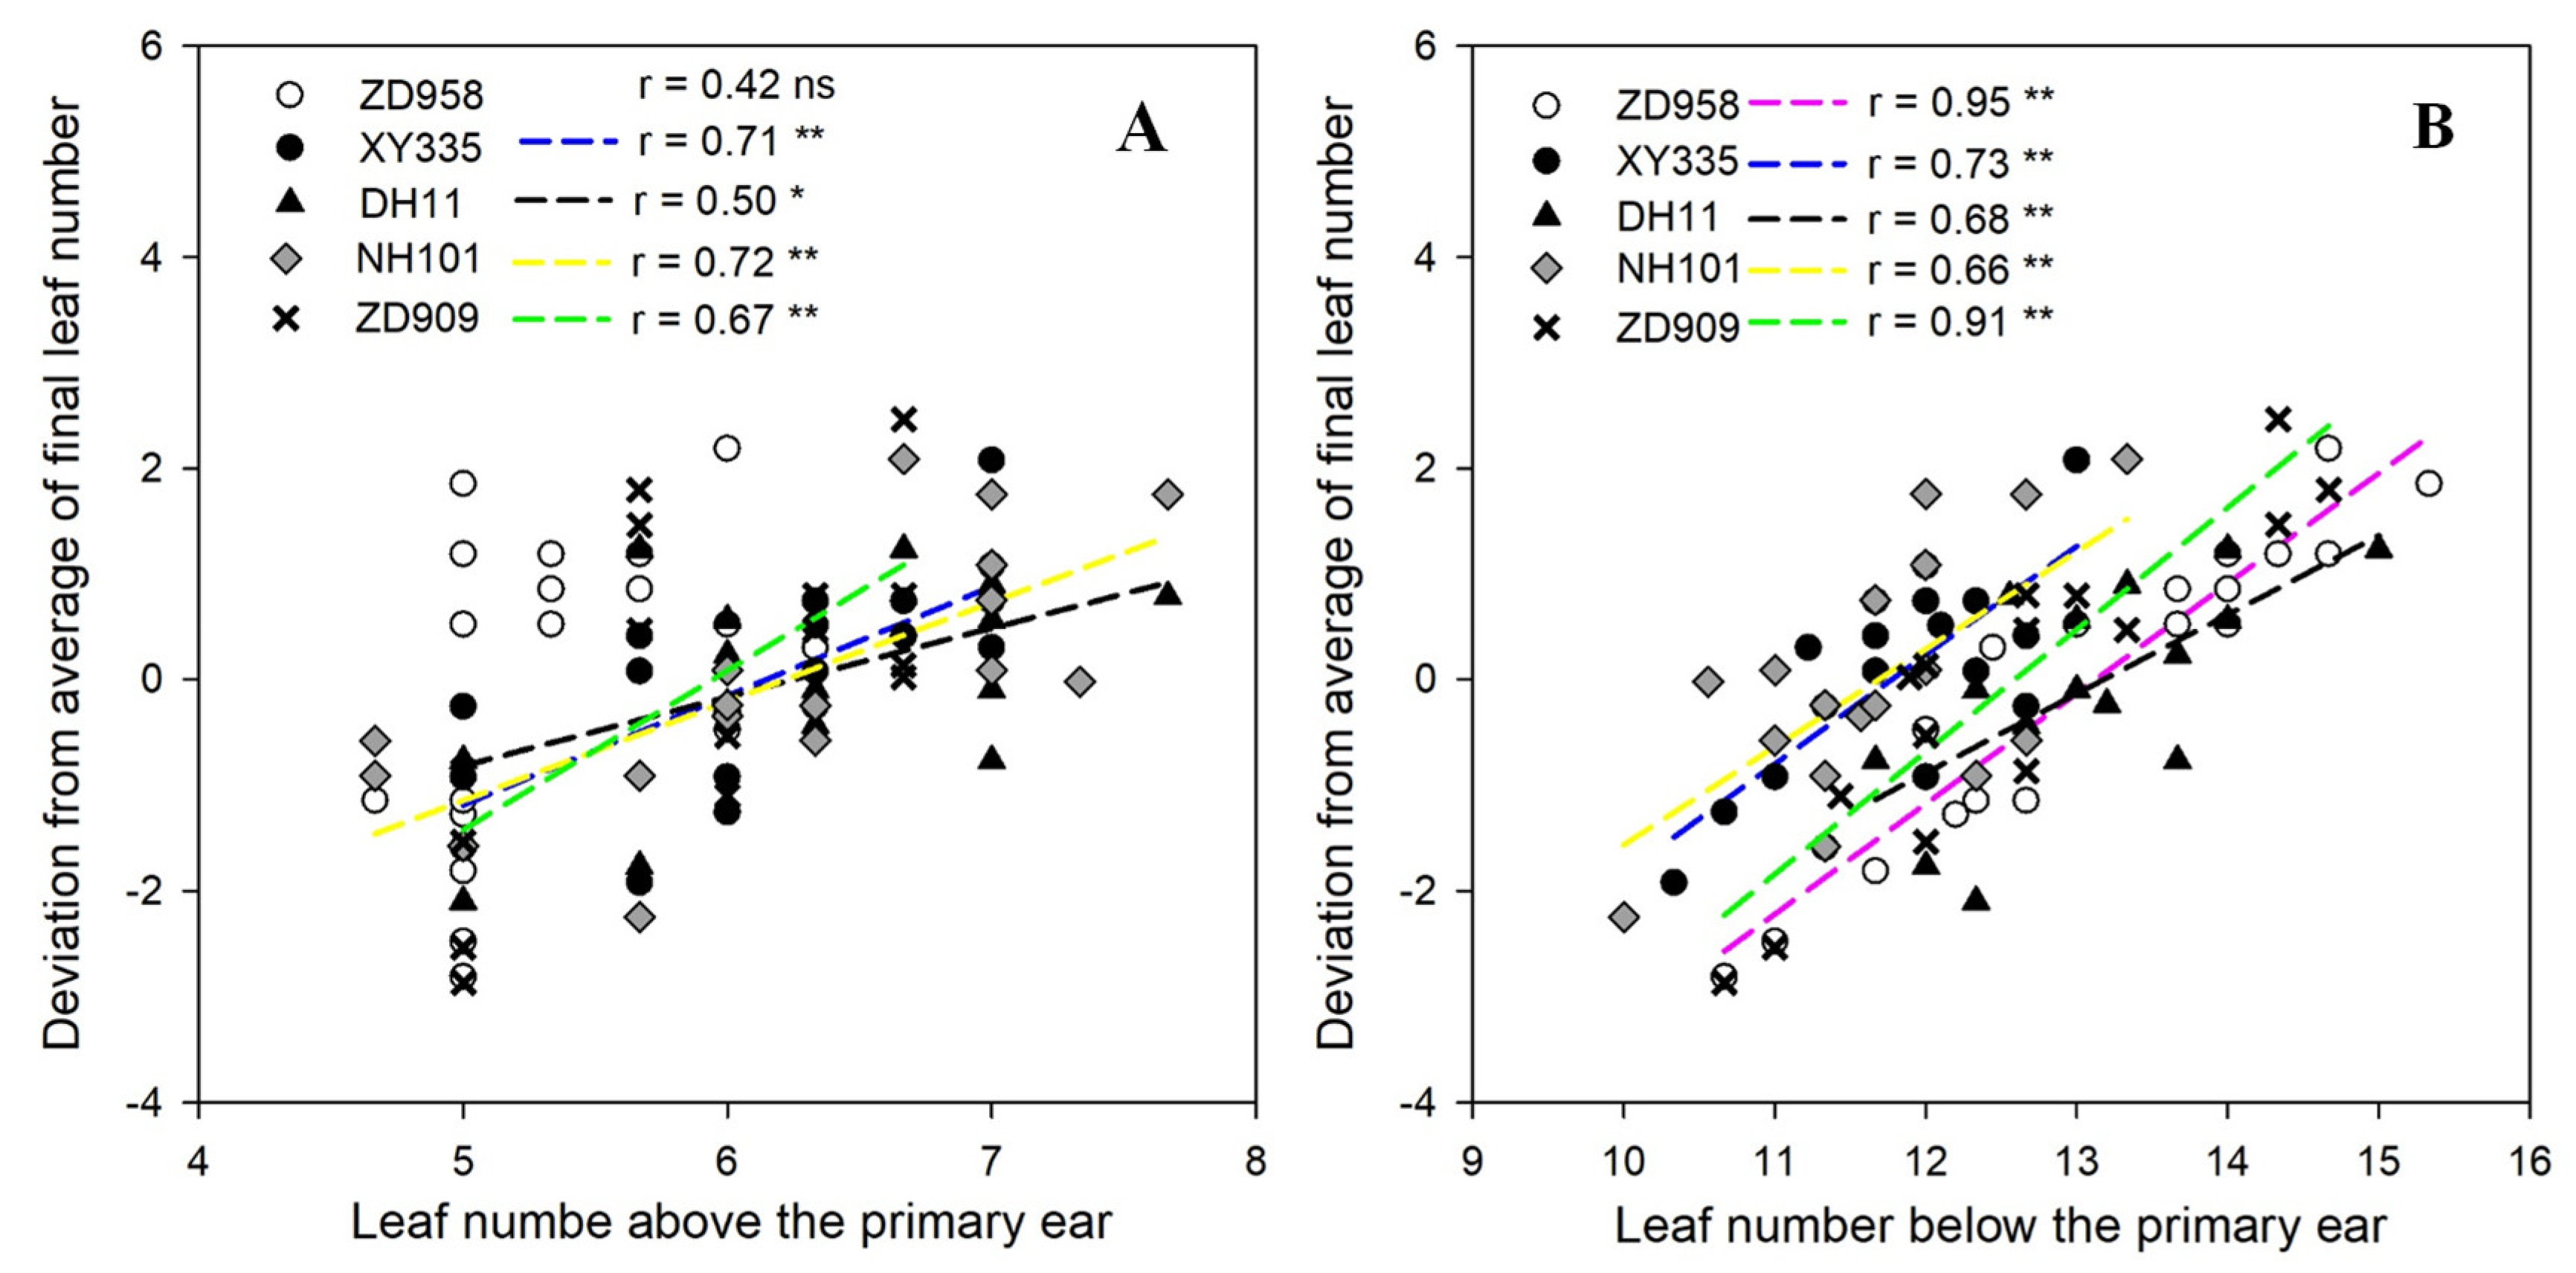
3.2. Relationships between Final Leaf Numbers and Leaf Numbers Both Above and Below the Primary Ear

As shown in Table 3, across all locations and cultivars, the mean leaf number above the primary ear was 6.0, ranging from 4.7 to 7.7. The mean leaf number below the primary ear was 12.5 and ranged from 10.0 to 15.3. Among the five cultivars, the trend of the mean leaf number below the primary ear was the same as that of the mean final leaf number, and the mean final leaf number was basically consistent with the result of that in 2013–2016 (Table 2). The largest mean leaf number below the primary ear was obtained for DH11, with a value of 14.2, and the lowest was obtained for NH101, with a value of 12.7. The largest mean leaf number above the primary ear was obtained for DH11, with a value of 6.3, and the lowest was obtained for ZD958, with a value of 5.4 (Table 3). Furthermore, in order to determine the effects of leaf numbers above and below the primary ear on the final leaf number, we analyzed the relationships between the difference (deviation) in final leaf numbers and leaf numbers both above and below the primary ear (Figure 3). It was found that there were significant relationships between deviations from the averages of the final leaf numbers and leaf numbers both above and below the primary ear for XY335, DH11, NH101, and ZD909 (Figure 3A,B). In comparison, the relationship between deviation from the average of the final leaf numbers and leaf numbers above the primary ear was not significant for ZD958 (Figure 3A), which indicated the difference in leaf number below the primary ear mainly contributed to the difference of final leaf number for ZD958. In general, the leaf numbers both above and below the primary ear changed in a wide range of natural environments, which resulted in differences in final leaf numbers for the same cultivars.

3.3. Effects of Climatic Variables on Final Leaf Number

According to the correlation coefficients between the mean final leaf number, climatic factors, and days during the vegetative growth stage (from sowing to silking) for each cultivar across all locations (Table 4), it was found that mean final leaf number was significantly positively associated with diurnal temperature range, daily solar radiation, ≥10 °C accumulated temperature, accumulated solar radiation, photoperiod, and vegetative growth days of for all cultivars (p < 0.01). Additionally, it was found that the mean final leaf numbers were negatively correlated with mean temperature, maximum temperature, and minimum temperature for DH11, NH101, and XY335 (Table 4).
Stepwise regression equations were built to clarify the main factors influencing the final leaf numbers for each cultivar (Table 5). The results showed that mean final leaf number was mainly affected by the photoperiod for ZD958 (p < 0.01), the photoperiod and daily mean temperature for XY335 (p < 0.01), the photoperiod for DH11 (p < 0.01), the photoperiod and maximum temperature for NH101 (p < 0.01), and the photoperiod for ZD909 (p < 0.01).

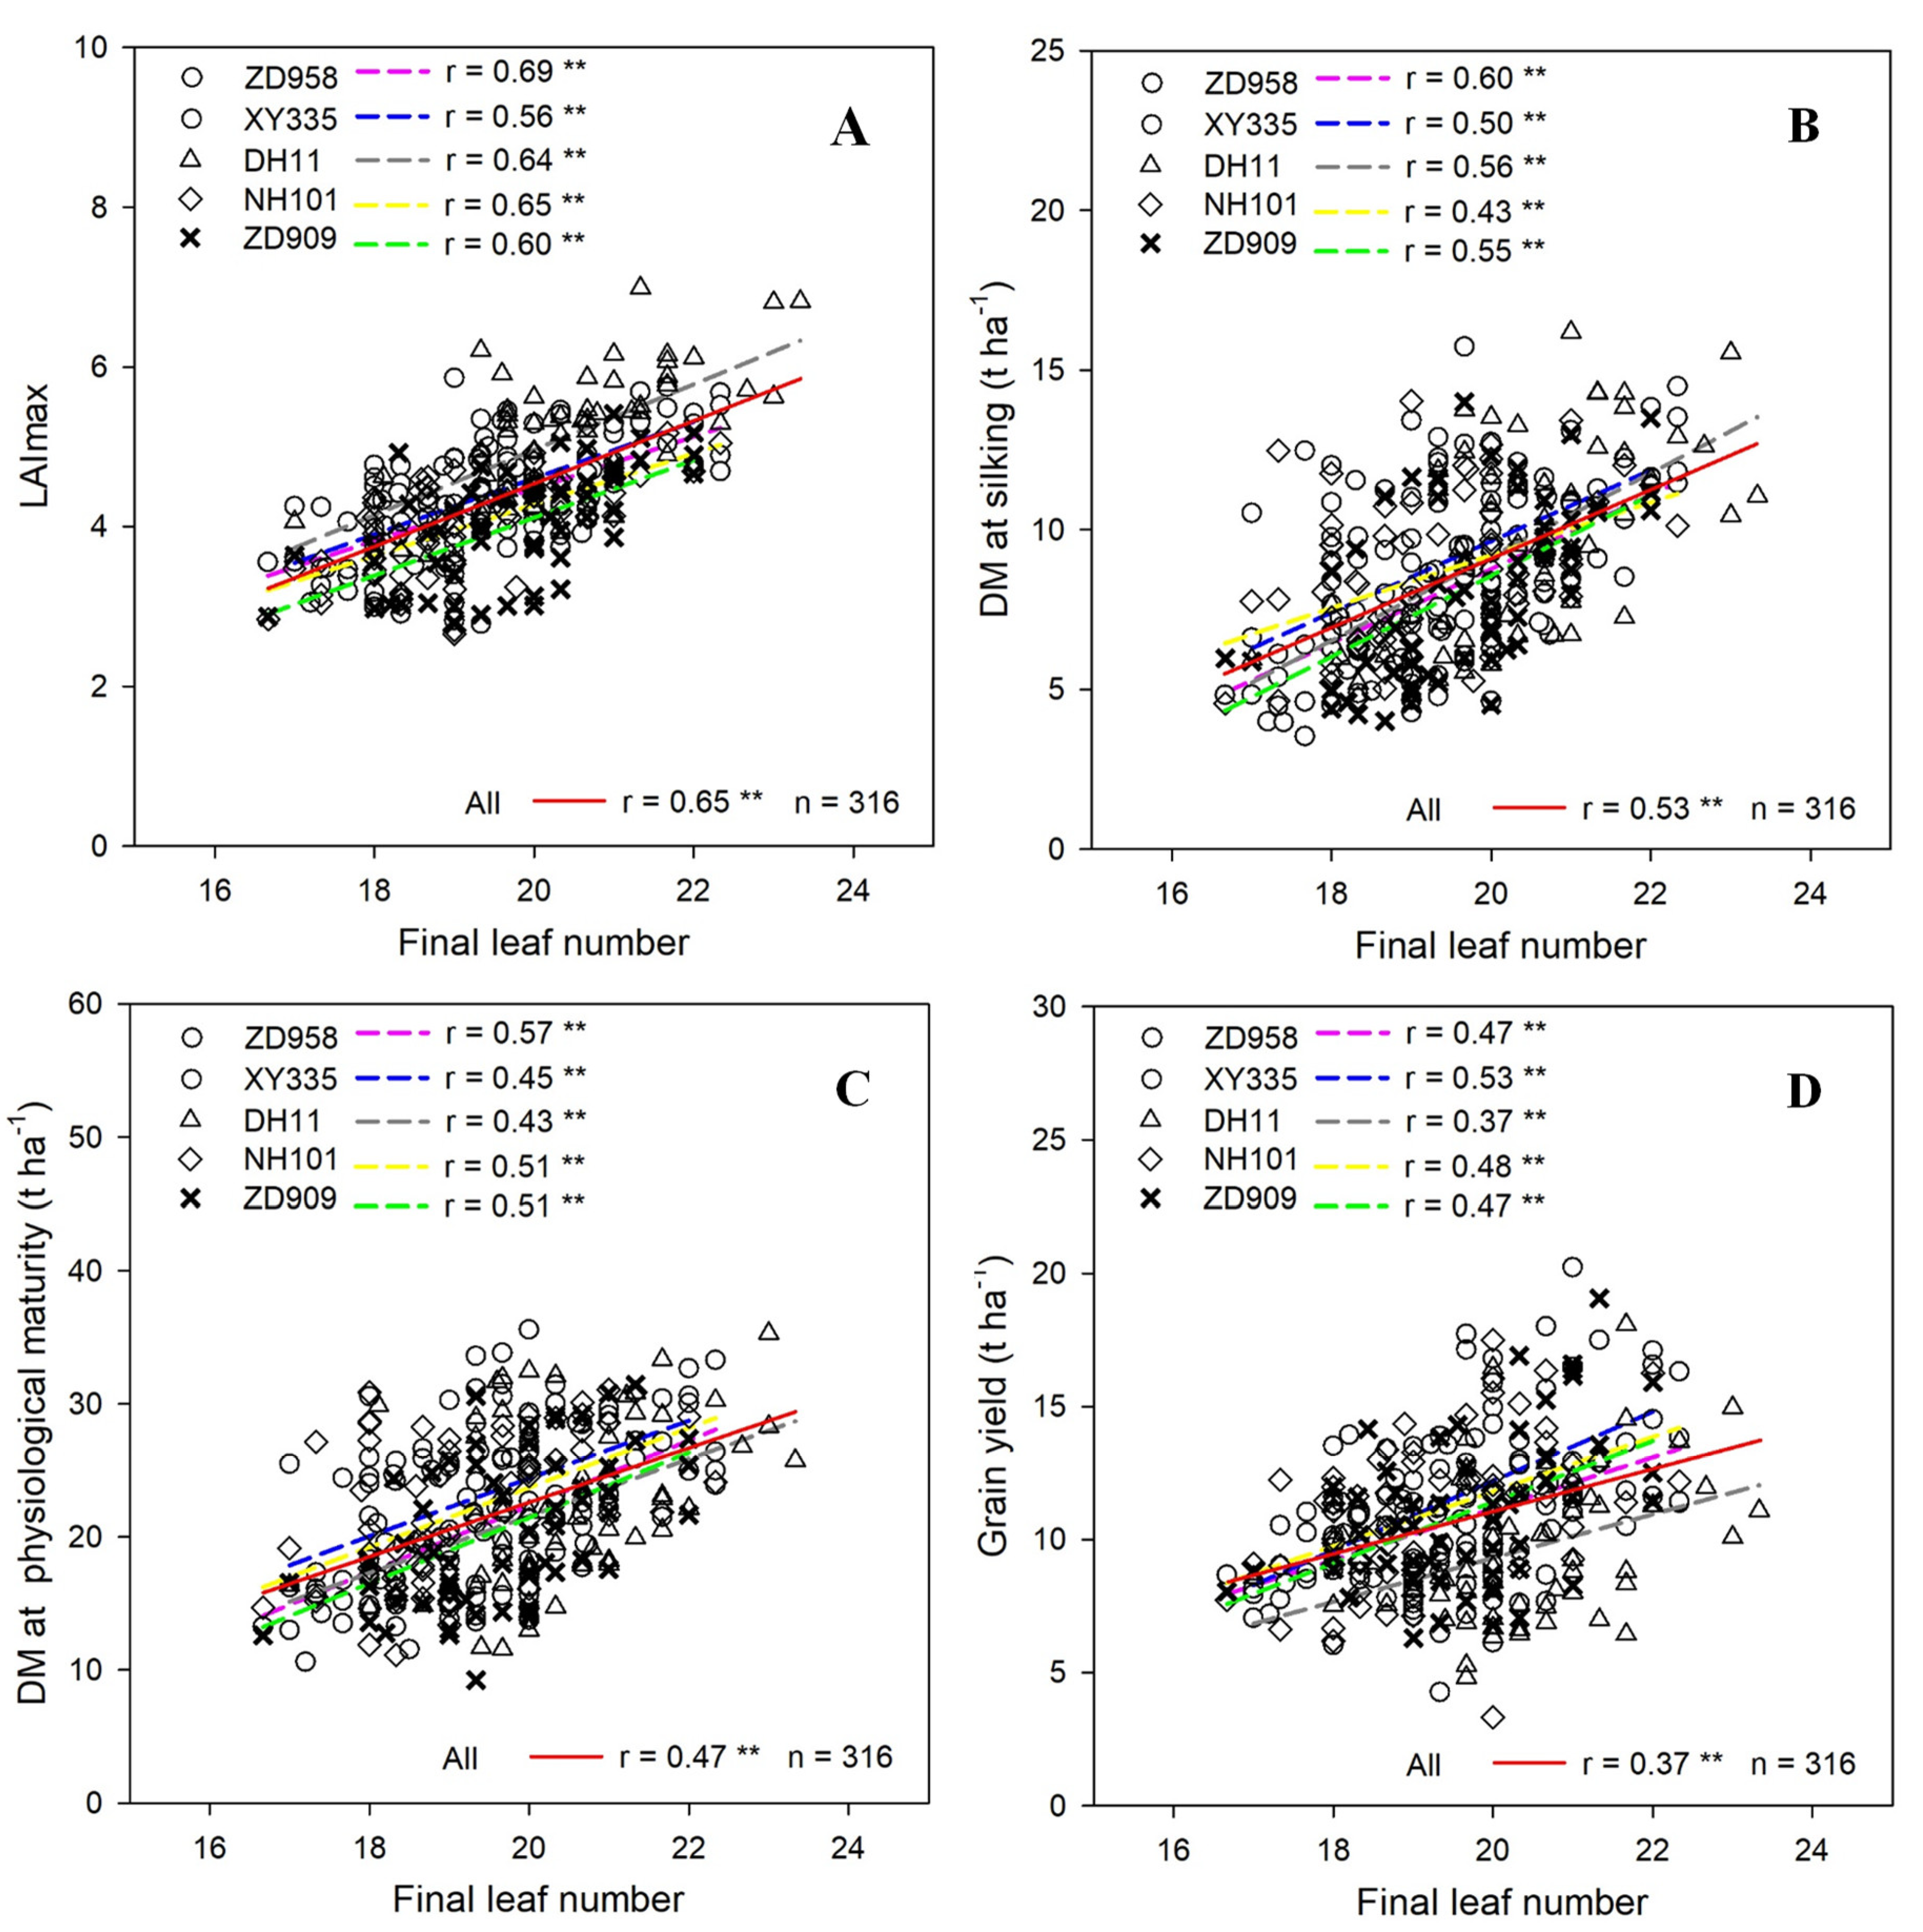
3.4. Relationships between Final Leaf Number and LAImax, DM, and Grain Yield

There was a strong positive relationship between the LAImax and the final leaf number for each cultivar across all locations (p < 0.01; Figure 4A). Moreover, similar to LAImax, the DM at both silking (r = 0.53, p < 0.01) and physiological maturity (r = 0.47, p < 0.01) and grain yield (r = 0.37, p < 0.01) were significantly correlated with final leaf number when the data from all locations were pooled together (Figure 4B–D). Similarly, significant relationships between the final leaf number and (1) DM at silking, (2) DM at physiological maturity, and (3) grain yield were also observed for each cultivar (p < 0.01). Overall, the correlation coefficients of DM at both silking and physiological maturity were higher than that of grain yield for these cultivars. Additionally, it was found that there were significant correlations between the LAImax and DM at both silking and physiological maturity and the grain yield (p < 0.01) for each cultivar (data not shown). In other words, the difference in final leaf numbers significantly affected the differences in DM at both silking and physiological maturity and grain yields for the same cultivars at a large spatial scale, which was mainly due to the fact that the final leaf number affected the LAImax, and, subsequently, the dry matter accumulation and grain yield formation. By further analyzing the correlation between the leaf numbers above the primary ear and grain yields, it was found that there were significant correlations for XY335 (r = 0.50, p < 0.05) and NH101 (r = 0.58, p < 0.05), however, the correlation was not significant for ZD598 (p > 0.05), DH11 (p > 0.05), and ZD909 (p > 0.05).

4. Discussion

4.1. Maize Final Leaf Numbers and Leaf Numbers Above and Below the Primary Ear

Leaf numbers are an essential metric of the morphological characteristics of maize and can vary with plant genotype and environmental conditions [9,48]. Most studies on the response of leaf numbers to plant genotypes have demonstrated that the final leaf number varies between different types of cultivars [16,20,28]. The results of the present study were consistent with these previous findings (Table 2). It has been shown that, due to the effects of environmental factors, the final leaf number of the modern maize cultivar ZD958 (which has an average value of 21.0) increased significantly with increasing latitude in northern China, with a range of 5.0 leaves moving from 35°11′ to 48°08′ N [8]. However, in the present study, the range of final leaf numbers for the five studied cultivars was found to be 6.6 leaves, and that for each individual cultivar was found to be more than five leaves in the latitudes of 26°30′–46°45′ N and longitudes of 81°19′–130°16′ E. Moreover, the average final leaf numbers of the five cultivars were all less than 21.0, which can be attributed to the fact that our study covered a wider and more environmentally variable area than the study of Liu et al. [8].
Due to the important role played by leaves above the primary ear in canopy light interception, most previous studies have mainly focused on the changes in leaf number above the primary ear [26,27,49]. However, few studies have reported the changes in leaf number both above and below the primary ear for the same cultivars in different environments and their correlation with the final leaf number. In this study, the correlation analysis showed that the increase in leaf numbers both above and below the primary ear resulted in the increase in the final leaf numbers across all locations. This is different from the findings of Zhang and Mugo [15], who, in a controlled photoperiod experiment, reported that the increase in final leaf numbers was due to the increase in leaf numbers above the primary ear. This difference may be due to the relative complexity of environmental conditions and the larger spatial scale of our study area. It has previously been shown that, in common maize, variation in the leaf number above the primary ear is generally limited, ranging from 4 to 7 [49], which is similar to the results of the present study (Table 3). This finding can be attributed to the high heritability of the leaf number above the primary ear [50].

4.2. Relationships between Final Leaf Number and Climatic Factors and Vegetative Growth Days

Besides field management practices, the leaf numbers of maize have been shown to be strongly affected by climatic factors [20]. The correlation analysis performed in the present study showed that the final leaf numbers had significant positive relationships with diurnal temperature range, ≥10 °C accumulated temperature, accumulated solar radiation, photoperiod, and the number of growth days during the vegetative growth stage for each cultivar (Table 4), which is in accordance with the results of several previous trials conducted in controlled environments for the diurnal temperature range, accumulated solar radiation, and silking date [14,20]. The present study found negative correlations between final leaf numbers and mean temperature, maximum temperature, and minimum temperature. This is in accordance with the results of a few previous studies, especially for mean temperature [51]; however, most previous studies have reported that the final leaf number increased with temperature [13,18]. This discrepancy may be due to the fact that the positive influences of some of the factors described above were greater than that of temperature across all the experimental sites in this study. Meanwhile, the stepwise regression analysis performed showed that temperature and, especially, photoperiod, were the most critical determining factors for the final leaf number for each cultivar (Table 5), whereas the responses to temperature variables varied among the cultivars. This result showed that many factors collectively caused variation in the final leaf numbers of the same cultivar across different locations in China and, at the same time, confirmed that the photoperiod and temperature were the main factors affecting the final leaf numbers of modern hybrids over a wide area.

4.3. Relationship between Final Leaf Numbers and DM and Grain Yield

The final leaf number can influence the LAI and thus also the canopy light interception, DM, and grain yield [24,52]. Several previous studies reported that the total LAI and DM of leafy cultivars increased with an increasing final leaf number; however, the grain yield did not increase obviously [28,29,30]. In the present study, it was found that the LAImax increased with an increasing final leaf number, which was similar to the results of a previous study [31]. Consistent with LAImax, a significantly positive relationship was observed between the final leaf number and (1) DM at silking, (2) DM at physiological maturity, and (3) grain yields, across all locations and cultivars (Figure 4A–D). The large difference in final leaf number which was observed in different environments had a greater effect on DM at silking, which had the highest correlation coefficient with final leaf number (r = 0.53; Figure 4B). This is attributed to the significant increase in the LAImax with an increasing final leaf number. Meanwhile, from an overall perspective, the correlation coefficient between yield and leaf number was lower than that of DM at both silking and physiological maturity (Figure 4B–D).

4.4. Maize Final Leaf Numbers and Crop Models

The final leaf number is used as an important basic parameter in some crop simulation models [32,53]. For example, Muchow and Carberry [54] first developed a model for the simulation of a maize LAI based on bell-shaped curve functions. In this model the final leaf number, as the genotype-specific coefficient, was used to determine the total leaf area per plant [31,32]. In a recent model-based study, although the relevant model parameters obtained calibrations based on modern maize cultivars, the effects of the growth conditions, especially environmental conditions, on the maize final leaf numbers were not considered [42]. Additionally, in some process-oriented maize simulation models, such as the Hybrid-Maize model, the final leaf numbers were calculated using the thermal time (i.e., growing degree day (GDD)), which is also regarded as a genotype-specific parameter that varies with cultivars [55]. However, a previous study had found that GDD requirements were significantly different for the same cultivar between locations, which meant that the leaf numbers might change for the same cultivars in accordance with this study [5]. In other words, the final leaf number of the same cultivar varied greatly under different environments, which affected the LAI, DM, and grain yield of maize (Figure 4). To date, the spatial scale of crop simulation models is gradually being expanded [33,34]. If the final leaf number is set as a fixed parameter for the same maize cultivar in future similar models when simulating maize ontogeny and growth at different scales, it may result in simulation errors for the LAI and DM, and thus the grain yield of maize. Therefore, further research about model verification and calibration with a varied final leaf number parameter for the same cultivars in these models will be particularly necessary in the future.

5. Conclusions

The average of the final leaf numbers of the five modern maize cultivars studied in this work was 19.6 and showed a wide variation over a large spatial scale (from 26°30′ to 46°45′ N) with varied environmental conditions which varied by an average of 6.6 for these cultivars. The variation in final leaf numbers was found to have a significant effect on the LAImax, the DM at both silking and physiological maturity, and the grain yield for each cultivar, which meant that if a fixed final leaf number parameter was used for the same maize cultivar in some maize crop models when simulating maize ontogeny and growth, especially under wide range of agro-ecological environments, it may result in simulation errors for the LAI and DM, and thus the grain yield of maize. Therefore, further research about model verification and calibration with a varied final leaf number parameter in these models will be necessary in the future. The variations in the leaf numbers both above and below the primary ear caused the difference in the final leaf numbers for these cultivars across all locations. Moreover, climatic factors were found to significantly affect the maize final leaf number, and the influences of photoperiod and temperature especially were greater for the studied modern maize cultivars across wide and complex environments. These results can provide a theoretical basis for future trans-regional maize cultivation.

Author Contributions

Conceptualization, P.H. and S.L.; methodology, W.L. and P.H.; software, W.L. and B.M.; validation, P.H., B.M. and S.L.; formal analysis, W.L., P.H., B.M., R.X., K.W. and S.L.; investigation, W.L., G.L., Y.Y. and X.G.; resources, P.H. and S.L.; data curation, W.L. and B.M.; writing—original draft preparation, W.L.; writing—review and editing, W.L. and P.H.; visualization, W.L. and P.H.; supervision, S.L. and P.H.; project administration, S.L.; funding acquisition, P.H. All authors have read and agreed to the published version of the manuscript.

Funding

This research was supported by the National Key Research and Development Program of China (2016YFD0300110, 2016YFD0300101), the National Natural Science Foundation of China (31871558, 31501266, 31371575), and the National Basic Research Program of China (973, Program: 2015CB150401).

Acknowledgments

We gratefully acknowledge all researchers in the experimental stations for collecting the data.

Conflicts of Interest

The authors declare no conflict of interest.

References

  1. Ort, D.R.; Long, S.P. Botany. Limits on yields in the Corn Belt. Science 2014, 344, 484–485. [Google Scholar] [CrossRef] [PubMed]
  2. FAOSTAT—Agriculture Database. Available online: http://faostat.fao.org/ (accessed on 15 December 2016).
  3. Leff, B.; Ramankutty, N.; Foley, J.A. Geographic distribution of major crops across the world. Glob. Biogeochem. Cycles 2004, 18, 1–27. [Google Scholar] [CrossRef]
  4. Ramirez-Cabral, N.Y.Z.; Kumar, L.; Shabani, F. Global alterations in areas of suitability for maize production from climate change and using a mechanistic species distribution model (CLIMEX). Sci. Rep. 2017, 7, 5910–5913. [Google Scholar] [CrossRef] [PubMed]
  5. Hou, P.; Liu, Y.; Xie, R.; Ming, B.; Ma, D.; Li, S.; Mei, X. Temporal and spatial variation in accumulated temperature requirements of maize. Field Crop Res. 2014, 158, 55–64. [Google Scholar] [CrossRef]
  6. Liu, B.; Chen, X.; Meng, Q.; Yang, H.; Wart, J.V. Estimating maize yield potential and yield gap with agro-climatic zones in China—Distinguish irrigated and rainfed conditions. Agric. Meteorol. 2017, 239, 108–117. [Google Scholar] [CrossRef]
  7. Bonhomme, R.; Derieux, M.; Kiniry, J.R.; Edmeades, G.O.; Ozier-Lafontaine, H. Maize leaf number sensitivity in relation to photoperiod in multilocation field trials. Agron. J. 1991, 83, 153–157. [Google Scholar] [CrossRef]
  8. Liu, Y.; Xie, R.; Hou, P.; Li, S.; Liang, S. Phenological responses of maize to changes in environment when grown at different latitudes in China. Field Crop Res. 2013, 144, 192–199. [Google Scholar] [CrossRef]
  9. Ren, B.; Zhang, J.; Xia, L.; Xia, F.; Zhao, B. Effects of waterlogging on the yield and growth of summer maize under field conditions. Can. J. Plant Sci. 2014, 94, 23–31. [Google Scholar] [CrossRef]
  10. Cavero, J.; Farre, I.; Debaeke, P.; Faci, J.M. Simulation of maize yield under water stress with the EPICphase and CROPWAT Models. Agron. J. 2000, 92, 679–689. [Google Scholar] [CrossRef]
  11. Elawad, H.E. Growth and Production of Maize (Zea Mays L.) as Affected by Water Treatment, Organic and Inorganic Fertilizers. Ph.D. Thesis, University of Khartoum, Khartoum, Sudan, 2007. [Google Scholar]
  12. Ellis, R.H.; Summerfield, R.J.; Edmeades, G.O.; Roberts, E.H. Photoperiod, leaf number, and interval from tassel initiation to emergence in diverse cultivars of maize. Crop Sci. 1992, 32, 398–403. [Google Scholar] [CrossRef]
  13. Tollenaar, M.; Hunter, R.B. A photoperiod and temperature sensitive period for leaf number of maize1. Crop Sci. 1983, 23, 457–460. [Google Scholar] [CrossRef]
  14. Warrington, I.J.; Kanemasu, E.T. Corn growth response to temperature and photoperiod. III. leaf number1. Agron. J. 1983, 75, 762–766. [Google Scholar] [CrossRef]
  15. Zhang, F.; Mugo, S. Primary study on the effect of long photo-period on different maize Germplasm. J. Maize Sci. 2001, 9, 54–56. [Google Scholar]
  16. Birch, C.J.; Hammer, G.L.; Rickert, K.G. Temperature and photoperiod sensitivity of development in five cultivars of maize (Zea mays L.) from emergence to tassel initiation. Field Crop Res. 1998, 55, 93–107. [Google Scholar] [CrossRef] [Green Version]
  17. Hunter, R.B.; Hunt, L.A.; Kannenberg, L.W. Photoperiod and temperature effects on corn. Can. J. Plant Sci. 1974, 54, 71–78. [Google Scholar] [CrossRef] [Green Version]
  18. Birch, C.J.; Vos, J.; Putten, P.E.L. Plant development and leaf area production in contrasting cultivars of maize grown in a cool temperate environment in the field. Eur. J. Agron. 2003, 19, 173–188. [Google Scholar] [CrossRef] [Green Version]
  19. Tollenaar, M. Duration of the grain-filling period in maize is not affected by photoperiod and incident PPFD during the vegetative phase. Field Crop Res. 1999, 62, 15–21. [Google Scholar] [CrossRef]
  20. Allen, J.R.; Mckee, G.W.; Mcgahen, J.H. Leaf number and maturity in hybrid corn1. Agron. J. 1973, 65, 233–235. [Google Scholar] [CrossRef]
  21. Nemeskéri, E.; Molnár, K.; Rácz, C.; Dobos, A.C.; Helyes, L. Effect of water supply on spectral traits and their relationship with the productivity of sweet corns. Agronomy 2019, 9, 63. [Google Scholar] [CrossRef] [Green Version]
  22. Li, D.; Wang, X.; Zhang, X.; Chen, Q.; Xu, G.; Xu, D.; Wang, C.; Liang, Y.; Wu, L.; Huang, C.; et al. The genetic architecture of leaf number and its genetic relationship to flowering time in maize. New Phytol. 2016, 210, 256–268. [Google Scholar] [CrossRef] [Green Version]
  23. Xue, H.; Han, Y.; Li, Y.; Wang, G.; Feng, L.; Fan, Z.; Du, W.; Yang, B.; Cao, C.; Mao, S. Spatial distribution of light interception by different plant population densities and its relationship with yield. Field Crop Res. 2015, 184, 17–27. [Google Scholar] [CrossRef]
  24. Liu, G.; Hou, P.; Xie, R.; Ming, B.; Wang, K.; Xu, W.; Liu, W.; Yang, Y.; Li, S. Canopy characteristics of high-yield maize with yield potential of 22.5 Mg ha−1. Field Crop Res. 2017, 213, 221–230. [Google Scholar] [CrossRef]
  25. Shaver, D. Genetics and breeding of maize with extra leaves above the ear. In Proceedings of the 38th Annual Corn and Sorghum Industry Research Conference, Washington, DC, USA, 7–8 December 1983; pp. 161–180. [Google Scholar]
  26. Begna, S.H.; Hamilton, R.I.; Dwyer, L.M.; Stewart, D.W.; Smith, D.L. Variability among maize hybrids differing in canopy architecture for above-ground dry matter and grain yield. Maydica 2000, 45, 135–141. [Google Scholar]
  27. Subedi, K.D.; Ma, B.L. Ear position, leaf area, and contribution of individual leaves to grain yield in conventional and leafy maize hybrids. Crop Sci. 2005, 45, 2246–2257. [Google Scholar] [CrossRef]
  28. Begna, S.H.; Hamilton, R.I.; Dwyer, L.M.; Stewart, D.W.; Cloutier, D.; Assemat, L.; Foroutan-pour, K.; Smith, D.L. Morphology and yield response to weed pressure by corn hybrids differing in canopy architecture. Eur. J. Agron. 2001, 14, 293–302. [Google Scholar] [CrossRef]
  29. Dwyer, L.M.; Andrews, C.J.; Stewart, D.W.; Ma, B.L.; Dugas, J.A. Carbohydrate levels in field-grown leafy and normal maize genotypes. Crop Sci. 1995, 35, 1020–1027. [Google Scholar] [CrossRef]
  30. Andrews, C.J.; Dwyer, L.M.; Stewart, D.W.; Dugas, J.A.; Bonn, P. Distribution of carbohydrate during grainfill in Leafy and normal maize hybrids. Can. J. Plant Sci. 2000, 80, 87–95. [Google Scholar] [CrossRef]
  31. Birch, C.J.; Rickert, K.G.; Hammer, G.L. Modelling leaf production and crop development in maize (Zea mays L.) after tassel initiation under diverse conditions of temperature and photoperiod. Field Crop Res. 1998, 58, 81–95. [Google Scholar] [CrossRef] [Green Version]
  32. Lizaso, J.I.; Batchelor, W.D.; Westgate, M.E. A leaf area model to simulate cultivar-specific expansion and senescence of maize leaves. Field Crop Res. 2003, 80, 1–17. [Google Scholar] [CrossRef]
  33. Pohlert, T. Use of empirical global radiation models for maize growth simulation. Agric. Meteorol. 2004, 126, 47–58. [Google Scholar] [CrossRef]
  34. Van Wart, J.; Kersebaum, K.C.; Peng, S.; Milner, M.; Cassman, K.G. Estimating crop yield potential at regional to national scales. Field Crop Res. 2013, 143, 34–43. [Google Scholar] [CrossRef] [Green Version]
  35. Li, S.K.; Wang, C.T. Potential and Ways to High Yield in Maize; Science Press: Beijing, China, 2010; pp. 15–85. [Google Scholar]
  36. Li, J. Production, breeding and process of maize in China. In Handbook of Maize: Its Biology; Bennetzen, J.L., Hake, S.C., Eds.; Springer: New York, NY, USA, 2009; pp. 563–576. [Google Scholar]
  37. Hou, P.; Liu, Y.E.; Liu, W.M.; Liu, G.Z.; Xie, R.Z.; Wang, K.R.; Ming, B.; Wang, Y.H.; Zhao, R.L.; Zhang, W.J.; et al. How to increase maize production without extra nitrogen input. Resour. Conserv. Recy. 2020, 160, 104913. [Google Scholar] [CrossRef]
  38. Ming, B.; Xie, R.; Hou, P.; Li, L.; Wang, K.; Li, S. Changes of maize planting density in China. Sci. Agric. Sin. 2017, 50, 1960–1972. [Google Scholar]
  39. Hou, P.; Gao, Q.; Xie, R.; Li, S.; Meng, Q.; Kirkby, E.A.; Römheld, V.; Müller, T.; Zhang, F.; Cui, Z.; et al. Grain yields in relation to N requirement: Optimizing nitrogen management for spring maize grown in China. Field Crop Res. 2012, 129, 1–6. [Google Scholar] [CrossRef]
  40. Liu, Y.; Hou, P.; Xie, R.; Hao, W.; Li, S.; Mei, X. Spatial variation and improving measures of the utilization efficiency of accumulated temperature. Crop Sci. 2015, 55, 1806–1817. [Google Scholar] [CrossRef]
  41. Xu, W.; Liu, C.; Wang, K.; Xie, R.; Ming, B.; Wang, Y.; Zhang, G.; Liu, G.; Zhao, R.; Fan, P.; et al. Adjusting maize plant density to different climatic conditions across a large longitudinal distance in China. Field Crop Res. 2017, 212, 126–134. [Google Scholar] [CrossRef]
  42. Zhen, X.; Shao, H.; Zhang, W.; Huo, W.; Batchelor, W.D.; Hou, P.; Wang, E.; Mi, G.; Miao, Y.; Li, H.; et al. Testing a bell-shaped function for estimation of fully expanded leaf area in modern maize under potential production conditions. Crop J. 2018, 6, 527–537. [Google Scholar] [CrossRef]
  43. Liu, G.; Yang, Y.; Liu, W.; Guo, X.; Xue, J.; Xie, R.; Ming, B.; Wang, K.; Hou, P.; Li, S. Leaf removal affects maize morphology and grain yield. Agronomy 2020, 10, 269. [Google Scholar] [CrossRef] [Green Version]
  44. The National Meteorological Information Center of the China Meteorological Administration (CMA). Available online: http://data.cma.cn/ (accessed on 6 November 2017).
  45. Yan, M.; Liu, X.; Zhang, W.; Li, X.; Liu, S. Spatio-temporal changes of ≥10°C accumulated temperature in northeastern China since 1961. Chin. Geogr. Sci. 2011, 21, 17–26. [Google Scholar] [CrossRef]
  46. Jones, C.A.; Kiniry, J.R. CERES-Maize: A Simulation Model of Maize Growth and Development; Texas A&M University Press: College Station, TX, USA, 1986; p. 194. [Google Scholar]
  47. Hocking, R.R. The analysis and selection of variables in linear regression. Biometrics 1976, 32, 1–49. [Google Scholar] [CrossRef]
  48. Pecina-Martínez, J.A.; Mendoza-Castillo, M.C.; López-Santillán, J.A.; Castillo-González, F.; Mendoza-Rodríguez, M. Phenological and morphological response of tamaulipas maize to contrasting environments in México. Agrociencia 2009, 43, 681–694. [Google Scholar]
  49. Cui, M.; Jia, B.; Liu, H.; Kan, X.; Zhang, Y.; Zhou, R.; Li, Z.; Yang, L.; Deng, D.; Yin, Z. Genetic mapping of the leaf number above the primary ear and its relationship with plant height and flowering time in maize. Front. Plant Sci. 2017, 8, 1437. [Google Scholar] [CrossRef] [Green Version]
  50. Freire, A.I.; Dias, K.O.G.; Oliveira, L.B.V.; Nalin, R.S.; Guedes, F.L.; Souza, J.C. Genetic control of the number of leaves above the ear in maize. Genet. Mol. Res. 2015, 14, 1318–1323. [Google Scholar] [CrossRef] [PubMed]
  51. Tsimba, R.; Edmeades, G.O.; Millner, J.P.; Kemp, P.D. The effect of planting date on maize grain yields and yield components. Field Crop Res. 2013, 150, 135–144. [Google Scholar] [CrossRef]
  52. Keating, B.A.; Wafula, B.M. Modelling the fully expanded area of maize leaves. Field Crop Res. 1992, 29, 163–176. [Google Scholar] [CrossRef]
  53. Yakoub, A.; Lloveras, J.; Biau, A.; Lindquist, J.L.; Lizaso, J.I. Testing and improving the maize models in DSSAT: Development, growth, yield, and N uptake. Field Crop Res. 2017, 212, 95–106. [Google Scholar] [CrossRef]
  54. Muchow, R.C.; Carberry, P.S. Environmental control of phenology and leaf growth in a tropically adapted maize. Field Crop Res. 1989, 20, 221–236. [Google Scholar] [CrossRef]
  55. Yang, H.S.; Dobermann, A.; Cassman, K.G.; Walters, D.T. Hybrid-Maize—A Simulation Model for Corn Growth and Yield; University of Nebraska-Lincoln: Lincoln, NE, USA, 2006; p. 67. [Google Scholar]
Figure 1. The spatial distribution of the experimental sites and the locations of the northwestern maize region (NW), northern spring maize region (NM), Huanghuaihai maize region (HM), and the southwestern maize region (SW) in China, as well as maize growth information during the vegetative growth stage. n means number of data samples.
Agriculture 10 00411 g001
Figure 2. The images of maize growing in the fields at some of the experimental sites in different regions. (A) Qitai in NW. (B) Jiling in NM. (C) Mianyang in SW. (D) Xinxiang in HM.
Agriculture 10 00411 g002
Figure 3. Relationships between deviation from the averages of final leaf numbers and leaf numbers above (A) and below (B) the primary ear for each cultivar across all locations. * and ** indicate that the correlation is significant at the p < 0.05 level and p < 0.01 level, respectively; ns means that the correlation is not significant at the p < 0.05 level.
Agriculture 10 00411 g003
Figure 4. The relationships between the final leaf numbers and (A) the maximum leaf area index (LAImax), (B) the above-ground dry matter (DM) at silking, (C) the DM at physiological maturity, and (D) the grain yield for each cultivar across all locations. Markers with different shapes represent different cultivars. ** indicates that the correlation is significant at the p < 0.01 level.
Agriculture 10 00411 g004
Table 1. Climatic conditions and irrigation amount during the vegetative growth stage in the four studied maize-growing regions in 2013–2016.
RegionTmean (°C)Tmax (°C)Tmin (°C)Tr (°C)Rd (MJ m−2)At (°C·day)Ra (MJ m−2)Pd (h)Pre (mm)A-Ir (mm)
NW18.826.411.614.910.11708.1946.214.884.7260
SW21.526.418.08.46.81473.3467.813.6308.345
HM26.731.422.78.68.41489.6467.614.3285.498
NM20.426.514.611.89.21667.7759.814.7219.3145
Note: NW: northwestern maize region; NM: northern spring maize region; HM: Huanghuaihai maize region; SW: southwestern maize region. Tmean: mean daily temperature; Tmax: mean daily maximum temperature; Tmin: mean daily minimum temperature; Tr, diurnal temperature range; Rd: mean daily solar radiation; At: ≥10 °C accumulated temperature; Ra: accumulated solar radiation; Pd: photoperiod; Pre: accumulated precipitation; A-Ir: average irrigation amount.
Table 2. Final leaf numbers of different maize cultivars across all locations during 2013–2016.
CultivarnMeanMinimumMaximumRangeCoefficient of Variation (%)
DH115820.4 a17.023.36.36.1
ZD9586919.7 b16.722.35.67.1
ZD9095819.7 b16.722.05.36.0
NH1016919.2 c16.722.35.66.5
XY3356219.2 c17.022.05.06.0
ALL31619.616.723.36.66.7
Note: means followed by different letters are significantly different at the p < 0.05 level. DH11: denghai11; NH101: nonghua101; XY335: xianyu335; ZD909: zhongdan909; ZD958: zhengdan958. n means number of data samples.
Table 3. Leaf numbers above and below the primary ear and final leaf numbers of different maize cultivars across all locations during 2015 and 2016.
CultivarnLeaf Number Above EarLeaf Number Below EarFinal Leaf Number
MeanRangeCV (%)MeanRangeCV (%)MeanRangeCV (%)
DH11176.3 a5.0–7.711.714.2 a12.7–16.06.120.4 a18.3–21.74.7
ZD958185.4 b4.7–6.38.914.1 a11.7–16.39.419.5 b16.7–21.77.5
ZD909185.9 a5.0–6.710.413.6 a11.7–15.78.119.5 b16.7–22.07.2
NH101186.2 a4.7–7.714.112.7 b11.0–14.36.318.9 b16.7–21.06.1
XY335186.1 a5.0–7.011.312.8 b11.3–14.05.618.9 b17.0–21.05.4
ALL896.04.7–7.712.612.510.0–15.39.319.516.7–22.06.8
Note: means in the same column followed by different letters are significantly different at the p < 0.05 level. CV: coefficient of variation. n means number of data samples.
Table 4. Relationships between final leaf number and climatic factors and growth days during the maize vegetative growth stage.
CultivarTmean (°C)Tmax (°C)Tmin (°C)Tr (°C)Ra (MJ m−2)At (°C·day)Acc-Ra (MJ m−2)Pd (h)Growth Duration (d)
DH11−0.30 *−0.26 *−0.37 **0.36 **0.03 *0.42 **0.45 **0.53 **0.40 **
ZD958−0.07 ns0.01 ns−0.20 ns0.39 **0.51 **0.52 **0.49 **0.76 **0.36 **
ZD909−0.14 ns−0.04 ns−0.29 *0.47 **0.57 **0.53 **0.57 **0.70 **0.40 **
NH101−0.41 **−0.36 **−0.47 **0.43 **0.44 **0.40 **0.54 **0.66 **0.49 **
XY335−0.50 **−0.44 **−0.55 **0.47 **0.32 *0.37 **0.57 **0.54 **0.57 **
ALL−0.25 **−0.18 **−0.33 **0.39 **0.39 **0.46 **0.49 **0.59 **0.42 **
Note: Tmean: mean temperature; Tmax: maximum temperature; Tmin: minimum temperature; Tr: diurnal temperature range; Ra: daily solar radiation; At: ≥10 °C accumulated temperature; Acc-Ra: accumulated solar radiation; Pd: photoperiod. * and ** indicate that correlation is significant at the p < 0.05 level and p < 0.01 level, respectively; ns means that correlation is not significant at the p < 0.05 level.
Table 5. Results of the stepwise regression between final leaf numbers and climatic factors for each maize cultivar during the vegetative growth stage.
CultivarPartial Regression EquationR2Pr > P
DH11y = 1.323x1 + 1.480.29<0.01
ZD958y = 2.058x1 − 3.930.58<0.01
ZD909y = 0.383x1 − 3.130.49<0.01
NH101y = 1.499x1 − 0.123x3 + 1.040.50<0.01
XY335y = 0.978x1 − 0.136x2 + 8.190.43<0.01
ALLy = 1.411x1 − 0.039x4 + 0.0590.36<0.01
Note: Stepwise criteria: probability-of-F-to-enter ≤ 0.05; probability-of-F-to-remove ≥ 0.1. y: final leaf number; x1, x2, x3, and x4 are the photoperiods (h), daily mean temperature (°C), maximum temperature (°C), and minimum temperature (°C), in the vegetative growth stage. Pr > P means that the regression equation is significant at the p < 0.01 level.

