Abstract
An unmanned aerial vehicle (UAV) was used to capture high-resolution aerial images of crop fields. Software-based image analysis was performed to classify land uses. The purpose was to help relevant agencies use aerial imaging in managing agricultural production. This study involves five townships in the Chianan Plain of Chiayi County, Taiwan. About 100 ha of farmland in each township was selected as a sample area, and a quadcopter and a handheld fixed-wing drone were used to capture visible-light images and multispectral images. The survey was carried out from August to October 2018 and aerial photographs were captured in clear and dry weather. This study used high-resolution images captured from a UAV to classify the uses of agricultural land, and then employed information from multispectral images and elevation data from a digital surface model. The results revealed that visible-light images led to low interpretation accuracy. However, multispectral images and elevation data increased the accuracy rate to nearly 90%. Accordingly, such images and data can effectively enhance the accuracy of land use classification. The technology can reduce costs that are associated with labor and time and can facilitate the establishment of a real-time mapping database.
1. Introduction
Remote sensing technology, incorporating a geographical information system, is used globally for land management, agriculture, forestry, environmental protection, and the fishery industry [1,2]. Economic development and social changes have led to increasingly complex land uses, increased damage to the natural environment, and the inappropriate use of land resources, including the unauthorized use of farmlands, inappropriate waste disposal, and the illegal construction of factories. Previous study used satellite imaging, which facilitates large-area detection, real-time monitoring, and therefore the rapid depiction of current conditions and dynamic changes in national territories to obtain basic data for determining land uses. The study collected satellite images of a particular area on appropriate scales and established a system for automatically interpreting them [3]. Currently, surveys on agricultural land areas in Taiwan are mostly conducted manually or through telemetric imaging. However, because telemetric imaging is expensive and cannot be used to acquire real-time images, such surveys often miss the growth period of crops. However, in situ investigations take considerable time, and in mountainous areas, even more time is likely to be required because of terrain variations or roadway-related limita tions. Investigators may have difficulty accessing locations on hillsides; their view may be obstructed, making the results of investigations of crops planted on hillsides less than reliable [4].
Agricultural land use in Taiwan is highly complex and involves mostly intensive farming. A block of land is often planted with two or three types of crops, causing management difficulty for local government. Regardless of yield estimation, disaster loss estimation, and market pricing determination, complete land use data are required. Moreover, environments and climate exert profound effects on agricultural productivity. The risk of natural disasters is high in Taiwan because the island is located in a subtropical region where they occur frequently. Such disasters lead to considerable losses because the government must allocate additional budgets as relief for farmers while they suffer reduced incomes. Agricultural statistics have suggested that meteorological disasters are the main cause of agricultural losses in Taiwan. Of these losses, 70% have been caused by typhoons and 27% by rainfalls, leading to an annual agricultural loss of NT$1–18 billion (US$ 34–620 million) [5]. Therefore, the Taiwanese government has compiled land use data to effectively manage agricultural land. In recent years, researchers have used UAVs to capture high-resolution images to gain information about crop distributions and detailed land cover spectra [6,7,8]. Using computer-based automated interpretation, researchers can obtain data on field crops more rapidly and extensively than before. Tian et al. (2013) analyzed the characteristics of remote sensing images of crops with a high spatial resolution that were obtained using UAVs. They focused on winter wheat and proposed a method for rapidly classifying crops and retrieving relevant data from the spectral characteristics of crops and the threshold value of the normalized difference vegetation index (NDVI). This method is more widely applicable than other frequently used remote sensing classification methods. The results showed that the crop classification information that is captured from UAV images was more accurate and widely applicable than that obtained using earlier investigative approaches [9]. Their method was rapid and low cost. UAV-based aerial imaging is therefore widely used to study large-area crops [7,10].
Studies on land use classification have mostly adopted pixel-based image classification, in which each pixel is classified based on its spectral characteristics. Because crops exhibit similar spectral characteristics, identifying multiple crops from a single pixel is highly difficult. Consequently, pixels with different crops might be classified as the same category. Pixel-based classification also overlooks ground objects with spatial characteristics, which reduces classification accuracy [11]. Lin et al. (2015) used fixed-wing UAVs to capture high-resolution aerial images of rice and citrus crops in Miaoli, Taiwan and generated high-resolution orthophotos and a digital surface model (DSM) using a Pix4D mapper. They performed geometric corrections and used overlaid cadastral maps, which were useful for subsequent study. They also used cartographic data and multiple overlays to establish identification technology for a remote aerial imaging-based geographic information system [12]. They thus obtained relevant basic information and developed a system for identifying crop damage caused by natural disasters to evaluate the applicability of their approaches to investigating such damage. Kuo (2016) used UAVs to monitor farmland use, converted raw images into mosaic images, and added patterns and elevation to the images to improve classification accuracy [13]. The maximum likelihood method was used for classification; statistical probability-based methods were used to determine similarities between the population and samples [14]. For example, the single feature probability (SFP) was used, and the accuracy of the results depended on the selection of training samples. Finally, ground truth data were used to confirm the classification accuracy [11].
UAVs have been widely used for research in various fields [15,16,17]. Conventional aerial imaging can collect data over a large area, but the method is limited by low mobility, high cost, and a dependence on favorable weather conditions [8]. By contrast, UAVs feature simple controls, require low costs, and are highly mobile with the ability to take off anywhere [18,19]. Because different crops have similar spectral characteristics, a DSM constructed using UAV images was employed in the present study to enhance the classification accuracy. In addition to multispectral images taken using the UAV, we introduced elevation data to supplement the shortcomings of classification solely based on spectral characteristics. In this work, images were obtained using UAVs and interpreted to classify land uses, and object-based image classification was employed by considering the relationship between neighboring pixels to treat blocks with similar characteristics as objects and the smallest unit of classification, thereby increasing the classification accuracy [8,20]. Aerial and multispectral images were overlaid to enable the real-time analysis of related agriculture field management, reducing agricultural yield losses.
2. Methods
2.1. Research Sites
The research sites were in Chiayi County because the Tropic of Cancer passes through it, and its climate is tropical and humid. High temperatures all year round and long hours of sun irradiation provide favorable conditions for crop growth. Therefore, Chiayi County is a crucial agricultural region of Taiwan and frequently suffers typhoon- and heavy rainfall-related disasters. Specifically, the research sites were in five townships in the plain area in Chiayi, which were Lucao, Minxiong, Xingang, Budai, and Yizhu (Figure 1). The area of each sampling site was 100–115 ha. The sampling sites in Lucao, Minxiong, and Xingang were primarily rice-planting areas, with a few dry farms that planted other grains, vegetables, and pineapple. The sampling sites in Budai and Yizhu were adjacent to the coast, and most of their areas were comprised fish farms, with only a few dry farms and forest lands.
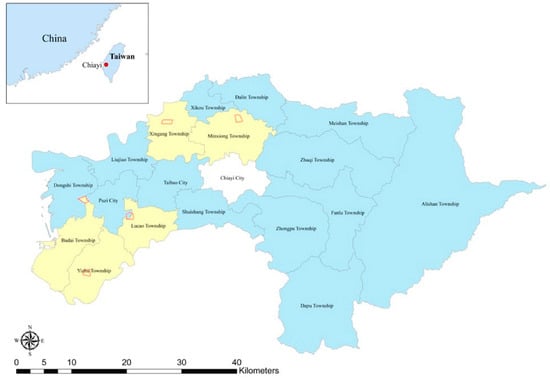
Figure 1.
Distribution of sampling sites.
2.2. Photographing Tools
Aerial imaging was performed from April to October 2018, using two UAVs—a DJI Phantom 4 Pro and a Parrot DISCO AG. The DJI Phantom 4 Pro mainly captured orthophotos of the sampling sites with a ground resolution of 3.10–3.20 cm at a height of approximately 120 m. Equipped with a Sequoia lens, the Parrot DISCO AG captured near infrared (NIR) to determine whether the group surface was covered by vegetation. Images with a ground resolution of 7.33–8.74 cm were captured at a height of approximately 120 m. Since the sampling site in Xingang was close to an airport, the image capturing height in that region was 60 m, which is the flight height limit there. The ground resolution of these orthophotos was 1.65–1.69 cm.
2.3. Research Procedure
After UAVs were dispatched to the sampling sites for aerial imaging surveys, crop growth images were captured, and Pix4Dmapper, an image processing and analysis software program, was used to perform geographical alignment and to orthorectify the raw aerial images. High-resolution orthophotos and a DSM were produced. These data were then imported into the ESRI ArcGIS version 10.0 and overlaid with a cadastral map to generate cartographic materials with coordinates, which provided a basis for subsequent investigations. Image classification methods can be categorized into supervised, unsupervised, and mixed classification methods. The supervised classification method was used in this study. According to the classification method employed in previous studies [11,20], we overlaid orthophotos (RGB), multispectral images (NIR), and the DSM. Various types of land cover were delineated in the training samples, and the spectral characteristics of the training samples provided a reference for interpretation for image classification. The maximum likelihood method and SFP was adopted for image classification and interpretation [21,22]. Following an accuracy assessment, interpretation results were produced (Figure 2). These results can be used in agricultural production management and post-disaster surveys. This method was confirmed as reliable in a previous study [23,24].
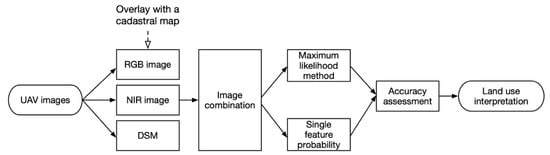
Figure 2.
Research flowchart.
2.4. Maximum Likelihood Method
The maximum likelihood method is a type of supervised classifier for probability calculation [23]. First, classification must be performed across an entire image, followed by the selection of training samples with separability (clustering of similar items and separation of differing items), which significantly affects the classification result. Therefore, training samples must be selected cautiously. The basis of classification through maximum likelihood estimation is to assume that the distribution of eigenvalues in each category is normal [11].
2.5. Single Feature Probability
Images often contain mixed pixels that are homogenous but exhibit different spectral characteristics or pixels that are heterogenous but exhibit similar spectral characteristics. Such pixels often affect the results of pixel-based classification. Object-based classification can reduce the classification error caused by mixed pixels [11]. Single feature probability can be used to define the spectral characteristics and patterns of pixels in training samples. Next, Bayesian classification can be used to determine the probability of a pixel belonging to a category; this probability value ranges between 0 and 1, with a value approaching 1 indicating a high probability of the pixel belonging to the category in question [25].
2.6. Accuracy Assessment
To determine the interpretation accuracy, an error matrix is often used in image classification [23]. The results of image interpretation were compared with ground truth data (reference data) that were obtained in field surveys, and an error matrix was used to assess the results (Table 1). The columns of the error matrix indicate the types of land cover, determined by computer-based interpretation and classification, while the rows provide the actual results related to land cover. Four assessment indices were evaluated using the error matrix [26]; they were the producer’s accuracy, the user’s accuracy, the overall accuracy, and the Kappa value [14,27]:

Table 1.
Error matrix.
- (1)
- Producer’s accuracy: This is the accuracy of classification of ground-truth reference data. It is obtained by dividing the number of correctly classified samples by the total number of samples in the corresponding reference data.
- (2)
- User’s accuracy: This refers to the accuracy of classification of actual land cover based on computed-based interpretation. It is calculated by dividing the number of correctly classified samples in a specific type by the total number of sample types.
- (3)
- Overall accuracy: This is the most straightforward and general parameter and is obtained by dividing the number of samples on the diagonal of the matrix by the total number of samples. This index weights the types of land use, so the results are relatively objective. A higher overall accuracy corresponds to a more accurate interpretation result.
- (4)
- Kappa value: This index compares computer classification with random classification and calculates the percentage by which the errors of the former is lower than that of the latter. In general, the Kappa value ranges between 0 and 1; a high value indicates high similarity between the two classifications and therefore a highly accurate computer-based interpretation.
Since determining the overall accuracy involves the weights of the individual types and the Kappa value considers the relationship between commission error and omission error, the classification results were evaluated herein using overall accuracy assessments and the Kappa value.
3. Results
3.1. Analysis of Land Use Interpretation at the Lucao Sampling Site
After ArcGIS 10.0 was used to delineate the healthy and diseased crops in the training sample, the land cover at the Lucao sampling site was classified into five types—rice fields, grain and vegetable fields, buildings and wastelands, cemeteries, and roads. Following image classification and interpretation, the ground truth data that were obtained through field surveys were compared with the results of image interpretation to obtain the classification accuracy. The orthophoto that was captured on August 17 covered 145 ha with a ground resolution of 3.15 cm. The overall accuracy of interpretation was 74% and the Kappa value was 0.546 (Figure 3). The error matrix (Table S1) reveals that the interpretation accuracy was the highest for buildings and the lowest for grain and vegetable fields. The researchers inferred that since part of the second rice crop had begun to grow at the time of imaging, grain and vegetable fields were easily identified as rice fields, resulting in misinterpretation.
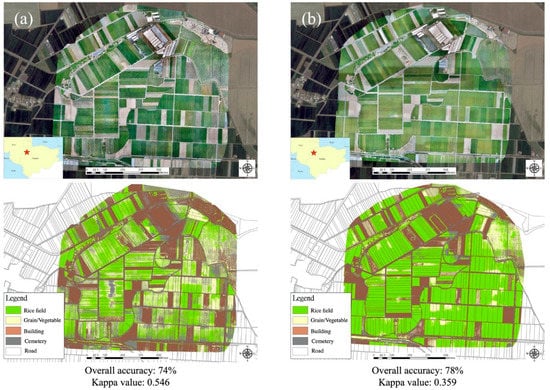
Figure 3.
Interpretation accuracy at the Lucao sampling site. The orthophoto captured on (a) 17 August 2018; (b) 28 September 2018.
The image of the Lucao sampling site that was captured on September 28 covered 138 ha with a ground resolution of 3.18 cm. The overall accuracy of interpretation was 78% and the Kappa value was 0.359 (Figure 3). The error matrix (Table S2) reveals that rice fields, wastelands, and buildings had high classification accuracies, with an overall user′s accuracy of 83%. Grains and vegetables had the lowest interpretation accuracy. At the time of imaging, the second rice crop had just begun sprouting; therefore, the color of the rice fields differed significantly from those of nearby land cover, facilitating accurate interpretation. However, a small fraction of the rice field was mistakenly identified as grain and vegetable fields.
To determine whether different image bands and elevations can improve the interpretation accuracy, we combined NIR images with the DSM and discovered that the overall accuracy increased slightly (to 80–83%) when NIR image bands were included to classify the August and September images. The overall accuracy was considerably increased to 88–90% when the DSM elevation data were incorporated (Table 2).
Table 2.
Accuracy assessment results for three image composites at the Lucao sampling site.
3.2. Analysis of Land Use Interpretation at the Minxiong Sampling Site
After ArcGIS 10.0 was used to delineate the training sample, the land cover at the Minxiong sampling site was classified into five types—rice fields, grain and vegetable fields, pineapple fields, greenhouses and buildings, and vacant lot. Following image classification and interpretation, the ground truth data that were obtained through field surveys were compared with the results of image interpretation to evaluate the classification accuracy. The orthophoto that was captured on 7 September covered 151 ha with a ground resolution of 3.16 cm. The overall accuracy of interpretation was 76% and the Kappa value was 0.448 (Figure 4). The error matrix (Table S3) shows that the interpretation accuracy was the highest for rice fields, with a user′s accuracy of 97%. However, the interpretation accuracy was lowest for pineapple fields. The researchers inferred that at the time of imaging, the second rice crop had been growing for a considerable period, and the color spectrum of the rice field could be clearly distinguished from that of other types of land cover, supporting a relatively high accuracy of interpretation. However, since most of the pineapples in the pineapple fields at the sampling site had been recently harvested, the remaining bare soil resulted in the misidentification of pineapple fields as other types of land cover.
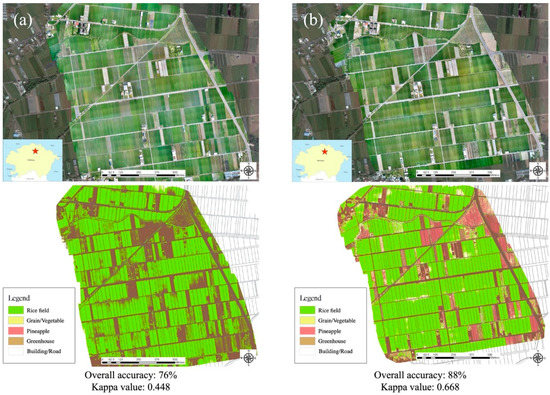
Figure 4.
Interpretation accuracy at the Minxiong sampling site. The orthophoto captured on (a) 7 September 2018; (b) 5 October 2018.
The image of the Minxiong sampling site that was captured on 5 October covered 141 ha with a ground resolution of 3.22 cm. The overall accuracy of interpretation was 78%, and the Kappa value was 0.359 (Figure 4). The error matrix (Table S4) reveals that the rice fields and pineapple fields had high interpretation accuracies, with a user′s accuracy of approximately 100%. Vacant lot had the lowest interpretation accuracy, with a high probability of misidentification as either pineapple fields or greenhouses or buildings. Since no cultivation was observed in the vacant lot at that time, the color of the bare soil in this vacant lot was similar to that of the bare soil in the pineapple fields and that of the rooftops of the greenhouses or buildings, leading to misidentification.
The classification accuracy of the RGB orthophotos from the Minxiong sampling site was satisfactory (76–88%) without the NRI image band and DSM elevation data. After the NIR image band data were added, the classification rates of the September and October images increased to nearly 90% (82–89%). Incorporating the DSM elevation data further increased the overall accuracy to above 90% (Table 3).
Table 3.
Accuracy assessment results for three image composites at the Minxiong sampling site.
3.3. Analysis of Land Use Interpretation at Xingang Sampling Site
The Xingang sampling site is located close to Chiayi Airport where airspace is controlled. The Civil Aeronautics Administration restricts the flight altitude to 60 m. After ArcGIS 10.0 was used to delineate the training sample, the land cover at the Xingang sampling site was classified into four types—rice fields, grain and vegetable fields, greenhouses and buildings, and vacant lot and roads. Following image classification and interpretation, the ground truth data that were obtained in field surveys were compared with the results of image interpretation to evaluate the classification accuracy. The orthophoto that was captured on September 13 covered 127 ha with a ground resolution of 1.65 cm. The overall accuracy of interpretation was 74% and the Kappa value was 0.555 (Figure 5). The error matrix (Table S5) reveals that the interpretation accuracy is the highest for buildings and greenhouses (94%), followed by rice fields (82%). At the time of imaging, most of the second rice crop was in the growth stage, and some of the fields lay fallow or had been planted with other crops; accordingly, the spectral variation among land cover types was conspicuous, and the interpretation accuracy was considerable.
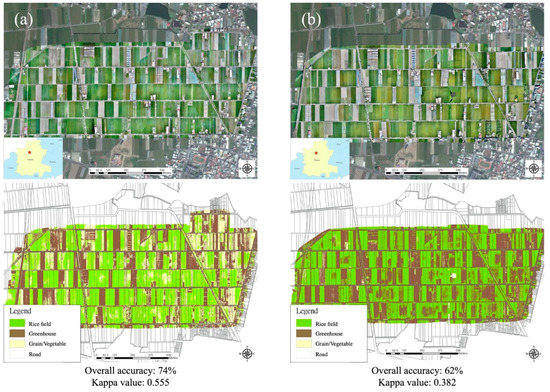
Figure 5.
Interpretation accuracy at the Xingang sampling site. The orthophoto captured on (a) 13 September 2018; (b) 26 October 2018.
The image of the Xingang sampling site that was captured on 26 October covered 120 ha with a ground resolution of 1.62 cm. The overall accuracy of interpretation was 62% and the Kappa value was 0.382 (Figure 5). The error matrix (Table S6) shows that buildings and greenhouses had the highest interpretation accuracy, with a user′s accuracy of 100%. Vacant lot had the lowest interpretation accuracy, with a user′s accuracy of less than 1%. The imaging was performed more than one month after the previous image capturing session. Both rice and grain and vegetable fields showed abundant plant growth; therefore, parts of the grain and vegetable fields were misidentified as rice fields. The colors of the bare soil in the vacant lot and the grain and vegetable fields were close to those of the nearby buildings and greenhouses, so the vacant lot and grain and vegetable fields were easily misidentified as buildings or greenhouses.
To determine whether image band and elevation information can improve the classification accuracy, the RGB, NIR, and DSM images were combined to form different image composites. The results revealed that when the NIR image band data were added, the overall accuracy slightly increased (to 80% and 81%). Incorporating the DSM elevation data further increased the overall accuracy to 85–87% (Table 4).
Table 4.
Accuracy assessment results for three image composites at the Xingang sampling site.
3.4. Analysis of Land Use Interpretation at the Budai Sampling Site
The Budai sampling site is located close to the coast. After ArcGIS 10.0 was used to delineate the training sample, the land cover at the Budai Xingang sampling site was classified into five types—fish farms, empty ponds, woodlands, vacant lot, and buildings. Following image classification and interpretation, the ground truth data that were obtained through field surveys were compared with the results of image interpretation to evaluate the classification accuracy. The orthophoto that was captured on September 6 covered 126 ha with a ground resolution of 3.12 cm. The overall accuracy of interpretation was 86% and the Kappa value was 0.783 (Figure 6). The error matrix (Table S7) reveals that at the time of imaging, all fish farms were filled with water, so empty ponds were excluded from consideration. Vacant lot had the highest interpretation accuracy, with a user’s accuracy of 93%. Buildings had the lowest user′s accuracy. At the time of imaging, since some spaces were being weeded or rearranged, and because the colors of the fish farms and woodlands differed greatly, misinterpretation was relatively unlikely.
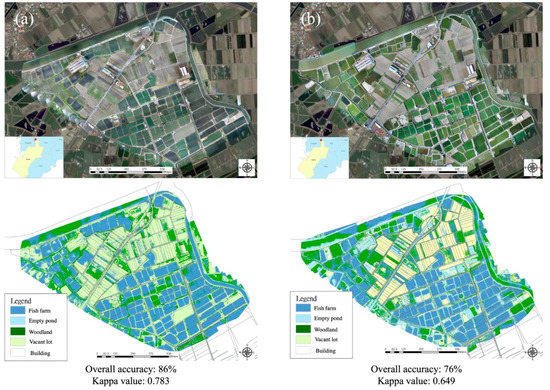
Figure 6.
Interpretation accuracy at the Budai sampling site. The orthophoto captured on (a) 6 September 2018; (b) 15 October 2018.
The orthophoto that was captured on 15 October covered 134 ha with a ground resolution of 3.23 cm. The overall accuracy of interpretation was 76% and the Kappa value was 0.649 (Figure 6). In the error matrix (Table S8), vacant lot had the highest user′s accuracy of any land cover type (99%), followed by fish farms (80%). Buildings had the lowest interpretation accuracy possibly because the color of the building rooftops was close to that of the bottom of empty ponds.
Because multiple fish farms were present in the Budai sampling sites, they were frequently misclassified as empty spaces in RGB images. After the NIR image band data were added, the overall classification accuracy of the September image increased to over 90% (91%). Adding the DSM elevation data further increased the overall classification accuracy of the September and October images to 88–94% (Table 5).
Table 5.
Accuracy assessment results for three image composites at the Budai sampling site.
3.5. Analysis of Land Use Interpretation at the Yizhu Sampling Site
The Yizhu sampling site is located near the coast. After ArcGIS 10.0 was used to delineate the training sample, the land cover at the Budai Xingang sampling site was classified into five types—fish farms or irrigation channels, buildings, rice fields, empty ponds or wasteland, and roads and vacant lot. Following image classification and interpretation, the ground truth data that were obtained through field surveys were compared with the results of image interpretation to evaluate the classification accuracy. The orthophoto that was captured on August 10 covered 134 ha with a ground resolution of 3.16 cm. The overall accuracy of interpretation was 60% and the Kappa value was 0.387 (Figure 7). The error matrix (Table S9) indicates that of all land cover types, empty ponds or wastelands had the highest interpretation accuracy with a user′s accuracy of 90%. Fish farms had the lowest interpretation accuracy (19%). Fish farms were mostly misidentified as empty ponds or wastelands, because the color spectrum of fish farms at the time of imaging was close to that of wastelands.
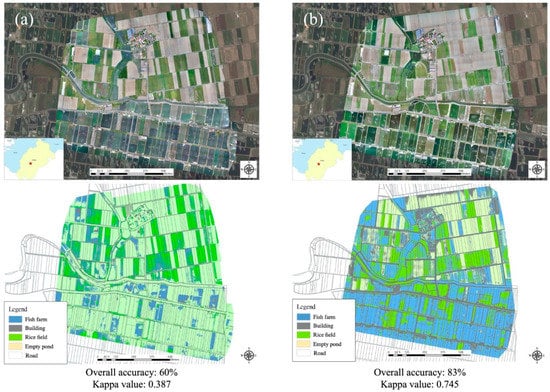
Figure 7.
Interpretation accuracy at the Yizhu sampling site. The orthophoto captured on (a) 10 August 2018; (b) 21 September 2018.
The orthophoto of the Yizhu sampling site that was captured on 21 September covered 132 ha with a ground resolution of 3.12 cm. The overall interpretation accuracy was 83% and the Kappa value was 0.745 (Figure 7). According to the error matrix (Table S10), fish farms had the highest interpretation accuracy, with a user′s accuracy of 91%, whereas rice fields had a relatively low interpretation accuracy, with a user′s accuracy of 74%. The color spectrum of fish farms/wasteland was inferred to be considerably more different from that of rice fields in the photograph taken at this time than in the image that was captured in the previous month, yielding a higher interpretation accuracy.
The Yizhu sampling site had a mix of fish and agricultural farms, and the fish farms in the RGB images were frequently misclassified as paddy fields. When the NIR image band data were added, the overall accuracy of the September image increased to over 90% (94%). Adding the DSM elevation data also increased the accuracy of the September and October images to over 90% (92–96%; Table 6).
Table 6.
Accuracy assessment results for three image composites at the Yizhu sampling site.
4. Discussion
According to the aforementioned analysis results, the following conclusions and recommendations were provided as a reference for subsequent research.
- The interpretation results for the five sampling sites demonstrated that of the images that were captured from August to October, those had high interpretation accuracies. Moreover, interpretation accuracy varied with the environmental features of the sampling sites; even at a single sampling site, interpretation accuracy varied among crop growth stages.
- The classification accuracy of RGB images was unsatisfactory (60–88%). However, after the NIR image band data were added, the classification accuracy increased to over 80%. Adding the DSM elevation data further improved the accuracy to approximately 90%. Therefore, multispectral and elevation data were verified to effectively enhance the accuracy of land use classification. This result showed that RGB image classification is often prone to the “salt and pepper effect”, which can be ameliorated by the inclusion of multispectral images. This is because the RGB image spectrum classification accuracy is low, and such images lack the NIR image band data to improve the separability of land coverage type. These findings are consistent with past studies [11,18,28,29].
- Adding different types of image information exerts distinct effects in land use classification. For example, paddy fields and water bodies exhibit highly similar characteristics, often leading to misclassification. However, the addition of DSM elevation data helps distinguish these two types of land. In addition, buildings with green roofs are likely to be misinterpreted as vegetation cover. Adding NIR image band and DSM elevation data can effectively distinguish between such buildings and vegetation. When lacking DSM elevation data, misclassification often occurs because of the lack of the interpretations of terrain height and plant height [15,16]. When multiple types of images are integrated, such as multispectral images and elevation images, the accuracy of the classification of land cover increases [30].
- Paddy fields and fish farms are easily misclassified because of the presence of water on the land surface. In this study, the addition of NIR image band data did not prevent fish farms from being misclassified as paddy fields. This is attributable to how fish farms contain various aquatic plants and algae that are difficult to distinguish using multispectral images. However, this problem can be addressed through the addition of elevation data [20,31]. In addition, water bodies reflect light, which can lead to errors in image interpretation. Thus, we suggest that researchers avoid capturing images at noon to reduce direct light reflection from water.
- The image classification tool ArcGIS 10.0 was used to identify land uses. This tool performs classification and interpretation by the color of each cell, using the known spectra in delineated training samples to determine other parts of the image. However, since different land cover types can yield similar spectra, misinterpretation is possible. For example, a vegetable field can be misidentified as an open space owing to the bare soil in the field. The interpretation results were relatively accurate only when the crops were flourishing; newly planted seedlings were too small to be effectively classified by computer interpretation [32]. Therefore, to increase the interpretation accuracy, crop samples at various growth stages should be used for computer learning.
5. Conclusions
In this study, high-resolution UAV images were used in combination with multispectral image and DSM elevation data to perform land use classification. The results verified that the proposed method effectively enhanced classification accuracy. While UAV technology continues to mature, the costs and barriers to entry of UAV operations are decreasing, and the application of relevant technology in agriculture is becoming increasingly prevalent. The decrease in the number of workers in the agricultural industry renders UAV technology an effective tool for agricultural land management by local governments and for research by academia to promote precision agriculture, which focuses on high efficiency, food safety, and risk prevention.
Supplementary Materials
The following are available online at https://www.mdpi.com/2077-0472/10/9/416/s1, Table S1 Error Matrix of the Lucao Sampling site on 17 August; Table S2 Error Matrix of the Lucao Sampling site on 28 September; Table S3 Error Matrix of the Minxiong Sampling site on 7 September; Table S4 Error matrix of the Minxiong Sampling site on 5 October; Table S5 Error Matrix of the Xingang Sampling site on 13 September; Table S6 Error Matrix of the Xingang Sampling site on 26 October; Table S7 Error Matrix of the Budai Sampling site on 6 September; Table S8 Error Matrix of the Budai Sampling site on 15 October; Table S9 Error Matrix of the Yizhu Sampling site on 10 August; Table S10 Error Matrix of the Yizhu Sampling site on 21 September.
Author Contributions
Conceptualization, Y.-C.C.; Data curation, P.-C.C.; Funding acquisition, Y.-C.C.; Investigation, P.-C.C.; Methodology, P.-Y.W.; Writing—original draft, P.-Y.W. and Y.-C.C.; Writing—review and editing, P.-Y.W. All authors have read and agreed to the published version of the manuscript.
Funding
This research was funded by Chiayi County Government of Taiwan (#106GJ821C3).
Acknowledgments
This paper was presented on the 2018 International Consortium of Landscape and Ecological Engineering (ICLEE) 9th Conference and selected as the Best Paper Award.
Conflicts of Interest
The authors declare no conflict of interest.
References
- Comber, A.; Fisher, P.; Brunsdon, C.; Khmag, A. Spatial analysis of remote sensing image classification accuracy. Remote Sens. Environ. 2012, 127, 237–246. [Google Scholar] [CrossRef]
- Thorp, K.R.; Tian, L.F. A review on remote sensing of weeds in agriculture. Precis. Agric. 2004, 5, 477–508. [Google Scholar] [CrossRef]
- Wu, C.C. Study on Land Utilizes and Changes by Satellite Image Automation Classification. Master’s Thesis, The National Cheng Kung University, Tainan, Taiwan, 2007. Unpublished. [Google Scholar]
- Lee, R.Y.; Ou, D.Y.; Hsu, C.H. Utilizing unmanned aerial vehicle images to interpret crop types in the hillside area. ISPRS J Photogramm. Remote Sens. 2018, 23, 245–256. [Google Scholar]
- Council of Agriculture, Executive Yuan. Agriculture Statistics Yearbook. 2019; Taipei. Available online: https://agrstat.coa.gov.tw/sdweb/public/book/Book.aspx (accessed on 2 September 2020).
- Liu, S.; Li, L.; Gao, W.; Zhang, Y.; Liu, Y.; Wang, S.; Lu, J. Diagnosis of nitrogen status in winter oilseed rape (Brassica napus L.) using in-situ hyperspectral data and unmanned aerial vehicle (UAV) multispectral images. Comput. Electron. Agric. 2018, 151, 185–195. [Google Scholar] [CrossRef]
- Torres-Sánchez, J.; Peña, J.M.; de Castro, A.I.; López-Granados, F. Multi-temporal mapping of the vegetation fraction in early-season wheat fields using images from UAV. Comput. Electron. Agric. 2014, 103, 104–113. [Google Scholar] [CrossRef]
- Ma, L.; Li, M.; Ma, X.; Cheng, L.; Du, P.; Liu, Y. A review of supervised object-based land-cover image classification. ISPRS J. Photogramm. Remote Sens. 2017, 130, 277–293. [Google Scholar] [CrossRef]
- Tian, Z.K.; Fu, Y.Y.; Liu, S.H.; Liu, F. Rapid crops classification based on UAV low-altitude remote sensing. Trans. Chin. Soc. Agric. Eng. 2013, 29, 109–116. [Google Scholar]
- Bryson, M.; Reid, A.; Ramos, F.; Sukkarieh, S. Airborne vision-based mapping and classification of large farmland environments. J. Field Robot 2015, 27, 632–655. [Google Scholar] [CrossRef]
- Yang, M.D.; Huang, K.S.; Kuo, Y.H.; Hui, T.; Lin, L.M. Spatial and spectral hybrid image classification for rice lodging assessment through UAV imagery. Remote Sens. 2017, 9, 583. [Google Scholar] [CrossRef]
- Lin, F.Y.; Chang, S.C.; Feng, Y.Y.; Chen, Y.W. Evaluation for Application of Sensing Technology to Monitor on Agricultural Loss. In Proceedings of the Symposium on Agricultural Engineering and Automation Project Achievements, Taipei, Taiwan, 1 March 2015. [Google Scholar]
- Kuo, Y.H. Application of UAV Images to Cultivated Field Classification. Master′s Thesis, The National Chung Hsing University, Taichung, Taiwan, 2011. Unpublished. [Google Scholar]
- Congalton, R.G. A review of assessing the accuracy of classifications of remotely sensed data. Remote Sens. Env. 1991, 37, 35–46. [Google Scholar] [CrossRef]
- Al-Najjar, H.A.H.; Kalantar, B.; Pradhan, B.; Saeidi, V.; Halin, A.A.; Ueda, N.; Mansor, S. Land cover classification from fused DSM and UAV images using convolutional neural networks. Remote Sens. 2019, 11, 1461. [Google Scholar] [CrossRef]
- Michez, A.; Piégay, H.; Lisein, J.; Claessens, H.; Lejeune, P. Classification of riparian forest species and health condition using multi-temporal and hyperspatial imagery from unmanned aerial system. Environ. Monit. Assess. 2016, 188, 146. [Google Scholar] [CrossRef] [PubMed]
- Torres-Sánchez, J.; López-Granados, F.; Peña, J.M. An automatic object-based method for optimal thresholding in UAV images: Application for vegetation detection in herbaceous crops. Comput. Electron. Agric. 2015, 114, 43–52. [Google Scholar] [CrossRef]
- Hunt, E.R., Jr.; Hively, W.D.; Fujikawa, S.J.; Linden, D.S.; Daughtry, C.S.T.; McCarty, G.W. Acquisition of NIR-green–blue digital photographs from unmanned aircraft for crop monitoring. Remote Sens. 2010, 2, 290–305. [Google Scholar] [CrossRef]
- Kalantar, B.; Mansor, S.B.; Sameen, M.I.; Pradhan, B.; Shafri, H.Z.M. Drone-based land-cover mapping using a fuzzy unordered rule induction algorithm integrated into object-based image analysis. Int. J. Remote Sens. 2017, 38, 2535–2556. [Google Scholar] [CrossRef]
- Yang, M.D.; Huang, K.S.; Wan, J.; Tsai, H.P.; Lin, L.M. Timely and quantitative damage assessment of oyster racks using UAV images. IEEE J. Sel. Top. Appl. Earth Obs. Remote Sens. 2018, 11, 2862–2868. [Google Scholar] [CrossRef]
- Hubert-Moy, L.; Cotonnec, A.; Le Du, L.; Chardin, A.; Pérez, P. A comparison of parametric classification procedures of remotely sensed data applied on different landscape units. Remote Sens. Environ. 2001, 75, 174–187. [Google Scholar] [CrossRef]
- Peña-Barragán, J.M.; López-Granados, F.; García-Torres, L.; Jurado-Expósito, M.; Sánchez de La Orden, M.; García-Ferrer, A. Discriminating cropping systems and agro-environmental measures by remote sensing. Agron. Sustain. Dev. 2008, 28, 355–362. [Google Scholar] [CrossRef]
- Lillesand, T.M.; Kiefer, R.W. Remote Sensing and Image Interpretation, 5th ed.; John Wiley & Sons: New York, NY, USA, 2004. [Google Scholar]
- Lin, G.C. Factors and integrated managements of rice blast disease in Yunlin, Chiayi, and Tainan region. Tainan Agric. News 2014, 87, 22–25. [Google Scholar]
- Jovanovic, D.; Govedarica, M.; Sabo, F.; Bugarinovic, Z.; Novovic, O.; Beker, T.; Lauter, M. Land cover change detection by using Remote Sensing—A Case Study of Zlatibor (Serbia). Geogr. Pannonica. 2015, 19, 162–173. [Google Scholar] [CrossRef]
- McGwire, K.C.; Fisher, P. Spatially Variable Thematic Accuracy: Beyond the Confusion Matrix. In Spatial Uncertainty in Ecology: Implications for Remote Sensing and GIS Applications; Hunsaker, C.T., Goodchild, M.F., Friedl, M.A., Case, T.J., Eds.; Springer: New York, NY, USA, 2001; pp. 308–329. [Google Scholar]
- Congalton, R.G.; Green, K. Assessing the Accuracy of Remotely Sensed Data: Principles and Practices; Lewis Publishers: Boca Raton, FL, USA, 1999. [Google Scholar]
- Liu, T.; Abd-Elrahman, A. Multi-view object-based classification of wetland land covers using unmanned aircraft system images. Remote Sens. Environ. 2018, 216, 122–138. [Google Scholar] [CrossRef]
- Feng, Q.; Liu, J.; Gong, J. UAV Remote sensing for urban vegetation mapping using random forest and texture analysis. Remote Sens. 2015, 7, 1074–1094. [Google Scholar] [CrossRef]
- Baron, J.; Hill, D.J.; Elmiligi, H. Combining image processing and machine learning to identify invasive plants in high-resolution images. Int. J. Remote Sens. 2018, 39, 5099–5118. [Google Scholar] [CrossRef]
- Meyer, G.E.; Neto, J.C. Verification of color vegetation indices for automated crop imaging applications. Comput. Electron. Agric. 2008, 63, 282–293. [Google Scholar] [CrossRef]
- Zheng, H.; Cheng, T.; Zhou, M.; Li, D.; Yao, X.; Tian, Y.; Cao, W.; Zhu, Y. Improved estimation of rice aboveground biomass combining textural and spectral analysis of UAV imagery. Precis. Agric. 2019, 20, 611–629. [Google Scholar] [CrossRef]


© 2020 by the authors. Licensee MDPI, Basel, Switzerland. This article is an open access article distributed under the terms and conditions of the Creative Commons Attribution (CC BY) license (http://creativecommons.org/licenses/by/4.0/).