Crop Productivity and Climatic Conditions: Evidence from Hungary


Abstract
:1. Introduction
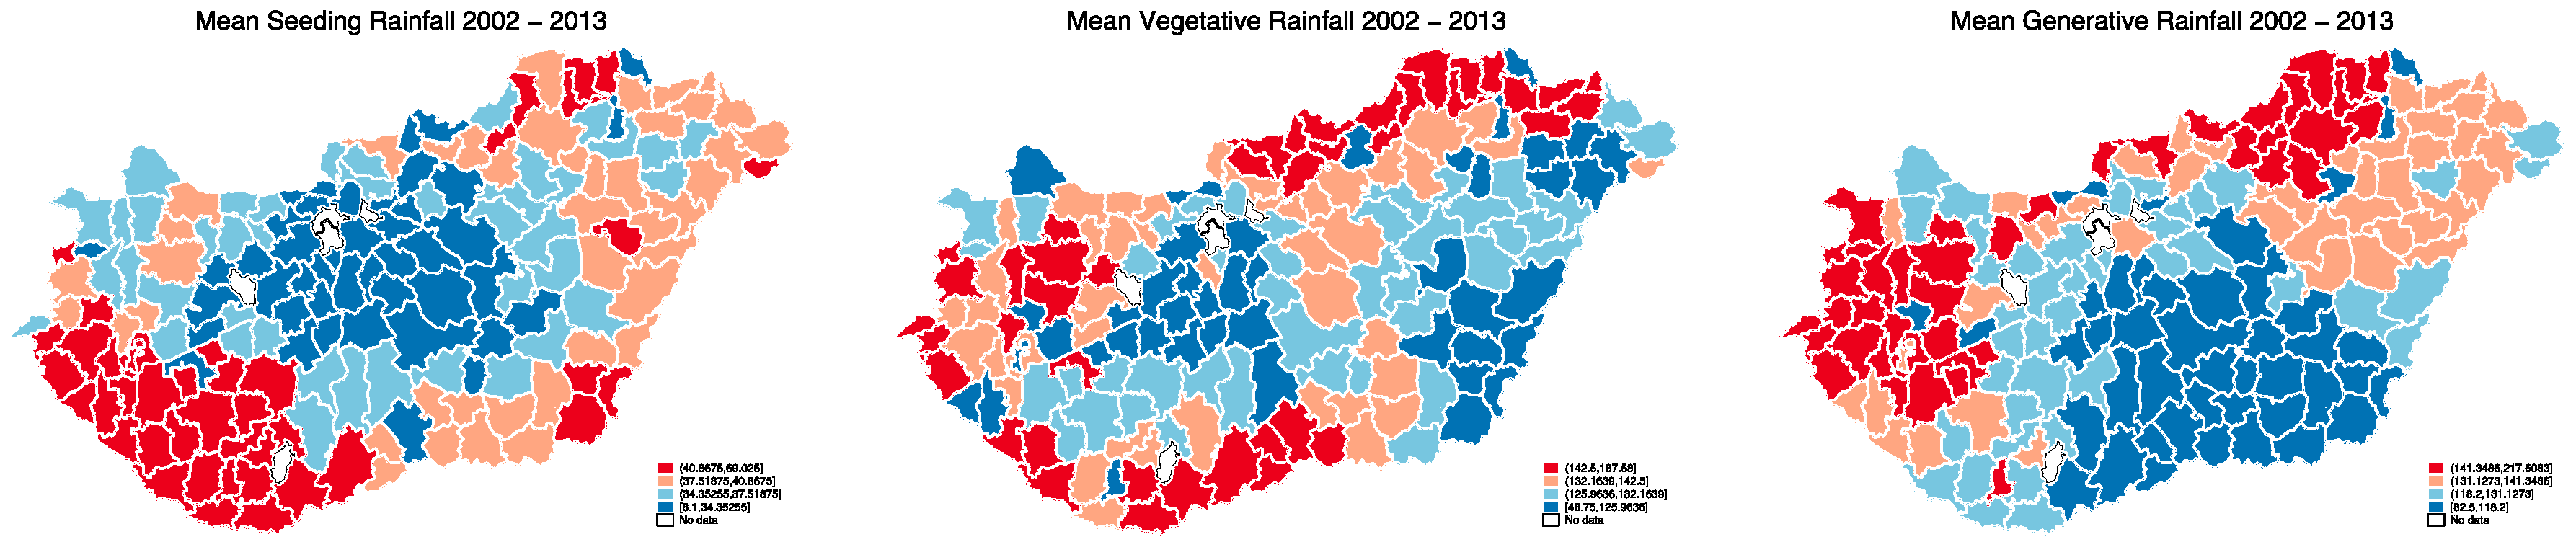
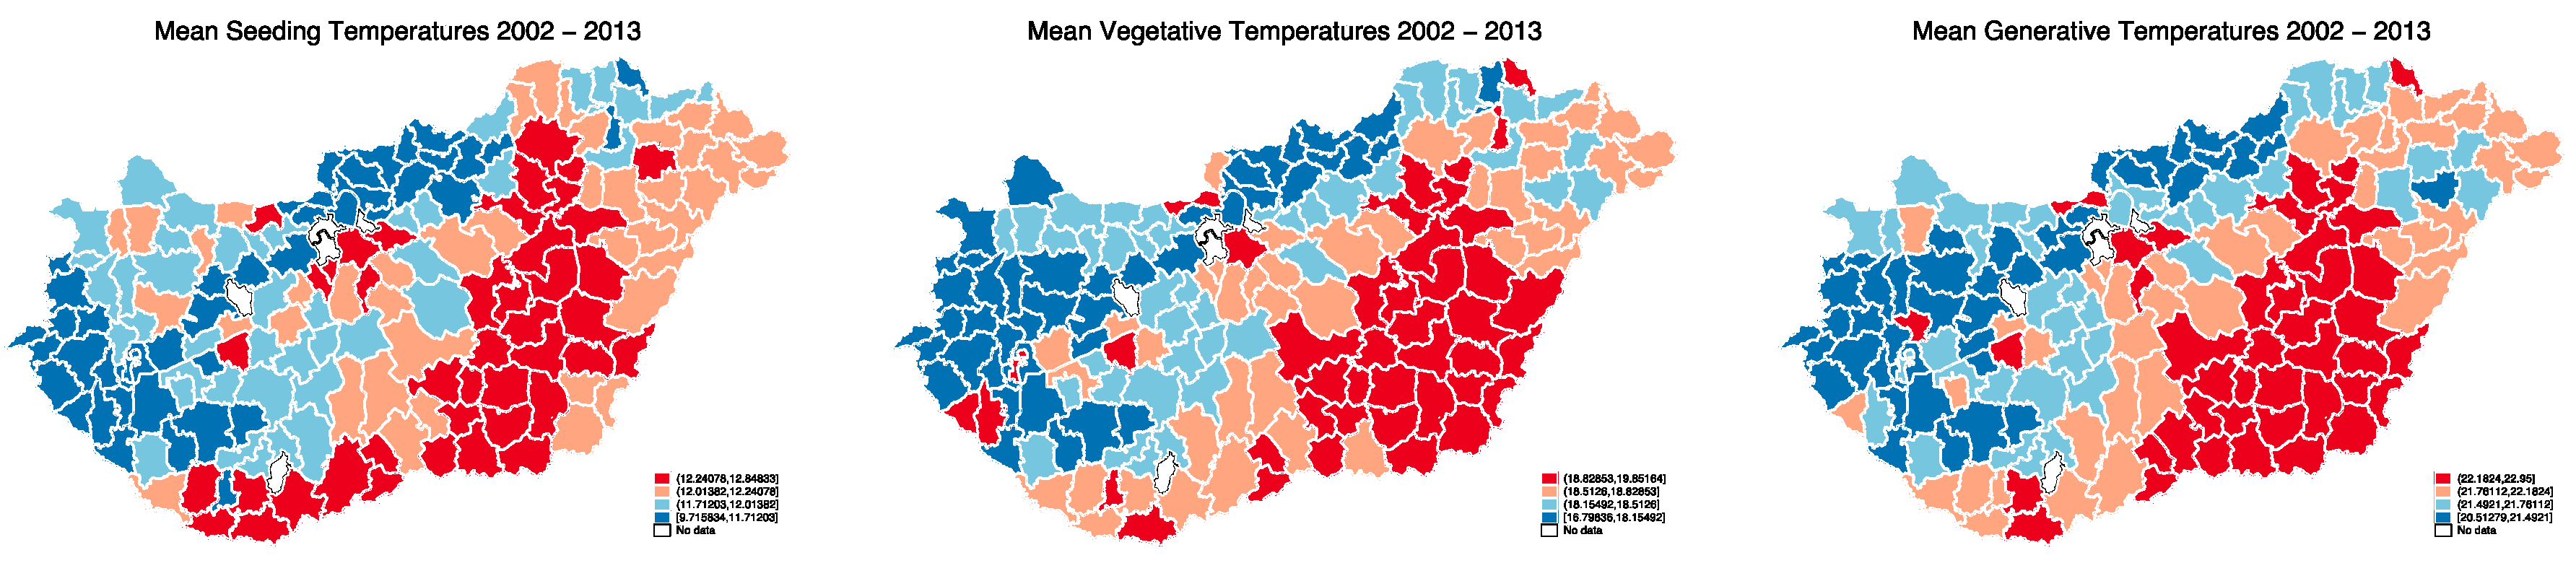
Temperature and Precipitation Trends in Hungary
2. Materials and Methods
2.1. Data
- Number of extreme temperature days: no_tminS and no_tminV: number of days with below 0 °C temperatures in Seeding and Vegetative periods, respectively; no_tmaxV and no_tmaxG: number of days above 30 °C in the Vegetative and Generative periods, respectively.
- Deviations from long-run, historical temperature and precipitation. To calculate deviations, we employed grid-specific daily weather data from 1975–2013. Thus, DEVtemp_avS, DEVtemp_avV, DEVtemp_avG denote temperature deviations, whilst DEVprec_sumS, DEVprec_sumV, DEVprec_sumG denote precipitation deviations from historical data in Seeding, Vegetative and Generative periods, respectively.
- Deviations from historical extreme weather events.
2.2. Method
3. Results
4. Discussion
5. Conclusions
Author Contributions
Funding
Acknowledgments
Conflicts of Interest
References
- IPCC. The Physical Science Basis. Contribution of Working Group I to the Fourth Assessment Report of the Intergovernmental Panel on Climate Change; IPCC: Cambridge, UK; Cambridge University Press: New York, NY, USA, 2007; p. 996. [Google Scholar]
- Reidsma, P.; Lansink, A.O.; Ewert, F. Economic impacts of climatic variability and subsidies on European agriculture and observed adaptation strategies. Mitig. Adapt. Strat. Gl. 2009, 14, 35–59. [Google Scholar] [CrossRef] [Green Version]
- IPCC. Climate Change 2013: The Physical Science Basis; Stocker, T.F., Qin, D., Plattner, G.-K., Tignor, M., Allen, S.K., Boschung, J., Nauels, A., Xia, Y., Bex, V., Midgley, P.M., Eds.; Cambridge University Press: Cambridge, UK; New York, NY, USA, 2013. [Google Scholar]
- Fogarasi, J.; Kemény, G.; Molnár, A.; Keményné Horváth, Z.; Nemes, A.; Kiss, A. Modelling climate effects on Hungarian winter wheat and maize yields. Stud. Agric. Econ. 2016, 118, 85–90. [Google Scholar] [CrossRef] [Green Version]
- Trnka, M.; Olesen, J.E.; Kersebaum, K.C.; Rötter, R.P.; Brázdil, R.; Eitzinger, J.; Jansen, S.; Skjelvåg, A.O.; Peltonen-Sainio, P.; Hlavinka, P. Changing regional weather crop yield relationships across Europe between 1901 and 2012. Clim. Res. 2016, 70, 195–214. [Google Scholar] [CrossRef] [Green Version]
- Pinke, Z.; Lövei, G.L. Increasing temperature cuts back crop yields in Hungary over the last 90 years. Glob. Chang. Biol. 2017, 23, 5426–5435. [Google Scholar] [CrossRef] [PubMed]
- Mukherjee, D.; Bravo-Ureta, B.E.; De Vries, A. Dairy productivity and climatic conditions: Econometric evidence from South-eastern United States. Aust. J. Agric. Econ. 2013, 57, 123–140. [Google Scholar] [CrossRef] [Green Version]
- Njuki, E.; Bravo-Ureta, B.E.; O’Donnell, C.J. A new look at the decomposition of agricultural productivity growth incorporating weather effects. PLoS ONE 2018, 13, 1–21. [Google Scholar] [CrossRef] [Green Version]
- Qi, L.; Bravo-Ureta, B.E.; Cabrera, V.E. From cold to hot: Climatic effects and productivity in Wisconsin dairy farms. J. Dairy Sci. 2015, 98, 8664–8677. [Google Scholar] [CrossRef] [Green Version]
- Ranjan, A.; Mukherjee, D. Assessing the linkage between dairy productivity growth and climatic variability: The case of New York State. Open Agric. 2018, 3, 658–669. [Google Scholar] [CrossRef]
- Roco, L.; Bravo-Ureta, B.; Engler, A.; Jara-Rojas, R. The impact of climatic change adaptation on agricultural productivity in Central Chile: A stochastic production frontier approach. Sustainability 2017, 9, 1648. [Google Scholar] [CrossRef] [Green Version]
- Szépszó, G.; Horányi, A. Transient simulation of the REMO regional climate model and its evaluation over Hungary. Időjárás 2008, 112, 203–231. [Google Scholar]
- Olesen, J.E.; Trnka, M.; Kersebaum, K.C.; Skjelvåg, A.O.; Seguin, B.; Peltonen-Sainio, P.; Rossi, F.; Kozyra, J.; Micale, F. Impacts and adaptation of European crop production systems to climate change. Eur. J. Agron. 2011, 34, 96–112. [Google Scholar] [CrossRef]
- Sippel, S.; Otto, F.E. Beyond climatological extremes-assessing how the odds of hydrometeorological extreme events in South-East Europe change in a warming climate. Clim. Chang. 2014, 125, 381–398. [Google Scholar] [CrossRef] [Green Version]
- Spinoni, J.; Lakatos, M.; Szentimrey, T.; Bihari, Z.; Szalai, S.; Vogt, J.; Antofie, T. Heat and cold waves trends in the Carpathian Region from 1961 to 2010. Int. J. Climatol. 2015, 35, 4197–4209. [Google Scholar] [CrossRef] [Green Version]
- Spinoni, J.; Naumann, G.; Vogt, J.; Barbosa, P. European drought climatologies and trends based on a multi-indicator approach. Global Planet. Chang. 2015, 127, 50–57. [Google Scholar] [CrossRef]
- Dong, B.; Sutton, R.; Woollings, T. The extreme European summer 2012. B Am. Meteorol. Soc. 2013, 94, s28–s32. [Google Scholar]
- Moberg, A.; Jones, P.D. Trends in indices for extremes in daily temperature and precipitation in central and western Europe, 1901–1999. Int. J. Climatol. 2005, 25, 1149–1171. [Google Scholar] [CrossRef]
- Brown, C.; Werick, W.; Leger, W.; Fay, D.; Ghile, Y.; Laverty, M.; Li, K.; Wilby, R. Water and Climate Change Adaptation: Policies to Navigate Uncharted Waters (No. WPBWE (2013) 2/REV1)(p. 121); OECD Publishing: Paris, France, 2013. [Google Scholar]
- Mezösi, G.; Meyer, B.C.; Loibl, W.; Aubrecht, C.; Csorba, P.; Bata, T. Assessment of regional climate change impacts on Hungarian landscapes. Reg. Environ. Chang. 2013, 13, 797–811. [Google Scholar] [CrossRef]
- Bartholy, J.; Csima, G.; Horanyi, A.; Hunyady, A.; Pieczka, I.; Pongracz, R.; Szepszo, G.; Torma, C.S. Regional climate models for the Carpathian Basin: Validation and preliminary results for the future. Geophys. Res. Abstr. 2013, 11, 12509. [Google Scholar]
- EU Joint Research Centre, MARS-AGRI4CAST (Monitoring Agricultural Resources). Available online: https://agri4cast.jrc.ec.europa.eu/DataPortal/Index.aspx (accessed on 16 September 2020).
- EU Joint Research Center, EUSOILS. Available online: https://esdac.jrc.ec.europa.eu/resource-type/european-soil-database-soil-properties (accessed on 16 September 2020).
- Schmidt, P.; Knox-Lovell, C.A.K. Estimating technical and allocative inefficiency relative to stochastic production and cost frontiers. J. Econom. 1979, 9, 343–366. [Google Scholar] [CrossRef]
- Meeusen, W.; van den Broeck, J. Technical efficiency and dimension of the firm: Some results on the use of frontier production functions. Empir. Econ. 1977, 2, 109–122. [Google Scholar] [CrossRef]
- Tsionas, E.G. Stochastic frontier models with random coefficients. J. Appl. Economet. 2002, 17, 127–147. [Google Scholar] [CrossRef]
- Alvarez, A.; del Corral, J.; Tauer, L.W. Modeling unobserved heterogeneity in New York dairy farms: One-stage versus two-stage models. Agric. Resour. Econ. Rev. 2012, 41, 275–285. [Google Scholar] [CrossRef]
- Belotti, F.; Ilardi, G. Consistent Estimation of the True Fixed-Effects Stochastic Frontier Model; CEIS Working Paper No. 231; CEIS: Paris, France, 2012. [Google Scholar]
- Pitt, M.M.; Lee, L.-F. The measurement and sources of technical inefficiency in the Indonesian weaving industry. J. Dev. Econ. 1981, 9, 43–64. [Google Scholar] [CrossRef]
- Schmidt, P.; Sickles, R.C. Production frontiers and panel data. J. Bus. Econ. Stat. 1984, 2, 367–374. [Google Scholar]
- Abdulai, A.; Tietje, H. Estimating technical efficiency under unobserved heterogeneity with stochastic frontier models: Application to northern German dairy farms. Eur. Rev. Agric. Econ. 2007, 34, 393–416. [Google Scholar] [CrossRef]
- Greene, W. Reconsidering heterogeneity in panel data estimators of the stochastic frontier model. J. Econom. 2005, 126, 269–303. [Google Scholar] [CrossRef]
- Battese, G.E.; Coelli, T.J. Prediction of firm-level technical efficiencies with a generalized frontier production function and panel data. J. Econom. 1988, 38, 387–399. [Google Scholar] [CrossRef]
- Coelli, T.J.; Rao, D.S.P.; O’Donnell, C.J.; Battese, G.E. An Introduction to Efficiency and Productivity Analysis; Springer: New York, NY, USA, 2005. [Google Scholar]
- Pereda, P.C.; de Oliveira Alves, D.C. Climate impacts on dengue risk in Brazil: Current and future risks. In Climate Change and Health; Springer: Berlin/Heidelberg, Germany, 2016; pp. 201–230. [Google Scholar]
- Key, N.; Sneeringer, S. Potential effects of climate change on the productivity of US dairies. Am. J. Agric. Econ. 2014, 96, 1136–1156. [Google Scholar] [CrossRef]
- Letson, D.; Letson, D. Assessing the value of climate information and forecasts for the agricultural sector in the Southeastern United States: Multi-output stochastic frontier approach. Reg. Environ. Chang. 2013, 13, S5–S14. [Google Scholar]
- Deschenes, O.; Greenstone, M. The Economic Impacts of Climate Change: Evidence from Agricultural Output and Random Fluctuations in Weather. Am. Econ. Rev. 2007, 97, 354–385. [Google Scholar] [CrossRef] [Green Version]


| Variable | Description | Observations | Mean | Std. Dev. | Min | Max |
|---|---|---|---|---|---|---|
| DEVtemp_avS | Temperature deviations from historical data in seeding period | 11 785 | −1.07 | 1.01 | −4.98 | 1.30 |
| DEVprec_sumS | Precipitation deviations from historical data in seeding period | 11 785 | 0.19 | 0.84 | −2.85 | 1.70 |
| DEVtemp_avV | Temperature deviations from historical data in vegetative period | 11 785 | −0.83 | 1.16 | −4.41 | 1.74 |
| DEVprec_sumV | Precipitation deviations from historical data in vegetative period | 11 785 | −0.06 | 1.00 | −4.95 | 2.37 |
| DEVtemp_avG | Temperature deviations from historical data in generative period | 11 785 | −1.00 | 0.86 | −3.09 | 1.13 |
| DEVprec_sumG | Precipitation deviations from historical data in generative period | 11 785 | −0.08 | 1.03 | −4.54 | 2.12 |
| no_tminS | Number of days with below 0 °C temperatures in seeding period | 11 785 | 1.65 | 2.11 | 0.00 | 12.00 |
| no_tminV | Number of days with below 0 °C temperatures in vegetative period | 11 785 | 0.07 | 0.29 | 0.00 | 3.00 |
| no_tmaxV | Number of days above 30 °C in the vegetative period | 11 785 | 8.59 | 5.98 | 0.00 | 29.00 |
| no_tmaxG | Number of days above 30 °C in the generative period | 11 785 | 22.44 | 8.16 | 3.00 | 44.00 |
| Variable | Description | M1 | M2 | M3 | M4 | M5 |
|---|---|---|---|---|---|---|
| Frontier | ||||||
| lnLand | Logarithmic form of land variable | 0.00 | 0.01 | 0.01 | 0.02 | 0.01 |
| lnLabor | Logarithmic form of labor variable | 0.08 *** | 0.09 *** | 0.09 *** | 0.08 *** | 0.09 *** |
| lnCap | Logarithmic form of capital variable | 0.09 *** | 0.09 *** | 0.09 *** | 0.08 *** | 0.09 *** |
| lnMat | Logarithmic form of intermediate consumption | 0.83 *** | 0.82 *** | 0.82 *** | 0.82 *** | 0.82 *** |
| lnLand_lnLabor | −0.05 ** | −0.06 *** | −0.06 *** | −0.06 *** | −0.06 *** | |
| lnLand_lnCap | 0.03 | 0.03 ** | 0.03 ** | 0.04 ** | 0.04 ** | |
| lnLand_lnMat | 0.03 | 0.03 | 0.03 | 0.03 | 0.03 | |
| lnLabor_lnCap | −0.04 *** | −0.04 *** | −0.04 *** | −0.04 *** | −0.04 *** | |
| lnLabor_lnMat | −0.05 ** | −0.04 * | −0.04 * | −0.04 * | −0.04 * | |
| lnCap_lnMat | −0.03 * | −0.04 *** | −0.04 *** | −0.04 *** | −0.04 *** | |
| lnLand_2 | Quadratics of logarithmic land variable | 0.00 | 0.01 | 0.01 | 0.01 | 0.01 |
| lnLabor_2 | Quadratics of logarithmic labor variable | 0.06 *** | 0.06 *** | 0.06 *** | 0.06 *** | 0.06 *** |
| lnCap_2 | Quadratics of logarithmic capital variable | 0.03 *** | 0.03 *** | 0.03 *** | 0.03 *** | 0.03 *** |
| lnMat_2 | Quadratics of logarithmic intermediate consumption | 0.01 | 0.01 | 0.01 | 0.01 | 0.01 |
| trend | Trend variable | 0.01 *** | −0.04 *** | −0.03 *** | −0.04 *** | −0.03 *** |
| trend2 | Quadratics of trend variable | −0.00 *** | 0.00 *** | 0.00 *** | 0.00 *** | 0.00 *** |
| lnTSeeding | Logarithmic form of temperature in seeding period | 0.29 *** | 0.29 *** | 0.51 *** | 0.30 *** | |
| lnTVegetative | Logarithmic form of temperature in vegetative period | −0.15 | −0.10 | 0.04 | −0.17 * | |
| lnTgenerative | Logarithmic form of temperature in generative period | −1.46 *** | −1.21 *** | −1.10 *** | −1.45 *** | |
| lnPSeeding | Logarithmic form of precipitation in seeding period | 0.00 | 0.00 | −0.01 | −0.00 | |
| lnPVegetative | Logarithmic form of precipitation in vegetative period | 0.05 *** | 0.04 *** | 0.07 *** | 0.05 *** | |
| lnPgenerative | Logarithmic form of precipitation in generative period | −0.03 *** | −0.03 *** | −0.01 | −0.03 *** | |
| lnTSeeding2 | Quadratics of logarithmic temperature in seeding period | 1.05 ** | 0.94 * | 1.50 *** | 1.09 ** | |
| lnTVegetative2 | Quadratics of logarithmic temperature in vegetative period | −9.14 *** | −8.40 *** | −8.05 *** | −9.23 *** | |
| lnTgenerative2 | Quadratics of logarithmic temperature in generative period | 3.54 | 4.14 * | 4.33 * | 3.95 * | |
| lnPSeeding2 | Quadratics of logarithmic precipitation in seeding period | −0.01 *** | −0.01 *** | −0.01 *** | −0.01 *** | |
| lnPVegetative2 | Quadratics of logarithmic precipitation in vegetative period | −0.03 * | −0.03 ** | −0.02 | −0.03 * | |
| lnPgenerative2 | Quadratics of logarithmic precipitation in generative period | −0.06 *** | −0.06 *** | −0.04 *** | −0.06 *** | |
| Mu | ||||||
| no_tmaxG | Number of days above 30 °C in the generative period | 1.19 *** | ||||
| no_tmaxV | Number of days above 30 °C in the vegetative period | 0.79 | ||||
| no_tminV | Number of days with below 0 °C temperatures in vegetative period | −3.90 | ||||
| no_tminS | Number of days with below 0 °C temperatures in seeding period | −0.79 | ||||
| DEVtemp_avS | Temperature deviations from historical data in seeding period | −8.17 *** | ||||
| DEVprec_sumS | Precipitation deviations from historical data in seeding period | 3.56 | ||||
| DEVtemp_avV | Temperature deviations from historical data in vegetative period | −5.63 ** | ||||
| DEVprec_sumV | Precipitation deviations from historical data in vegetative period | −6.80 *** | ||||
| DEVtemp_avG | Temperature deviations from historical data in generative period | −9.51 *** | ||||
| DEVprec_sumG | Precipitation deviations from historical data in generative period | −4.17 ** | ||||
| DEVno_tminS | Deviation from number of days with below 0 °C temperatures in seeding period | 0.17 | ||||
| DEVno_tminV | Deviation form number of days with below 0 °C temperatures in vegetative period | −1.44 | ||||
| DEVno_tmaxV | Deviation form number of days with above 30 °C temperatures in vegetative period | 0.48 ** | ||||
| DEVno_tmaxG | Deviation form number of days with above 30 °C temperatures in generative period | −0.18 ** | ||||
| constant | −205.29 *** | −175.76 *** | −150.78 *** | −99.34 *** | −122.08 *** | |
| Usigma | ||||||
| legal | Legal form of farm | −0.40 *** | −0.49 *** | −0.47 *** | −0.46 *** | −0.49 *** |
| constant | 3.81 *** | 3.60 *** | 3.20 *** | 2.71 *** | 3.28 *** | |
| Vsigma | ||||||
| AGRICUL | Dominant limitations for the agricultural use of soils, dummy variable | 0.08 | 0.02 | −0.04 | −0.01 | 0.04 |
| HWC_SUB | Water retention capacity of subsoil is above 140 mm/m, dummy variable | −0.10 ** | −0.17 *** | −0.19 *** | −0.14 *** | −0.16 *** |
| HWC_TOP | Good water retention capacity of topsoil, dummy variable | −0.36 *** | −0.36 *** | −0.38 *** | −0.39 *** | −0.35 *** |
| LOC | Soil organic content is below <2%, dummy variable | −0.01 | −0.05 | −0.04 | −0.05 | −0.05 |
| constant | −3.08 *** | −3.01 *** | −2.94 *** | −2.99 *** | −3.04 *** | |
| Statistics | ||||||
| N | 11,375.00 | 11,327.00 | 11,327.00 | 11,327.00 | 11,327.00 | |
| ll | −964.65 | −454.58 | −432.11 | −369.31 | −449.01 | |
| chi2 | 67,463.12 | 71,899.56 | 71,555.29 | 69,065.44 | 72,323.66 | |
| p | 0.00 | 0.00 | 0.00 | 0.00 | 0.00 |
© 2020 by the authors. Licensee MDPI, Basel, Switzerland. This article is an open access article distributed under the terms and conditions of the Creative Commons Attribution (CC BY) license (http://creativecommons.org/licenses/by/4.0/).
Share and Cite
Bakucs, Z.; Fertő, I.; Vígh, E. Crop Productivity and Climatic Conditions: Evidence from Hungary. Agriculture 2020, 10, 421. https://doi.org/10.3390/agriculture10090421
Bakucs Z, Fertő I, Vígh E. Crop Productivity and Climatic Conditions: Evidence from Hungary. Agriculture. 2020; 10(9):421. https://doi.org/10.3390/agriculture10090421
Chicago/Turabian StyleBakucs, Zoltán, Imre Fertő, and Enikő Vígh. 2020. "Crop Productivity and Climatic Conditions: Evidence from Hungary" Agriculture 10, no. 9: 421. https://doi.org/10.3390/agriculture10090421
APA StyleBakucs, Z., Fertő, I., & Vígh, E. (2020). Crop Productivity and Climatic Conditions: Evidence from Hungary. Agriculture, 10(9), 421. https://doi.org/10.3390/agriculture10090421