Abstract
Recently, a Total Merit Index (RZ€) has been developed for German Holstein dairy cattle on the basis of margin in Euro. Our aim was to adjust this lifetime net merit for the dual-purpose German Black Pied cattle breed (DSN) accounting for beef production in addition to milk performance and fitness traits. We used the estimated breeding values of DSN sires and developed a breeding value for carcass weight and quality. Furthermore, we adjusted the German Holstein marginal profits per standard deviation, which are used to calculate the estimated breeding values, to DSN-specific values. The DSN Net Merit is the sum of the three sub-indices DSN Net Milk, DSN Net Fitness, and DSN Net Beef, which contribute to the DSN Net Merit with 52.84%, 43.43%, and 3.73%, respectively. The DSN Net Merit that was calculated for 33 DSN sires ranged between EUR −1114 and +709. The DSN Net Merit strongly correlates with the Total Merit Index. The implementation of the DSN Net Merit is useful for selection and mating decisions. Especially, the sub-index DSN Net Beef, which does not correlate with existing breeding values, can be used to maintain the dual-purpose character of DSN while modestly improving milk yield. The approach can be easily adapted to other dual-purpose breeds.
1. Introduction
Breeding values of sires and/or dams give breeders the opportunity to base their breeding selection on the respective breeding goal defined in the breeding program. The breed description of the German Black Pied cattle (DSN, “Deutsches Schwarzbuntes Niederungsrind”) aims for a dual-purpose-type cattle with cows producing about 7000 to 8000 kg of milk per year and young bulls with a daily weight gain of more than 1000 g per day during the fattening period. Although breeding for single-purpose dairy cattle was economically not recommended during EU milk price quota regulation [1], the replacement of dual-purpose DSN cattle with the single-purpose high-milk-yielding Holstein Friesian breed from North America was a continuous process in the 20th century. Today, DSN is an endangered breed listing about 2550 herd book animals in Germany [2]. As the milk yield from dual-purpose breeds is lower than dairy breeds—albeit the marginal revenues for fattening of dual-purpose calves are higher than for calves from dairy breeds [3]—farming a dual-purpose breed presents an economic challenge. To preserve the breed from extinction, DSN breeders are financially supported by the regional government.
Breeding of DSN aims at milk production based on a ration that contains at least two-thirds roughage [4] which leads to lowered marginal costs compared to higher concentrate input systems [5]. These lower feeding costs for DSN compared to high-yielding Holstein cows increase the marginal profit of DSN. Furthermore, for a cost-efficient milk production mainly based on roughage, the dry-matter intake capacity of a cow is important [5]. Since DSN cows have on average a smaller body size compared to German Holstein (GH) cows [6], this results in a lower dry-matter intake capacity [7]. However, the general lower milk yield of DSN compared to German Holstein cows leads to a higher maintenance energy required per kg milk of around 3.5%, which increases the feeding costs for additional kg of milk in DSN. The farmers are striving for better economic results, which translates into breeding values used for selection decisions.
Breeding values are used to estimate and evaluate the performance of an individual sire or cow relative to the average population. In Germany, estimated breeding values (EBVs) are calculated using daily or monthly recorded data for milk production, fertility, reproduction, conformation, health, and longevity traits. The absolute EBVs for milk, fat, and protein yield are given in kilograms, for fat and protein content in percentage. Relative EBVs are calculated based on absolute EBVs and are standardized to the population average of 100 with a standard deviation of 12 at a fixed group [8]. The Total Merit Index (RZG, “Relativ Zuchtwert Gesamt”) combines different trait-specific EBVs or their indices (milk, functional herd life, conformation, somatic cell score, fertility, and calving traits) that form the basis of economical [9] and breeding decisions. This breeding value estimation and its application is best established for the high-yielding German Holstein breed.
For the dual-purpose Simmental population, a Total Merit Index (GZW, “Gesamtzuchtwert”) with a population mean of 100 and a standard deviation of 12 has been established [10]. The GZW accounts beside milk (milk, fat, and protein yield) and fitness (functional herd life, persistency, female fertility, calving ease maternal/paternal, stillbirth maternal/paternal, vitality, udder health, and milking speed) also for beef traits (daily gain, dressed carcass, and grade). The economic weight of milk:beef:fitness is within the Simmental population in Austria and Germany 38:18:44 to underline the dual-purpose character of the breed [11].
In contrast, in other countries it is common to estimate the net merit in terms of the economic profit in the local currency such as the Total Performance Index (TPI) in the USA, the Pro$ in Canada, or the Economic Breeding Index (EBI) in Ireland [12,13,14]. The net merit measures the lifetime profit of a dam’s or sire’s offspring on the basis of economic values of the considered traits. These net merits have to be calculated under the ceteris paribus assumption that one unit of the respective trait changes and all other traits remain constant [15]. Likewise, an additional Total Merit Index called RZ€ has been developed recently for the German Holstein population that accounts for the marginal profit of dairy production in Euro [16,17,18].
The objectives of this study were (1) to implement an economic lifetime net merit for the dual-purpose DSN breed to support breeding decisions on a more appropriate economic basis, (2) to figure out the economic weight between milk, beef, and fitness traits within a breeding index under the given market conditions, and (3) to find sires combining positive inheritance for all economic important traits. Therefore, a DSN specific net merit was established (called DSN Net Merit) based on the RZ€ valid for the German Holstein breed. The RZ€ has been published in August 2020 for the first time and the methodology developed by the vit was transferred to this paper. The marginal profits per standard deviation for each trait included in the RZ€ were recalculated for the specific biological and economical characteristics of the DSN population. Furthermore, the economic side of beef production in comparison to milk production was investigated. In order to account for beef production in a dual-purpose breed, values for weights, quality, and prices of carcasses of DSN young bulls were included in the calculation of the DSN Net Merit.
2. Materials and Methods
Preliminary work on which this study builds was performed by the “Vereinigte Informationssysteme Tierhaltung w.V.” (vit) [18]. The marginal profit for the EBVs were adjusted for the DSN population and an EBV for carcass traits was developed. The marginal profit describes the economic gain per additional point/value of the respective EBV as margin in Euro (EUR). This article focuses on a local breed by adapting an existing approach for a major local breed, the German Holstein dairy cattle. The approach is well documented in the German literature but many of the breeding evaluation literature is not officially published in international journals. Particularly, the development of the German RZ€ has not been published yet. We fill this gap by delivering a detailed description of the methodological procedure, the data basis and the processing of the data.
2.1. Phenotype Data for Carcass Weight, Quality, and Marginal Profit
Phenotypes were obtained from two DSN farms which account for around 40% of the current German DSN population. Carcass weights of 2403 young bulls descending from 33 sires were collected between 2002 and 2019. Beef and carcass quality data was recorded between 2015 and 2018 for 711 young bulls descending from 24 sires (Table S1). The mean age at slaughter was 603 days ranging from 228 to 730 days. Carcass quality was classified using the EUROP system (EU No. 2017/1182) [19] with “E” defining excellent, “U” very good, “R” good, “O” fair and “P” poor quality. The fat classes ranged from “1” for the lowest to “5” for the highest fat content. Surplus fat of a carcass lowered the pay-out per kg carcass. Although the main classes for carcass conformation and fat quality were further subdivided (“+”, “0”, and “−“), main classes were used for calculation, sub-classes were not considered.
The marginal profit (mpclass) per kg carcass weight was calculated as the feed ration for a daily gain of 1200 g for young bulls. The average fattening costs for every additional kg of carcass weight were calculated with 2.15 EUR/kg [20]. If no carcass conformation data was available, the average quality “R3” (corresponding to carcass conformation class “R” and fat class “3”) with a price of 3.53 EUR/kg was assumed ( = 3.53 EUR/kg − 2.15 EUR/kg = 1.38 EUR/kg) since around 75% of DSN young bulls were classified as “R3” (Table S1). The prices were average pay-out prices over the last 15 years. We checked if there could be a trend for future predictions seen, but there was not a clear trend which could be used, e.g., for the next generation interval. To account for a lifetime net merit, the marginal profit was multiplied with the total number of male calves during a functional herd life of a cow lowered by a stillbirth rate of 8.8% among all male calves from heifers and cows (n = 1.37 male calves of a cow’s functional herd life).
2.2. Estimated Breeding Values (EBVs)
EBVs of DSN sires (born between 1978 and 2013) were obtained from vit as of August 2019. Breeding value evaluation in Germany is routinely performed three times per year separately for DSN and other breeds. The absolute EBVs include milk, fat, and protein yield in kg. Lactose yield in kg was calculated as 4.8% of the milk yield [21]. At the moment, the lactose content is not considered as a selection criterion, because it is relatively stationary and the farmers are not paid for it. However, we had to take it into account for the economic calculations, because it is produced by the cow besides fat and protein and requires therefore energy from feed, which is subsequently not available for fat and protein. The relative EBVs included the traits calving to first insemination, first to last insemination in heifers and cows, direct and maternal stillbirth, direct and maternal calving ease, survival of female calves from day 3 to 458, and functional herd life. These EBVs were calculated based on daily or monthly recorded daughter performance data, conformation classification, and fertility data. In contrast to the German Holstein population, EBVs for health traits (RZEuterfit for udder health, RZKlaue for claw health, RZRepro for reproduction, and RZMetabol for metabolic stability) and genomic enhanced EBVs do not exist in DSN and thus could not be considered in this study.
2.3. Adjustment of the Marginal Profit for DSN
For each trait-specific EBV that contributed to the RZ€ of German Holstein, a marginal profit per standard deviation (SD) in Euro was estimated by the difference between marginal revenue and marginal costs per trait [16]. For the estimation of DSN Net Merit, the single marginal profits (mp) per EBV and per trait were adjusted with regard to biological and economical characteristics of DSN cattle (Table S2). Therefore, the biological performance per SD of every EBV and trait was multiplied with the economic value per SD. The biological values for functional herd life and calving interval were obtained from all 1410 DSN herd book cows in Brandenburg in 2018/2019. An average milk price resulting from pay-out prices of the last 15 years of 0.34 EUR/kg standard milk (4.0% fat and 3.4% protein content, EUR 3.73 per kg butter fat and 5.60 EUR/kg milk protein, average milk price of the three most important dairies in Germany Friesland Campina, DMK, MUH-Arla) formed the basis for the economic calculations. Past milk prices in Germany have been assumed as stationary processes [22]. This means that a part of the observed price fluctuations is deterministic and, therefore, predictable. Due to the stationary character of the milk price, the price of the previous month and also that from the month before last can be used as autoregressive explanatory variables. Therefore, we assume, that these stationary characteristics (e.g. a mean of EUR 0.34 per kilogram of milk) will continue in the future. Every marginal profit was therefore multiplied with the number of finished lactations (n = 2.84, EBVs for milk production) or with the respective number of calvings during functional herd life (n = 3, EBVs for calving and reproduction traits).
To calculate feeding costs per kg milk protein, milk fat, and lactose, the ratio of roughage to concentrate was set to 66:34. Prices for concentrate and roughage were assumed to be the same as for German Holsteins. Additionally, the higher maintenance energy required per kg energy-corrected milk (ECM) in DSN compared to German Holsteins was calculated to be 3.5% because of the lower milk yield of around 6 kg ECM per day in DSN; this was based on the around 50 kg difference in life weight of DSN compared to German Holsteins [6].
Furthermore, we assumed, that the proportion of male to female calves is 50:50, since sexed semen is not used in DSN. The overall stillbirth rate of 6.2% for male and female DSN calves was used to calculate the number of calves born per cow during her functional herd life. Absolute EBVs for milk yield traits were calculated on the basis of 305 days in milk. On farm, DSN cows were on average about 330 days in milk; therefore, the respective EBVs were multiplied with the factor 1.08. Economic parameters were obtained from economic summaries of animal production, which were available for the years 2007–2018. All marginal profits per SD for each included EBV are shown in Table 1.

Table 1.
EBVs included in the three sub-indices and their contribution to dual-purpose German Black Pied cattle breed net merit. Estimated breeding values included in the calculation of the DSN Net Merit composed of the sub-indices DSN Net Milk, DSN Net Fitness, and DSN Net Beef. For each EBV, the marginal profit in Euro per standard deviation is listed for DSN and German Holsteins [18]. Calculations of the marginal profit include the respective factor for lactation length and average number of lactations within each breed or number of calvings (3) during functional herd life. Furthermore, the financial contribution (in%) of each sub-index to DSN Net Merit is listed. Equations for the calculation of the marginal profit of EBVs are listed in Tables S2 and S3.
Differences in marginal profit per standard deviation for fat kg (EUR 195.55 for DSN vs. 197.72 for GH), protein kg (EUR 247.17 for DSN vs. 248.76 for GH), and lactose kg (EUR −52.79 for DSN vs. EUR −51.13 for GH) result from different factors for the lactation length/days in milk (330 days for DSN vs. 360 days for GH), the number of finished lactations during functional herd life (2.84 for DSN vs. 2.75 for GH), the feeding costs depending on the roughage to concentrate ratio (66:34 for DSN vs. 50:50 for GH), and a 3.5% higher maintenance energy required per kg ECM in DSN versus GH. Both effects cancel each other out, which is shown in the marginal profit per additional kg fat (EUR 2.54 in DSN vs. EUR 2.56 in GH) or protein (EUR 4.07 in DSN vs. EUR 4.09 in GH).
The adjustments of the marginal profit for DSN Net Fitness included a similar price for DSN as for German Holstein calves (EUR 130 for DSN vs. EUR 133 for GH). In combination with shorter calving intervals (387 days for DSN vs. 410 days for GH) this led to similar economic values per additional day of calving interval (0.34 EUR/d for DSN vs. 0.33 EUR/d for GH). The revenue for DSN calves also decreased the marginal profit for lower still birth rates direct (9.36 EUR/SD for DSN vs. 9.87 EUR/SD for GH) and lower still birth rates maternal (12.09 EUR/SD for DSN vs. 12.81 EUR/SD for GH). In DSN, higher losses for an average premature calf death within 458 days of rearing (EUR 592.10 for DSN vs. EUR 449.70 for GH) were found (Table S5). The marginal profit for calf survival depends on the different distribution of calf deaths within the 458-day time range. In DSN, female calves died at a later time point so that the marginal costs to rear these calves were higher in comparison to GH calves, which died on average earlier. Thus, the marginal profit per standard deviation of calf survival is higher in DSN compared to German Holstein (73.33 EUR/SD for DSN vs. 54.61 EUR/SD for GH). For DSN, lower prices for the replacement of cows (EUR 698.23 for DSN vs. EUR 1098.75 for GH) were assumed because average prices for the carcasses of DSN cows were higher compared to German Holstein cows and DSN had lower rearing costs for heifers. This huge difference led to a much lower marginal profit for functional herd life in DSN (164.21 EUR/SD in DSN vs. 258.69 EUR/SD in GH). Due to shorter calving intervals with equal functional herd life (1100 days for DSN and GH) DSN cows reached on average more lactations compared to German Holstein cows (2.84 for DSN vs. 2.75 for GH). This in turn results in higher fertility costs for DSN sires inheriting poorer fertility to their daughters. Prices per semen dose (EUR 10 for DSN vs. EUR 12.50 for GH) and service costs for fertility were lower in DSN (EUR 14.41 for DSN vs. EUR 22.50 for GH). More DSN cows were inseminated in their last lactation (75% in DSN vs. 69% in GH), which caused higher costs. Higher economic values for the first to last insemination of DSN heifers and cows were assumed (EUR 7.20 heifers/EUR 39.09 cows for DSN vs. EUR 10.35 heifers/52.04 cows for GH). A delay from calving to first insemination of cows results in losses of marginal profit per calf and day, which are higher in DSN (EUR 6.13 for DSN vs. EUR 6.05 for GH). The marginal profit for treatment costs for calving ease maternal (CEm) and direct (CEd) were assumed to be the same in DSN and GH (EUR CEm 4.03, EUR CEd 5.03).
2.4. DSN Net Milk and DSN Net Fitness
The sub-indices DSN Net Milk and DSN Net Fitness of the DSN Net Merit were calculated by converting the EBVs of each DSN sire into an economic value using the corresponding marginal profit per SD for absolute and relative EBVs (Tables S3 and S4).
Absolute EBVs for fat kg, protein kg, lactose kg (i = 1, 2, 3, respectively) were converted to economic values using Equation (1):
where is the sub-index in Euro per sire for the economic value of milk production, is the absolute EBV for trait i per sire, is the marginal profit per SD of the respective absolute EBV divided by the SD of the respective EBV () including a correction for the lactation length that is cut to 305 days in milk and the average number of lactations within the DSN population. All marginal profits per SD and EBV are given in relation to the lactation length and the average number of lactations (Table 1).
Relative EBVs for functional herd life, calving to first insemination cows, first to last insemination heifers/cows, stillbirth rate direct/maternal, calving ease direct/maternal, calf survival (i = 1,…,9, respectively) were converted to economic values using Equation (2):
where is the sub-index in Euro per sire for the economic value of fitness, and is the relative EBV per sire. As relative EBVs are standardized with regard to the population mean to the basis of 100, the population mean had to be subtracted from the individual relative EBV of each sire ( −100), so that values lower than 100 are negative. is the marginal profit per SD for relative EBVs including a correction for the average number of calvings (except functional herd life), which is divided by the SD of the respective EBV ().
2.5. Generating an EBV for Carcass Weight (eCW)
Before calculating the DSN Net Beef, we had to translate the carcass weight at slaughter of a sire’s progeny group to an EBV of each sire. This includes (1) multiple corrections of the raw carcass weight of every male offspring, (2) the calculation of the heritability and (3) the calculation of an index value for each sire based on the number of progeny.
- 1.
- The mean age at slaughter was 603 days. The carcass weight (CW) of each young bull j (j = 1,...,n) was up- or downscaled to 600 days using the Gompertz function [9] in Equation (3):where sCW is the scaled carcass weight for 600 days of age, is the measured carcass weight of bull j at the age of slaughter t, α is the asymptote describing the maximum carcass weight (380.58 kg), b is the average birth weight for male calves (46.7 kg), c is the growth rate (0.01), and e is Euler’s number. The average birth weight b and growth rate c were not measured, but predicted using the Gompertz function. In the second step, a corrected carcass weight (cCWjkl) was obtained through adjustment of the scaled carcass weight () of each young bull j (j = 1,...,n) for herd (n = 2) and year of slaughter (n = 17) using a linear model (Equation (4)):where is the corrected carcass weight for each young bull and ε the error term. The calculated mean carcass weight was 357.27 kg (SD = 27 kg).
- 2.
- The corrected carcass weights () of young bulls were grouped as progeny group per sirem (Equation (5)):
An ANOVA was performed on the model in Equation (5) to estimate the genetic () and environmental variance () of carcass weight [23]. Therefore, the mean sum of squares among sire half sib groups (S) and within sire half sib groups (W) was taken out of ANOVA to calculate the heritability h2 of carcass weight using Equation (6):
where r was calculated by dividing the degrees of freedom (df) within half sib groups (W) by those among half sib groups (S) plus 1 (). Heritability for carcass weight in the DSN population under investigation was estimated with h2 = 0.31.
- 3.
- The index value per sire (bsire) based on the number of progeny (n) [24] was calculated using h2 for carcass weight (Equation (7)):
In the next step, an EBV for carcass weight ) was calculated for each sire (Equation (8)):
where is the index value calculated in Equation (7), and coef() is the coefficient from the progeny group for carcass weight per sire resulting from Equation (5).
The eCW corresponds to the potential of each sire to increase or decrease the carcass weight in kg of the progeny depending on the intercept of the population. The mean eCW of the 33 DSN sires was zero with a SD of 15 kg and accuracy ranging from 67.9% to 97.4% dependent of the number of offspring.
2.6. DSN Net Beef Includes Carcass Conformation and Fat Quality
The DSN Net Beef per sire was calculated as (Equation (9)):
where is the proportion of each carcass conformation class (5 classes) for each sire and is the marginal profit for each conformation class multiplied with the average number of male calves per cow in her functional herd life. is the proportion of each fat quality class (5 classes) for each sire, the reduction per surplus fat of EUR 0.10, if the fat class is higher than 1 adjusted for the average number of male calves (Table S1), and the EBV for carcass weight of the respective sire.
2.7. DSN Net Merit and Correlation to EBVs
The DSN Net Merit in Euro was calculated as the sum of the sub-indices DSN Net Milk, DSN Net Fitness, and DSN Net Beef. This DSN Net Merit is the average economic gain or loss from a sire’s progeny for milk, fitness and beef production. The DSN Net Merit was calculated for 33 out of 92 sires with a minimum of 10 sons with carcass weight records. The DSN Net Merit values were compared with its sub-indices and all available relative and absolute EBVs from the German breeding evaluation in August 2019 by calculating Pearson’s correlation coefficients. Correlations were defined as “very weak” when r = [0–0.20), “weak” when r = [0.20–0.40), “moderate” when r = [0.40–0.60), “strong” when r = [0.60–0.80), and “very strong” when r = [0.80–1], also for the respective negative values.
3. Results
3.1. DSN Net Merit for 33 DSN Sires
The DSN Net Merit in Euro was calculated for 33 DSN sires ranging from EUR −1114 to +709 with a mean of EUR −113 and a SD of EUR ±473 (Table 2). The DSN Net Milk contributed with 52.8% most to the DSN Net Merit and had a similar range (EUR −1087 to +566) with a mean of EUR −180 and a SD of EUR ±403. In contrast, DSN Net Fitness and DSN Net Beef showed a lower range from EUR −258 to +465 (mean EUR +68, SD EUR ±197) and from EUR −75 to +67 (mean EUR −1, SD EUR ±28), respectively. These ranges were 2.3 and 11.7 times smaller compared to DSN Net Milk. The contribution of DSN Net Fitness and DSN Net Beef to DSN Net Merit were 43.4% and 3.7%, respectively. The order of sires sorted from best to worst is almost identical when comparing DSN Net Merit with DSN Net Milk, but switches completely when comparing with DSN Net Fitness and DSN Net Beef. The birth year of the sire had no influence on the DSN Net Merit.
Table 2.
Summary of 33 DSN sires for DSN Net Merit, DSN Net Milk, DSN Net Fitness, and DSN Net Beef for a cow’s lifetime, and RZG on a relative scale (population mean 100). Basic data originate from the breeding evaluation in August 2019.
Independently of ranking for DSN Net Merit sires can be grouped by the patterns of their positive and negative sub-indices (DSN Net Milk, DSN Net Fitness, and DSN Net Beef). For example, a sire can inherit positive or negative values of the three sub-indices. We found eight patterns among our 33 sires (Figure 1).
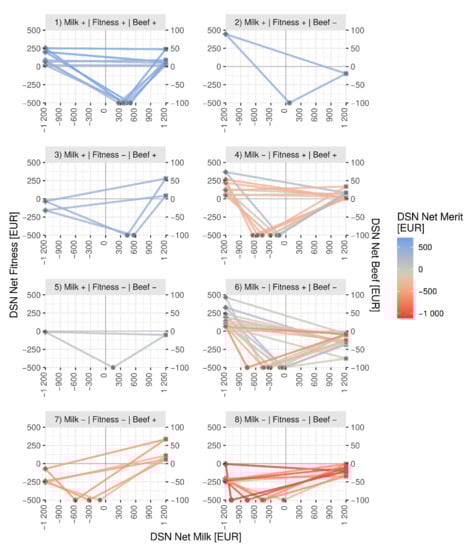
Figure 1.
Patterns for 33 DSN sires based on the sub-indices of DSN Net Merit. Each sire is represented by a triangle connecting DSN Net Milk (dots on x-axis), DSN Net Fitness (rotated quadrats on left y-axis), and DSN Net Beef (squares on right y-axis) in Euro. The color of a triangle depends on the DSN Net Merit of the sire (blue most positive, red most negative). The sires were grouped by their combination of positive (+) and/or negative (−) sub-indices.
3.2. DSN Net Merit Sub-Indices Patterns of DSN Sires
Five sires showed positive inheritance of all three sub-indices DSN Net Milk, DSN Net Fitness and DSN Net Beef (n = 5, group 1). These sires ranked also as the top sires based on their DSN Net Merit. Sires which are positive for DSN Net Milk, but negative for either DSN Net Beef (n = 1, group 2) or DSN Net Fitness (n = 2, group 3) showed an overall positive DSN Net Merit. Seven sires had negative values for DSN Net Milk, but positive indices for both DSN Net Fitness and DSN Net Beef (n = 7, group 4). One sire built group 5 showing a positive DSN Net Milk, but slightly negative values for DSN Net Fitness and DSN Net Beef which led to a DSN Net Merit of around zero. The largest group composed of nine sires showed positive values for DSN Net Fitness, but negative for the remaining two sub-indices (n = 9, group 6). If DSN Net Beef is the only positive score (n = 4, group 7), the sire always ranks negative for DSN Net Merit. Among the 33 DSN sires, four are negative for all three sub-indices (n = 4, group 8) and, therefore, also show the lowest DSN Net Merit values. Generally, the lower the value of DSN Net Milk is, the lower is the DSN Net Merit. A slightly negative DSN Net Milk can be compensated by a high DSN Net Fitness that brings the DSN Net Merit into a positive direction.
3.3. Comparison between DSN Net Merit and EBVs
We compared the DSN Net Merit and sub-indices for Milk, Fitness, and Beef to all EBVs from the German breeding evaluation for DSN. The ranking lists of the best to worst performing sires considering DSN Net Merit was highly consistent with ranking based on the Total Merit Index RZG, which was also evident by a very strong correlation of r = 0.97 (P < 0.001) (Figure 2). This high correlation mainly results from the high contributing of the sub-index DSN Net Milk to DSN Net Merit (52.8%) and milk production traits to the Total Merit Index RZG (45%). Although, conformation traits were not included in the calculation of the DSN Net Merit, the positive correlations between DSN Net Merit and its sub-indices to 12 EBVs for conformation traits showed that conformation traits play an important economic role for milk and beef production as well as for fitness.
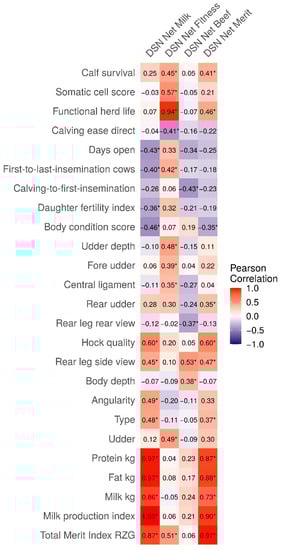
Figure 2.
Heatmap of Pearson’s correlation coefficients between DSN Net Merit and its sub-indices with EBVs from the breeding evaluation in August 2019. Only EBVs with at least one significant correlation (P < 0.05) to DSN Net Merit or a sub-index are shown. Significant correlations (P < 0.05) are highlighted with an asterisk *. Correlation coefficients are highlighted in a gradient from blue for perfect negative (r = −1) over white for no correlation (r = 0) to red for perfect positive correlation (r = 1).
The correlations of DSN Net Milk to specific EBVs for milk performance such as the milk production index (r = 1.00, P < 0.001) including fat and protein kg in a ratio of 1:2, fat kg (r = 0.97, P < 0.001), protein kg (r = 0.97, P < 0.001), and milk kg (r = 0.86, P < 0.001) were very strong up to perfect. Moderate positive correlations were found between DSN Net Milk and EBVs for conformation traits such as hock quality (r = 0.60, P < 0.001), angularity (r = 0.49, P = 0.003), type (r = 0.48, P = 0.004), and rear leg side view (r = 0.45, P = 0.008). Moderate negative correlations were observed between DSN Net Milk and the EBV for body condition score (r = −0.46, P = 0.008) as well as EBVs for fertility traits such as days open (r = −0.43, P = 0.022) and first to last insemination in cows (r = −0.40, P = 0.013). Consistently, a weak negative correlation was evident between DSN Net Milk and the EBV daughter fertility index (r = −0.36, P = 0.039).
As expected, DSN Net Fitness correlated significantly with EBVs contributing to this sub-index (functional herd life r = 0.94, P < 0.001; calf survival r = 0.45, P = 0.008; first to last insemination cows r = 0.42, P = 0.015, calving ease direct r = −0.41, P = 0.017); the correlation was suggestive between DSN Net Fitness and EBVs for additional fertility traits (days open r = 0.33, P = 0.064; daughter fertility index r = 0.32, P = 0.072). The DSN Net Fitness was positively correlated to the EBV for somatic cell score (r = 0.57, P < 0.001), where a higher EBV for somatic cell score means lower somatic cell counts. Furthermore, DSN Net Fitness was also positively correlated to EBVs for conformation traits affecting udder quality (udder r = 0.49, P = 0.004; udder depth r = 0.48, P = 0.004; fore udder r = 0.39, P = 0.024; central ligament r = 0.35, P = 0.043; rear udder r = 0.30, P = 0.088). The correlation between DSN Net Fitness and the Total Merit Index RZG was moderately positive (r = 0.51, P = 0.002).
DSN Net Beef was moderately correlated to EBVs for conformation traits such as rear leg side view (r = 0.53, P = 0.002) and body depth (r = 0.38, P = 0.027). DSN Net Beef showed moderate negative correlation to EBV for rear leg rear view (r = −0.37, P = 0.034) and EBVs for fertility traits such as calving to first insemination (r = −0.43, P = 0.013) and suggestively to days open (r = −0.34, P = 0.052). Interestingly, the EBV rear leg side view correlates with both DSN Net Milk and DSN Net Beef in a positive direction (r = 0.45 and r = 0.53, respectively), which implicates that higher yielding cows and heavier young bulls tend to have more angled rear legs than less performing animals. Observation of this correlation to rear leg side view has to be monitored, since it was found that more angled legs in German Holstein cows showed a trend for a shorter productive life compared to cows with less angled rear legs [25]. No correlation could be detected between DSN Net Beef and the Total Merit Index RZG (r = 0.06, P = 0.727).
4. Discussion
In this study, we calculated the values for DSN Net Merit with three sub-indices, namely DSN Net Milk, DSN Net Fitness, and DSN Net Beef, for 33 DSN sires. We adjusted the equations that had been developed originally for the German Holstein population for DSN-specific data. Since DSN is a dual-purpose breed, we added a sub-index accounting for beef traits.
The calculated DSN Net Merits for the 33 sires were approximately normally distributed, but the mean was negative (EUR −113), which is concordant with the average Total Merit Index RZG of the 33 bulls (on average 94). We would expect that the mean of DSN Net Merit over a population is zero. Therefore, we conclude that these 33 DSN sires do not represent the whole sire population. Since we required sires to have at least 10 male offspring with beef data, the 33 sires were most frequently used for artificial insemination within the last decade. Interestingly, the birth year of sires was independent from the DSN Net Merit and RZG, which could be explained by the preservation breeding program. Therefore, very old sires are mated to the current living population to avoid high inbreeding coefficients, but keep the DSN typical characteristics of the breed.
For our calculations, we used local prices for feed, milk and carcasses based on invoices from the two largest DSN farms under conventional production systems. In general, the DSN Net Merit should be valid for most common production systems and for a main part of the population. Nevertheless, the DSN Net Merit has to be re-evaluated every generation interval to see whether the calculated marginal profit still represents the market price situation. For example, milk prices could drop, or beef prices could increase in unforeseen ways. This could lead to a bull shifting from a negative to a positive DSN Net Merit. Furthermore, by selection based on DSN Net Merit, economic developments are incorporated into the breeding decisions in contrast to selection based on the Total Merit Index RZG, which is independent of prices for milk and beef and all costs.
When we developed the DSN Net Merit, we could not sufficiently consider animal health and conformation traits although veterinarian treatments for common diseases cause variable cost components and body conformation is important for milk and meat production. Without EBVs for mastitis resistance, reproduction and metabolic diseases, and claw disorders an implementation of treatment costs to DSN Net Merit is impossible. Nonetheless, DSN Net Fitness shows a positive correlation of r = 0.57 to somatic cell score, which is an indirect indicator for clinical and sub-clinical mastitis [26]. In the future, the estimation of EBVs for health traits in DSN would be necessary to improve the DSN Net Merit calculation.
Based on the magnitude and direction of effect of the three sub-indices for milk, fitness and beef, the 33 sires were assigned to eight different groups, which showed the influence of all three indices on the total DSN Net Merit. This grouping shows how the DSN Net Merit with its three sub-indices can be used as a tool for supporting selection decisions to improve the DSN Net Merit while simultaneously keep the breed-specific dual-purpose type in the DSN population. For example, if a sire shows a negative pattern for all three sub-indices it should be excluded from mating, but two positive sub-indices might still be sufficient as an indication for a good breeding bull. The composition of the DSN Net Merit shows that a positive sub-index for DSN Net Beef cannot compensate the other two sub-indices being negative. We suggest to preserve the dual-purpose type of the DSN breed, through selecting bulls with high DSN Net Beef merits for mating, even if one of the other two indices is negative.
As shown above, although milk production contributes most to the DSN Net Merit, exclusive breeding for high DSN Net Merit would not help to maintain the breed. Breeding a dual-purpose breed has to focus not only on milk performance traits, but also on the amount and quality of beef from young bulls. The latest breeding value evaluation for beef traits (carcass weight, carcass conformation, and carcass fat class) in DSN was performed in 2012 [27]. In order to save costs in the small DSN population, the breeding value estimation for meat was not continued. Since then, the beef production under controlled housing and feeding conditions has not been systematically measured and, therefore, breeding values did not exist. To bridge this gap, we developed DSN Net Beef as a sub-index of DSN Net Merit. This means, selection based on DSN Net Merit could also contribute to improve carcass weight, conformation, and fat class, traits that contribute to DSN Net Beef. In turn, the marginal profit from fatting young bulls could be increased by decreasing marginal costs (higher feed efficiency) and/or increasing marginal revenue (better carcass quality). Therefore, we see an advantage of the DSN Net Merit including the index DSN Net Beef over the currently available Total Merit Index RZG that does not consider meat for breeding and mating decisions. The DSN Net Beef was calculated in this study using a selection index and genetic parameters were taken out of the ANOVA. This method is beneficial for small populations with limited possibilities for breeding evaluation. It could be improved using the REML method in the future, when data flow from the field is routinely implemented and the pedigrees of the young bulls and sires are considered.
In this study, DSN Net Beef accounts for 3.7% of DSN Net Merit. The magnitude is in agreement with breeding strategies in other dual-purpose breeds in Germany that recommend the consideration of about 5% beef traits in the Total Merit Index of breeds like Simmental and Brown Swiss [9]. A different economic importance of beef in comparison to milk and fitness was calculated for the dual-purpose Simmental population in Austria and Germany. There, an economic weight of 38% milk, 18% beef, and 44% fitness for the GZW was revised in April 2016 on economic assumptions [10].
The net merit for beef production is considered also in other countries, for example in Ireland for Irish Frisian, which is also a dual-purpose breed. The Irish net merit sub-index considers the cull weight of a cow, carcass weight, carcass conformation, and carcass fat. It accounts for 8% of the economic weight of the EBI [28], which is more than twice as high as in this study. The specific production conditions in Ireland are the reason for the higher consideration of beef. A direct comparison of DSN Net Beef and EBI for carcass in Irish Friesian is difficult, since the replacement costs of cows belong to the EBI for carcass, but contribute to the DSN Net Fitness and not the Beef index in DSN. Implementing the replacement costs and a cow’s carcass quality to the DSN Net Beef sub-index would lead to a bigger difference between the German Total Merit Index system for DSN and German Holstein.
Differences between DSN Net Merit and EBI can be also found for fertility and calving sub-indices, which are both included in DSN Net Fitness. The higher economic weight of calving (10%) and fertility (35%) in Ireland compared to German DSN dairy farms results from different housing systems. While DSN cattle are predominantly housed in freestall barns with constant calving-rates over the whole year, Irish Frisians are predominantly kept under a seasonal calving pasture. Seasonal calving is economically more vulnerable against low fertility [29,30], since cows with late calvings cannot start their lactation at the beginning of the season, when the nutritional value of the grassland is best.
The EBI for Irish Friesian (less than 10% Holstein) ranges from EUR −183 to +199, the sub-indices for milk production from EUR −112 to +73, for fertility from EUR −140 to +147, for calving from EUR −16 to +65, and for carcass from EUR −33 to +13 [31]. The range of the Irish EBI is around 5-fold smaller compared to DSN Net Merit. It has to be noted, that the population mean is not standardized to zero for the EBI. The marginal profit for carcass weight of 1.22 EUR/kg in Ireland [12] is 13% lower compared to our study for DSN with EUR 1.38 for quality class “R3”. The comparison between the EBI for Irish Frisian and DSN Net Merit shows that the specific economic and environmental conditions in each country largely affect the final Total Merit Index. Therefore, the net merit has to be calculated for the specific conditions of a breed and its environment. Only then it can be used as a selection criterion.
5. Conclusions
Since economical breeding values are becoming common in more and more countries, we developed the equations for calculating a DSN Net Merit for DSN sires. This approach was done on the basis of equations that had been developed for German Holstein dairy breed. To take special features of the DSN breed into account we adjusted the equations from Holsteins in two directions: Firstly, we calculated marginal profits, which are the basis of the economic breeding values, for DSN-specific characteristics under the existing production system and accounted for local costs. Secondly, we introduced the sub-index DSN Beef Merit to account for the economic gain from beef production.
The results show that DSN Net Merit strongly correlates with the Total Merit Index RZG, which has been successfully used in breeding decisions before. Therefore, DSN Net Merit can be used as an economically useful selection tool to improve the economic success, which is at the first glance mainly driven by milk production. However, in addition to DSN Net Merit, the three sub-indices for milk, fitness and beef are of particular value to maintain the dual-purpose type of the breed. The sub-indices DSN Net Fitness and DSN Net Beef may counterbalance the selection for DSN Net Milk. The grouping of sires according to their sub-indices shows that a moderate improvement of milk together with high fitness and maintaining the existing beef type would be sufficient to obtain high Net Merits. This is consistent with the breeding goals for DSN. Thus, in addition to DSN Net Merit, the sub-indices patterns of DSN sires can be used as a simple and useful tool for breeders to select which sires to breed based on the current economic situation. An improvement of the DSN Net Fitness by adding treatment costs for the most occurring health issues in DSN will improve the accuracy of the economic weight within the DSN Net Merit.
Furthermore, we conclude that although the limited economic gains from beef (3.73%) in DSN, it is important to incorporate the DSN Beef Merit into the DSN Net Merit calculation. This needs to be done in order to account for the dual-purpose character of DSN, especially because no strong correlations between the DSN Beef Merit and the current RZG could be found. Meaning that it is currently not possible to support breeding decisions by a reliable EBV for this trait.
The methodology and equations presented in this paper can be modified for other dual-purpose breeds by adjusting the marginal profits. For providing breeders with accurate DSN Net Merit estimates for breeding decisions, we strongly recommend to further record milk production, fertility, and health data as well as monitoring beef production. Our data provide evidence that the DSN Net Merit and its sub-indices DSN Net Milk, DSN Net Fitness, and DSN Net Beef are suitable for economic selection decisions in the breeding program for DSN.
Supplementary Materials
The following are available online at https://www.mdpi.com/2077-0472/11/1/41/s1, Table S1: Proportion of young DSN bulls assigned to carcass conformation classes and to carcass fat classes (EUROP system), Table S2: Biological and economical parameters included in the calculation of DSN Net Merit, Table S3: Equations for calculating marginal profit in Euro per SD (mpσ) corrected for lactation length (LE) and average number of lactations (LA) for absolute EBVs included in DSN Net Milk and DSN Net Beef, Table S4: Equations for calculating marginal profit in Euro per SD (mpσ) corrected for average number of calves (CA) for relative EBVs included in DSN Net Fitness, Table S5: Marginal costs for premature loss of female calves in the respective time interval to survive (days of age) (n = 2578).
Author Contributions
S.M. had the initial idea of the study. S.M., G.F., D.A. and G.A.B. designed the study. S.M. collected and analyzed the data and drafted the manuscript and graphics. P.K., G.F., D.A., S.K., D.S., and G.A.B. helped revising the manuscript. All authors read and approved the final manuscript.
Funding
The project was supported by funds of the Federal Ministry of Food and Agriculture (BMEL) based on a decision of the parliament of the Federal Republic of Germany via the Federal Office for Agriculture and Food (BLE) under the Federal Program for Ecological Farming and Other Forms of Sustainable Agriculture (Funding number: 2815NA010). We acknowledge support by the German Research Foundation (DFG) and the Open Access Publication Fund of Humboldt-Universität zu Berlin.
Institutional Review Board Statement
Ethical review and approval were waived for this study, since this was an entirely theoretical study that did not include any animal samples.
Informed Consent Statement
Not applicable.
Acknowledgments
The RBB Rinderproduktion Berlin-Brandenburg GmbH and associated DSN farms supported this project with their expertise and economic results. The vit (Vereinigte Informationssysteme Tierhaltung w.V., Verden) provided all breeding values and expertise in development of an economic breeding value.
Conflicts of Interest
The authors declare no conflict of interest.
References
- Hoffmann, H.; Pirchner, F.; Dempfle, L. Comparison of Dual versus Single Purpose Cattle. In Proceedings of the World Congress on Genetics Applied to Livestock Production, Madrid, Spain, 4–8 October 1982; pp. 399–413. [Google Scholar]
- Bundesverband Rind und Schwein e.V. Rinderzucht in Deutschland 2018; BRS: Bonn, Germany, 2019. [Google Scholar]
- Commission, E. Weekly Prices for Live Animals 2019. Available online: https://ec.europa.eu/info/food-farming-fisheries/farming/facts-and-figures/markets/prices/price-monitoring-sector/animal-products/beef/live-animals/2019_en (accessed on 16 September 2020).
- RBB Rinderproduktion Berlin-Brandenburg GmbH. Deutsches Schwarzbuntes Niederungsrind—Lebendes Kulturerbe. Available online: https://www.rinderzucht-bb.de/de/zucht/dsn-genreserve/ (accessed on 21 November 2019).
- Koenen, E.P.C.; Berentsen, P.B.M.; Groen, A.F. Economic values of live weight and feed-intake capacity of dairy cattle under Dutch production circumstances. Livest. Prod. Sci. 2000, 66, 235–250. [Google Scholar] [CrossRef]
- Timmreck, H. Vergleichende Untersuchungen zwischen den Milchkuhrassen Deutsch-Schwarzbuntes Niederungsrind und Deutsche Holstein in Bezug auf Rationsgestaltung, Futteraufnahme sowie ausgewählte Leistungsparameter und Körpermerkmale; Humboldt-Universität zu Berlin: Berlin, Germany, 2012. [Google Scholar]
- Stakelum, G.; Connolly, J. Effect of Body Size and Milk Yield on Intake of Fresh Herbage by Lactating Dairy Cows Indoors. Irish J. Agric. Res. 1987, 26, 9–22. Available online: https://www.jstor.org/stable/25556173 (accessed on 6 April 2020).
- VIT. Estimation of Breeding Values for Milk Production Traits, Somatic Cell Score, Conformation, Productive Life and Reproduction Traits in German Dairy Cattle. Available online: https://www.vit.de/fileadmin/DE/Zuchtwertschaetzung/Zws_Bes_eng.pdf (accessed on 20 August 2019).
- Lind, B. Ableitung der Wirtschaftlichkeitskoeffizienten und Optimalen Indexgewichte des Gesamtzuchtwertes für die Deutschen Milch-und Zweinutzungsrassen unter Berücksichtigung Aktueller und Erwarteter zukünftiger Rahmenbedingungen. Ph.D. Thesis, Georg-August-Universität, Göttingen, Germany, 2007. [Google Scholar]
- Fürst, C. Zuchtwertschätzung beim Rind—Grundlagen, Methoden und Interpretationen; ZuchtData GmbH: Vienna, Austria, 2019; Available online: http://cgi.zar.at/download/ZWS/ZWS.pdf (accessed on 6 April 2020).
- Sölkner, J.; Miesenberger, J.; Willam, A.; Fürst, C.; Baumung, R. Total merit indices in dual purpose cattle. Arch. Anim. Breed. 2000, 43, 597–608. [Google Scholar] [CrossRef][Green Version]
- Berry, D.P.; Shalloo, L.; Cromie, A.R.; Olori, V.E.; Amer, P. Economic Breeding Index for Dairy Cattle in Ireland. In Technical Report to the Irish Cattle Breeding Federation; Irish Cattle Breeding Federation: Cork, Ireland, 2005; pp. 1–31. [Google Scholar]
- Van Doormaal, B.J.; Kistemaker, G.J.; Beavers, L.; Sullivan, P.G. Pro$: A New Profit-Based Genetic Selection Index in Canada. Interbull 2015, 49, 103–110. [Google Scholar]
- VanRaden, P.M. Invited review: Selection on net merit to improve lifetime profit. J. Dairy Sci. 2004, 87, 3125–3131. [Google Scholar] [CrossRef]
- VanRaden, P.M. Net Merit as a Measure of Lifetime Profit—2000 Version. AIPL Research Report. Available online: https://aipl.arsusda.gov/reference/nmcalc-2000.htm (accessed on 1 March 2020).
- Rensing, S.; Kipp, S. Neuer Gesamt-Zuchtwert RZ€. ZWS-Infoveranstaltung Online 27. April 2020, Verden, Germany. Available online: https://www.vit.de/fileadmin/DE/Zuchtwertschaetzung/Der_neue_RZEuro_pptx.pdf (accessed on 9 July 2020).
- Kipp, S.; Rensing, S.; Segelke, D.; Reents, R. Ergebnisse zur Etablierung eines ökonomischen Indexes und zur Neugestaltung des RZG. In Mitgliederversammlung der BRS-FG-Milchrind; BRS: Kassel, Germany, 2019; pp. 1–61. [Google Scholar]
- Kipp, S. Richtig züchten: Der RZ€ legt den Fokus auf die ökonomisch erfolgreiche Zucht. Milchrind 2020, 2, 4–8. [Google Scholar]
- The European Commission. Commission Delegated Regulation (EU) 2017/1182; Official Journal of the European Union: Brussels, Belgium, 2017; pp. 74–99. [Google Scholar]
- Martin, J.; Münch, H.; Jänsch, M. Deutsches Schwarzbuntes Niederungsrind im Leistungsvergleich. In Blickpunkt Rind 2/3; RBB Rinderproduktion Berlin-Brandenburg GmbH: Groß Kreutz, Germany, 2019; pp. 38–39, 48–49. [Google Scholar]
- Miller, G.; Jarvis, J.; McBean, L. Handbook of Dairy Foods and Nutrition, 2nd ed.; CRC Press: Boca Raton, FL, USA, 1999. [Google Scholar]
- Artavia, M.; Deppermann, A.; Filler, G.; Grethe, H.; Häger, A.; Kirschke, D.; Odening, M. Ertrags-und Preisinstabilität auf Agrarmärkten in Deutschland und der EU. In Möglichkeiten und Grenzen der Wissenschaftlichen Politikanalyse; vTI: Braunschweig, Germany, 2010; Volume 50, Available online: https://ageconsearch.umn.edu/record/93956 (accessed on 27 December 2020).
- Wahlsten, D. Insensitivity of the analysis of variance to heredity-environment interaction. Behav. Brain Sci. 1990, 13, 109–161. [Google Scholar] [CrossRef]
- Van der Werf, J. Simple selection theory and the improvement of selection accuracy. In Animal Breeding: Use of New Technologies; Kinghorn, B.P., Van der Werf, J., Ryan, M., Eds.; University of Sydney: Sydney, Australia, 2000; pp. 19–34. [Google Scholar]
- Johannssen, J.; Römer, A. Which factors have an influence on birth weight? In Gesunde Milchkühe—Ergebnisse aus den Testherden MV Heft 60; Sanftleben, P., Katroschan, D.-U., Heilmann, H., Arndt, G.-M., Eds.; Landesforschungsanstalt für Landwirtschaft und Fischerei: Gülzow, Germany, 2018; pp. 50–54. [Google Scholar]
- Berry, D.P.; Shalloo, L.; Cromie, A.; Olori, V.; Veerkamp, R.; Dillon, P.; Amer, P.; Evans, R.; Kearney, F.; Wickham, B. The Economic Breeding Index: A Generation on. Technical report to the Irish Cattle Breeding Federation. Irish Cattle Breed. Fed. 2007, 1–50. Available online: http://www.icbf.com/publications/files/economic_breeding_index.pdf (accessed on 1 March 2020).
- Zuchtwertschätzung auf Fleischleistung; Landesamt für Verbraucherschutz Landwirtschaft und Flurneuordnung: Frankfurt, Germany, 2012.
- DoveaGenetics. Economic Breeding Index (EBI). Available online: https://www.doveagenetics.co.uk/economic-breeding-index-ebi (accessed on 6 October 2020).
- Evans, R.D.; Dillon, P.; Shalloo, L.; Wallace, M.; Garrick, D.J. An economic comparison of dual-purpose and Holstein-Friesian cow breeds in a seasonal grass-based system under different milk production scenarios. Irish J. Agric. Food Res. 2004, 43, 1–16. [Google Scholar]
- Olori, V.E.; Meuwissen, T.H.E.; Veerkamp, R.F. Calving interval and survival breeding values as measure of cow fertility in a pasture-based production system with seasonal calving. J. Dairy Sci. 2002, 85, 689–696. [Google Scholar] [CrossRef]
- ICBF.Bull Proofs (11/2019). Available online: https://www.icbf.com (accessed on 22 January 2020).


Publisher’s Note: MDPI stays neutral with regard to jurisdictional claims in published maps and institutional affiliations. |
© 2021 by the authors. Licensee MDPI, Basel, Switzerland. This article is an open access article distributed under the terms and conditions of the Creative Commons Attribution (CC BY) license (http://creativecommons.org/licenses/by/4.0/).