Article

Infrared Thermography of the Mammary Gland in Sows with Regard to Health and Performance

1
Clinic for Swine and Small Ruminants, Forensic Medicine and Ambulatory Service, University of Veterinary Medicine Hannover, Foundation, D-30173 Hannover, Germany
2
Institute for Animal Nutrition, University of Veterinary Medicine Hannover, Foundation, Bischofsholer Damm 15, D-30173 Hannover, Germany
3
Department of Animal Sciences, Livestock Systems, Georg-August-University Göttingen, Albrecht-Thaer-Weg 3, D-37075 Göttingen, Germany
4
BHZP GmbH, An der Wassermühle 8, D-21368 Dahlenburg-Ellingen, Germany
5
Department of Animal Sciences, University of Göttingen, Burckhardtweg 2, 37077 Göttingen, Germany
6
EVH Select GmbH, An der Feuerwache 14, D-49716 Meppen, Germany
*
Author to whom correspondence should be addressed.
Agriculture 2021, 11(10), 1013; https://doi.org/10.3390/agriculture11101013
Submission received: 15 September 2021 / Revised: 29 September 2021 / Accepted: 14 October 2021 / Published: 17 October 2021
(This article belongs to the Special Issue Swine Diseases: Prevention, Control and Food Safety)

Abstract

:
Monitoring of sows’ health is the key to preventing and controlling diseases in sows, and it guarantees optimal rearing conditions for piglets. The aim of this study was to investigate the relationship between the health status of sows shortly after parturition, and to analyze thermographic images of the mammary gland and the sows’ performance. Clinical examination of a total of 513 db.Viktoria hybrid sows was bundled individually using a modified score system. According to this, animals were divided into three health classes: healthy, clinically suspicious, and diseased. Simultaneously, the mammary glands were investigated by infrared thermography. Total born piglets (TBP), number of piglets born alive (NBA), and the daily weight gain of the piglets were significantly lower in the diseased group (p < 0.05). Regarding the results of the thermographic images of the mammary gland, significantly higher mean value of the warmest pixels was found in the diseased group (38.3 °C ± 0.57), while the significantly lowest value was reported in the healthy group (37.2 °C ± 0.54; p < 0.05). The results of this study show that thermography of the mammary gland at birth contains information that can help to identify diseased animals whose disease has negative effects on their piglets.

1. Introduction

In recent years, the fertility performance of sows has increased [1,2]. According to the annual reports from the Association for the promotion of pig farming (Verein zur Förderung der Schweinehaltung (VzF)) for the marketing years 2007/2008 and 2019/2020, the average number of piglets weaned per sow per year increased from 23.1 to 29.6 during this period [3,4]. This is typical for Germany and also applies to Europe and beyond [1,5]. The milk yield has not increased proportionally to the number of piglets [6]. Newborn piglets have limited glycogen reserves [7,8], so that colostrum is their main source of energy during the first 12 h of life [9] as well as being an important source of energy until 34 h after birth [7]. In addition, lightweight piglets have fewer glycogen reserves than heavier ones [10]. Because the number of live-born piglets correlates negatively with birth weight and the weight variation within the litter increases [5,11,12], more piglets have particularly limited reserves [2,5,10,13]. For this reason, and because colostrum and milk intake have a dominant influence on growth rates of suckling piglets [14,15], nowadays it is more important than ever that all piglets are provided with sufficient amounts of colostrum and milk [16,17,18]. This goal can only be achieved by healthy sows [19,20,21,22]. It has long been known that postpartum dysgalactia syndrome (PDS) of sows has negative effects on the weaning litter weight [23] and the daily weight gain of their piglets [24]. Productivity of sows depends on early detection of a disease so that it can be treated as quickly as possible [25]. To date, decreased feed intake and fever, which is characterized by a body temperature that is above 39.5 °C, is considered the leading symptom of PDS [26]. In addition, in the case of uterine inflammation, there may be both persistent and purulent discharge [27]. Mastitis may be characterized by swelling and redness of the udder and hypo- or agalactia. Moreover, animal behavior is used to make the diagnosis. For example, sows with inflammation of the udder are more likely to lie on their bellies and breasts [27,28,29]. If agalactia occurs, hungry piglets are conspicuous due to restless behavior [22,30] and later injured carpal joints, bite wounds in the head area, increased mortality in the first week of life, and retardation in growth [19]. If the sow eats adequately and the above symptoms do not occur, the sow is considered healthy.
As a supplement to the clinical signs mentioned above or even as an alternative to taking a rectal temperature, infrared thermography is a promising technology [31,32,33]. Compared to taking a temperature, it has the great advantage of being less invasive and involving less risk of spreading germs because it is contactless [34,35]. It also means less stress for the animals. Moreover, it should be noted that stress can lead to inaccurate rectal temperature readings [36], and absence of stress is good for animal welfare [37]. There are several studies showing that mastitis diagnosis in dairy cows is possible using infrared cameras [38,39,40]. It has also been shown in other areas of livestock animals that it is possible to draw conclusions from thermographic images concerning the comfort [41] and rectal temperature of animals [42,43].
Thus, this study aimed to examine whether there are correlations between the above clinical parameters and content of the thermal images from the respective sows’ mammary gland. Furthermore, it set out to ascertain whether there are correlations between the rearing performance of sows and the thermal image of the mammary glands.

2. Materials and Methods

The animal housing and data collection took place in accordance with German regulations. No relevant interventions according to the German Animal Welfare Act had been carried out on live animals (Approval by the Animal Welfare Officer of the University of Veterinary Medicine Hannover, Foundation, Hannover, reference: TVO-2020-V-9).

2.1. Animals, Housing and Feeding

The data for the present study were collected on a farrow-to-feeder farm in Lower Saxony, Germany from August 2019 to November 2020. The study was conducted using db.Viktoria hybrid sows (BHZP Landrace x BHZP Edelschwein) with a total of 513 sows aged from 1 to 6 years from the Bundes Hybrid Zucht Programm (BHZP), Ellringen, Germany. Several sows have been examined more than one time. Therefore, a total of 754 sows at birth were examined. The farm produced at two-week batch farrowing with 500 sows and a 21-day lactation period, so around 50 sows were grouped per batch. The barn had a total of six farrowing units, four units each containing 24 ProDromi farrowing pens and two units each containing six ProDromi farrowing pens. The farrowing units were equipped with forced ventilation (negative pressure system).
Sows were housed in farrowing crates, and litters were usually standardized within the first 24 h of birth. At day 109 of gestation (see Figure 1), day 7 before farrowing (d-7), the sows entered the farrowing room. The nutrient content of the diet in accordance with the declaration is shown in Table 1. From d-7 to d-3, feed was offered twice daily, from d-2 to d0 (during farrowing) once, from d1 and d2 (shortly after farrowing) twice, and from d3 onwards three times. All sows were acclimated to the diets (3750 g/d) 5 days prior to farrowing. Subsequently, the farrowing period ran from d-3 to d1.
In addition, milk replacer (Vilofoss Speedy Milk, VILOFOSS, Deutsche Vilomix Tierernährung GmbH, Neuenkirchen-Vörden, Germany) was offered to suckling piglets from the first day postpartum. Vilofoss Speedy Junior (VILOFOSS, Deutsche Vilomix Tiernährung GmbH) was also sprinkled daily on the lying area in the piglet nest. From day 19 postpartum, two handfuls of Vilofoss Speedy Junior were sprinkled on the lying surface every day. All animals had free access to public water during the whole production cycle.

2.2. Design of the Study and Data Collection

The data from the sows and the piglets were collected as shown in Figure 1, in parts only in the study period (thermal images; skin scoring of piglets). Sows were weighed before being placed in the farrowing pen and at the day of weaning (Figure 1). Additionally, the back fat was measured by using a backfat scanner (Lean-meater®, series 12, Renco Corp., Golden Valley, MN, USA) before farrowing and at day 17 of lactation (Figure 1). During the experimental period, clinical examination and mammary thermography were performed at three different time points: at the day of farrowing or shortly thereafter and at about 14 days and at weaning (Figure 1).
In addition, the bodyweight of the piglets was determined within 24 h after birth and at weaning, and the skin of piglets was scored at five days after birth (Figure 1) using the modified scoring from the Board of Trustees for Technology and Construction in Agriculture (Kuratorium für Technik und Bauwesen in der Landwirtschaft (KTBL)) [44]. In short, scores were 0 for no fresh/bloody or encrusted injuries on the carpal joints with a diameter of 0.5 cm or more, 1 being given for less than 50% of the litter with fresh/bloody or encrusted injuries with a diameter of about 0.5 cm, and 2 for more than 50% of the litter with fresh/bloody or encrusted injuries on the carpal joints with a diameter of 0.5 cm or more. Injuries with a diameter of less than 0.5 cm were not documented. Only the skin at the carpal joints was scored because there were no piglets with wounds on the face or other injuries.

2.3. Measurements

2.3.1. Clinical Examination and Mammary Thermography

Clinical examination was carried out by inspection and palpation of the udder followed by the mammary thermography (left and right side of the udder) to find PDS-affected sows. Each complex of the mammary gland was examined individually using a modified score system [31] and the results were documented. The characteristics of the degree of formation, increase in circumference, reddening, consistency, knots, pain, scratches, and teat injuries were recorded (Table 2). In the case of scratches and teat injuries, a distinction was only made between yes and no. Three gradations were made for the other characteristics (Table 2). No feed intake or purulent discharge were documented. When sows were reluctant to stand up then that was documented, too.
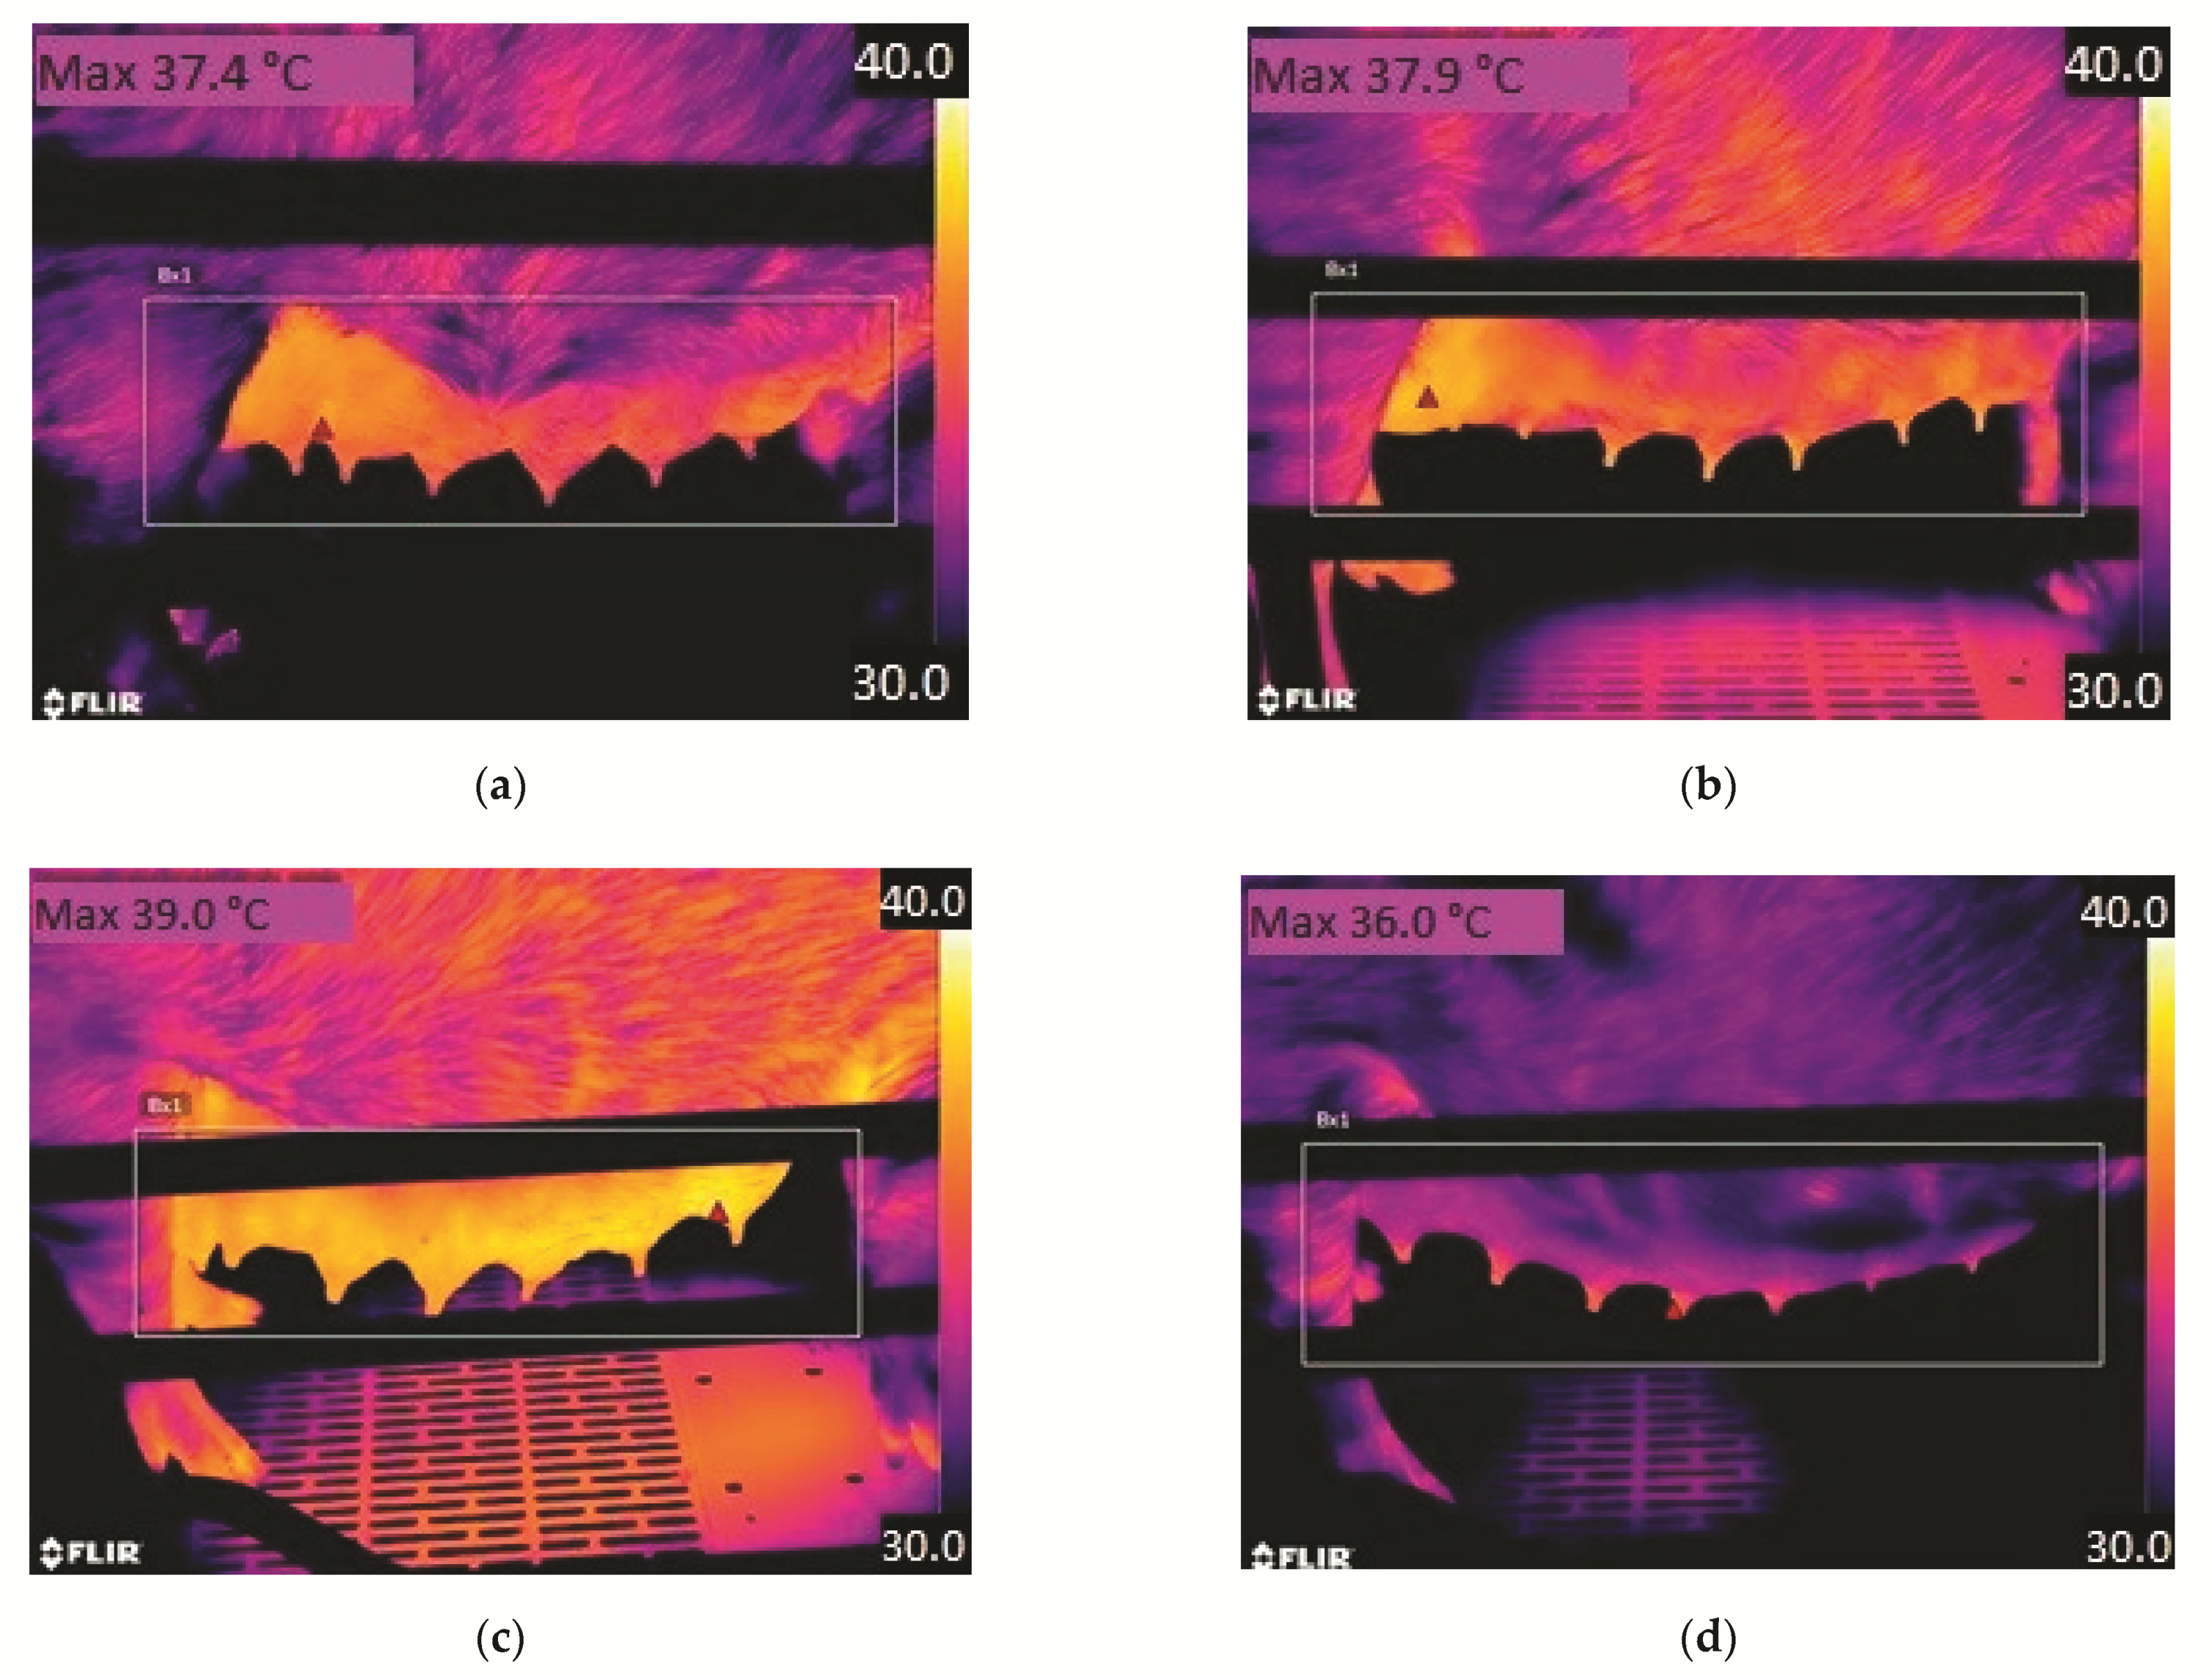
After the clinical examination of the sows, a thermal image was made of the sows’ udder in the standing position from a distance of 90 to 110 cm, avoiding an angle of less than 60° [31], (FLIR T540, FLIR Systems, Inc., Wilsonville, OR, USA). Some examples are shown in Figure 2. The distance from the camera to the mammary gland was indicated by the camera for each image. The emissivity was set to 0.96 [31,45]. Thermography of the mammary complexes on the right and the left side was performed separately. Because of the ProDromi farrowing pens, the heating plates of the piglet nests did not have to be covered to prevent stray radiation. In addition, the routinely collected rectal temperature was measured at the end of the thermography with a Veterinary Thermometer VT 1831 (Microlife AG, Widnau, Switzerland).
Before entering a farrowing unit and immediately after all sows had been examined, the room temperatures as displayed by the barn equipment were recorded. In order to check the measurement quality of the stable equipment, the temperature was also measured continuously with TGP-4500 Tinytag Plus 2 temperature loggers. The comparison showed only minor differences, so it can be assumed that the calibrated barn thermometers had a high measuring accuracy.
The thermal images were then evaluated using the FLIR Tools program (FLIR Systems, Inc.) in such a way that the temperature of the warmest pixel was noted on each side of the udder.
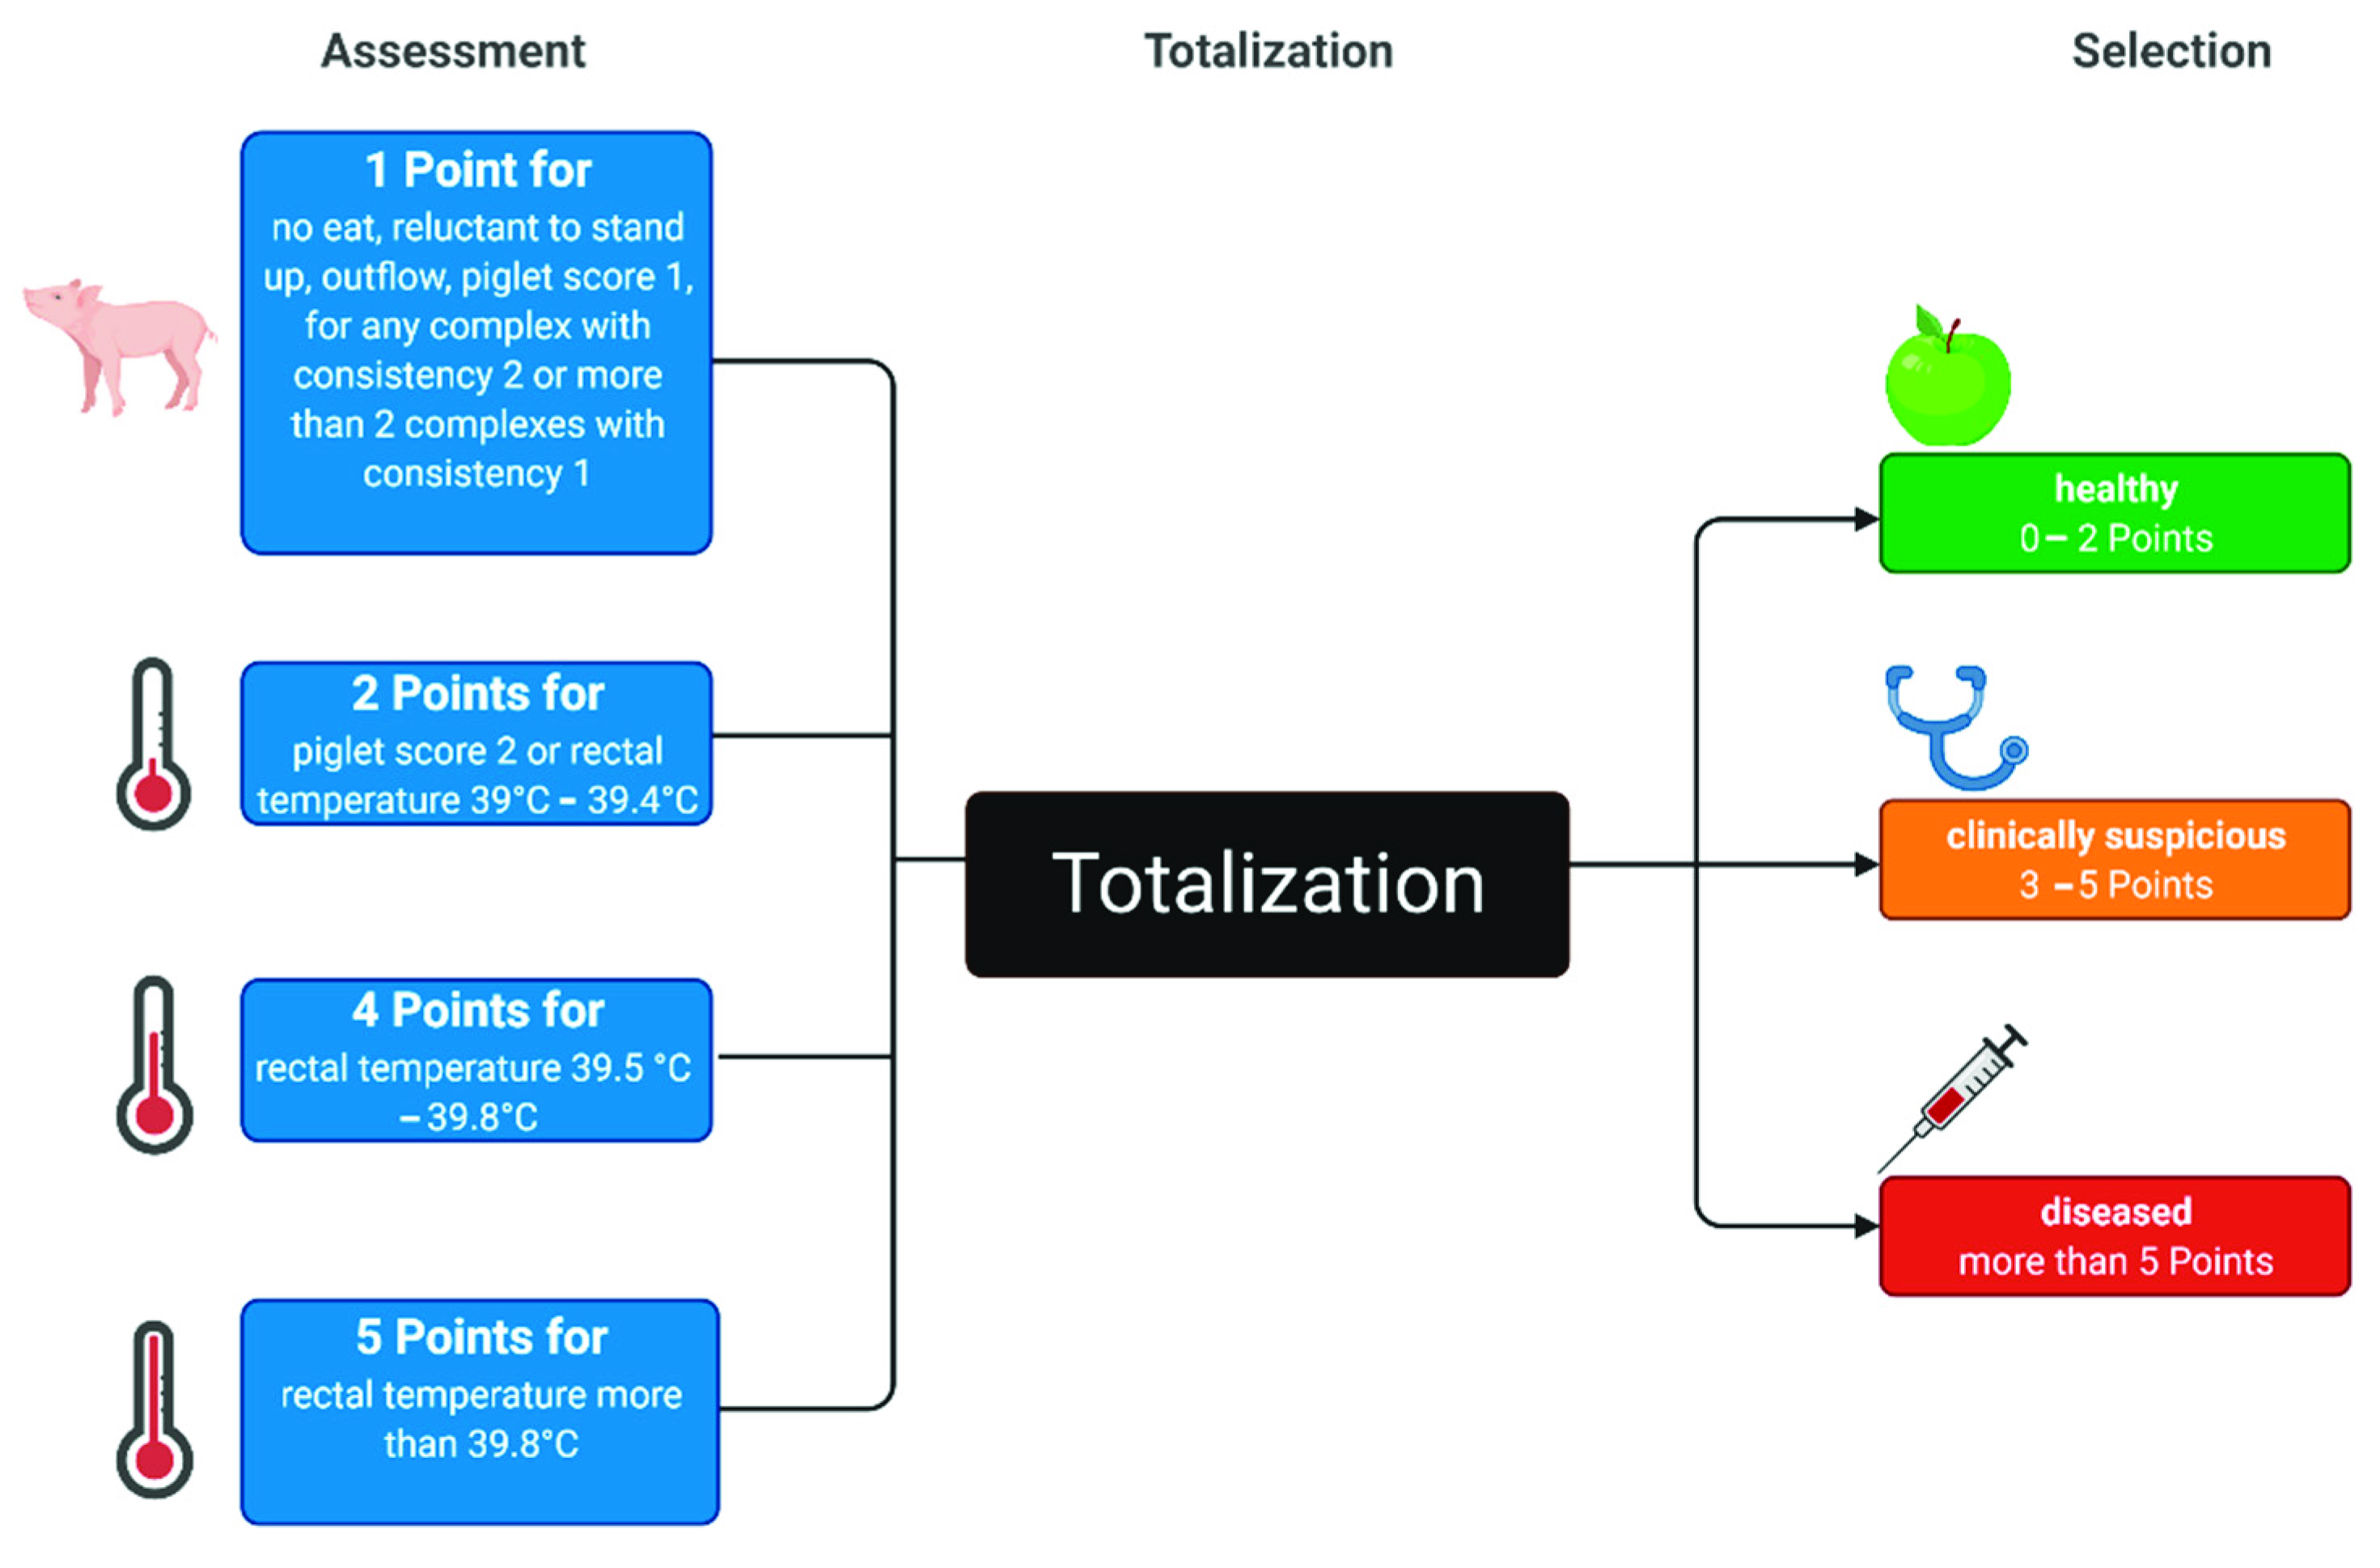
The clinical data were subsequently bundled using a health score (Figure 3). The more and clearer clinical findings a sow and her litter showed during the examination, the more points she collected. If the sow was reluctant to stand up, if the sow had purulent discharge, if the sow did not eat, if she had at least three complexes with a consistency of 1 or if the piglets were given a rating of 1, each finding was awarded one point. There was also one point for each complex with the consistency 2. Two points were allocated if the rectal temperature was ≥39 °C and ≤39.4 °C. If the rectal temperature was ≥39.5 °C and ≤39.8 °C, four points were given. Five points were awarded if the temperature was ≥39.9 °C. If a sow was given a total of zero to two points, she was considered healthy, in the case of three to five points, clinically suspicious, and when allotted more than five points, diseased. Using this score, all sows that were in labour or after birth were divided into the categories healthy, clinically suspicious or diseased (Figure 3). If the sow had not yet given birth to any piglets at the time of examination, she was not allotted to any of the three groups. Of the mammary score, only consistency was included in the total score because other alterations were not detected with regard to other parameters of the mammary gland.

2.3.2. Performance Parameters

Within the first 24 h after birth, the piglets were weighed and individually marked. A second weighing took place at weaning. During this period, the daily BW gain of each piglet in an individual litter could be determined. A litter equalizing usually took place exactly 1 day after birth.
In addition, the sows were weighed when they were moved to and out of the farrowing pen. This was carried out with low floor scales (Meier-Brakenberg GmbH & Co. KG, Extertal, Germany). There was space for four sows at the same time on the scales. Therefore, four sows were left on the scales, one after the other being taken off and the weight of the sow that was last taken off the scales was determined by calculating the difference.
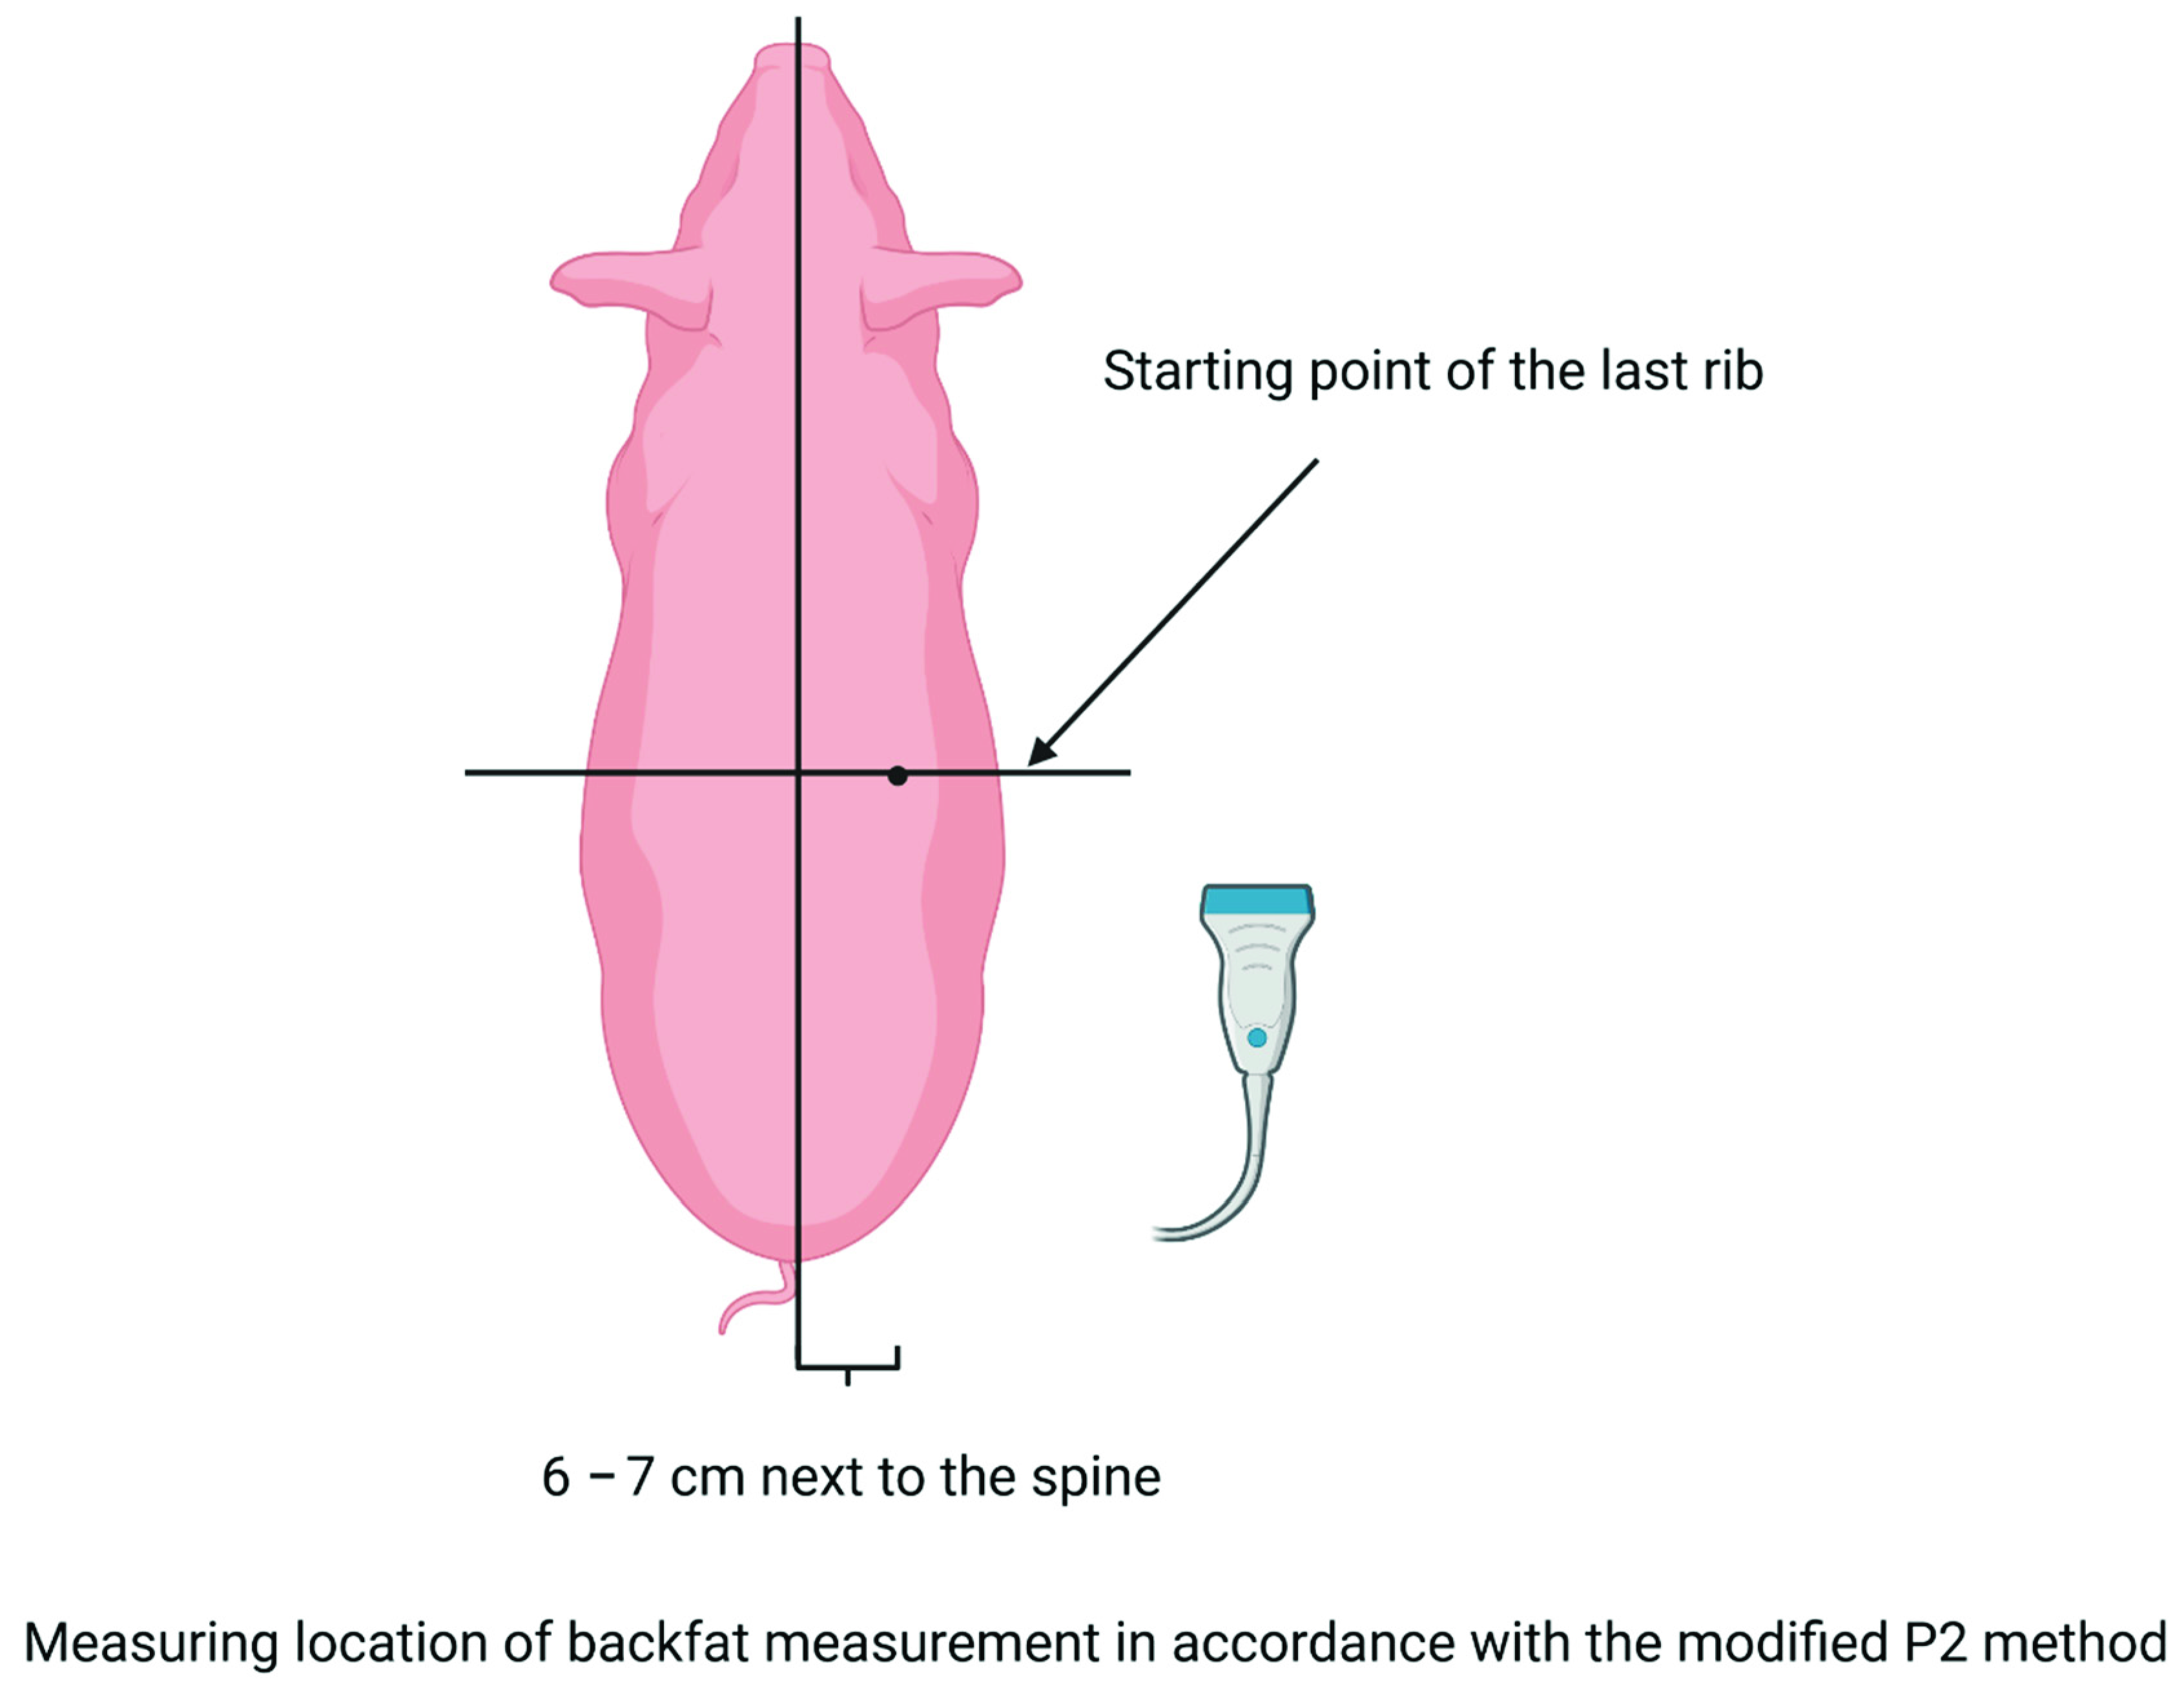
Sow backfat was measured with a backfat scanner (Lean-meater®, series 12, Renco Corp., Golden Valley, MN, USA), this taking place shortly after the pigs had been moved to and shortly before the pigs had left the farrowing house. The backfat thickness was measured using a modified P2 method (Figure 4) on the right side of the spine [46,47]. Measurements were taken three times at each point and a mean value was calculated from the three measured values. For technical reasons, not all parameters could be collected for each sow.
Furthermore, all routinely recorded data from the sow management software were available. This means TBA, number of stillborn piglets (NS), NBA, number of piglets died before weaning (PWM) and number of weaned piglets (NWP) for each sow per litter.

2.4. Statistical Analysis

Data were statistically analyzed using the SAS Enterprise Guide (version 7.1, Fa. SAS Institute Inc., Cary, NC, USA). All charts were created with MS Office Excel 2016. Mean values and the standard deviation were calculated for all parameters shown in Table 3, Table 4 and Table 5. Differences between health categories were examined by using a one-way analysis of variance (ANOVA). For multiple pairwise means comparison between the three groups, the Ryan–Einot–Gabriel–Welsch multiple-range test (REGWQ) was used. The Kolmogorov–Smirnov test was used to test for normal data distribution. Data, for which the correlations are given in Table 5, were all normally distributed. Therefore, the correlation coefficient was determined in accordance with Pearson. In accordance with Akoglu [48], 0.00–0.29 meant poor correlation, 0.3–0.59 fair correlation, 0.6–0.79 moderate correlation, 0.8–0.99 very strong correlation and 1 perfect correlation.

3. Results

3.1. Performance Parameters

The results of the evaluations carried out for sow and piglet performance parameters are shown in Table 1. Significantly lower TBP and NBA were observed in the diseased group (TBP (n): healthy; 17.3 ± 3.30, clinically suspicious; 17.5 ± 3.29, diseased; 16.4 ± 3.71 (p < 0.05) and NBA (n): healthy; 16.3 ± 3.43, clinically suspicious; 16.7 ± 3.30, diseased; 15.3 ± 3.97 (p < 0.05), Table 3). In addition, the daily weight gain of the piglets from birth to 2nd weighing (DWG) was significantly lower in the diseased group compared with the clinically suspicious and healthy group (healthy: 194 g ± 32.1, clinically suspicious: 191 g ± 33.1, diseased: 183 g ± 38.2, (p < 0.05), Table 3). Sow body weight at weaning (SW2) was significantly lower in the clinically suspicious group (healthy: 222 kg ± 32.7, clinically suspicious: 215 kg ± 35.0, diseased: 221 kg ± 32.2, (p < 0.05) Table 3). No weight differences were observed between the three sow groups at farrowing house entry and at weaning. In addition, no differences were found between the groups for the back-fat thickness (BFT), NWP during the experimental period, NS and the PWM.

3.2. Thermography-Associated Data

Furthermore, rectal temperature (RT) and the mean value of the highest temperature of the sow’s mammary gland were measured by using thermography (TH) for the three different time points (shortly after birth, 14 days after birth and at weaning) on the three health condition groups as shown in Table 4. Differences between the data shortly after birth regarding the healthy, clinically suspicious, and diseased groups were statistically significant (RT0: healthy; 38.8 °C ± 0.29, clinically suspicious; 39.2 °C ± 0.24, diseased; 39.9 °C ± 0.43; TH0: healthy; 37.2 °C ± 0.54, clinically suspicious; 37.6 °C ± 0.54, diseased; 38.3 °C ± 0.57 (p < 0.05), Table 4). None of the sows had received antibiotic treatment for at least 7 days prior to the study. All gilts were treated with 15 mL metamizole sodium (Metapyrin® 500 mg/mL) 24 h or more before the examination shortly after birth. From experience, the farmer was able to achieve a positive influence through the analgesic effect, which was expressed in low losses in suckling piglets. The RT at days 14 after birth and at weaning was significantly lower in the healthy group (RT14: healthy; 38.9 °C ± 0.35, clinically suspicious; 39.0 °C ± 0.37, diseased; 39.0 °C ± 0.35; RT21: healthy; 38.5 °C ± 0.41, clinically suspicious; 38.7 °C ± 0.43, diseased; 38.7 °C ± 0.48 (p < 0.05), Table 4). In addition, the TH value was significantly lower in the healthy group at days 14 after birth and at weaning (TH14: healthy; 37.6 °C ± 0.60, clinically suspicious; 37.7 °C ± 0.60, diseased; 37.8 °C ± 0.69; TH21: healthy; 37.3 °C ± 0.64, clinically suspicious; 37.4 °C ± 0.63, diseased; 37.5 °C ± 0.68 (p < 0.05), Table 4).

3.3. Correlation Analysis

Table 5 shows the Pearson correlation coefficient between two variables from 11 investigated parameters including the rectal temperature, mean value of the highest temperature from the right and left thermal image of the breast, and the sows’ weight. Moderate correlations (r = correlation coefficient) occurred between the TH14 and the TH21 (r = 0.75, p < 0.0001), the RT21 and the TH21 (r = 0.69, p < 0.0001) and the RT0 and the TH0 (r = 0.68, p < 0.0001). Fair correlations occurred between the RT14 and RT21 (r = 0.57, p < 0.0001), the RT14 and the TH14 (r = 0.56, p < 0.0001), the RT14 and TH21 (r = 0.48, p < 0.0001) and the RT21 and the TH14 (r = 0.44, p < 0.0001). Weak correlations occurred between the TH0 and the TH14 (r = 0.39, p = 0.0001), the TH0 and the TH21 (r = 0.34, p < 0.0001) and the SW2 and the SWD (r = 0.31, p < 0.0001). A poor correlation occurred between the RT0 and RT21 (r = 0.21, p < 0.0001) and the RT21 and the TH0 (r = 0.2, p < 0.0001). Negative fair correlation occurred between the SW2 and the RT14 and RT21 (both r = −0.38, p < 0.0001), the SW2 and the TH21 (r = −0.36, p < 0.0001), the SW2 and the TH14 (r = −0.31, p < 0.0001) and the SW2 and the NBA (r = −0.25, p < 0.0001). All listed correlations were significant with p < 0.0001.

4. Discussion

The fertility performance of sows and especially the litter size of sows has increased in the last years [1,2,5]. PDS-diseased sows have less milk than healthy sows [19], so it is very important to perform health control of sows around parturition as densely as possible to detect PDS early on to respond appropriately. By now, infrared thermography has become an established and useful monitoring tool where the skin temperature can be measured in real time in a noncontact manner in livestock [9,49,50,51]. Additionally, it allows a more precise diagnosis of sow mammary gland alterations [31,32], which is necessary for treatment in time [19].

4.1. Performance Parameters

In our study, a lower number of TBP and NBA was found in the group of diseased sows. This is not in accordance with a previous study [30] that found that more than 13 piglets born alive increased significantly the probability of coliform mastitis. Another publication reports no differences in TBP and NBA between litters from healthy (12.5 ± 1.2/11.8 ± 1.3) and PDS-affected sows (12.4 ± 1.3/11.9 ± 1.1) [23]. We found no significant differences in the NWP between the three groups. This is not in accordance with a previous review [19] that reported in general that there is a lower number of weaned piglets in sows with postpartum dysgalactia syndrome. Patra et al. [52] compared the consequences of PDS of crossbred sows (Hampshire x Ghungroo) kept in the tropics (India) in summer and winter. In winter, the PDS-affected sows weaned significantly fewer piglets than the healthy sows (PDS-affected; 4.56 ± 2.24, healthy; 7.87 ± 2.5; (p < 0.01)), while in summer, there was no significant difference (PDS-affected; 7.33 ± 3.07, healthy; 8.19 ± 2.64).
Average daily weight gains of suckling piglets were significantly lower (5.7%) in the diseased group in our study. This is in accordance with a previous investigation [24] that reported an approximately 5% less daily weight gain from the third day of life till weaning through PDS of the sow. Other authors reported about significant differences of daily weight gain in piglets in winter (PDS-affected; 97.78 g ± 23.76, healthy; 132.25 g ± 36.1) and in summer (PDS-affected; 118.63 g ± 18.73, healthy; 141.56 ± 30.03) [52]. In addition, a significant difference (p < 0.01) was detected between the weaning weight of litters of healthy and PDS-affected sows: 77.3 kg ± 3.2 for a litter from a healthy sow and 68.2 kg ± 2.1 for a litter from a PDS-affected sow [23]. Another publication only reported differences by trend of daily weight gain of suckling piglets from healthy and PDS-affected sows till weaning [53]. Two feeding groups were compared. Group one was fed a normal gestation diet and then a lactation diet. Group two received the same diets, but at day 20 prepartum and day 28 postpartum, the diet was supplemented with Bacillus licheniformis. In feeding group one, weaned piglets from healthy sows weighed 6.92 kg and those from PDS-affected sows 6.23 kg on average. In feeding group two, weaned piglets from healthy sows weighed 7.24 kg and those from PDS-affected sows 7.19 kg on average [53].
In summary, the results from our study and previous findings show that illness of sows in the peripartal period results in a longer-lasting disadvantage for piglets, at least up until weaning [23,52]. The cause may be less colostrum and milk production as a result of the disease. The lower number of TBP and PBA in the diseased group could not be associated with birth complications because the number of stillborn piglets (NS) and preweaning mortality (PWM) did not differ significantly between the three groups. The fact that there were no significant differences in NWP between the three groups could be explained by the practice of transferring piglets between the litters, especially exactly after the first day of life. This indicates that good farm management and professional farm work means active animal welfare.

4.2. Infrared Thermography

According to the rectal temperature and thermography results, all three groups differed significantly at RT0 and TH0 (shortly after farrowing). In addition, a strong correlation was found between the rectal temperature and the warmest pixel in the thermal image of the mammary gland at this time point. This agreed with previous studies. A highly significant correlation was reported in a study that investigated sows’ mammary glands by thermography at 21 d, 7 d and 1 d before birth and in addition 1 d, 3–4 d and 14 d after birth [31]. Using a computer program, the average skin temperature of each mammary complex was calculated and found significant correlations between the first six complexes when taking rectal temperature at all specified time points. Another investigation found a moderate correlation between the mammary temperature and rectal temperature [32]. In conclusion, in our study the diseased group had the highest rectal temperature and the highest temperature in the thermographic image, especially shortly after birth, and probably the lowest performance parameters. Therefore, thermographic imaging of the mammary gland shortly after birth could help to identify sows with low performance disease-related data. Thermography would be even more effective in diagnosing mastitis [31], but there was no clear mastitis in our study.
Room temperature has no effect on the rectal temperature of sows, so we concluded that it does not influence the animal welfare of the animals in our study.
In our study, the animals in the healthy group had a significantly lower rectal temperature and a significantly lower temperature of the warmest pixel in the thermal image of the udder at 14 days after birth and at weaning. There was also a moderate correlation between RT14, RT21, TH14, and TH21 with SW2. Besides, the group of clinically suspicious sows showed a significantly lower body weight at weaning than those in the other groups. In our study, the healthy sow group consisted of about 14% gilts, the clinically suspicious group of about 24% gilts, and the diseased group of about 18% gilts. Gourdine et al. [54] reported an average rectal temperature of 38.9 °C for gilts at farrowing and 38.7 °C for older sows. Stiehler et al. [55] reported 39.2 °C and 39.0 °C, respectively. Besides, Gourdine et al. [54] reported a difference that was more or less constant throughout lactation. Stiehler et al. [55] confirmed this trend for the first six days after birth. In conclusion, differences in RT14/TH14 and RT21/TH21 between groups can be in part explained by the difference in the proportion of gilts, which results in groups with many gilts having a higher average temperature both rectally and on the mammary surface. This could also be the reason for the lower SW1 and SW2 of the clinically suspicious group. The age of the sows could also be an influencing factor on differences between the three groups on rectal temperature and thermographic temperature.

4.3. Correlations

The relationship between the thermographic images, the rectal temperature and the other parameters shown in Table 5 and collected during this study were shown to be significant. The highest correlation coefficient was found between TH14 and TH21 with 0.75 and p < 0.0001. The correlation coefficients between RT0 and TH0 (r = 0.68; p < 0.0001) and between RT21 and TH21 (r = 0.69; p < 0.0001) showed that rectal temperature and the warmest pixel in the thermal image at parturition and at weaning were moderately correlated. Shortly after birth, Schmitt and O’Driscoll [56] found similar and higher correlation coefficients between rectal temperature and thermographic images of the back and the ear base of piglets. Between RT14 and TH14, the correlation was fair (r = 0.56; p < 0.0001). This means that the surface temperature of the mammary was more constant between 14 days after birth and at weaning than the rectal temperature so that a thermal image of the mammary of a sow 14 days after birth or at weaning seems to provide very similar information. The disadvantage of thermography is that it is less accurate than rectal temperature measurement because it has a larger standard deviation (RT: 0.5, 0.36, and 0.44 °C compared to TH: 0.64, 0.62, and 0.65 °C) than rectal temperature measurement, but it is less invasive [9]. Besides, the moderate correlation shortly after birth and at weaning provide clues about whether an animal has fever by taking a thermal image of the mammary at the appropriate time. Other studies gave such indications, too [31,32], but there is a study that has found otherwise. However, the base of the ear, the back and the anus region were investigated by infrared thermography in that study, not the mammary gland [57]. Therefore, it is reasonable to carry out research and make development efforts in the future to be able to use practical and affordable infrared cameras in mobile phones that will have better quality in the future, or maybe to be able to install automatically working thermal imaging cameras on barn ceilings.

5. Conclusions

In summary, it can be said that the use of thermography can help to find early diseased sows, whose disease has negative consequences on the daily weight gain of the piglets at least until weaning. This knowledge would allow for more targeted piglet feeding in the identified sows to minimize the disadvantages to the piglets.
This will require further research in the future so that the technology can automatically suspect disease in animals. In this way, infrared thermography of sows´ mammary gland could bring the basis for many technical improvements in the field of smart farming. In addition, it makes sense to do more research in farms with mastitis problems.

Author Contributions

Conceptualization, M.W., H.H., A.D., J.T., I.T. and C.V.; methodology, S.R., L.-S.T., M.W. and C.V.; validation, S.R., M.W. and C.V.; formal analysis, S.R., B.C. and C.V.; investigation, S.R.; data curation, S.R., H.H. and C.V.; writing—original draft preparation, S.R.; writing—review and editing, S.R., B.C., M.W. and C.V.; visualization, S.R. and D.C.S.; supervision, M.W. and C.V.; project administration, A.D.; funding acquisition, M.W., A.D., I.T., H.H., J.T. and C.V. All authors have read and agreed to the published version of the manuscript.

Funding

This research was funded by EIP-Agri (European Innovation Partnership “Agricultural Productivity and Sustainibility”), European Agricultural Fund for Rural Development. This publication was supported by Deutsche Forschungsgemeinschaft and University of Veterinary Medicine Hannover, Foundation within the funding programme Open Access Publishing.

Institutional Review Board Statement

The study was conducted according to the guidelines of the Declaration of Helsinki, and approved by the Institutional Review Board of the University of Veterinary Medicine Hannover, Foundation, Germany (protocol code TVO-2020-V-9; 4 February 2020).

Informed Consent Statement

Not applicable.

Data Availability Statement

The original contributions generated for the study are included in the article, further inquiries can be directed to the corresponding author.

Acknowledgments

We would like to thank Frances Sherwood-Brock for proofreading the manuscript to ensure correct English.

Conflicts of Interest

The authors declare no conflict of interest.

References

  1. Koketsu, Y.; Iida, R.; Piñeiro, C. A 10-year trend in piglet pre-weaning mortality in breeding herds associated with sow herd size and number of piglets born alive. Porcine Health Manag. 2021, 7, 4. [Google Scholar] [CrossRef]
  2. Rutherford, K.M.D.; Baxter, E.M.; D’Eath, R.B.; Turner, S.P.; Arnott, G.; Roehe, R.; Ask, B.; Sandøe, P.; Moustsen, V.A.; Thorup, F.; et al. The welfare implications of large litter size in the domestic pig I: Biological factors. Anim. Welf. 2013, 22, 199–218. [Google Scholar] [CrossRef]
  3. Jahresbericht 2008 der VzF GmbH. 2008, p. 9. Available online: https://www.vzf-gmbh.de/download (accessed on 26 June 2021).
  4. Jahresbericht 2020 der VzF GmbH. 2020, p. 10. Available online: https://www.vzf-gmbh.de/download (accessed on 3 July 2021).
  5. Blavi, L.; Solà-Oriol, D.; Llonch, P.; López-Vergé, S.; Martín-Orúe, S.M.; Pérez, J.F. Management and Feeding Strategies in Early Life to Increase Piglet Performance and Welfare around Weaning: A Review. Animals 2021, 11, 302. [Google Scholar] [CrossRef] [PubMed]
  6. Prunier, A.; Heinonen, M.; Quesnel, H. High physiological demands in intensively raised pigs: Impact on health and welfare. Animal 2010, 4, 886. [Google Scholar] [CrossRef] [Green Version]
  7. Theil, P.K.; Lauridsen, C.; Quesnel, H. Neonatal piglet survival: Impact of sow nutrition around parturition on fetal glycogen deposition and production and composition of colostrum and transient milk. Animal 2014, 8, 1021–1030. [Google Scholar] [CrossRef] [PubMed]
  8. Devillers, N.; Farmer, C.; Le Dividich, J.; Prunier, A. Variability of colostrum yield and colostrum intake in pigs. Animal 2007, 1, 1033–1041. [Google Scholar] [CrossRef] [Green Version]
  9. Farmer, C.; Maes, D.; Peltoniemi, O. Mammary system. In Diseases of Swine, 11th ed.; Zimmerman, J.J., Karriker, L., Ramirez, A., Schwartz, K.J., Stevenson, G.W., Zhang, J., Eds.; Wiley-Blackwell: Hoboke, NJ, USA, 2019; pp. 313–338. [Google Scholar]
  10. Hole, C.V.; Ayuso, M.; Aerts, P.; Prims, S.; Van Cruchten, S.; Van Ginneken, C. Glucose and glycogen levels in piglets that differ in birth weight and vitality. Heliyon 2019, 5, e02510. [Google Scholar] [CrossRef] [Green Version]
  11. Quesnel, H.; Brossard, L.; Valancogne, A.; Quiniou, N. Influence of some sow characteristics on within-litter variation of piglet birth weight. Animal 2008, 2, 1842–1849. [Google Scholar] [CrossRef] [PubMed] [Green Version]
  12. Quiniou, N.; Dagorn, J.; Gaudré, D. Variation of piglets’ birth weight and consequences on subsequent performance. Livest. Prod. Sci. 2002, 78, 63–70. [Google Scholar] [CrossRef]
  13. Wolf, J.; Žáková, E.; Groeneveld, E. Within-litter variation of birth weight in hyperprolific Czech Large White sows and its relation to litter size traits, stillborn piglets and losses until weaning. Livest. Sci. 2008, 115, 195–205. [Google Scholar] [CrossRef]
  14. Hojgaard, C.K.; Bruun, T.S.; Theil, P.K. Impact of milk and nutrient intake of piglets and sow milk composition on piglet growth and body composition at weaning. J. Anim. Sci. 2020, 98, skaa060. [Google Scholar] [CrossRef]
  15. Devillers, N.; Le Dividich, J.; Prunier, A. Influence of colostrum intake on piglet survival and immunity. Animal 2011, 5, 1605–1612. [Google Scholar] [CrossRef] [Green Version]
  16. Kobek-Kjeldager, C.; Moustsen, V.; Theil, P.; Pedersen, L. Effect of litter size, milk replacer and housing on production results of hyper-prolific sows. Animal 2020, 14, 824–833. [Google Scholar] [CrossRef]
  17. Moreira, L.; Menegat, M.; Barros, G.; Bernardi, M.; Wentz, I.; Bortolozzo, F. Effects of colostrum, and protein and energy supplementation on survival and performance of low-birth-weight piglets. Livest. Sci. 2017, 202, 188–193. [Google Scholar] [CrossRef]
  18. Quesnel, H.; Farmer, C.; Theil, P.K. Colostrum and milk production. In The Gestating and Lactating Sow; Farmer, C., Ed.; Wageningen Academic Publishers: Wageningen, The Netherlands, 2015; pp. 173–192. [Google Scholar]
  19. Kemper, N. Update on postpartum dysgalactia syndrome in sows. J. Anim. Sci. 2020, 98, S117–S125. [Google Scholar] [CrossRef] [PubMed]
  20. Kaiser, M.; Jacobsen, S.; Andersen, P.H.; Bækbo, P.; Cerón, J.J.; Dahl, J.; Escribano, D.; Theil, P.K.; Jacobson, M. Hormonal and metabolic indicators before and after farrowing in sows affected with postpartum dysgalactia syndrome. BMC Vet. Res. 2018, 14, 334. [Google Scholar] [CrossRef] [Green Version]
  21. Angjelovski, B.; Radeski, M.; Djadjovski, I.; Mitrov, D.; Bojkovski, J.; Adamov, N.; Dovenski, T. Prevalence and clinical signs of postpartum dysgalactia syndrome at the first day after farrowing in farmed sows in the Republic of Macedonia. Maced. Vet. Rev. 2019, 42, 79–86. [Google Scholar] [CrossRef] [Green Version]
  22. Papadopoulos, G.A.; Vanderhaeghe, C.; Janssens, G.P.; Dewulf, J.; Maes, D.G. Risk factors associated with postpartum dysgalactia syndrome in sows. Vet. J. 2010, 184, 167–171. [Google Scholar] [CrossRef]
  23. Mirko, C.; Bilkei, G. Acute phase proteins, serum cortisol and preweaning litter performance in sows suffering from periparturient disease. Acta Vet. Scand. 2004, 54, 153–161. [Google Scholar]
  24. Sărăndan, H.; Sărăndan, R.; Petroman, I.; Rada, O.; Balint, A.; Faur, B. Growth rate and mortality in suckling piglets and their correlation to the sows’milk yield. Sci. Pap. Anim. Sci. Biotechnol. 2009, 42, 277–282. [Google Scholar]
  25. Kaiser, M.; Jacobson, M.; Andersen, P.H.; Bækbo, P.; Cerón, J.J.; Dahl, J.; Escribano, D.; Jacobsen, S. Inflammatory markers before and after farrowing in healthy sows and in sows affected with postpartum dysgalactia syndrome. BMC Vet. Res. 2018, 14, 83. [Google Scholar]
  26. Schmidt, M.; Hoffmann, G.; Ammon, C.; Schön, P.; Manteuffel, C.; Amon, T. Anwendung der Infrarotthermografie bei ferkelführenden Sauen. Landtechnik 2013, 68, 228–231. [Google Scholar]
  27. Martineau, G.-P.; Farmer, C.; Peltoniemi, O.; Ramirez, A.; Schwartz, K.; Stevenson, G. Mammary system. In Diseases of Swine, 10th ed.; Zimmerman, J.J., Karriker, L.A., Ramirez, A., Schwartz, K.J., Stevenson, G.W., Eds.; Wiley Blackwell: Chichester, UK, 2012; Volume 10, pp. 270–293. [Google Scholar]
  28. Gerjets, I.; Kemper, N. Coliform mastitis in sows: A review. J. Swine Health Prod. 2009, 17, 97–105. [Google Scholar]
  29. Hirsch, A.; Philipp, H.; Kleemann, R. Investigation on the efficacy of meloxicam in sows with mastitis–metritis–agalactia syndrome. J. Vet. Pharmacol. Ther. 2003, 26, 355–360. [Google Scholar] [CrossRef] [PubMed]
  30. Gerjets, I.; Traulsen, I.; Reiners, K.; Kemper, N. Assessing individual sow risk factors for coliform mastitis: A case–control study. Prev. Vet. Med. 2011, 100, 248–251. [Google Scholar] [CrossRef] [PubMed]
  31. Spiegel, F. Vergleichende infrarotthermographische und bakteriologische Untersuchungen am gesunden sowie durch Mastitis veränderten Gesäuge beim Schwein. Ph.D. Thesis, Tierärztliche Hochschule Hannover, Hannover, Germany, 2016. [Google Scholar]
  32. Traulsen, I.; Naunin, K.; Muller, K.; Krieter, J. Untersuchungen zum Einsatz der Infrarotthermographie zur Messung der Körpertemperatur bei Sauen. Zuchtungskunde 2010, 82, 437–446. [Google Scholar]
  33. Vicente-Perez, R.; Avendano-Reyes, L.; Mejia-Vazquez, A.; Álvarez-Valenzuela, F.D.; Correa-Calderon, A.; Mellado, M.; Meza-Herrera, C.A.; Guerra-Liera, J.E.; Robinson, P.; Macias-Cruz, U. Prediction of rectal temperature using non-invasive physiologic variable measurements in hair pregnant ewes subjected to natural conditions of heat stress. J. Therm. Biol. 2016, 55, 1–6. [Google Scholar] [CrossRef]
  34. Knížková, I.; Kunc, P.; Gürdil, G.A.K.; Pinar, Y.; Selvi, K. Applications of infrared thermography in animal production. J. Fac. Agric. 2007, 22, 329–336. [Google Scholar]
  35. Soerensen, D.D.; Pedersen, L.J. Infrared skin temperature measurements for monitoring health in pigs: A review. Acta Vet. Scand. 2015, 57, 5. [Google Scholar] [CrossRef] [Green Version]
  36. Roberto, J.V.B.; De Souza, B.B. Use of infrared thermography in veterinary medicine and animal production. J. Anim. Behav. Biometeorol. 2020, 2, 73–84. [Google Scholar] [CrossRef]
  37. Hemsworth, P.; Mellor, D.J.; Cronin, G.M.; Tilbrook, A.J. Scientific assessment of animal welfare. N. Z. Vet. J. 2015, 63, 24–30. [Google Scholar] [CrossRef]
  38. Sathiyabarathi, M.; Jeyakumar, S.; Manimaran, A.; Jayaprakash, G.; Pushpadass, H.A.; Sivaram, M.; Ramesha, K.; Das, D.; Kataktalware, M.A.; Prakash, M.A. Infrared thermography: A potential noninvasive tool to monitor udder health status in dairy cows. Vet. World 2016, 9, 1075. [Google Scholar] [CrossRef] [Green Version]
  39. Sathiyabarathi, M.; Jeyakumar, S.; Manimaran, A.; Pushpadass, H.A.; Sivaram, M.; Ramesha, K.; Das, D.; Kataktalware, M.A.; Jayaprakash, G.; Patbandha, T.K. Investigation of body and udder skin surface temperature differentials as an early indicator of mastitis in Holstein Friesian crossbred cows using digital infrared thermography technique. Vet. World 2016, 9, 1386. [Google Scholar] [CrossRef] [Green Version]
  40. Sathiyabarathi, M.; Jeyakumar, S.; Manimaran, A.; Pushpadass, H.A.; Kumaresan, A.; Lathwal, S.; Sivaram, M.; Das, D.; Ramesha, K.; Jayaprakash, G. Infrared thermography to monitor body and udder skin surface temperature differences in relation to subclinical and clinical mastitis condition in Karan Fries (Bos taurus × Bos indicus) crossbred cows. Indian J. Anim. Sci. 2018, 88, 694–699. [Google Scholar]
  41. Brown-Brandl, T.M.; Eigenberg, R.A.; Purswell, J.L. Using thermal imaging as a method of investigating thermal thresholds in finishing pigs. Biosyst. Eng. 2013, 114, 327–333. [Google Scholar] [CrossRef]
  42. de Diego, A.C.P.; Sánchez-Cordón, P.J.; Pedrera, M.; Martínez-López, B.; Gómez-Villamandos, J.C.; Sánchez-Vizcaíno, J.M. The use of infrared thermography as a non-invasive method for fever detection in sheep infected with bluetongue virus. Vet. J. 2013, 198, 182–186. [Google Scholar] [CrossRef]
  43. George, W.; Godfrey, R.; Ketring, R.; Vinson, M.; Willard, S. Relationship among eye and muzzle temperatures measured using digital infrared thermal imaging and vaginal and rectal temperatures in hair sheep and cattle. J. Anim. Sci. 2014, 92, 4949–4955. [Google Scholar] [CrossRef] [Green Version]
  44. Kuratorium für Technik und Bauwesen in der Landwirtschaft e.V. (KTBL). In Tierschutzindikatoren: Leitfaden für die Praxis-Schwein; KTBL: Darmstadt, Germany, 2016.
  45. Caldara, F.R.; dos Santos, L.S.; Machado, S.T.; Moi, M.; de Alencar Nääs, I.; Foppa, L.; Garcia, R.G.; dos Santos, R.d.K.S. Piglets’ surface temperature change at different weights at birth. Asian Australas. J. Anim. Sci. 2014, 27, 431. [Google Scholar] [CrossRef] [Green Version]
  46. Hesse, A.; Hesse, D. Sauen automatisch auf Kondition füttern. Bauförderung Landwirtsch. Fachinf. BFL Online. 2006, pp. 1–5. Available online: http://www.bfl-online.de/media/agrifair-kondi-he.pdf (accessed on 7 May 2021).
  47. Hesse, A. Entwicklung einer automatisierten Konditionsfütterung für Sauen unter besonderer Berücksichtigung der Tierleistung; Bundesforschungsanstalt für Landwirtschaft (FAL): Braunschweig, Germany, 2003. [Google Scholar]
  48. Akoglu, H. User’s guide to correlation coefficients. Turk. J. Emerg. Med. 2018, 18, 91–93. [Google Scholar] [CrossRef]
  49. Zaninelli, M.; Redaelli, V.; Luzi, F.; Bronzo, V.; Mitchell, M.; Dell’Orto, V.; Bontempo, V.; Cattaneo, D.; Savoini, G. First evaluation of infrared thermography as a tool for the monitoring of udder health status in farms of dairy cows. Sensors 2018, 18, 862. [Google Scholar] [CrossRef] [PubMed] [Green Version]
  50. Zhang, C.; Xiao, D.; Yang, Q.; Wen, Z.; Lv, L. Application of Infrared Thermography in Livestock Monitoring. Trans. ASABE 2020, 63, 389–399. [Google Scholar] [CrossRef]
  51. Feng, Y.-Z.; Zhao, H.-T.; Jia, G.-F.; Ojukwu, C.; Tan, H.-Q. Establishment of validated models for non-invasive prediction of rectal temperature of sows using infrared thermography and chemometrics. Int. J. Biometeorol. 2019, 63, 1405–1415. [Google Scholar] [CrossRef] [PubMed]
  52. Patra, M.; De, U.; Kent, Y.; Rungsung, S.; Krishnaswamy, N.; Deka, B. Influence of seasonal variation on post-farrowing dysgalactia syndrome (PFDS) and serum biochemistry profiles in the periparturient sow. Trop. Anim. Health Prod. 2021, 53, 1–12. [Google Scholar] [CrossRef] [PubMed]
  53. Yu, Y.-H.; Hsu, T.-Y.; Chen, W.-J.; Horng, Y.-B.; Cheng, Y.-H. The Effect of Bacillus licheniformis-Fermented Products and Postpartum Dysgalactia Syndrome on Litter Performance Traits, Milk Composition, and Fecal Microbiota in Sows. Animals 2020, 10, 2044. [Google Scholar] [CrossRef] [PubMed]
  54. Gourdine, J.-L.; Bidanel, J.P.; Noblet, J.; Renaudeau, D. Rectal temperature of lactating sows in a tropical humid climate according to breed, parity and season. Asian Australas. J. Anim. Sci. 2007, 20, 832–841. [Google Scholar] [CrossRef]
  55. Stiehler, T.; Heuwieser, W.; Pfuetzner, A.; Burfeind, O. The course of rectal and vaginal temperature in early postpartum sows. J. Swine Health Prod. 2015, 23, 72–83. [Google Scholar]
  56. Schmitt, O.; O’Driscoll, K. Use of infrared thermography to noninvasively assess neonatal piglet temperature. Transl. Anim. Sci. 2021, 5, txaa208. [Google Scholar] [CrossRef]
  57. Wendt, M.; Eickhoff, K.; Koch, R. Die Messung der Hauttemperatur als Methode zur Erkennung fieberhaft erkrankter Schweine. Deut Tierarztl Woch 1997, 104, 29–33. [Google Scholar]
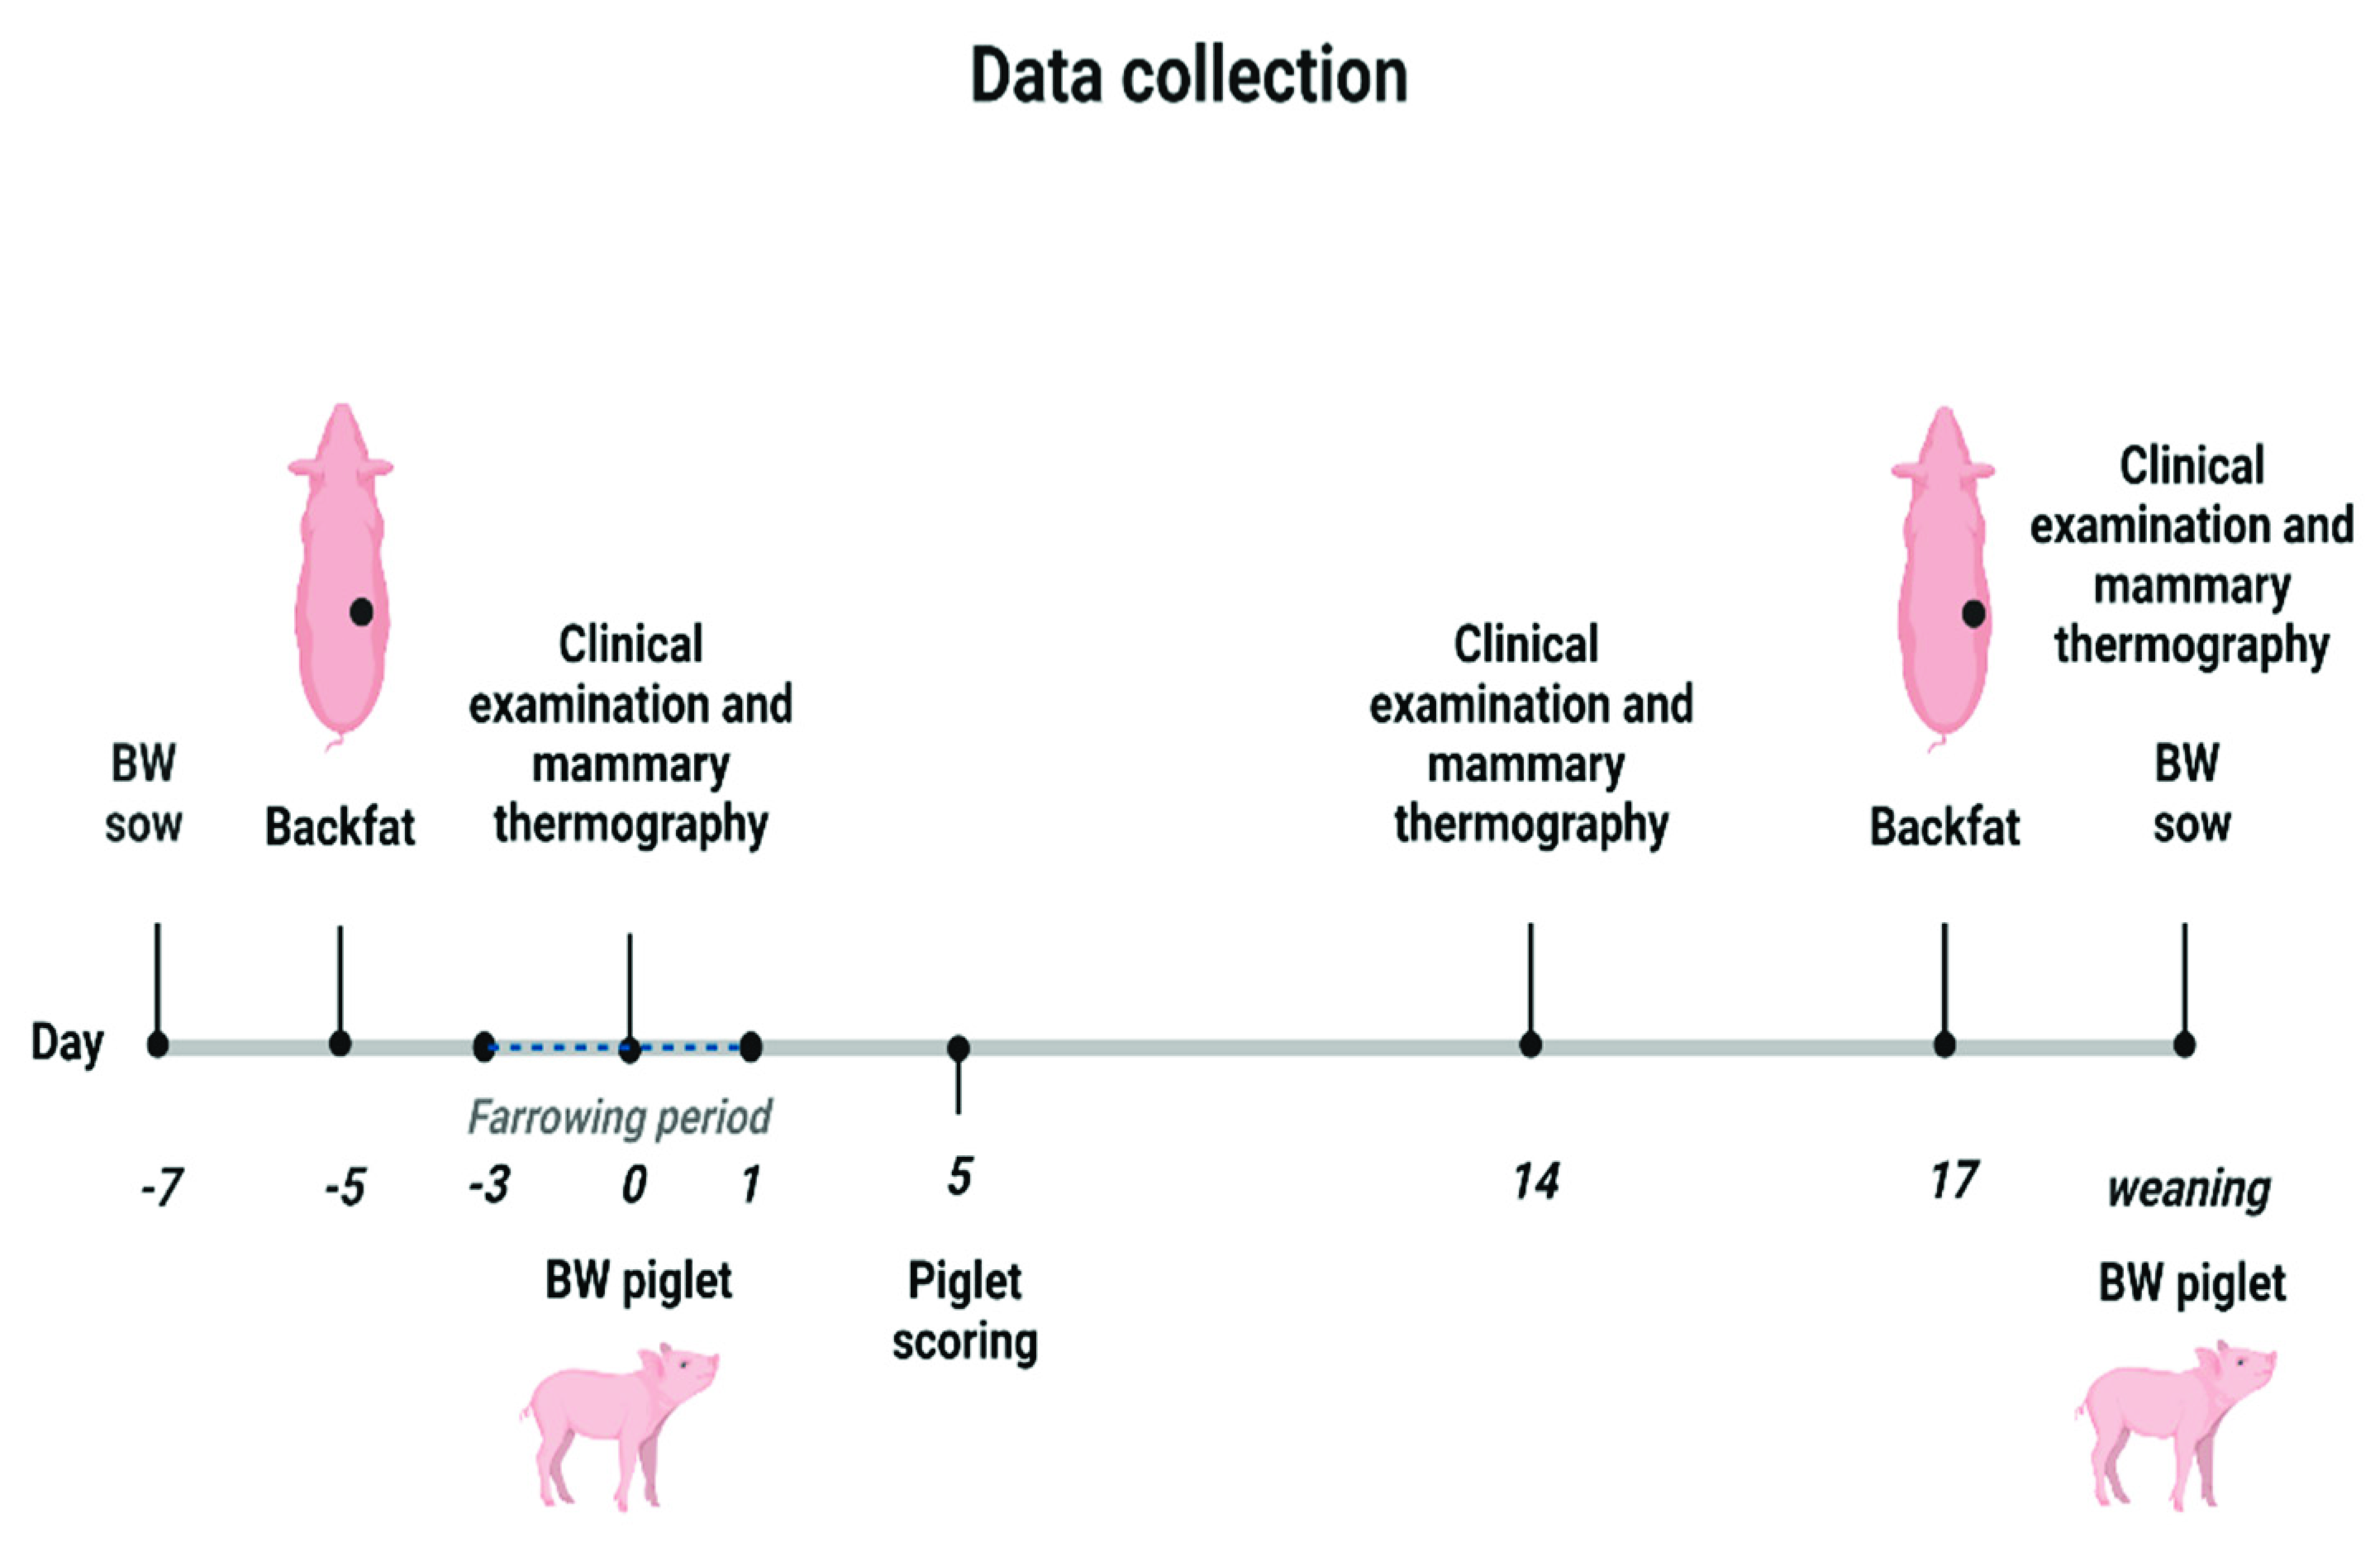
Figure 1. Overview concerning the time and data collection plan. BW; bodyweight (Figure was created with BioRender.com).
Agriculture 11 01013 g001
Figure 2. Thermographic images from the right mammary gland of a sow for categories (a) healthy; (b) clinically suspicious; (c) diseased and an image from 2 days before farrowing (d). The red triangle within the rectangle in the picture shows the location of the pixel with the highest temperature (see Max temperature top left in the picture).
Agriculture 11 01013 g002
Figure 3. The way to bundle the clinical parameter (Figure was created with BioRender.com). Assessment: 1 point for not eating, reluctant to stand up, purulent discharge, piglet score 1, for any complex with consistency 2 or more than 2 complexes with consistency 1; 2 Points for piglet score 2 or rectal temperature 39 °C–39.4 °C; 4 points for rectal temperature 39.5 °C–39.8 °C; 5 points for rectal temperature more than 39.8 °C; Highscore were 11.
Agriculture 11 01013 g003
Figure 4. Measuring location for backfat measurement with Lean-meater® (series 12, Renco Corp., Golden Valley, MN, USA) in accordance with the modified P2 method. (Figure was created with BioRender.com).
Agriculture 11 01013 g004
Table 1. Nutrient contents in the gestation and lactation diet in accordance with the declaration (g/kg as fed).
ItemGestation DietLactation Diet
Crude protein140165
Crude fat3337
Crude fiber7550
Crude ash5455
Calcium7.29
Phosphorus5.26.5
Natrium2.52.5
Energy (MJ ME/kg)11.413
Lysine7.010
Methionine2.43.0
Table 2. Score sheet of the clinical examination of the udder.
ItemScoreMeaning
Formation/Regression0in lactation
1poorly formed/in regression
2not formed/without milk production
Redness0physiological skin color
1moderate redness
2strong redness
Consistency0loose
1elastic
2solid
Nodes0not available
1Nodes present in skin/subcutis
2Nodes present in mammary parenchyma
Painfulness0not painful
1low grade painful
2high grade painful
Table 3. Comparison of performance parameters between healthy, clinically suspicious and diseased sows.
ItemnHealthynClinically SuspiciousnDiseased
TBP28917.3 a ± 3.3028817.5 a ± 3.2912116.4 b ± 3.71
NS2891.06 ± 1.592880.8 ± 1.641211.11 ± 2.44
NBA28916.3 a ± 3.4328816.7 a ± 3.3012115.3 b ± 3.97
PWM2892.09 ± 2.252882.41 ± 2.21211.98 ± 2.13
NWP28912.1 ± 1.9228812.1 ± 2.1012112.4 ± 2.29
BFT128916.7 ± 2.6030116.5 ± 2.3012216.4 ± 2.20
BFT228814.5 ± 2.1730114.1 ± 2.3912214.0 ± 2.23
BFTD2882.22 ± 1.613012.33 ± 1.661222.40 ± 1.73
SW1289267 ± 31.6301262 ± 34.9122265 ± 29.8
SW2287222 a ± 32.7300215 b ± 35.0121221 a ± 32.2
SWD28745.0 ± 16.930046.6 ± 16.812144.7 ± 15.8
DWG226194 a ± 32.1235191 a ± 33.197183 b ± 38.2
TBP (n); total number of born piglets, NS (n); stillborn piglet, NBA (n); piglets born alive, PWM (n); pre-weaning mortality, NWP (n); weaned piglets, BFT1 in mm; backfat thickness 2 d after entering the farrowing house, BFT2 in mm; backfat thickness at the end of the suckling period, BFTD in mm; difference between BFT1 and BFT2, SW1 in kg; sow weight when entering the farrowing house, SW2 in kg; sow weight at weaning, SWD in kg; difference between SW1 and SW2, DWG in g, daily weight gain of the piglets from birth to the 2nd weighing. a, b Different subscripts within a row mark significant difference (p < 0.05).
Table 4. Rectal temperature and thermographic data compared between healthy, clinically suspicious and diseased sows.
ItemnHealthynClinically SuspiciousnDiseased
RT031438.8 a ± 0.2931339.2 b ± 0.2412739.9 c ± 0.43
RT1428138.9 a ± 0.3529139.0 b ± 0.3711939.0 b ± 0.35
RT2127338.5 a ± 0.4128738.7 b ± 0.4311538.7 b ± 0.48
TH031437.2 a ± 0.5431337.6 b ± 0.5412738.3 c ± 0.57
TH1427937.6 a ± 0.6029137.7 b ± 0.6011837.8 b ± 0.69
TH2127337.2 a ± 0.6428737.4 b ± 0.6311537.5 b ± 0.68
RT0; rectal temperature shortly after birth, RT14; rectal temperature around 14 days after birth, RT21; rectal temperature at weaning, TH0; mean value of the highest temperature from the right and left thermal image of the breast shortly after birth, TH14; mean value of the highest temperature from the right and left thermal image of the breast around 14 days after birth, TH21; mean value of the highest temperature from the right and left thermal image of the udder at weaning. a, b, c Values within a row with different superscripts differ significantly at p < 0.05.
Table 5. Pearson correlation coefficient between rectal temperature, thermographic temperature of the mammary glands and performance parameters while different time points.
p-Value (n)Pearson Correlation Coefficient
NBANWPBFTDSW2SWDRT0RT14RT21TH0TH14TH21
NBA 0.190.04−0.250.140.000.120.090.020.120.14
NWP<0.0001 (698) 0.01−0.130.070.030.130.150.060.130.13
BFTD0.3345 (682)0.7152 (682) 0.000.000.070.070.040.040.060.06
SW2<0.0001 (680)0.0004 (680)0.9089 (708) 0.31−0.1−0.38−0.38−0.05−0.31−0.36
SWD0.0004 (680)0.087 (680)0.8637 (711)<0.0001 (708) −0.05−0.02−0.020.18−0.07−0.09
RT00.9473 (697)0.4308 (697)0.0487 (710)0.0061 (707)0.1929 (707) 0.150.210.680.160.19
RT140.0022 (656)0.0006 (656)0.0847 (672)<0.0001 (672)0.6628 (672)<0.0001 (690) 0.570.130.560.48
RT210.0263 (643)<0.0001 (643)0.3491 (664)<0.0001 (662)0.6722 (662)<0.0001 (674)<0.0001 (667) 0.20.440.69
TH00.6400 (698)0.1000 (698)0.2500 (711)0.1200 (708)0.1800 (708)<0.0001 (754)0.0007 (691)<0.0001 (675) 0.390.34
TH140.0022 (656)0.0006 (656)0.0847 (672)<0.0001 (670)0.0774 (670)<0.0001 (688)<0.0001 (688)<0.0001 (665)<0.0001 (688) 0.75
TH210.0003 (643)0.0006 (643)0.12 (664)<0.0001 (662)0.03 (662)<0.0001 (674)<0.0001 (667)<0.0001 (675)<0.0001 (675)<0.0001 (665)
Correlations: 0.00–0.29 poor, 0.3–0.59 fair correlation, 0.6–0.79 moderate, 0.8–0.99 very strong, 1 perfect. NBA; number of piglets born alive [n], NWP; number of weaned piglets [n], BFTD; difference between BFT1 and BFT2 [mm], SW2; sow weight when moving out of the farrowing house [kg], SWD; difference between SW1 and SW2 [kg], RT0; rectal temperature near birth, RT14; rectal temperature around 14 days after birth, RT21; rectal temperature at weaning, TH0; mean value of the highest temperature from the right and left thermal image of the breast shortly after birth, TH14; mean value of the highest temperature from the right and left thermal image of the breast around 14 days after birth, TH21; mean value of the highest temperature from the right and left thermal image of the udder at weaning. Bold indicates significant values with p < 0.05.
Publisher’s Note: MDPI stays neutral with regard to jurisdictional claims in published maps and institutional affiliations.