Article

Life Cycle Assessment of Sustainable Broiler Production Systems: Effects of Low-Protein Diet and Litter Incineration

1
Institute of Livestock and Grassland Science, National Agriculture and Food Research Organization (NARO), Tsukuba 305-0901, Japan
2
Laboratory of Animal Husbandry Resources, Division of Applied Bioscience, Graduate School of Agriculture, Kyoto University, Kyoto 606-8502, Japan
*
Author to whom correspondence should be addressed.
Agriculture 2021, 11(10), 921; https://doi.org/10.3390/agriculture11100921
Submission received: 2 September 2021 / Revised: 22 September 2021 / Accepted: 22 September 2021 / Published: 25 September 2021

Abstract

:
We conducted a life cycle assessment (LCA) to compare environmental impacts of conventional (CNV) broiler chicken production in Japan with those of three mitigation options: a low-protein diet supplemented with more crystalline amino acids (LP), incineration of broiler litter (IC), and their combination (LP + IC). Feed production, feed transport, broiler housing, and manure management were included in the LCA, with 1 kg of liveweight of broiler chicken as the functional unit. The CNV environmental impacts were: climate change, 1.86 kg CO2e; acidification, 52.6 g SO2e; eutrophication, 18.3 g PO4e; energy consumption, 18.8 MJ. Since broiler manure management has a lower N2O emission factor, the LP diet’s effects on greenhouse gas (GHG) emissions were limited. Because a large amount of ammonia is emitted from broiler-litter composting and the LP diet reduced nitrogen excretion and consequent NH3 emission, the LP showed lower acidification and eutrophication potentials than CNV. The IC system reduced fuel consumption by utilizing the generated heat for broiler-house heating and thus had lower GHG emissions and energy consumption; it reduced ammonia emission from the manure-management process by incineration and thus had lower acidification and eutrophication potentials even when including NOX generation by litter incineration. The LP + IC system had lower environmental impacts than CNV: for climate change (by 16%), acidification (48%), eutrophication (24%), and energy consumption (15%). Mitigation opportunities for broiler chickens remain, and broiler production systems with mitigation options help produce chickens more sustainably.

Graphical Abstract

1. Introduction

The global production of chicken meat in 2019 was 118 million tonnes (Mt) (accounting for ~35% of the global meat production), and it has increased by about tenfold in the last five decades, while the production of cattle meat and that of pig meat has increased by 1.8 and 3.2 times in the same period, respectively [1]. By 2029, chicken meat production is predicted to increase by approx. 20 Mt from the 2017–2019 average, accounting for about half of the increase in global meat production during that period [2]. Chicken meat also has several advantages in human nutrition, as it is relatively inexpensive, involves no major religious taboos, and has high nutritional value with high protein content and relatively less fat content [3]. Compared to livestock meat production, the production of chicken meat has relatively low environmental impacts [4,5]. However, the environmental impacts of broiler chicken production are still higher than those of plant protein sources such as soybean, and these impacts need to be reduced. In addition to greenhouse gas (GHG) emissions, poultry production has a particularly high ammonia (NH3) emission factor among livestock species [6,7], and the NH3 emission contributes to acidification.
One possible measure to mitigate the environmental impacts of broiler production is reducing the excretion of nitrogen, which is a source of nitrous oxide (N2O) and NH3 emissions from chicken manure management. Reducing the excretion of nitrogen from broiler production by lowering the crude protein (CP) contents in chicken feed has been studied for several decades [8], and it has been reported that productivity can be maintained by compensating for the insufficient amounts of amino acids by adding crystalline amino acids (CAAs) [9]. Another measure to mitigate the environmental impacts of broiler production is energy utilization by incinerating the broiler litter (which is a mixture of excreta and bedding material such as sawdust) removed from the barn after the broilers are shipped. Broiler litter can be incinerated without supplemental fuel [10], and the combustion heat can be used as an energy source for purposes such as heating a broiler house [11,12].
However, the use of a low-protein diet with CAAs involves additional environmental emissions derived from the manufacturing of CAAs, and this affects the emissions from feed production and those from manure management because of changes in the diet and manure compositions. The introduction of litter incineration also affects the emissions from manure management due to the changes in the emission factors of environmental pollutants. The effects of a low-protein diet with CAAs and litter incineration on the life cycle environmental impacts of broiler production have not yet been investigated.
The life-cycle assessment (LCA) method is suitable for environmental evaluation [13] and has been applied to evaluate environmental impacts of broiler production [14,15,16,17] in addition to other livestock production systems such as dairy farming [18,19], beef production [20,21], pig production [22,23], and crop-livestock integrated systems [24,25].
The objectives of the present study are to evaluate the environmental impacts of conventional broiler chicken production in Japan using the LCA method and to compare these impacts with those of broiler production with three mitigation options: a low-protein diet supplemented with CAAs, the incineration of broiler litter, and their combination.

2. Materials and Methods

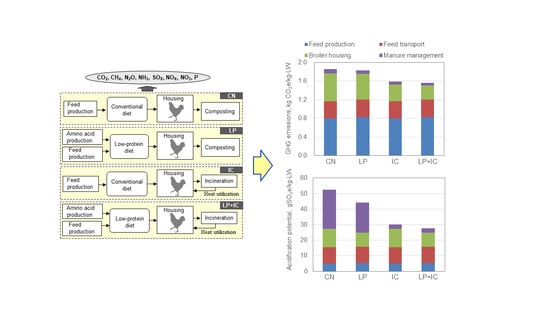
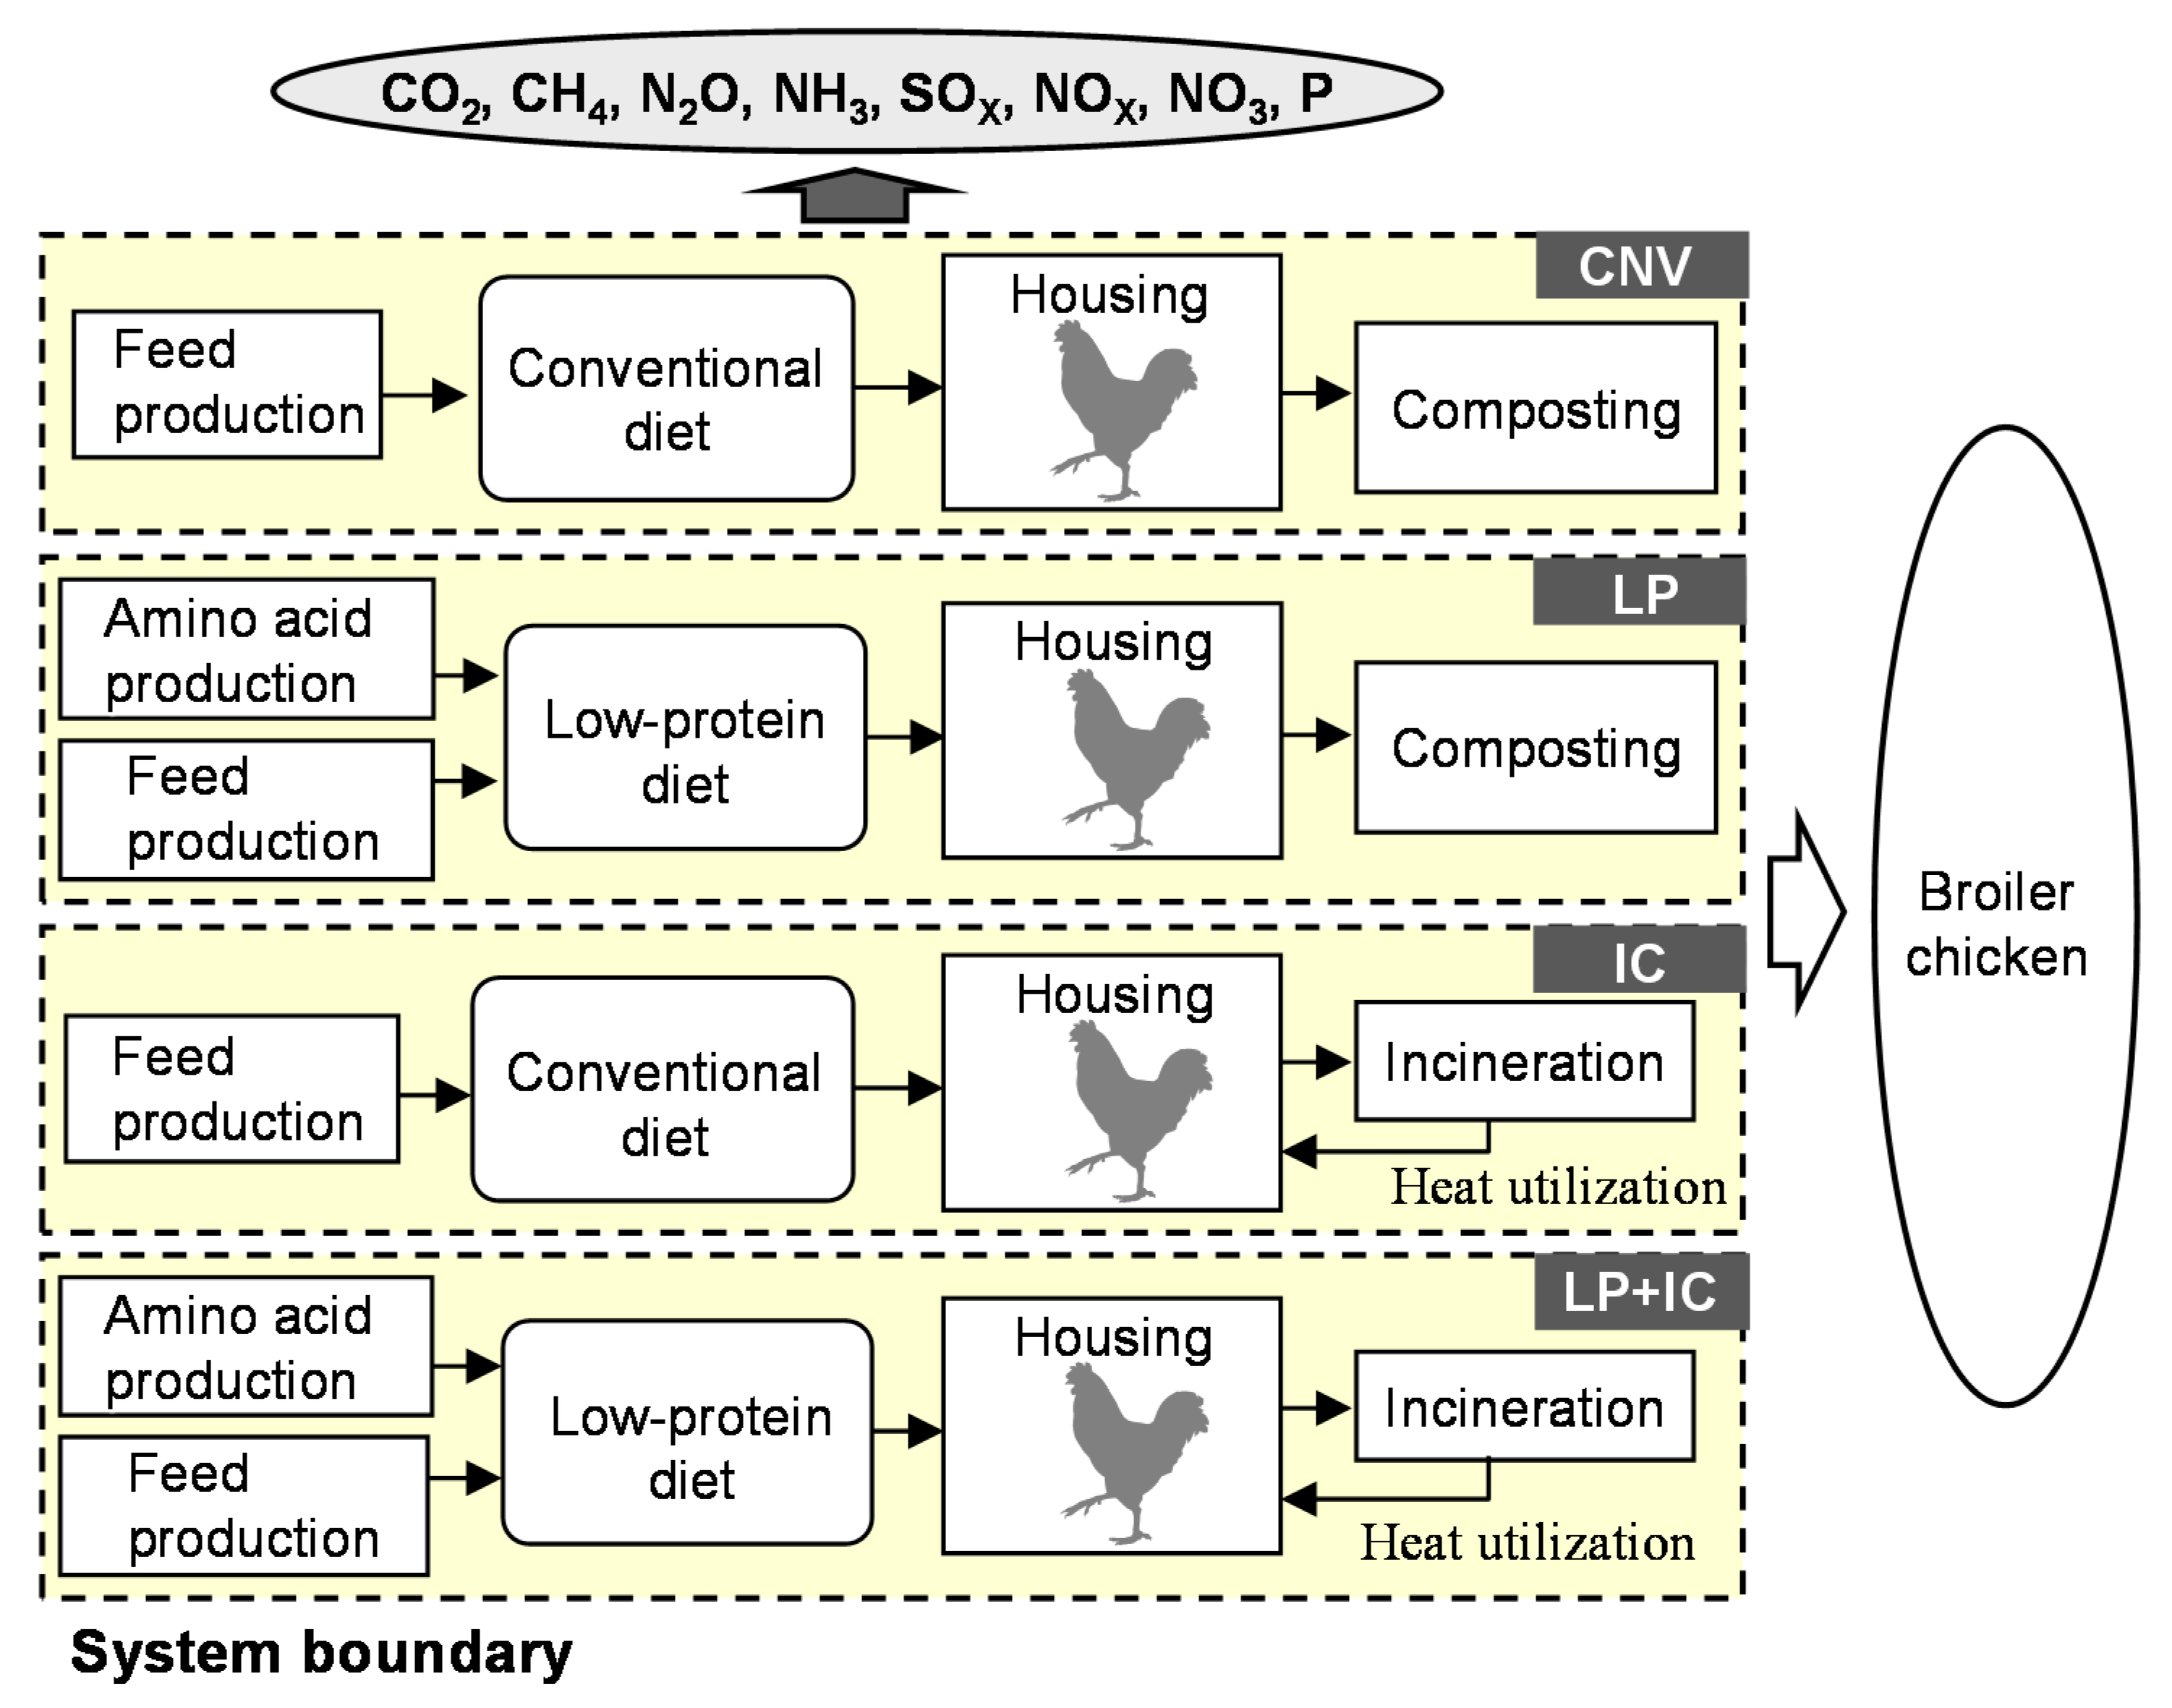
2.1. System Description

The goal of the present analysis was to evaluate the environmental impacts of four types of broiler chicken production systems in Japan: (1) a conventional system (CNV), (2) a system that uses low-protein diet supplemented with more CAAs (LP), (3) a system that includes the incineration of broiler litter (IC), and (4) a system that combines LP and IC (LP + IC). An outline of the systems analyzed in this study is presented in Figure 1. The evaluated systems included the processes of feed production, feed transport, animal housing, and manure management. The feed production process included CAA manufacturing for LP and LP + IC. The broiler chickens were assessed to be marketed at 3.06 kg of liveweight at 52 days of age with a 1.98 feed conversion ratio (FCR) based on Ogino et al. [26], which determined the average slaughter age and weight of broiler chickens in Japan according to several reports.
Regarding the diets, the crude protein (CP) contents of the conventional diets used in the CNV and IC systems for the first stage (~3 weeks of age) and the second stage (>3 weeks of age) of broiler chicken production were 21.7% and 19.5%, respectively, based on the nutrient contents of the commercial feeds used [26]. The conventional diets were formulated to have the above-mentioned values for CP contents supplemented with a certain amount of CAAs and to provide 5% more than the amino acid requirements described in the broiler production manual [27]. The low-protein diets for the LP and LP + IC systems were formulated by lowering the CP content and supplementing with more CAAs to provide 5% more than the amino acid requirements described in the broiler production manual. The compositions of the diets are presented in Table 1.
Newborn broiler chicks were introduced at 1 day of age, and newborn chick production was excluded from the analysis. Broiler chickens were reared on a sawdust litter floor, and the litter was removed from the barn after the broilers were shipped in all four of the systems investigated in this study.
Regarding manure management for the CNV and LP systems, we assumed that the broiler litter was treated by composting without forced aeration, which is the typical treatment for broiler manure in Japan. For the IC and LP + IC systems, it was assumed that the broiler litter was incinerated and that the heat from this incineration was used for heating the broiler house.
The functional was defined as 1 kg liveweight (LW) of a broiler chicken. The environmental loads associated with the production of capital goods such as broiler houses and composting facilities were not considered.

2.2. Life Cycle Inventory

Table 2 shows the emission factors associated with broiler production used in the present analysis. To calculate the environmental loads from the consumption of electricity, the production and combustion of fossil fuels, the production of materials, and transport, we used the database of the LCA software program MiLCA [28], and when data for materials were lacking in the database, we used an input−output-based database [29].
Regarding feed production, since most of the feed ingredients for Japanese broiler production are imported mainly from the U.S., we used the data on feed production in the U.S. The data on soybean production in Brazil were also used herein for the soymeal, because some amounts of soymeal in the diets were also derived from soybeans produced in Brazil. To evaluate the pollutant emissions from the commercial feed production in the U.S., we used data on the amounts of agricultural materials for each crop [39] and the fuels and electricity [40] consumed in production. We also used the data provided by Wang [40] for the unit emissions for each agricultural material. We assessed the pollutant emissions from the soybean production in Brazil based on findings reported by Mosnier et al. [41].
Regarding N2O emissions from the fields of feed production, we used 1.325% of the nitrogen amount in the organic and chemical fertilizers applied to the fields and 1.225% of the nitrogen amount in the crop residues left on the fields as being emitted as N2O directly and indirectly [42]. Concerning the emission of NH3 from the feed production fields, 6.8% of the nitrogen amount in organic and chemical fertilizers applied to the fields was considered to be emitted [43]. Regarding the CAAs used to supplement the low-protein diet in the present study, L-lysine HCl and L-threonine are produced by fermentation, and DL-methionine is produced by chemical synthesis. The data concerning environmental emissions from the CAAs production for Japanese broiler producers were collected from the CAAs’ manufacturers. The GHG emissions from and the energy consumption of the production of the CAAs were 5.20 kg CO2e/kg and 83.1 MJ/kg, respectively, as weighted averages.
With regard to the environmental loads from the transport of the commercial feeds to Japan, we obtained the shares of the major feed-exporting countries to Japan, of which the sum of shares is >90% of the total, from published trade statistics [44] and divided each share by the sum of the major countries’ shares so that the sum of the calculated major countries’ shares became 100%. The calculated shares of the exporting countries for each main feed crop were as follows: for corn, 86.2% was from the U.S. and 13.8% was from Brazil; for soybeans, 54.5% was from the U.S., 26.9% from Brazil, 8.4% from Argentina, 5.3% from Canada, and 4.8% from India.
Not only soymeal but also soy oil is produced from soybeans, and thus the environmental loads of soybean cultivation and its processing were allocated between the two products economically [45]. The unit emissions and energy consumption for land, marine, rail, and barge transport were based on the database of the LCA software program MiLCA [28].
Lighting, heating, ventilation, and washing of the broiler house, feed preparation, and the removal of manure from the broiler house were considered to be work associated with broiler housing, and we calculated the environmental loads based on the quantities of fuel and electricity consumed in the work [46].
The environmental loads for manure management were calculated based on the quantities of fuel, electricity, and materials consumed during composting or incineration [47]. The heat generated from litter incineration is used for heating the broiler house, especially during the chick stage, and the reduction rate of fuel consumption for heating was calculated herein as 80% (12.1 MJ/head for the CNV and LP systems and 2.4 MJ/head for the IC and LP + IC systems) [47]. We determined the environmental gas emissions in association with the degradation of manure using the emission factors shown in Table 2.
We adjusted the growth curve of broiler chickens in the Japanese feeding standard for poultry [48] using the body weight and slaughter age of the chickens used in this study (3.06 kg and 52 d), and we calculated the feed intakes at each week of age by using the body weight gains and the FCR (i.e., 1.98). The organic matter content in excreted manure was calculated from the composition and the digestibility of each nutrient in the diets, using the standard tables of feed composition in Japan [49]. The nitrogen (N) content in excreted manure for one broiler (expressed in g/day) was calculated as follows:
Excreted N = (CP − RP) / 6.25
where CP is the crude protein intake (g/day) and RP is the retained protein (g/day) calculated using the CP content of 19.2% of a broiler body [26]. The calculated nitrogen flow per head from feed to manure for a broiler fed the CNV and LP diets was as follows, respectively: 190.3 and 167.7 gN from feed intake, 92.8 and 92.8 gN used for weight gain, and 97.5 and 74.9 gN excreted into manure. The amounts and compositions of the diets were set to meet the nutrient requirements of broilers in response to the growth stages.
We calculated the amount of manure from the diets and the environmental loads related to manure by multiplying the nitrogen or organic matter in the manure by the emission factors. The production and environmental loads were therefore related to each other. Regarding the indirect N2O emissions from the broiler housing and manure management processes, we used 1% of the nitrogen amount in the NH3 emissions from those processes as being emitted as N2O indirectly [31]. The emission of enteric methane (CH4) from a broiler was negligible and not taken into account.
The emission of CO2 from broiler respiration and the degradation of broiler manure were offset by carbon fixation from the atmosphere into forage crops through photosynthesis. The GHG emissions from land use and land use change (LULUC) were not taken into account in this study; however, we examined the effects of the inclusion of LULUC-related emissions on the LCA results as a sensitivity analysis as described below.

2.3. Impact Assessment

We examined the contributions of the four broiler production systems in relation to the four environmental impact categories of climate change, acidification, eutrophication, and primary energy consumption. We first interpreted the data of the life cycle inventory in terms of their environmental impact. The environmental loads were sorted and assigned to specific environmental impact categories and then multiplied by equivalency factors for each specific load and impact category. Thereafter, all of the weighted environmental loads included in the impact category were added, and the environmental impact was obtained.
We computed the global warming potential (GWP), an index for estimating the climate change contribution due to the atmospheric emission of GHGs, according to the CO2-equivalent (CO2e) factors defined by the Intergovernmental Panel on Climate Change (IPCC) [50]: CO2, 1; CH4, 25; and N2O, 298. These factors were set based on a time horizon of 100 years. To calculate the acidification potential (AP) of the different trace gases, we used the SO2-equivalent (SO2e) factors for SO2 and SOX = 1, NO2 and NOX = 0.7, and NH3 = 1.88 derived from Heijungs et al. [51]. To calculate the eutrophication potential (EP) of the different pollutants, we used the PO4-equivalent (PO4e) factors for NO2 and NOX = 0.13, NH3 = 0.33, NO3 = 0.1, and P = 3.06 derived from Heijungs et al. [51].

2.4. Sensitivity Analysis
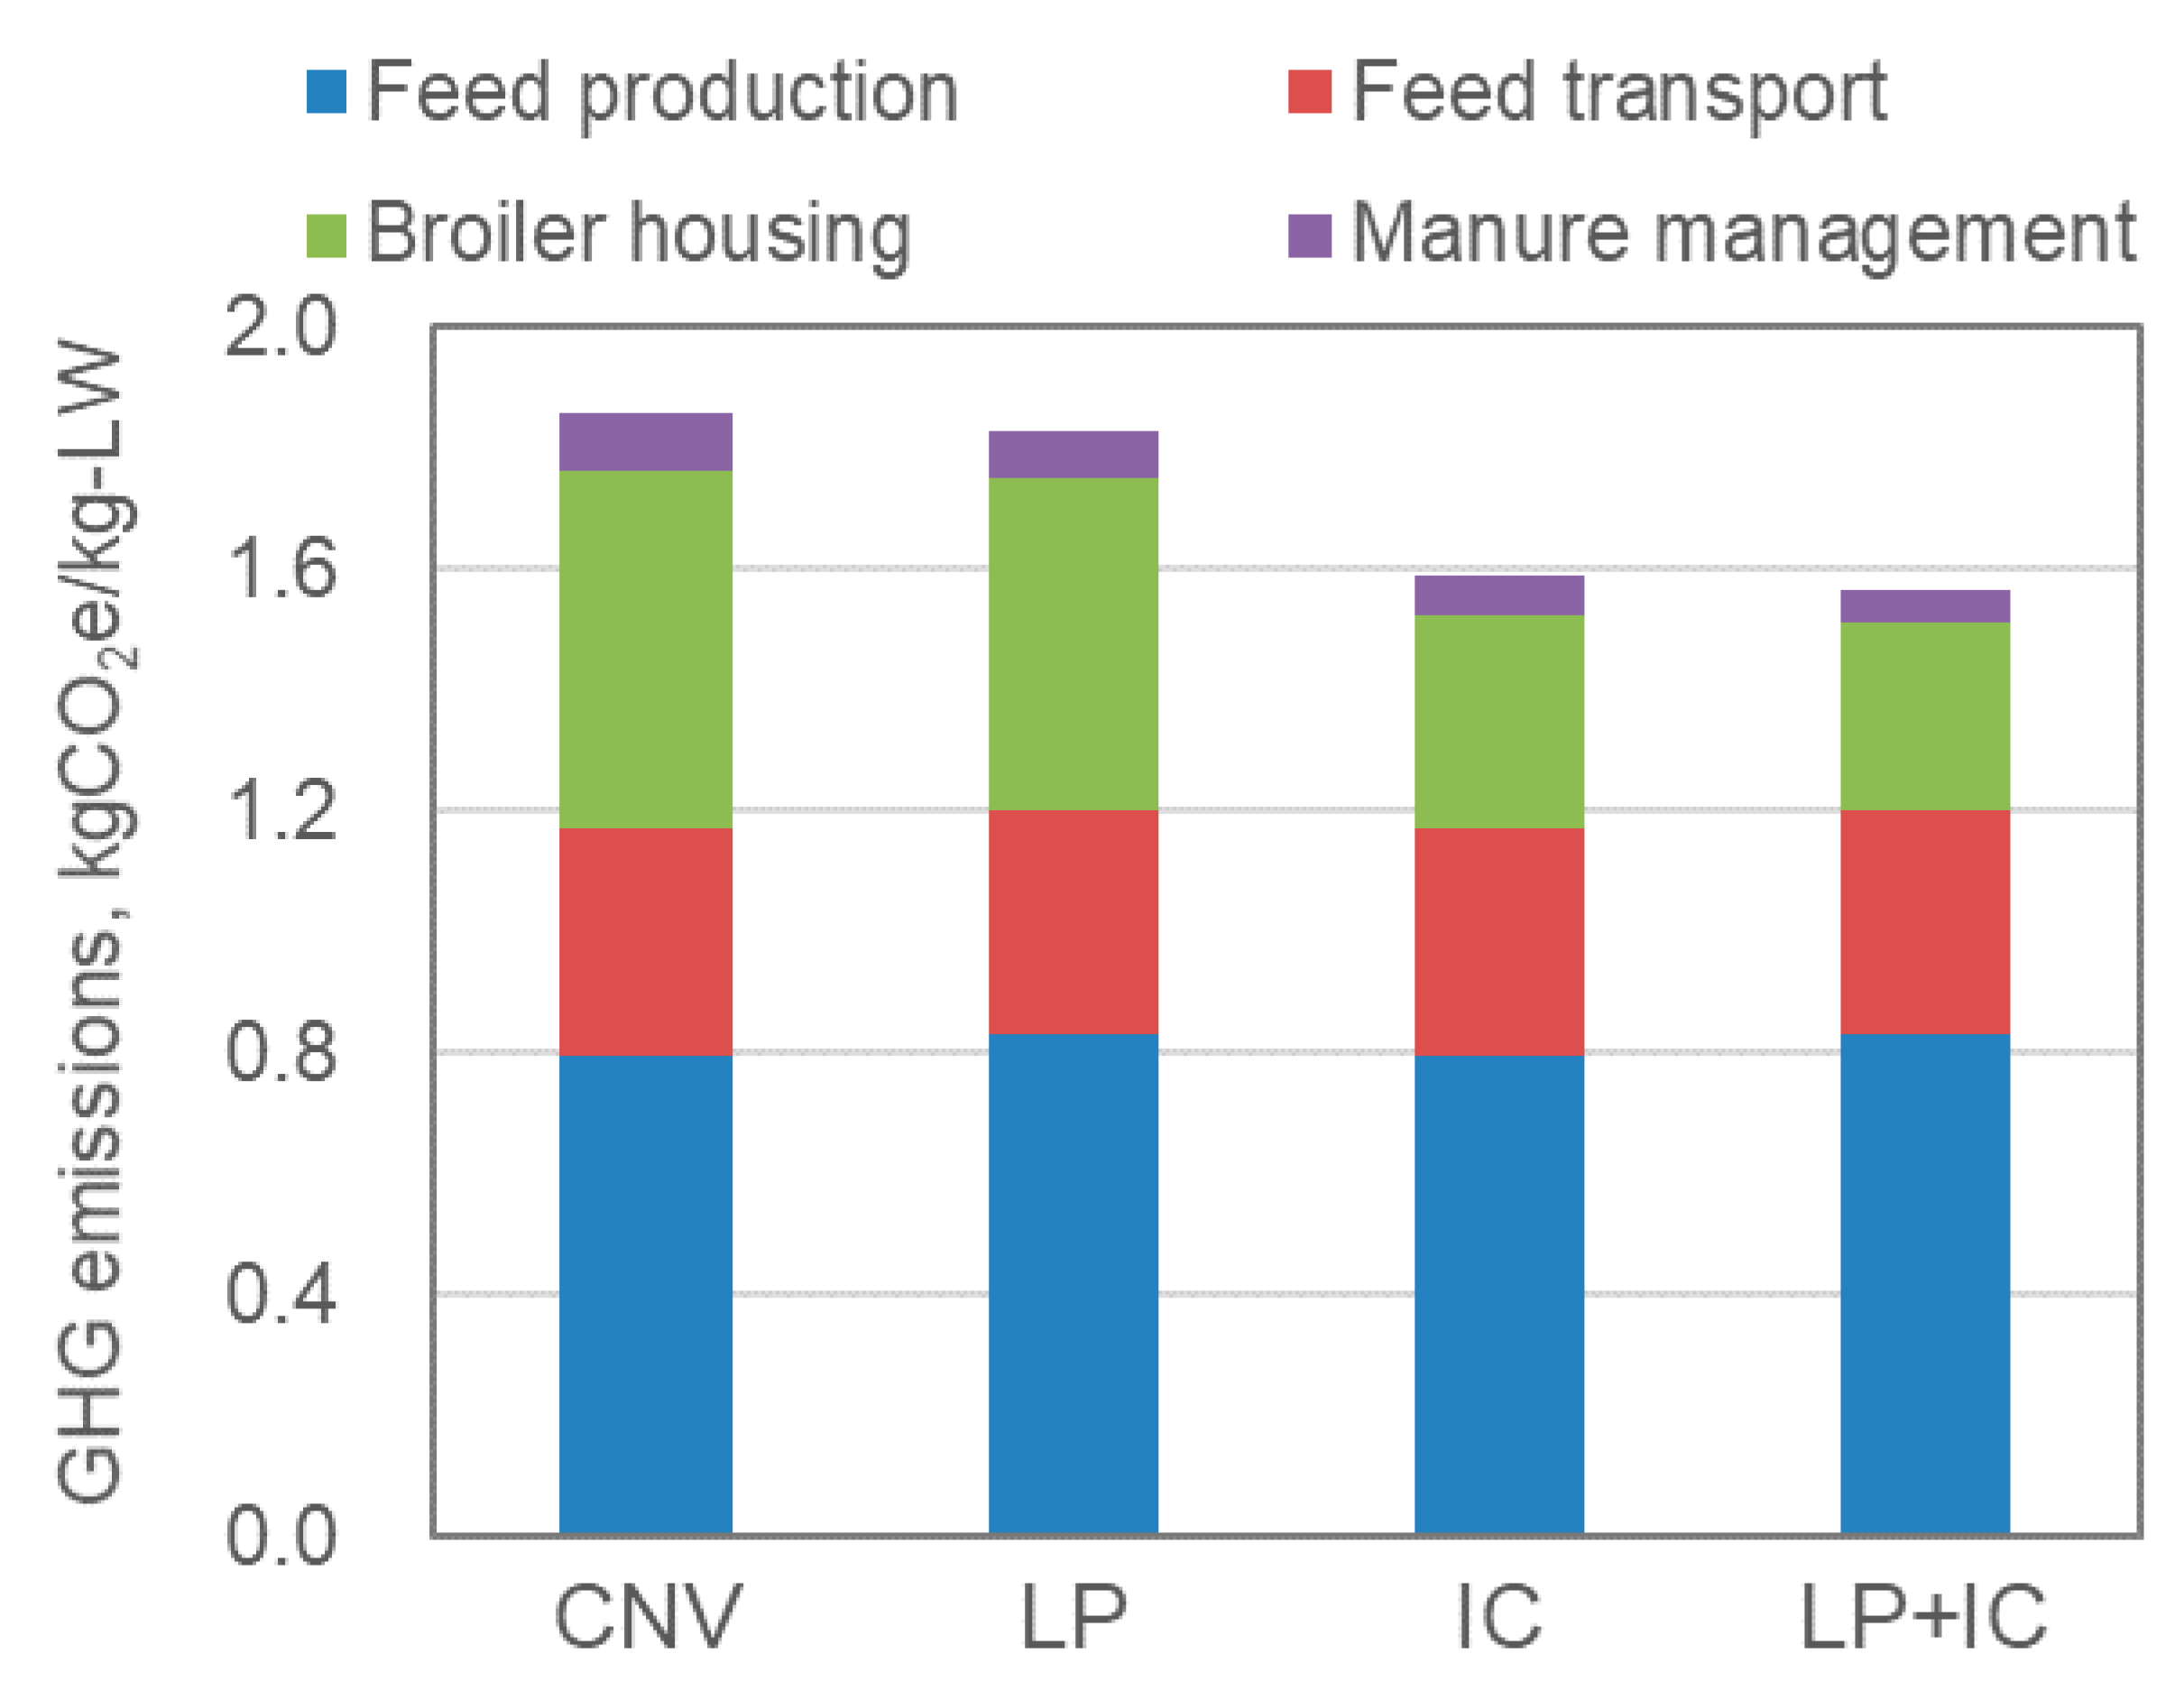
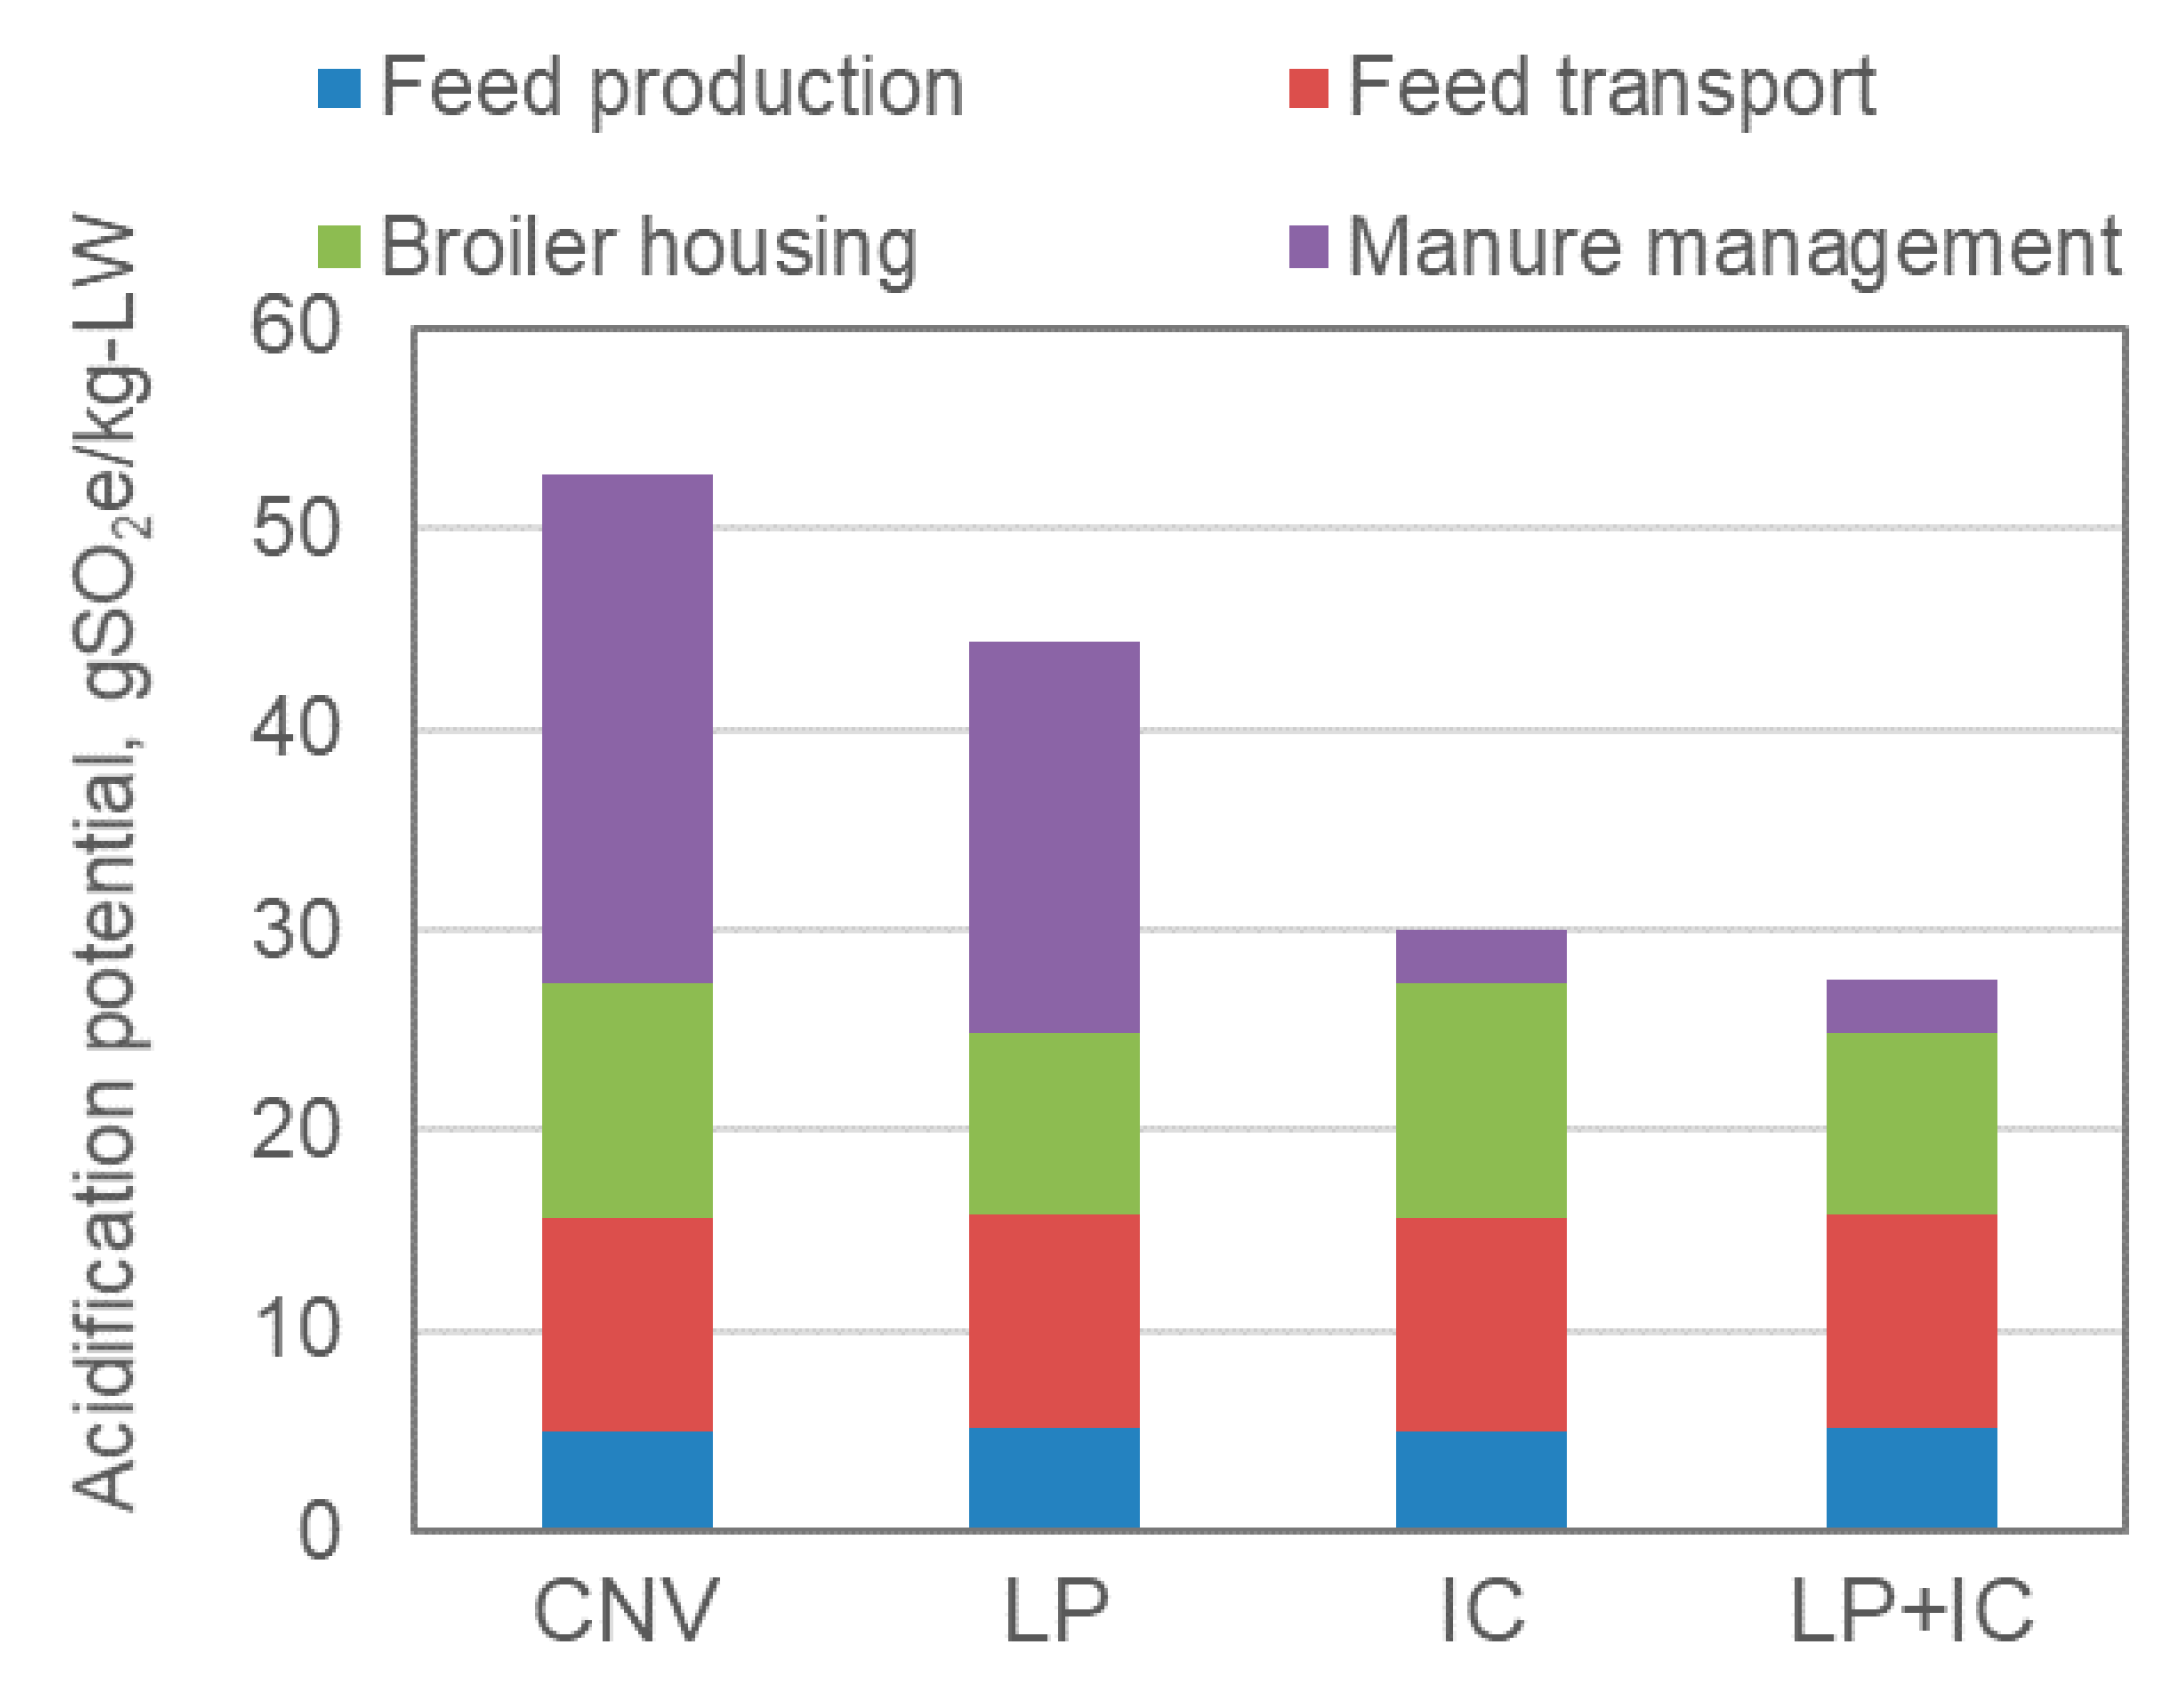
We conducted a sensitivity analysis to assess the robustness of the LCA results obtained in this study. The three tested scenarios were: (1) a higher N2O emission factor for incineration, (2) broiler production in a warmer region, and (3) the consideration of LULUC-related GHG emissions from the feed production. In the “higher incineration N2O” scenario, Billen et al. [33] reported the N2O emissions from incineration of 44–260 g/Mg manure, which can be converted to 0.121–0.714% (N2O-N/TN); we thus set the value of the N2O emission factor from broiler manure incineration at 0.714% instead of 0.1% for the baseline scenario.
In the “warmer region” scenario, we assumed that the fuel consumption for the heating of the broiler house is half of that in the baseline scenario. Regarding the consideration of LULUC-related GHG emissions from the feed production, some of the soybean meal was obtained from Brazil and Argentina as described above, and the soybeans produced in these two countries are related to land use change to some extent. We thus used the GHG emissions including LULUC from soybean production in Brazil [52] and Argentina [53] to calculate the GHG emissions involved in the diets. The calculated GHG emissions from the production of soymeal used in the diets with or without LULUC were 730 and 336 g CO2e/kg, respectively. Our further interpretation of the LCA results is described in the Discussion section.

3. Results

The GHG emissions from the four broiler production systems in Japan are illustrated in Figure 2. The GHG emissions from the CNV, LP, IC, and LP + IC systems were 1.86, 1.83, 1.59, and 1.57 kg CO2e/kg LW, respectively. The IC and LP + IC systems had 14% and 16% lower GHG emissions than the CNV system, respectively, and the reduction of CO2 emissions derived from fossil fuels in the broiler housing process contributed to the lower GHG emissions in these two systems. The feed production process was the largest GHG source (43%) followed by the housing process (32%) for CNV. For LP and LP + IC, the feed production process was also the largest GHG source; however, the feed transport was the second largest due to relatively lower GHG emissions from broiler housing. Carbon dioxide was the largest source of GHG emissions in all four systems.
Figure 3 depicts the acidification potential of the four broiler production systems. The acidification potentials of CNV, LP, IC, and LP + IC were 52.6, 44.3, 30.3, and 27.6 g SO2e/kg LW, respectively. The LP system showed a 14% lower acidification potential than the CNV system due to lower NH3 emissions from the broiler housing and manure management processes. The IC and LP + IC systems exhibited further lower acidification potentials than the CNV system, by 43% and 48%, respectively, due to much lower NH3 emissions from the manure management process. The NH3 emissions from manure management were the largest sources of acidification for CNV and LP, whereas the NH3 emission from broiler housing was the largest source for IC and the acidifying pollutant emissions from feed transport were the largest source for LP + IC.
The eutrophication potentials of CNV, LP, IC, and LP + IC were 18.3, 16.7, 14.3, and 13.8 g PO4e/kg LW, respectively (Figure 4). The lower NH3 emission from broiler housing and manure management contributed to lower eutrophication potentials for LP and LP + IC compared to CNV. The feed production process was the largest source of eutrophication for all four systems.
Figure 5 explains the energy consumption of the four broiler production systems. The energy consumption of CNV, LP, IC, and LP + IC was 18.8, 19.1, 15.6, and 15.9 MJ/kg LW, respectively. The IC and LP + IC systems had lower energy consumption than the CNV system due to the use of less fossil fuel in the broiler housing process; however, the LP system had slightly higher energy consumption due to higher energy use in the feed production process.
The results of the sensitivity analysis demonstrated that the “higher incineration N2O” scenario increased the GHG emissions from the LP + IC system; however, the LP + IC system still had lower GHG emissions than the CNV system (Table 3). Taking the LULUC-related GHG emissions into account, the GHG emissions from CNV, LP, IC, and LP + IC were 2.03, 1.95, 1.78, and 1.71 kg CO2e/kg LW, respectively. The consideration of LULUC-related GHG emissions had no effect on the relative environmental performance of the LP + IC system compared to the CNV system. In the “warmer region” scenario, LP + IC had smaller effects on reducing environmental impacts from CNV: 10% for GHG emissions and 7% for energy consumption.

4. Discussion

4.1. Comparison of the Four Broiler Production Systems

Our evaluation of the four broiler production systems using the LCA method revealed that compared to the CNV system, the LP + IC system had lower environmental impacts in all of the impact categories investigated herein (Figure 2, Figure 3, Figure 4 and Figure 5). The effect of the low-protein diet on GHG emissions was small (2%), and this seems to be because the broiler manure management for CNV has a lower N2O emission factor (0.16%) even though nitrogen excretion was reduced by the low-protein diet.
Ogino et al. reported that feeding a low-protein diet to fattening pigs reduced the life cycle GHG emissions from pig production by 5.4% in their LCA study [54], and higher N2O emissions from wastewater treatment contributed to the larger effect of the low-protein diet. Another reason for the smaller effect of the broiler low-protein diet in the present study appears to be that there is less room to lower the CP content in broiler diets since it is assumed that a certain amount of CAAs is added to even conventional broiler diets. In contrast to GHG emissions, the use of the low-protein diet reduced the acidification and eutrophication potentials to some extent compared to the CNV system, since a large amount of NH3 is emitted from the composting of broiler litter and the low-protein diet reduced the nitrogen excretion and consequent NH3 emission.
Regarding energy consumption, the carbon intensity of the CAAs was predictably higher than that of the main feed ingredients such as corn and soybean meal, and this led to the slightly higher energy consumption in the LP system.
The addition of protease to a diet increases protein digestibility and can thereby lower the CP contents of the diet. In their LCA study, Leinonen et al. observed that the use of a low-protein diet supplemented with protease in broiler production reduced the GHG emissions (by 2%), the acidification potential (by 5%), and the eutrophication potential (by 3%) compared to the conventional diet [55]. The effects of reducing nitrogen excretion by the addition of protease to the diets in their study were smaller than those obtained by the low-protein diet supplemented with more CAAs in this study, which seems to be due to a smaller reduction of the CP content by protease (6.9 g/kg on average).
Research is being conducted to further lower the CP content of broiler diets by adding more types of CAA such as valine and isoleucine [8,9], and it is hoped that this will lead to further reductions of environmental impacts — especially the acidification and eutrophication potentials of broiler production.
The IC system reduces fuel consumption by using the heat generated from the litter’s incineration for broiler-house heating, and this system thus had lower GHG emissions and energy consumption. The use of the IC systems also reduces the NH3 emission from the manure management process by incineration and thus had lower acidification and eutrophication potentials, even when NOx generation by litter incineration was taken into account. Broiler litter could be used as an energy source for other purposes such as electricity generation and gasification [12], and an LCA study of broiler production combined with such litter-utilization measures will be a future work.
In this study, the environmental impacts of broiler production were not allocated to the compost or broiler litter ash, which could be used as fertilizers, due to the following reasons: (1) phosphorus and potassium are left not only in the compost but also in the broiler litter ash, and thus the allocation does not affect the comparison between litter composting and incineration in terms of phosphorus and potassium, (2) since broiler production areas are also production areas for other livestock species in Japan and a large amount of compost is produced there, it is not clear whether the nitrogen in the compost reduces the use of synthetic nitrogen fertilizers. The avoided GHG emissions for the nitrogen in compost could be calculated to be 33 g CO2e/kg LW for the CNV system assuming 3.1 kg CO2e per kg N of synthetic nitrogen fertilizer [56] and 70% of fertilization efficiency for the nitrogen in broiler litter compost, which is relatively small compared to the overall GHG emissions from broiler production obtained in this study.
The results of the present sensitivity analysis demonstrated that the LP + IC system had lower environmental impacts than the CNV system in all four of the impact categories and in all of the scenarios investigated here. Regarding N2O emissions from litter incineration, Oshita et al. reported that the N2O emission from the incineration of cattle manure was increased at lower incineration temperatures (750−800 °C) [57]. The incineration of organic materials at ≤800 °C could also generate hazardous substances such as dioxin, and thus broiler litter should be incinerated at temperatures >850 °C. Considering the results of the present sensitivity analysis, litter incineration had smaller effects on the reduction of GHG emissions and energy consumption in a warmer region where the fuel consumption for broiler-house heating is lower, and thus litter incineration can be more effective in a colder region.
We observed that the effect of the low-protein diet on GHG mitigation was larger in the “LULUC” scenario than in the baseline scenario (96% vs. 98% as ratios to CNV), likely because soybean meal, a protein source, has a higher carbon intensity considering LULUC and because a low-protein diet reduces the use of soybean meal. Low-protein diets were reported to have different effects on GHG mitigation depending on the production areas of soybeans considering LULUC: larger effects for Brazil Center-West (involved with deforestation) and smaller effects for Brazil South (no relation to deforestation) [41,58].
As concerns about climate change continue to increase, many countries including Japan have set their own GHG reduction targets, and it is thus meaningful to evaluate the effects of mitigation measures on the reduction of GHG in each country as well as the reduction from a life cycle perspective. Taking into account the broiler housing and manure management processes as well as differences in the feed production and transport processes between the two compared systems as a system boundary, the LP + IC system had 42% lower GHG emissions than the CNV system.

4.2. Environmental Impacts of Broiler Production Systems

The results of several LCAs of broiler production have been reported, and a comparison of cradle-to-farmgate environmental impacts per kg LW of broiler production systems is provided in Table 4. A large variation in the environmental impacts was observed among the studies, depending on differences in feeds, production systems, and productivity. Different assumptions, emission factors, and characterization factors were also applied in these studies. A precise comparison is thus difficult; however, all of our present findings are within the ranges of the reported values.
GHG emissions were evaluated in all of the studies cited, and the reported values and the present data are in a range from 1.4 to 4.2 kg CO2e. The GHG emissions from broiler production were largely affected by whether LULUC-related emissions were included and, in cases in which LULUC-related emissions were considered, by the differences in the soybean meal contents in the diets [61] and the production area of soybean meal [16]. The higher acidification potential of the conventional system obtained in the present study appears to be due to the higher NH3 emission from manure management (composting).
Production systems and slaughter age have also had significant effects on environmental impacts. Among the LCA studies, the largest acidification and eutrophication potentials were obtained by the organic production system in a UK study [15], whereas the greatest energy consumption was in a high-quality system (slaughtered at 89 d) in a French study [16]. Among the reported studies and the present study, the slaughter age was significantly correlated with the acidification potential (r = 0.65), eutrophication potential (r = 0.52), and energy consumption (r = 0.82) per kg LW, whereas this was not the case with GHG emissions. Conversely, the higher productivity of broiler production systems tends to result in lower environmental impacts. It should be noted that production systems such as organic and high quality could have other advantages (e.g., increasing product quality and biodiversity of the ecosystem) not evaluated in the present LCA study.
Broiler chicken systems have relatively small environmental impacts among animal production systems. Nevertheless, our present findings suggest that effective mitigation opportunities for broiler chicken remain to be identified. Broiler production systems with optimal mitigation options will contribute to the production of animal products in a sustainable society.

5. Conclusions

We assessed the environmental impacts of conventional broiler chicken production in Japan using LCA and compared them with those of broiler production with mitigation options. The use of a low-protein diet supplemented with more crystalline amino acids reduced nitrogen excretion and consequent ammonia emission from manure management, resulting in lower acidification and eutrophication potentials. The broiler litter incineration reduced fuel consumption by utilizing the generated heat for broiler-house heating and thus led to lower GHG emissions and energy consumption. Furthermore, the litter incineration reduced ammonia emission from the manure management process by incineration and thus resulted in lower acidification and eutrophication potentials. Since the results of this study suggest that there are still mitigation opportunities for broiler chicken, broiler production systems with mitigation options help chickens to be produced in a more sustainable way.

Author Contributions

Conceptualization, A.O.; methodology, A.O. and A.S.; validation, A.O.; formal analysis, A.O.; investigation, A.O.; resources, A.O.; data curation, A.O.; writing—original draft preparation, A.O.; writing—review and editing, A.O., K.O., A.S. and T.O.; visualization, A.O.; project administration, A.O. and K.O.; funding acquisition, T.O. All authors have read and agreed to the published version of the manuscript.

Funding

This study was supported by the Ministry of Agriculture, Forestry and Fisheries of Japan, via the commissioned project study, “Development of Climate Change Mitigation Technology in the Livestock Sector”.

Data Availability Statement

The data presented in this study are available on request from the corresponding author.

Conflicts of Interest

The authors declare no conflict of interest.

References

  1. FAO. FAOSTAT. Production–Livestock Primary; Food and Agriculture Organization of the United Nations: Rome, Italy, 2020. [Google Scholar]
  2. OECD-FAO. OECD-FAO Agricultural Outlook 2020–2029; Food and Agriculture Organization of the United Nations: Rome, Italy, 2020; Available online: http://www.fao.org/publications/oecd-fao-agricultural-outlook/2020-2029/en/ (accessed on 14 August 2021).
  3. FAO. Poultry Development Review; Food and Agriculture Organization of the United Nations: Rome, Italy, 2013. [Google Scholar]
  4. De Vries, M.; de Boer, I.J.M. Comparing environmental impacts for livestock products: A review of life cycle assessments. Livest. Sci. 2010, 128, 1–11. [Google Scholar] [CrossRef]
  5. Poore, J.; Nemecek, T. Reducing food’s environmental impacts through producers and consumers. Science 2018, 360, 987–992. [Google Scholar] [CrossRef] [PubMed] [Green Version]
  6. Misselbrook, T.H.; Van der Weerden, T.J.; Pain, B.F.; Jarvis, S.C.; Chambers, B.J.; Smith, K.A.; Phillips, V.R.; Demmers, T.G.M. Ammonia emission factors for UK agriculture. Atmos. Environ. 2000, 34, 871–880. [Google Scholar] [CrossRef]
  7. Hojito, M.; Ikeguchi, A.; Kohyama, K.; Shimada, K.; Ogino, A.; Mishima, S.; Kaku, K. Estimation of nitrogen loading in Japanese prefectures and scenario testing of abatement strategies. Jpn. J. Soil Sci. Plant. Nutr. 2003, 74, 467–474. [Google Scholar]
  8. Kidd, M.T.; Maynard, C.W.; Mullenix, G.J. Progress of amino acid nutrition for diet protein reduction in poultry. J. Anim. Sci. Biotechnol. 2021, 12, 45. [Google Scholar] [CrossRef] [PubMed]
  9. Selle, P.H.; de Paula Dorigam, J.C.; Lemme, A.; Chrystal, P.V.; Liu, S.Y. Synthetic and crystalline amino acids: Alternatives to soybean meal in chicken-meat production. Animals 2020, 10, 729. [Google Scholar] [CrossRef] [PubMed] [Green Version]
  10. Dagnall, S.; Hill, J.; Pegg, D. Resource mapping and analysis of farm livestock manures — Assessing the opportunities for biomass-to-energy schemes. Bioresour. Technol. 2000, 71, 225–234. [Google Scholar] [CrossRef]
  11. Kelleher, B.P.; Leahy, J.J.; Henihan, A.M.; O’Dwyer, T.F.; Sutton, D.; Leahy, M.J. Advances in poultry litter disposal technology—A review. Bioresour. Technol. 2002, 83, 27–36. [Google Scholar] [CrossRef]
  12. Santos Dalólio, F.; da Silva, J.N.; de Oliveira, A.C.C.; de Fátima Ferreira Tinôco, I.; Barbosa, R.C.; de Oliveira Resende, M.; Albino, L.F.T.; Coelho, S.T. Poultry litter as biomass energy: A review and future perspectives. Renew. Sustain. Energy Rev. 2017, 76, 941–949. [Google Scholar] [CrossRef]
  13. ISO. Environmental Management—Life Cycle Assessment—Principles and Framework; International Organization for Standardization: Geneva, Switzerland, 2006; Available online: https://www.iso.org/standard/37456.html (accessed on 14 August 2021).
  14. Pelletier, N. Environmental performance in the US broiler poultry sector: Life cycle energy use and greenhouse gas, ozone depleting, acidifying and eutrophying emissions. Agric. Syst. 2008, 98, 67–73. [Google Scholar] [CrossRef]
  15. Leinonen, I.; Williams, A.G.; Wiseman, J.; Guy, J.; Kyriazakis, I. Predicting the environmental impacts of chicken systems in the United Kingdom through a life cycle assessment: Broiler production systems. Poult. Sci. 2012, 91, 8–25. [Google Scholar] [CrossRef]
  16. Da Silva, V.P.; van der Werf, H.M.G.; Soares, S.R.; Corson, M.S. Environmental impacts of French and Brazilian broiler chicken production scenarios: An LCA approach. J. Environ. Manag. 2014, 133, 222–231. [Google Scholar] [CrossRef]
  17. Costantini, M.; Ferrante, V.; Guarino, M.; Bacenetti, J. Environmental sustainability assessment of poultry productions through life cycle approaches: A critical review. Trends Food Sci. Technol. 2021, 110, 201–212. [Google Scholar] [CrossRef]
  18. De Boer, I.J.M. Environmental impact assessment of conventional and organic milk production. Livest. Prod. Sci. 2003, 80, 69–77. [Google Scholar] [CrossRef]
  19. Lorenz, H.; Reinsch, T.; Hess, S.; Taube, F. Is low-input dairy farming more climate friendly? A meta-analysis of the carbon footprints of different production systems. J. Clean. Prod. 2019, 211, 161–170. [Google Scholar] [CrossRef]
  20. Ogino, A.; Kaku, K.; Osada, T.; Shimada, K. Environmental impacts of the Japanese beef-fattening system with different feeding lengths as evaluated by a life-cycle assessment method. J. Anim. Sci. 2004, 82, 2115–2122. [Google Scholar] [CrossRef]
  21. Cusack, D.F.; Kazanski, C.E.; Hedgpeth, A.; Chow, K.; Cordeiro, A.L.; Karpman, J.; Ryals, R. Reducing climate impacts of beef production: A synthesis of life cycle assessments across management systems and global regions. Glob. Chang. Biol. 2021, 27, 1721–1736. [Google Scholar] [CrossRef] [PubMed]
  22. Basset-Mens, C.; van der Werf, H.M.G. Scenario-based environmental assessment of farming systems: The case of pig production in France. Agric. Ecosyst. Environ. 2005, 105, 127–144. [Google Scholar] [CrossRef]
  23. McAuliffe, G.A.; Chapman, D.V.; Sage, C.L. A thematic review of life cycle assessment (LCA) applied to pig production. Environ. Impact Assess. Rev. 2016, 56, 12–22. [Google Scholar] [CrossRef]
  24. Costa, M.P.; Schoeneboom, J.C.; Oliveira, S.A.; Viñas, R.S.; de Medeiros, G.A. A socio-eco-efficiency analysis of integrated and non-integrated crop-livestock-forestry systems in the Brazilian Cerrado based on LCA. J. Clean. Prod. 2018, 171, 1460–1471. [Google Scholar] [CrossRef] [Green Version]
  25. Ogino, A.; Van Thu, N.; Hosen, Y.; Izumi, T.; Suzuki, T.; Sakai, T.; Ando, S.; Osada, T.; Kawashima, T. Environmental impacts of a rice-beef-biogas integrated system in the Mekong Delta, Vietnam evaluated by life cycle assessment. J. Environ. Manag. 2021, 294, 112900. [Google Scholar] [CrossRef]
  26. Ogino, A.; Murakami, H.; Yamashita, T.; Furuya, M.; Kawahara, H.; Ohkubo, T.; Osada, T. Estimation of nutrient excretion factors of broiler and layer chickens in Japan. Anim. Sci. J. 2017, 88, 659–668. [Google Scholar] [CrossRef] [PubMed]
  27. Aviagen, I. Ross Broiler Nutrition Specifications 2019; Aviagen: Huntsville, AL, USA, 2019. [Google Scholar]
  28. JEMAI. LCA Software MiLCA. Available online: http://www.milca-milca.net/english/index.php (accessed on 13 March 2014).
  29. Ajinomoto. CO2 Emission Factor Database for Food-Related Materials; Ajinomoto Co., Inc.: Tokyo, Japan, 2010. [Google Scholar]
  30. Wathes, C.M.; Holden, M.R.; Sneath, R.W.; White, R.P.; Phillips, V.R. Concentrations and emission rates of aerial ammonia, nitrous oxide, methane, carbon dioxide, dust and endotoxin in UK broiler and layer houses. Br. Poult. Sci. 1997, 38, 14–28. [Google Scholar] [CrossRef] [PubMed]
  31. GIO (Greenhouse Gas Inventory Office of Japan); MOE (Ministry of the Environment, Japan). National Greenhouse Gas. Inventory Report of JAPAN 2020; Center for Global Environmental Research, National Institute for Environmental Studies: Tsukuba, Japan, 2020.
  32. Morand, P.; Peres, G.; Robin, P.; Yulipriyanto, H.; Baron, S. Gaseous emissions from composting bark/manure mixtures. Compost Sci. Util. 2005, 13, 14–26. [Google Scholar] [CrossRef]
  33. Billen, P.; Costa, J.; Van der Aa, L.; Van Caneghem, J.; Vandecasteele, C. Electricity from poultry manure: A cleaner alternative to direct land application. J. Clean. Prod. 2015, 96, 467–475. [Google Scholar] [CrossRef]
  34. EEA (European Environment Agency). EMEP/EEA Air Pollutant Emission Inventory Guidebook 2019; European Environment Agency: Copenhagen, Denmark, 2019; Available online: https://www.eea.europa.eu/publications/emep-eea-guidebook-2019 (accessed on 14 August 2021).
  35. Demmers, T.G.M.; Burgess, L.R.; Short, J.L.; Philips, V.R.; Clark, J.A.; Wathes, C.M. Ammonia emissions from two mechanically ventilated UK livestock buildings. Atmos. Environ. 1999, 33, 217–227. [Google Scholar] [CrossRef]
  36. Koerkamp, P.W.G.G.; Metz, J.H.M.; Uenk, G.H.; Phillips, V.R.; Holden, M.R.; Sneath, R.W.; Short, J.L.; White, R.P.; Hartung, J.; Seedorf, J.; et al. Concentrations and emissions of ammonia in livestock buildings in Northern Europe. J. Agric. Eng. Res. 1998, 70, 79–95. [Google Scholar] [CrossRef]
  37. Hayes, E.T.; Curran, T.P.; Dodd, V.A. Odour and ammonia emissions from intensive poultry units in Ireland. Bioresour. Technol. 2006, 97, 933–939. [Google Scholar] [CrossRef] [Green Version]
  38. Wheeler, E.F.; Casey, K.D.; Gates, R.S.; Xin, H.; Zajaczkowski, J.L.; Topper, P.A.; Liang, Y.; Pescatore, A.J. Ammonia emissions from twelve US broiler chicken houses. Trans. ASABE 2006, 49, 1495–1512. Available online: https://www.nal.usda.gov/exhibits/ipd/frostonchickens/exhibits/show/henhouses/item/290 (accessed on 14 August 2021).
  39. USDA-ERS. Farm. Business and Household Survey Data: Customized Data Summaries From Agricultural Resources and Management Survey (ARMS); United States Department of Agriculture, Economic Research Service: Washington, DC, USA, 2009.
  40. Wang, M. GREET 1.8b; Argonne National Laboratory: Argonne, IL, USA, 2008. [Google Scholar]
  41. Mosnier, E.; van der Werf, H.M.G.; Boissy, J.; Dourmad, J.-Y. Evaluation of the environmental implications of the incorporation of feed-use amino acids in the manufacturing of pig and broiler feeds using Life Cycle Assessment. Animal 2011, 5, 1972–1983. [Google Scholar] [CrossRef] [Green Version]
  42. IPCC. 2006 IPCC Guidelines for National Greenhouse Gas. Inventories; Institute for Global Environmental Strategies (IGES): Hayama, Japan, 2006. [Google Scholar]
  43. Bouwman, A.F.; Boumans, L.J.M.; Batjes, N.H. Estimation of global NH3 volatilization loss from synthetic fertilizers and animal manure applied to arable lands and grasslands. Glob. Biogeochem. Cycles 2002, 16, 1024. [Google Scholar] [CrossRef]
  44. MOF (Ministry of Finance). Trade Statistics of Japan; Ministry of Finance: Tokyo, Japan, 2019.
  45. Sato, K. Life cycle CO2 emissions from soy oil and soymeal production. In Life Cycle Assessment of Foods and Development of a Sustainability Indicator for Agro-Food Consumption and Production; Food Study Group, Inst. LCA Jpn: Tokyo, Japan, 2006. [Google Scholar]
  46. AFFTIS. Investigation of Energy-Managing Agricultural Production System Development [In Japanese]; Agriculture, Forestry and Fisheries Technology Information Society: Tokyo, Japan, 2000. [Google Scholar]
  47. LEIO. A Guide to Treatment and Utilization of Livestock Manure; Livestock Environment Improvement Organization: Tokyo, Japan, 1998. [Google Scholar]
  48. NARO. Japanese Feeding Standard for Poultry, 2011; Japan Livestock Industry Association: Tokyo, Japan, 2012.
  49. NARO. Standard Tables of Feed Composition in Japan, 2009; Japan Livestock Industry Association: Tokyo, Japan, 2010.
  50. IPCC. Climate Change 2007: The Physical Science Basis; Intergovernmental Panel on Climate Change: Geneva, Switzerland, 2007. [Google Scholar]
  51. Heijungs, R.; Guinee, J.; Huppes, G.; Lankreijer, R.M.; de Haes, H.A.U.; Sleeswijk, A.W.; Ansems, A.M.M.; Eggels, P.G.; Van Duin, R.; De, G.P. Environmental Life Cycle Assessment of Products–Guide; Center of Environmental Science (CML) Leiden University: Leiden, The Netherlands, 1992. [Google Scholar]
  52. Garcia-Launay, F.; van der Werf, H.M.G.; Nguyen, T.T.H.; Tutour, L.L.; Dourmad, J.Y. Evaluation of the environmental implications of the incorporation of feed-use amino acids in pig production using Life Cycle Assessment. Livest. Sci. 2014, 161, 158–175. [Google Scholar] [CrossRef]
  53. Panichelli, L.; Dauriat, A.; Gnansounou, E. Life cycle assessment of soybean-based biodiesel in Argentina for export. Int. J. Life Cycle Assess. 2009, 14, 144–159. [Google Scholar] [CrossRef] [Green Version]
  54. Ogino, A.; Osada, T.; Takada, R.; Takagi, T.; Tsujimoto, S.; Tonoue, T.; Matsui, D.; Katsumata, M.; Yamashita, T.; Tanaka, Y. Life cycle assessment of Japanese pig farming using low-protein diet supplemented with amino acids. Soil Sci. Plant. Nutr. 2013, 59, 107–118. [Google Scholar] [CrossRef]
  55. Leinonen, I.; Williams, A.G. Effects of dietary protease on nitrogen emissions from broiler production: A holistic comparison using Life Cycle Assessment. J. Sci. Food Agric. 2015, 95, 3041–3046. [Google Scholar] [CrossRef] [Green Version]
  56. Ogino, A.; Ishida, M.; Ohmori, H.; Tanaka, Y.; Yamashita, T.; Yokoyama, H.; Tatsugawa, K.; Ijiri, S.; Kawashima, T. Life cycle assessment of animal feeds prepared from liquid food residues: A case study of rice-washing water. J. Environ. Qual. 2012, 41, 1982–1988. [Google Scholar] [CrossRef] [PubMed]
  57. Oshita, K.; Sun, X.C.; Taniguchi, M.; Takaoka, M.; Matsukawa, K.; Fujiwara, T. Emission of greenhouse gases from controlled incineration of cattle manure. Environ. Technol. 2012, 33, 1539–1544. [Google Scholar] [CrossRef]
  58. Monteiro, A.N.; Garcia-Launay, F.; Brossard, L.; Wilfart, A.; Dourmad, J.Y. Effect of feeding strategy on environmental impacts of pig fattening in different contexts of production: Evaluation through life cycle assessment. J. Anim. Sci. 2016, 94, 4832–4847. [Google Scholar] [CrossRef]
  59. González-García, S.; Gomez-Fernández, Z.; Dias, A.C.; Feijoo, G.; Moreira, M.T.; Arroja, L. Life Cycle Assessment of broiler chicken production: A Portuguese case study. J. Clean. Prod. 2014, 74, 125–134. [Google Scholar] [CrossRef]
  60. Da Silva Lima, N.D.; de Alencar Nääs, I.; Garcia, R.G.; de Moura, D.J. Environmental impact of Brazilian broiler production process: Evaluation using life cycle assessment. J. Clean. Prod. 2019, 237, 117752. [Google Scholar] [CrossRef]
  61. Giannenas, I.; Bonos, E.; Anestis, V.; Filioussis, G.; Papanastasiou, D.K.; Bartzanas, T.; Papaioannou, N.; Tzora, A.; Skoufos, I. Effects of protease addition and replacement of soybean meal by corn gluten meal on the growth of broilers and on the environmental performances of a broiler production system in Greece. PLoS ONE 2017, 12, e0169511. [Google Scholar] [CrossRef] [PubMed]
  62. Cesari, V.; Zucali, M.; Sandrucci, A.; Tamburini, A.; Bava, L.; Toschi, I. Environmental impact assessment of an Italian vertically integrated broiler system through a Life Cycle approach. J. Clean. Prod. 2017, 143, 904–911. [Google Scholar] [CrossRef]
Figure 1. The four broiler production systems investigated in this study. CNV, conventional system; LP, system that uses low-protein diet supplemented with more crystalline amino acids; IC, system that includes incineration of broiler litter; LP + IC, system that combines LP and IC.
Agriculture 11 00921 g001
Figure 2. Greenhouse gas (GHG) emissions from the four broiler production systems. LW, liveweight; GHG, greenhouse gas; CNV, conventional system; LP, system that uses low-protein diet supplemented with more crystalline amino acids; IC, system that includes incineration of broiler litter; LP + IC, system that combines LP and IC.
Agriculture 11 00921 g002
Figure 3. The four broiler production systems’ impacts on acidification. LW, liveweight; CNV, conventional system; LP, system that uses low-protein diet supplemented with more crystalline amino acids; IC, system that includes incineration of broiler litter; LP + IC, system that combines LP and IC.
Agriculture 11 00921 g003
Figure 4. The four broiler production systems’ impacts on eutrophication. LW, liveweight; CNV, conventional system; LP, system that uses low-protein diet supplemented with more crystalline amino acids; IC, system that includes incineration of broiler litter; LP + IC, system that combines LP and IC.
Agriculture 11 00921 g004
Figure 5. The four broiler production systems’ impacts on energy consumption. LW, liveweight; CNV, conventional system; LP, system that uses low-protein diet supplemented with more crystalline amino acids; IC, system that includes incineration of broiler litter; LP + IC, system that combines LP and IC.
Agriculture 11 00921 g005
Table 1. Compositions of the conventional and low-protein diets.
First StageSecond Stage
ConventionalLow-ProteinConventionalLow-Protein
Corn54.1756.3558.0765.55
Soybean meal30.7030.0032.9025.00
Vegetable oil5.505.505.505.50
Corn gluten meal4.903.300.000.00
DL-methionine0.330.370.270.34
L-lysine, HCl0.400.440.080.32
L-threonine0.150.190.040.15
Calcium carbonate1.001.000.750.75
Tricalcium phosphate1.901.901.451.45
Salt0.370.370.310.31
Vitamins and minerals0.580.580.630.63
CP21.7220.6419.4816.83
As-fed basis, %. First stage, before 3 weeks of age; second stage, >3 weeks of age. CP: crude protein.
Table 2. Emission factors associated with the broiler production systems used in this study.
CompostingRef.IncinerationRef.
Animal housing:
CH4, mgCH4/kg BW/d12.0Wathes et al., 1997 [30]12.0Wathes et al., 1997 [30]
N2O, mgN2O-N/kg BW/d18.0 aWathes et al., 1997 [30]18.0 aWathes et al., 1997 [30]
NH3, mgNH3-N/animal/d299.0 aSee the footnote b299.0 aSee the footnote b
Manure management:
CH4, % c0.02GIO 2020 [31]0.40GIO 2020 [31]
N2O, % (N2O-N)0.08GIO 2020 [31]0.10GIO 2020 [31]
NH3, % (NH3-N)42.0Morand et al., 2005 [32]0.06Billen et al., 2015 [33]
NOX, kg/Mg manure04.99EEA 2019 [34]
a For the scenarios in which the low-protein diet was provided, 11.4% lower emission factors were used in response to the reduction of nitrogen excretion. b Average of five references: Demmers et al. (1999) [35], Groot Koerkamp et al. (1998) [36], Hayes et al. (2006) [37], Wathes et al. (1997) [30], and Wheeler et al. (2006) [38]. c Proportion to organic matter amount in manure. CH4: methane, N2O: nitrous oxide, NH3: ammonia.
Table 3. Sensitivity analysis on the environmental impacts of broiler production systems.
CNVLP + IC
Baseline
LP + IC
High N2O b
LP + IC
Warmer Region c
LP + IC
LULUC d
GHG emissions, kg CO2e a1.8684%88%90%84%
Acidification potential, g SO2e52.652%52%52%52%
Eutrophication potential, g PO4e18.376%76%76%76%
Energy consumption, MJ18.885%85%92%85%
a Units are per kg liveweight. The environmental impacts of LP + IC are expressed as the changes from those of CNV. b  The N2O emission factor from litter incineration was determined as 0.714% (0.1% for the baseline scenario). c It was assumed that the broilers were produced in a warmer region and that the fuel consumption for the heating of the broiler house was half of that in the baseline scenario. d The GHG emissions related to land use and land use change (LULUC) were considered. AP: acidification potential, EC: energy consumption, EP: eutrophication potential, GHG: greenhouse gas emissions.
Table 4. Comparison of cradle-to-farmgate environmental impacts per kg liveweight of broiler production systems.
SystemCountryGWP,
kg CO2e
AP,
g SO2e
EP,
g PO4e
EC,
MJ
LULUC aSlaughter Age, dSlaughter Weight, kgRef. (First Author)
Per kg Liveweight
ConventionalJapan1.8652.618.318.8N523.06This study
Low-protein + litter incinerationJapan1.5727.613.815.9N523.06This study
ConventionalJapan2.0352.618.318.8Y523.06This study
Low-protein + litter incinerationJapan1.7127.613.815.9Y523.06This study
ContemporaryUSA1.4015.83.915.0N482.26Pelletier 2008 [14]
StandardUK2.9130.813.416.7Y391.95Leinonen 2012 [15]
Free rangeUK3.3939.416.016.9Y582.06Leinonen 2012 [15]
OrganicUK3.7360.432.226.6Y732.17Leinonen 2012 [15]
StandardFrance2.2228.713.819.1Y401.92Prudêncio da Silva 2014 [16]
High-qualityFrance2.7047.219.329.5Y892.26Prudêncio da Silva 2014 [16]
Brazilian Center-WestBrazil2.0631.414.018.0Y422.40Prudêncio da Silva 2014 [16]
Brazilian SouthBrazil1.4534.514.419.1Y422.48Prudêncio da Silva 2014 [16]
ConventionalPortugal1.6228.513.410.2N341.70González-García 2014 [59]
Brazilian Center-WestBrazil2.7040.026.015.0Y502.84Duarte da Silva Lima 2019 [60]
Soybean mealGreece4.2132.417.814.9Y422.42Giannenas 2017 [61]
Soybean meal + proteaseGreece3.9231.217.514.7Y422.39Giannenas 2017 [61]
Corn gluten mealGreece1.6328.717.515.4Y422.26Giannenas 2017 [61]
Light broilersItaly3.0314.310.010.2Y321.60Cesari 2017 [62]
Medium broilersItaly3.2515.810.610.7Y402.50Cesari 2017 [62]
Roasters (heavy)Italy3.8419.212.812.4Y533.80Cesari 2017 [62]
a Greenhouse gas emissions related to land use and land use change (LULUC) are included or not. AP: acidification potential, EC: energy consumption, EP: eutrophication potential, GWP: global warming potential.
Publisher’s Note: MDPI stays neutral with regard to jurisdictional claims in published maps and institutional affiliations.

