Abstract
Microwave treatment is a green and pollution-free soil disinfection method. The application of microwaves to disinfect soil before cultivation is highly important to increase crop yields and protect the ecological environment. The electromagnetic field is an important parameter influencing the soil temperature field in the process of microwave soil treatment, and the change in soil temperature directly affects soil disinfection. Therefore, this article carried out research on the heating pattern in North China loess due to microwave treatment. First, COMSOL software was employed to simulate the microwave soil treatment process to analyze microwave penetration into soil. Second, with the application of microwaves at the designed frequency produced with a 2.45-GHz tunable microwave generating microdevice, soil with water contents of 0%, 10%, 20%, and 30% was treated for 10~60 s (at 10-s time intervals), and experiments on the influence of the microwave output power, treatment time, and soil moisture content on the soil temperature were performed via the controlled variable method. The simulation results indicate that with increasing soil moisture content, the microwave frequency inside the soil model increases, and the electric field intensity value decreases in the model at the same depth. After microwaves traverse through the 20-cm soil model, the incident field strength is three orders of magnitude lower than the outgoing field strength. The results of the microwave soil treatment experiment reveal that: (1) Compared to microwave output power levels of 1.8 and 1.6 kW, a level of 2 kW is more suitable for microwave soil disinfection. (2) After treatment, the highest temperature occurs on the soil surface, not within the soil. (3) The location of the highest soil internal temperature after microwave treatment increasingly approaches the soil surface with increasing soil moisture content, and the microwave output power does not affect the location of the highest soil internal temperature. Combining the electromagnetic field simulation and microwave soil treatment experiment results, it was found that the higher the field strength is, the higher the temperature value, and the highest soil internal temperature after microwave treatment often occurs at the first electromagnetic wave peak.
1. Introduction
Land use strongly affects the resilience of the soil food web and its response to extreme events caused by climate change [1]. Although the popularization of facility agriculture overcomes climate restrictions on crop growth, this also increases the risk of soil-borne diseases, insects, and weeds. Therefore, soil disinfection and eradication of harmful organisms in soil are important agronomic measures to increase crop yields. The chemicals commonly applied in soil disinfection include methyl bromide and chloropicrin. Because of the advantages of high speed and notable penetration into soil, chemical agents have been favored by farmers for decades. However, drug residues remain after the chemical soil disinfection process, which threatens the safety of humans and animals and damages the natural ecological environment [2,3]. As global sustainable development has been proposed, researchers are constantly developing green soil disinfection methods that can replace chemical agents.
In contrast to chemical fumigation methods, physical soil disinfection mainly relies on heat to kill pathogenic soil bacteria, insects, and weeds [4]. Common methods include fire, steam, and solar energy [5]. The ultimate goal of these methods is to maximize the transfer of heat energy to deep soil layers to achieve the best soil treatment effect. Because of the unique penetration features of microwaves, they perform better in terms of soil biological inactivation [6]. Microwave treatment, as a new agricultural physical disinfection method, was proposed in the 1980s [7], and microwave penetration in the soil disinfection process involves high-speed oscillation of polar molecules in soil. According to Fanti et al. [8], microwaves can simultaneously heat the interior and exterior of media containing polar molecules, and the actual effect is similar to that of chemical fumigation. This method leaves no residue or pollution upon application and helps to improve the soil microbial community and nitrogen content [9]. In addition, studies have indicated that microwave soil disinfection imposes a nonthermal effect on organisms [10], and microwaves affect the charge distribution near the cell membranes of organisms, causing cell membrane damage and membrane dysfunction, thus interfering with or destroying cells. Normal metabolic function interruption leads to organism growth inhibition, cessation, or death [11]. The main manifestation of microwave soil disinfection is reflected in the change of soil temperature [12]. The higher temperature after microwave treatment inactivates biological proteins, thereby killing pathogenic soil bacteria, nematodes, and other harmful organisms and grass seeds. Microwaves are an effective means to control soil microorganisms [13]. A previous study demonstrated that the soil microbial community and nitrogen content after a one-month microwave treatment were notably greater than those before the microwave treatment. Although, the microwave soil disinfection process will indiscriminately inactivate soil microorganisms, insects, and grass seeds. The crop yield in a pot experiment increased by 200%, and the crop yield per plant in a field experiment increased by 35~92% [9]. Research by Speir et al. [14] revealed that low-level microwave irradiation (approximately 5.4 × 10⁴ J) affects soil microorganisms, and the overall effect is similar to that of chloroform treatment in regard to the increase in extractable mineral nitrogen. Microwaves can also cause microbial damage in soil, so microwave treatment can be adopted as an effective method to evaluate the ability of the soil microbial population to survive under continuous microwave irradiation [15].
Microwave soil disinfection has broad application prospects. Soil temperature information constitutes an important basis for research on the inactivation of soil organisms and soil properties. As there are few related studies, the application of microwave in soil disinfection is limited. In this paper, a microwave transmission system with a transmission frequency of 2.45 GHz was selected. Taking Beijing loess in North China as an example, a 10–60 s microwave irradiation test was carried out on 0–30% water-bearing soil. The purpose is to explore the heating of the soil under the action of microwaves in a short period of time and, according to the law, obtain a model of microwave irradiation time and soil temperature change and determine the effective working depth of microwaves on soil with different moisture contents. When microwaves are used in agricultural production, determining the appropriate microwave output power and microwave irradiation time according to different soil conditions is beneficial to increase the applicability of the microwave soil disinfection method under different soil conditions and greatly improves the efficiency of soil microwave disinfection operations.
2. Materials and Methods
2.1. Electromagnetic Field Simulation with a Soil Model
COMSOL Multiphysics is an electromagnetic simulation software based on the finite element method. COMSOL Multiphysics relies on Maxwell partial differential equations to establish a microwave simulation model to calculate the field strength when microwaves act on soil so that the simulation results better reflect the real situation. According to the simulation results, the field intensity value that determines the soil temperature during the microwave treatment process can be obtained, and the soil model size can be preliminarily determined via experiments by observing the penetration degree of microwaves in soil.
In the process of simulating the electric field law of the water-bearing soil under different microwave output powers, the soil and horn antenna are modeled first, the properties of the external area of the model are set, and the model materials are set. Then, the model parameters are set and meshed, and then the electric displacement field model, constitutive relationship, solver and solution method, and finally analyze and solve are set. In this process, the relevant parameters need to be set according to the test requirements so that the simulation process is as consistent as possible with the actual situation. The main steps of the simulation are shown in Figure 1.
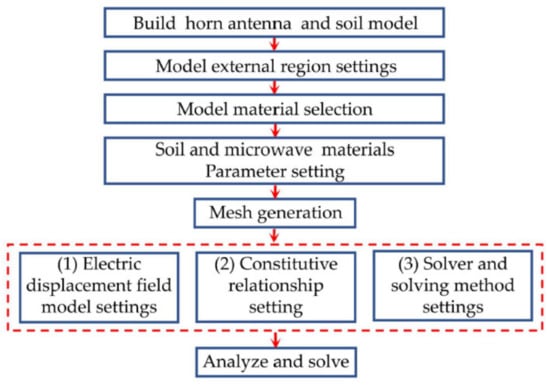
Figure 1.
Simulation flow chart.
The horn antenna shape and aperture size are important factors influencing electromagnetic waves [16], but based on the research content of this article, only a standard aperture (130 × 43 mm) horn antenna is selected as the prototype for model construction [17]. Moreover, the size of the soil model is set to 30 × 30 × 20 cm, and the outer area of the soil model is defined as a perfectly matching layer (PML). The purpose is to simulate an infinite distance. The electric displacement field model relies on the dielectric loss, and the corresponding expression is:
In the above equation: εr—Dielectric loss
ε′—Dielectric constant
ε″—Dielectric loss factor and
j—
The relative permeability is selected to obtain the following constitutive relationship:
In the above equation:
B—Magnetic induction
μ0—Permeability under vacuum
μr—Relative permeability and
H—Magnetic field strength (Weber/m)
Table 1 and Table 2 provide the main parameter settings in the simulation process. Table 2 lists the real and imaginary parts of the dielectric loss of different water-containing soils at a frequency of 2.45 GHz, which are also important parameters determining the accuracy of the simulation results [18]. The ideal meshing approach should provide a high resolution to achieve the required accuracy and should exhibit a high quality and low computational cost, but these requirements often conflict. Regarding simple models, automatic meshing with software is generally implemented. In addition, different physics schemes and solvers have distinct requirements for mesh quality. In this simulation, full coupling in the steady-state solver is selected to linearly solve the simulation problem. A small number of mesh elements with a quality lower than 0.01 among noncritical parts does not affect the convergence process of the entire model. Figure 2 shows the grid division of the horn antenna-soil model.

Table 1.
Specific parameter settings in the simulation process.
Table 2.
Parameter settings of the real (Re (eps)) part and imaginary part Im (eps) of the soil dielectric constant during the simulation.
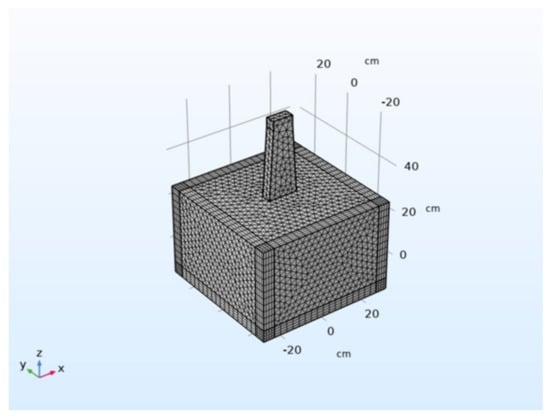
Figure 2.
Meshing of the model.
2.2. Design Microwave Treatment Experiment Bench
In terms of microwave soil disinfection experiments, most studies on the inactivation of soil pathogens, nematodes, grass seeds, etc., are carried out with a microwave oven as the main experimental equipment [19,20,21]. However, in actual production, it is obviously impractical to perform microwave soil treatment in the field with a closed cavity. Microwave soil treatment experiments with a cavity require perfect microwave reflection [16], and the wave guide directly affects the soil surface. There is a large difference in approaches [3,22,23]. Therefore, in the exploration experiment of the soil temperature pattern after microwave treatment, to ensure that the experimental microwave soil disinfection method is consistent with the field method involving microwave operation equipment, an open microwave generation experiment bench is designed in this paper. Microwaves directly impact the test soil through the horn antenna, and the function of the horn antenna is equivalent to that of a single microwave generating unit among field microwave soil disinfection equipment.
The experimental bench for microwave soil treatment mainly comprises a horn antenna (300 × 125 × 45 mm, MEGMEET Electric Co., Ltd., Shenzhen, China), power indicator (D69-2049, Elecall Electric Co., Ltd., Shenzhen, China), microwave controller (WepeX-C1, MEGMEET Electric Co., Ltd., Shenzhen, China), magnetron (2M362, LG, Seoul, Korea), microwave variable-frequency power supply (WepeX-C1, MEGMEET Electric Co., Ltd., Shenzhen, China), and lifting platform (300 × 300 mm, Weihai Jidao Hardware Tools Co., Ltd., Weihai, China). As shown in Figure 3, in the experiment, the microwave output power is adjusted with the microwave controller. The value displayed on the power indicator represents the output power of the microwave variable-frequency power supply, and the value displayed on the controller panel represents the actual microwave output power. The actual microwave output power is 0.6 times the rated power.
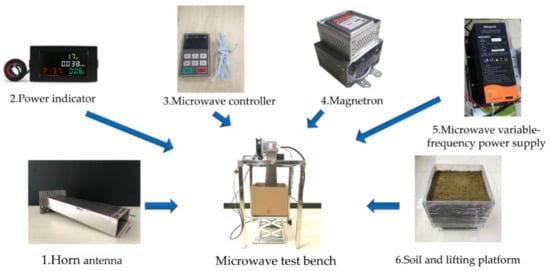
Figure 3.
Microwave experiment bench composition.
In the experiment, the soil surface temperature was measured with an infrared thermal imager, as shown in Figure 4 (Testo 865, Testo AG, Germany). A thermal sensitivity of ≤0.12 °C can achieve a 320 × 240-pixel infrared resolution. After temperature information acquisition, the data are stored as infrared images, and temperature information can be obtained after processing in Testo IR Soft software. The internal soil temperature was acquired with a high-precision PT100 thermocouple sensor (Figure 5), with a response time of 0.5 s and a measurement error range of 0.3 ± 0.005 T (T denotes the temperature value). Thirty probes containing PT100 thermocouple sensors were affixed on an aluminum plate in 5 rows and 6 columns. Each probe was 30 cm long and marked with a scale on the surface, with a diameter of 6 mm. Moreover, the tip is cone-shaped and easily inserted into the soil. The probe spacing is 40 mm, and the purpose is to avoid heat absorption by the sensor probe, which could affect the experimental results when collecting multipoint soil temperature data. The signal measured by the sensor is collected by a data acquisition card and transmitted to a computer via a 485-to-USB interface. The acquired temperature information is stored as a table in Smacq M Console V0.6 software (Beijing, China).
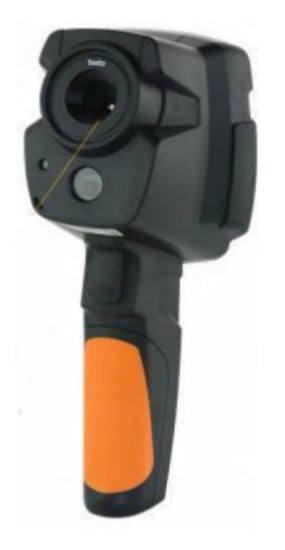
Figure 4.
Testo 865 thermal imager.
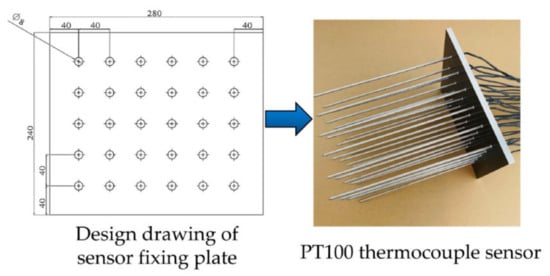
Figure 5.
PT100 thermocouple sensor.
2.3. Experimental Method
The experimental soil was acquired from the National Experimentation for Precision Agriculture base, located at 40°10′31″~40°11′18″ N, 116°26′10″~116°27′05″ E. The experimental soil was passed through a 2-mm sieve and placed in a drying box at 105 °C for 24 h before use. In this paper, the soil moisture content is determined on a wet basis, which is (mwater/msoil + mwater) × 100% [24].
After soil moisture content adjustment, the test soil was placed in an acrylic box with dimensions of 30 × 30 × 25 cm. Acrylic is a nonpolar material, so microwaves do not affect the experimental results due to the material of the soil tank during the experiment. The acrylic box containing soil was placed directly under the horn antenna. In the experiment, the distance between the horn antenna and the soil surface was adjusted to 5 cm by controlling the lifting platform [25]. Microwave output power levels of 2, 1.8, and 1.6 kW were selected to conduct the microwave soil treatment experiments, of which 2 kW is the maximum output power of the microwave variable-frequency power supply, as measured with a power meter. In regard to the microwave controller, the corresponding actual microwave power applied was set to 1200, 1080, or 960 W. Three microwave output power levels were considered to treat soil with a moisture content of 0%, 10%, 20%, and 30% for 10 to 60 s at 10 s intervals. The calculation of the treatment time started when the power indicator reached the required experimental value upon microwave power activation. This process generally lasted 2~3 s. Immediately after microwave treatment, an infrared thermal imaging instrument was employed to determine the soil surface temperature. During this process, the camera and soil surface occurred at an angle of 45°. After the complete soil tank surface was captured on the infrared thermal imaging instrument display, an image was recorded and stored.
The soil internal temperature was acquired with PT100 thermocouple sensors. According to the centerline mark on the acrylic box, before vertical insertion of the sensor into the soil, the centerline of the sensor aluminum plate and the long and short sides of the horn antenna were projected onto the soil surface to ensure coincidence. The purpose was to guarantee that symmetrical temperature data are obtained by the probes. According to the scale value on the metal probe, the sensor was gradually inserted into the soil for temperature acquisition. The experiment was conducted in December, and the initial soil temperature was measured before the experiment. The initial soil temperature reached 17.2 °C. An experimental flow chart of soil temperature distribution measurement is shown in Figure 6.
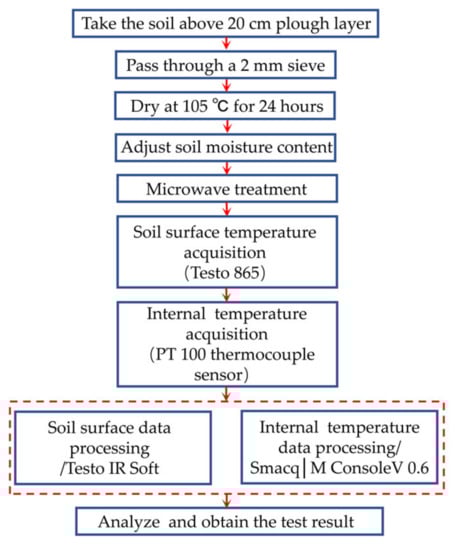
Figure 6.
Flowchart of the exploration experiment on the temperature distribution in microwave-treated soil.
During the experiment, the operator adopted relevant protective measures, and the magnetron was covered with a metal casing. Otherwise, strong electromagnetic interference could affect the normal operation conditions of the other components and cause unnecessary harm to the operator.
3. Results and Discussion
3.1. Simulation Results of Microwave Soil Treatment
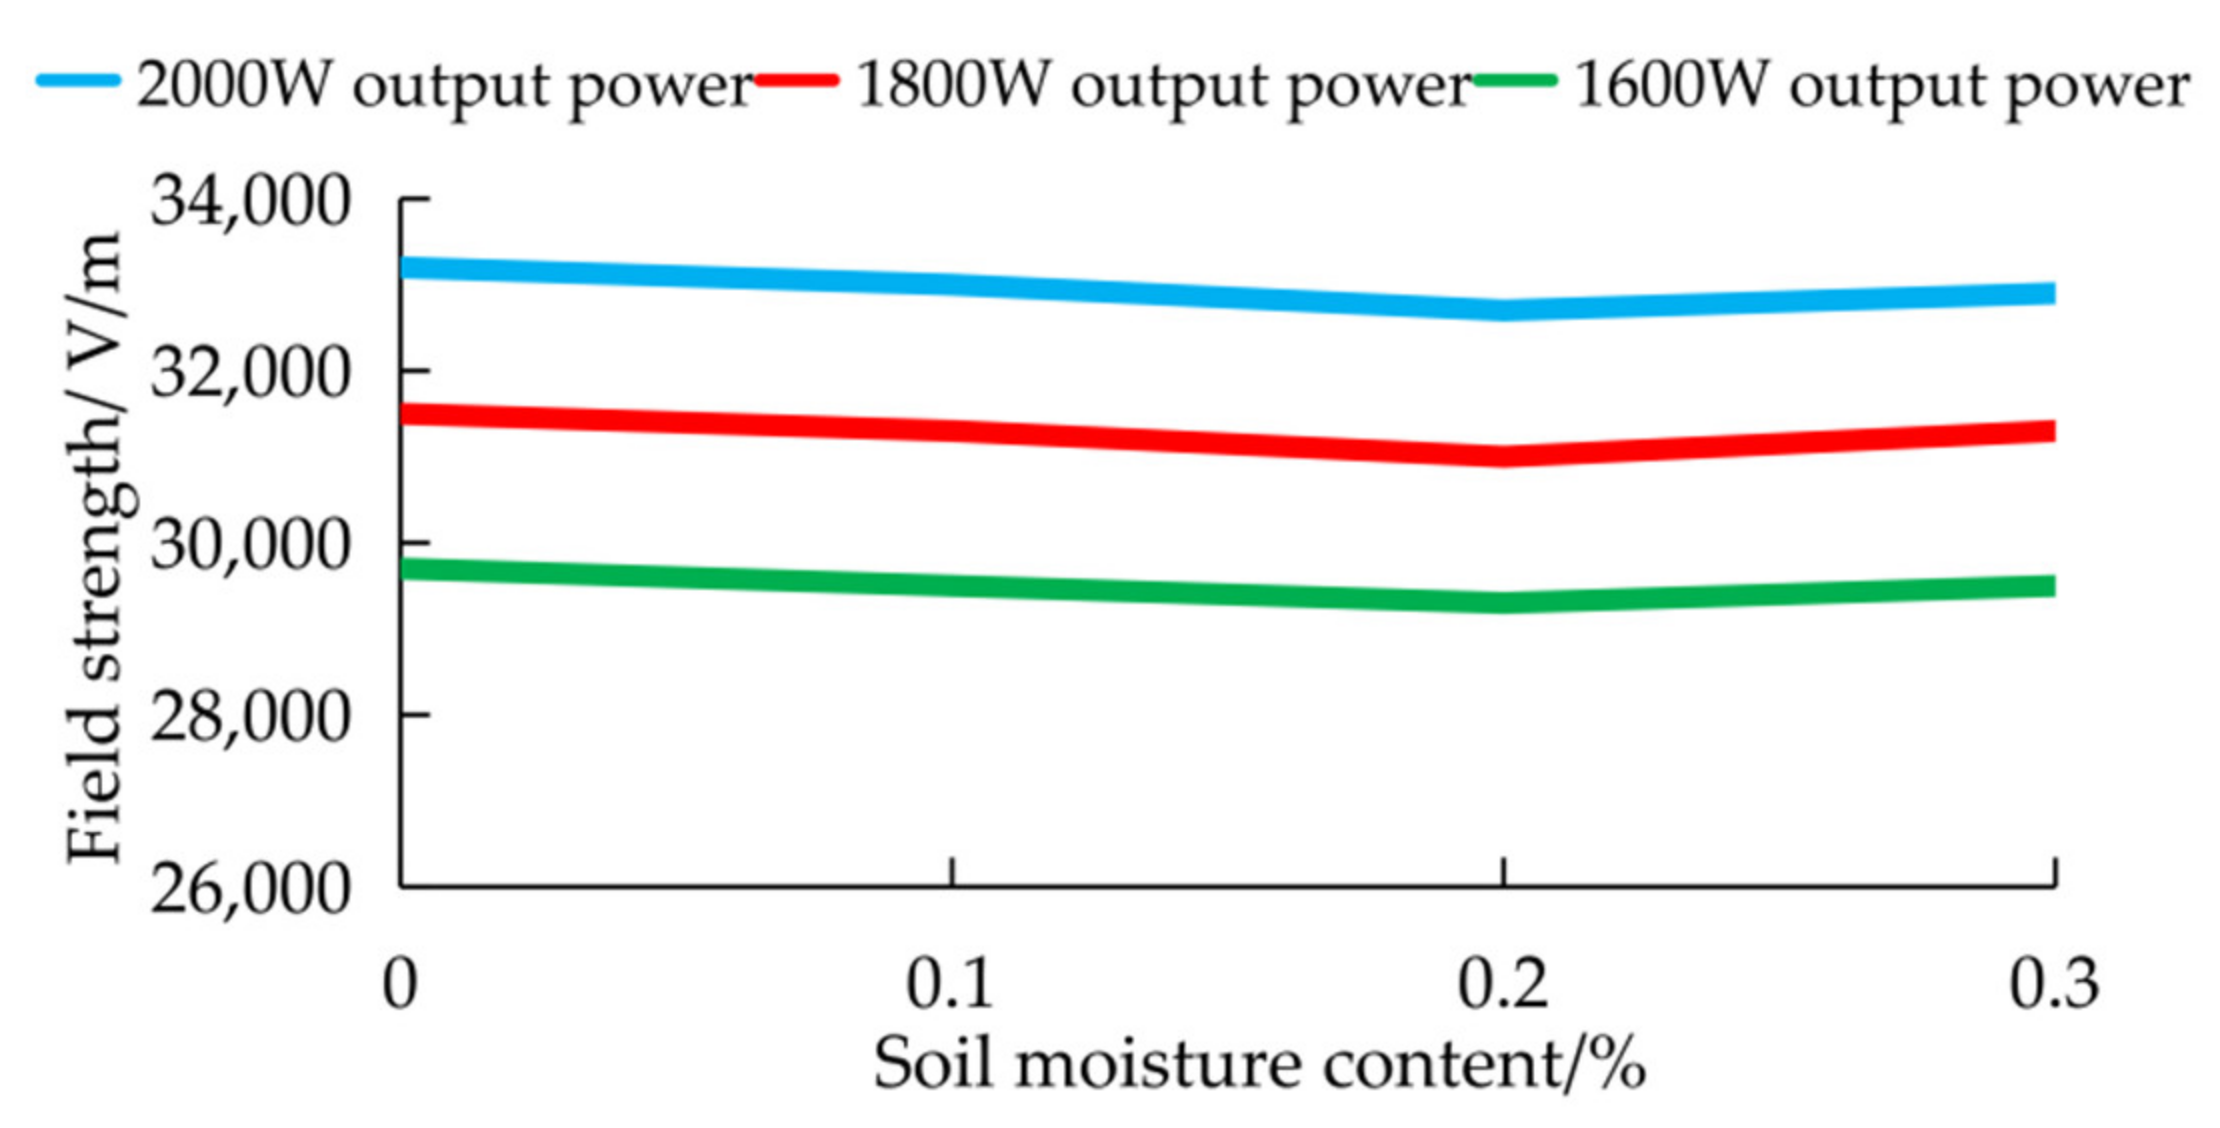
In the simulation, at microwave output power levels of 2, 1.8, and 1.6 kW, the corresponding maximum electric field value was determined, as shown in Figure 7. The electric field intensity decreased with decreasing output power, but the output power did not affect the waveform entering the water-bearing soil. After analysis of the microwaves entering the water-bearing soil, the simulation results obtained at a 2-kW microwave output power level were adopted as an example for illustration purposes.
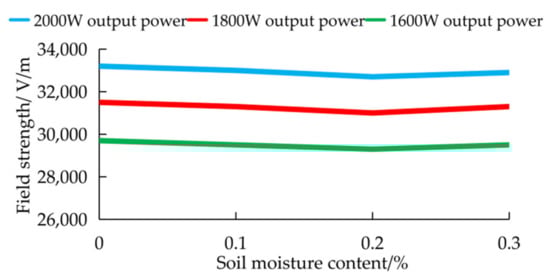
Figure 7.
Maximum field strength at the three microwave output power levels.
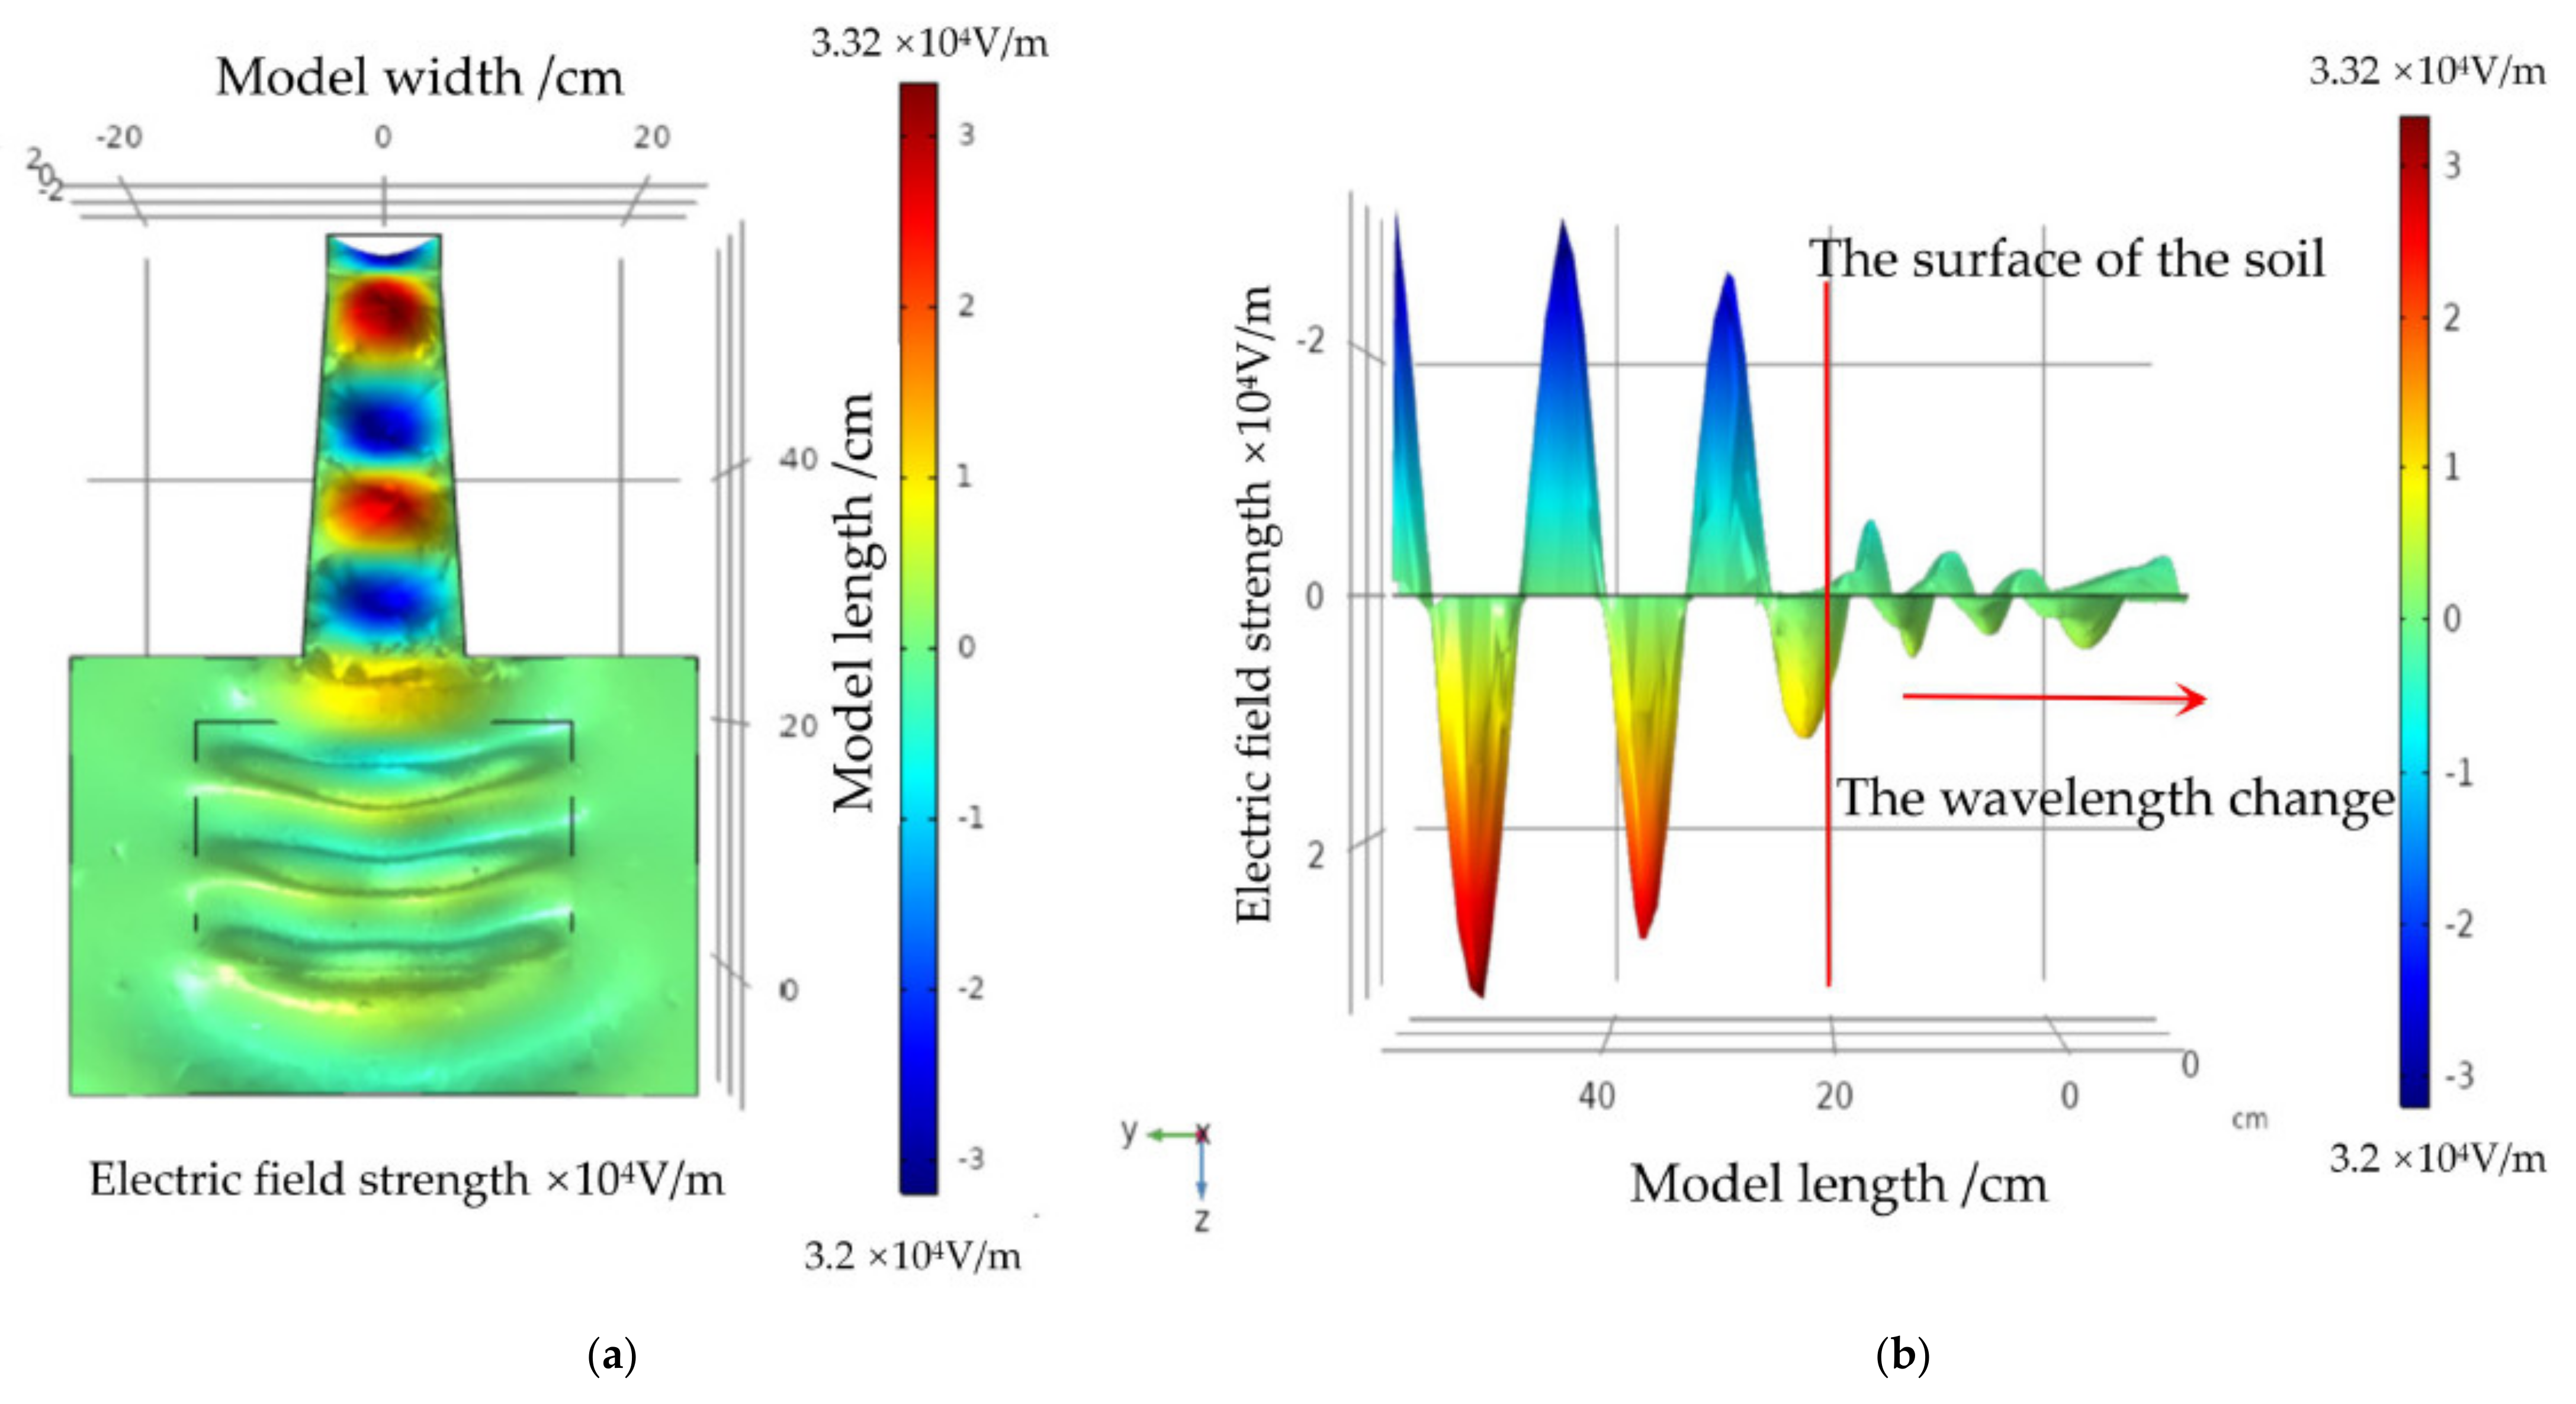
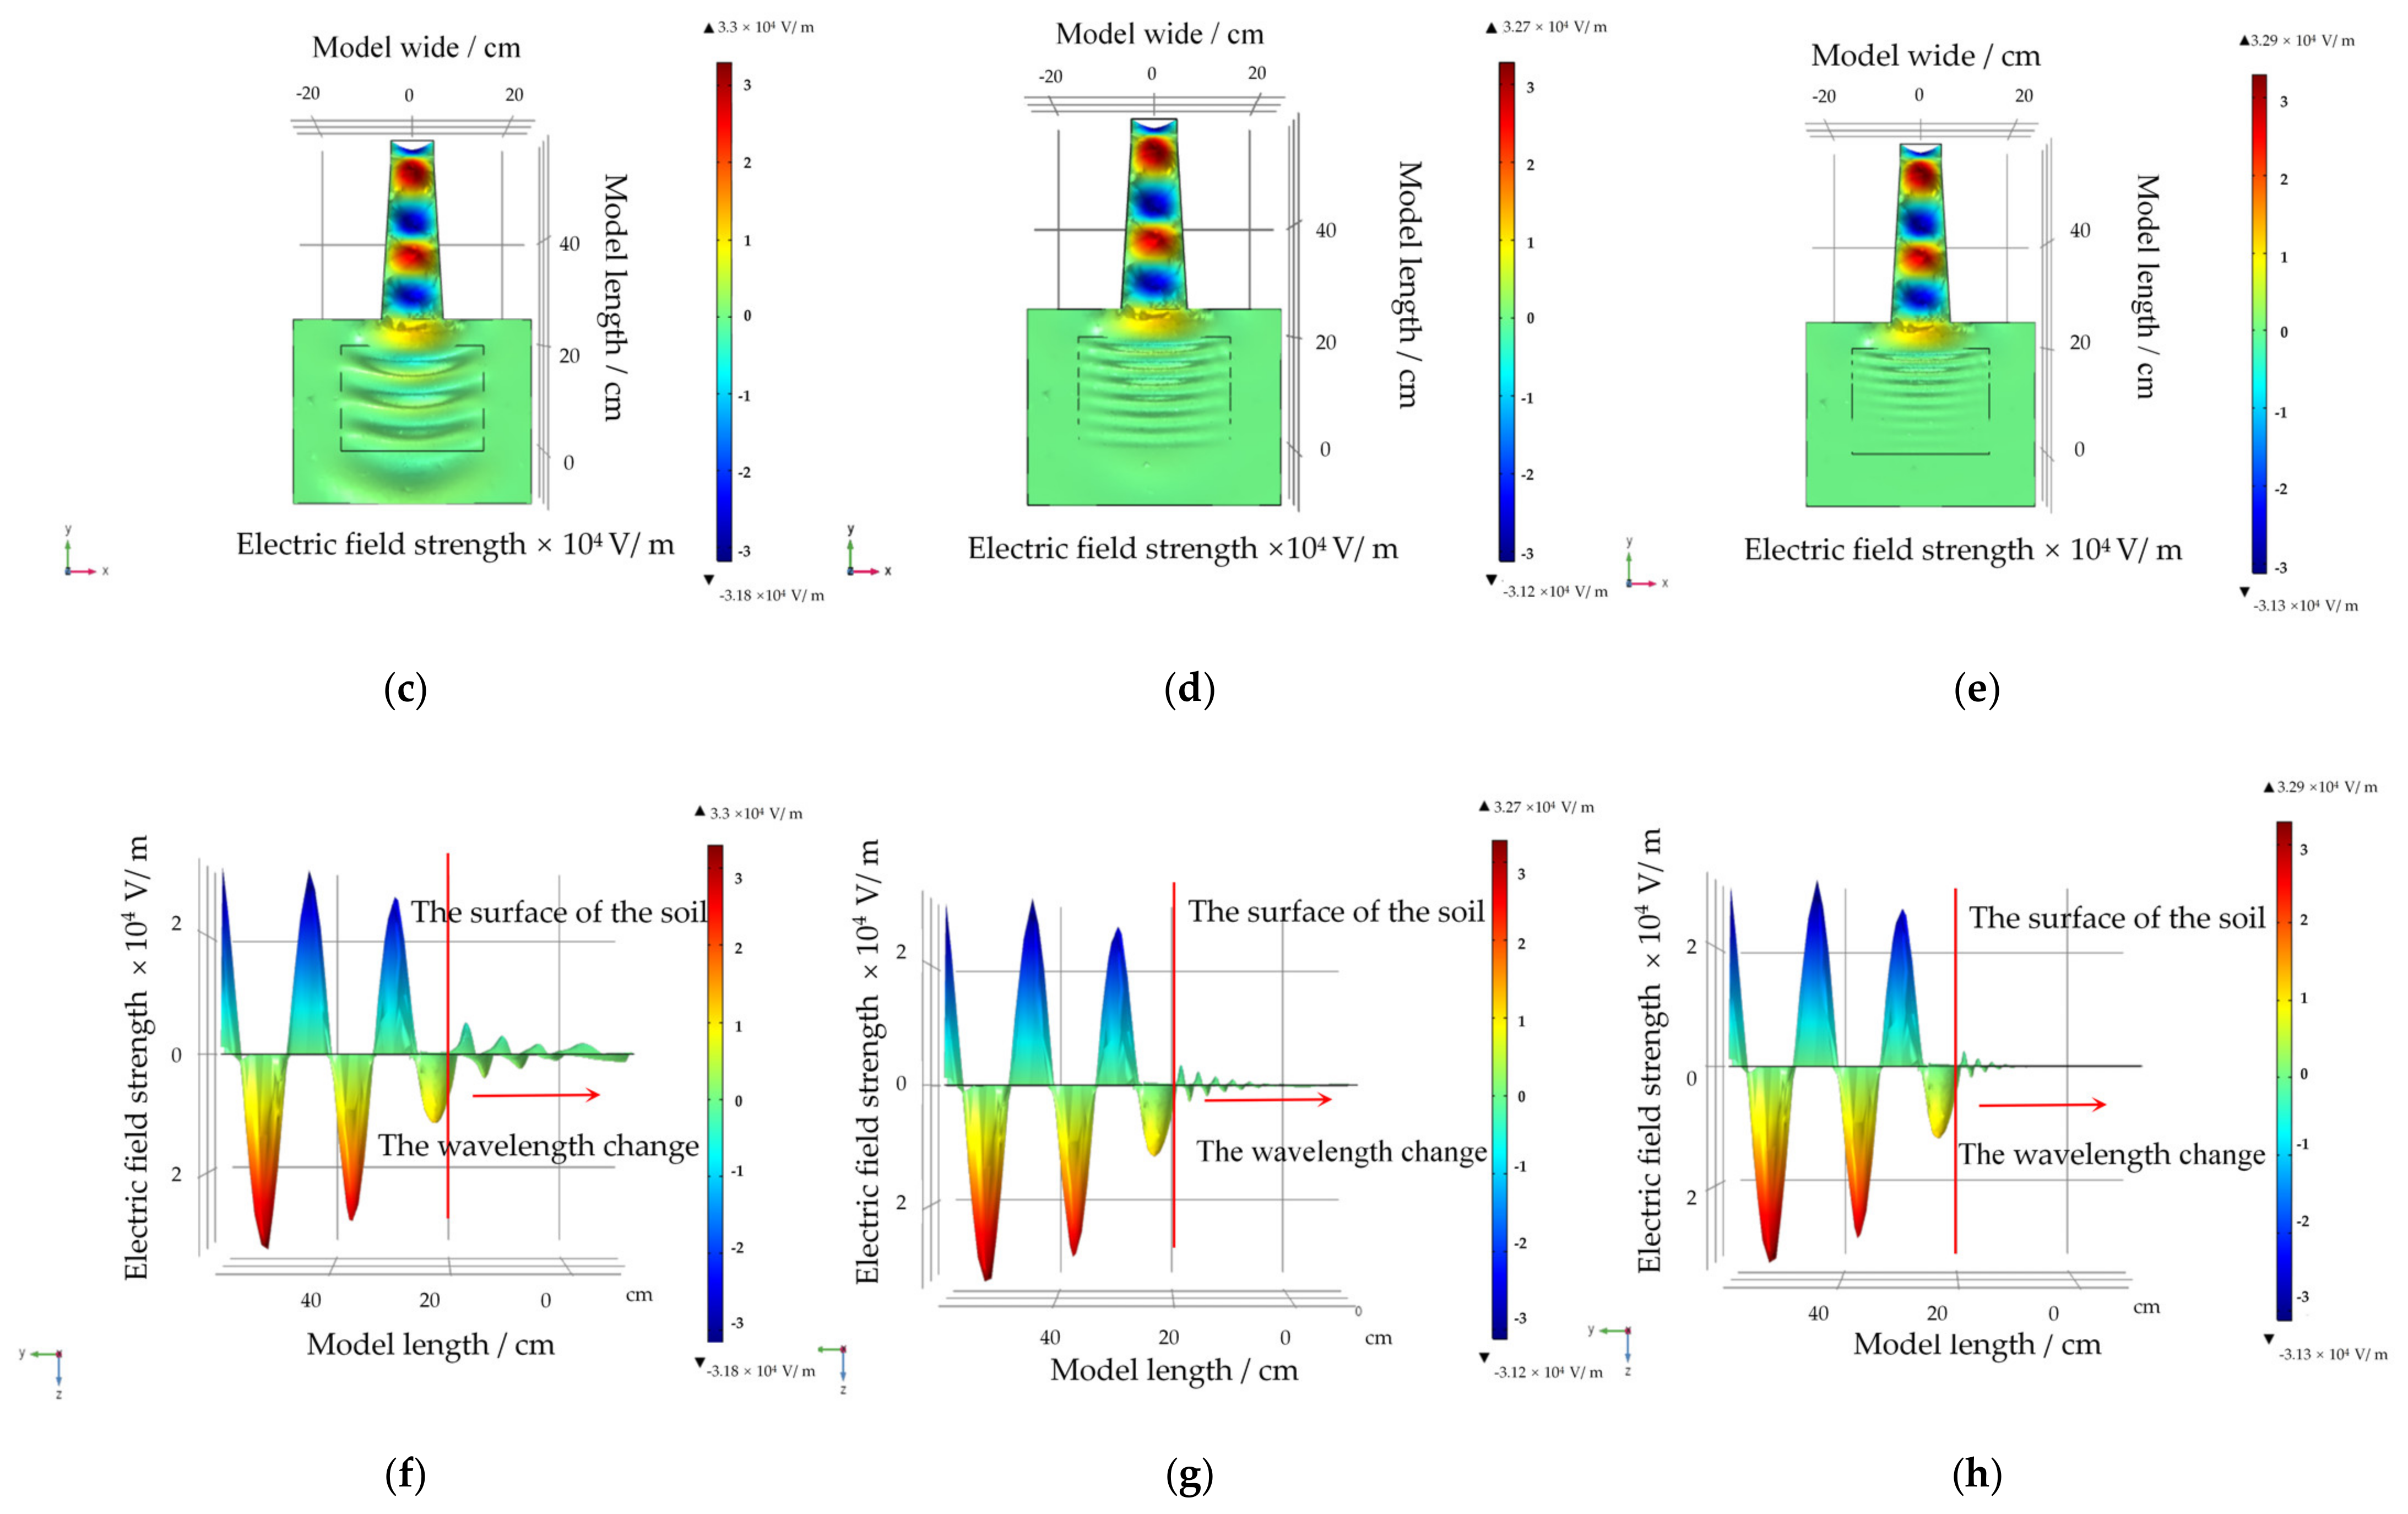
The simulation results of microwaves entering the water-bearing soil with moisture contents of 0%, 10%, 20%, and 30% are shown in Figure 8. Figure 8a,c–e show X–Y side views of the model, and Figure 8b,f–h show Y–Z model side views. Figure 8a,c–e show the waveform changes upon microwave entry into water-containing soils with different moisture contents. With increasing soil moisture content, the microwave frequency increases. The increase in free soil water causes microwave refraction, and the dielectric properties of the soil are affected by the dielectric relaxation of free water. With increasing temperature, the relaxation frequency shifts to higher values. Moreover, the wavelength decreases. Figure 8b,f–h more intuitively show the degree of penetration of microwaves into the soil under the different soil moisture contents, and the microwave penetration depth into the soil decreases with increasing water content.

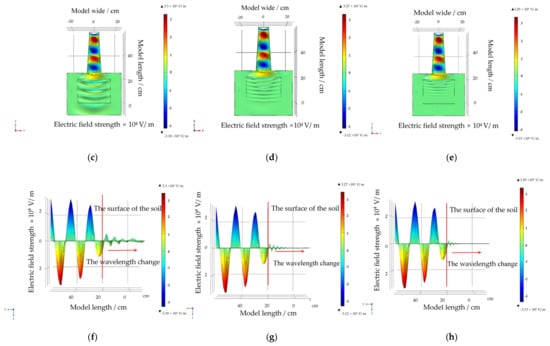
Figure 8.
Waveform change after the microwaves enter the soil. (a) X-Y view of simulation results of 0% water-containing soil. (b) Y-Z view of simulation results of 0% water-containing soil. (c) X-Y view of simulation results of 10% water-containing soil. (d) X-Y view of simulation results of 20% water-containing soil. (e) X-Y view of simulation results of 30% water-containing soil. (f) Y-Z view of simulation results of 10% water-containing soil. (g) Y-Z view of simulation results of 20% water-containing soil. (h)Y-Z view of simulation results of 30% water-containing soil.
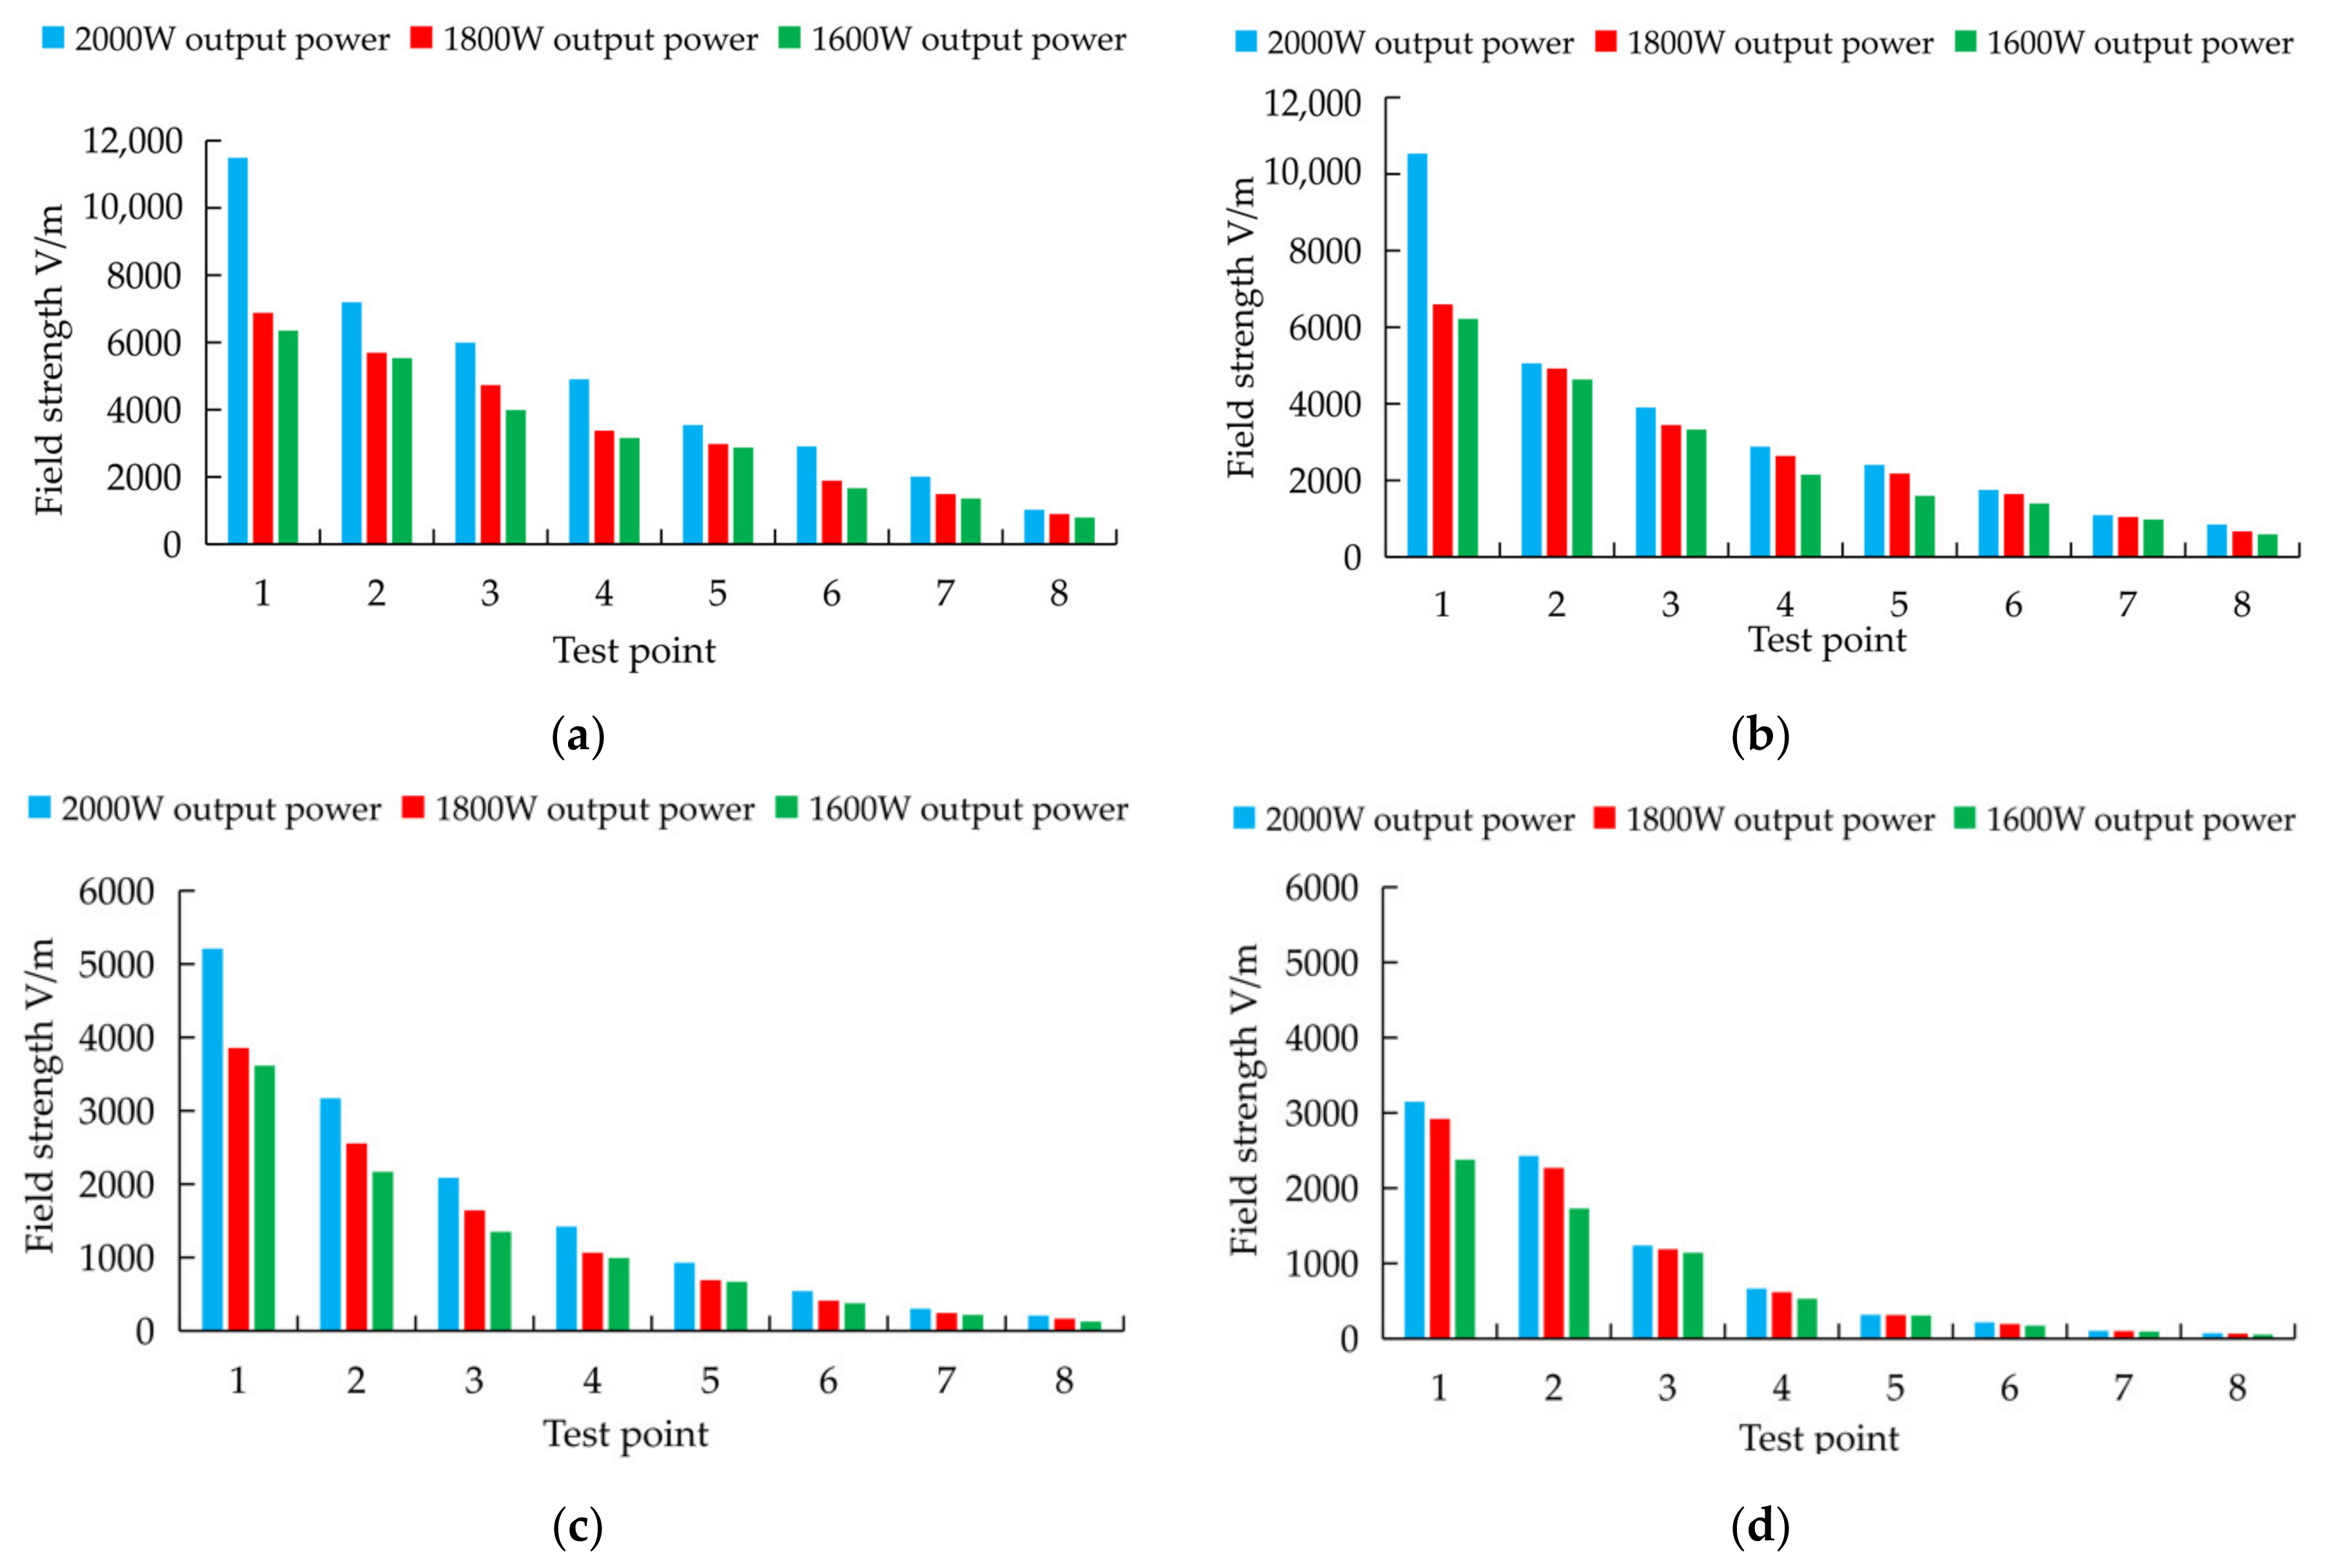
The four images shown in Figure 9 correspond to a field strength ranging from 0–30% in the water-containing soil at each output power level. Abscissas one to eight represent different positions within the soil model, namely, point one indicates the upper surface of the soil model, which is the incident surface, and point eight indicates the bottom surface of the soil model, which is the exit surface. The other points are evenly distributed along the centerline of the X–Y plane according to the soil depth. When the soil moisture content remains constant and the output power is varied, the field strength at the same location decreases with decreasing output power, but the difference is smaller than one order of magnitude. Under an output power of 2 kW acting on soil with moisture contents of 0% and 10% (Figure 9a,b, respectively), the output field strength of the soil model is two orders of magnitude lower than the incident field strength, but a high electric field value can still be maintained within the soil model. At soil moisture contents of 20% and 30% (Figure 9c), the output field strength is two orders of magnitude lower than the incident field strength, but the output field strength is much lower than that in the case with soil moisture contents of 0% and 10%. Compared to the different microwave output power levels, the soil moisture content is an important factor influencing the soil internal field strength.
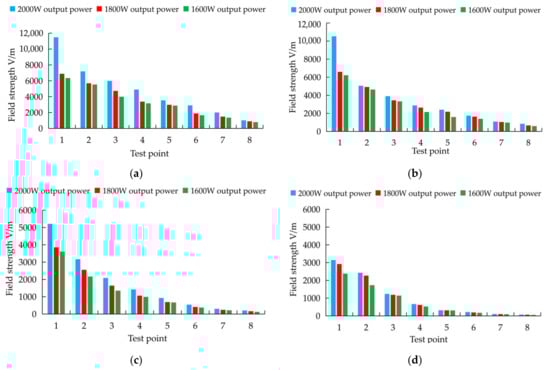
Figure 9.
Field strength at each experimental point for the different soil moisture levels: (a) field strength at 0% soil moisture; (b) field strength at 10% soil moisture; (c) field strength at 20% soil moisture; (d) field strength at 30% soil moisture.
In the process of microwave soil treatment, the electric field intensity is an important factor reflecting the energy in the soil. According to the change pattern of microwaves in the soil obtained via simulations, the temperature distribution pattern in the soil can be predicted accordingly. Since the field strength at the soil surface position is higher than that within the soil, a higher temperature value is obtained at the soil surface position than that obtained within the soil. However, the soil temperature value after microwave treatment is not determined by only the electric field intensity at a given location within the medium. The wave energy is concentrated at the peak frequency, and the corresponding field strength is the highest in the simulation process. Away from the peak frequency, the lower the energy is, the lower the corresponding field strength. Therefore, the highest temperature can be obtained near the location of the first wave peak after the microwaves enter the soil.
As indicated by the simulation results shown in Figure 8, at a low soil moisture content, the microwaves reach deeper soil layers. Moreover, the microwave frequency is low, and the wavelength is long. After the microwaves enter the soil with a low moisture content, the first wave peak is observed. Far away from the soil surface, with increasing soil moisture content, it becomes increasingly difficult for microwaves to penetrate the soil. At this time, the microwave frequency is high, and the wavelength is short. Therefore, the position of the first wave peak after microwave entry into the soil becomes increasingly closer to the soil surface, which suggests that the location of the highest temperature within the soil, upon microwave soil treatment, may increasingly approach the soil surface.
3.2. Microwave Soil Treatment Experimental Results
3.2.1. Surface Temperature Experimental Results of Microwave Soil Treatment
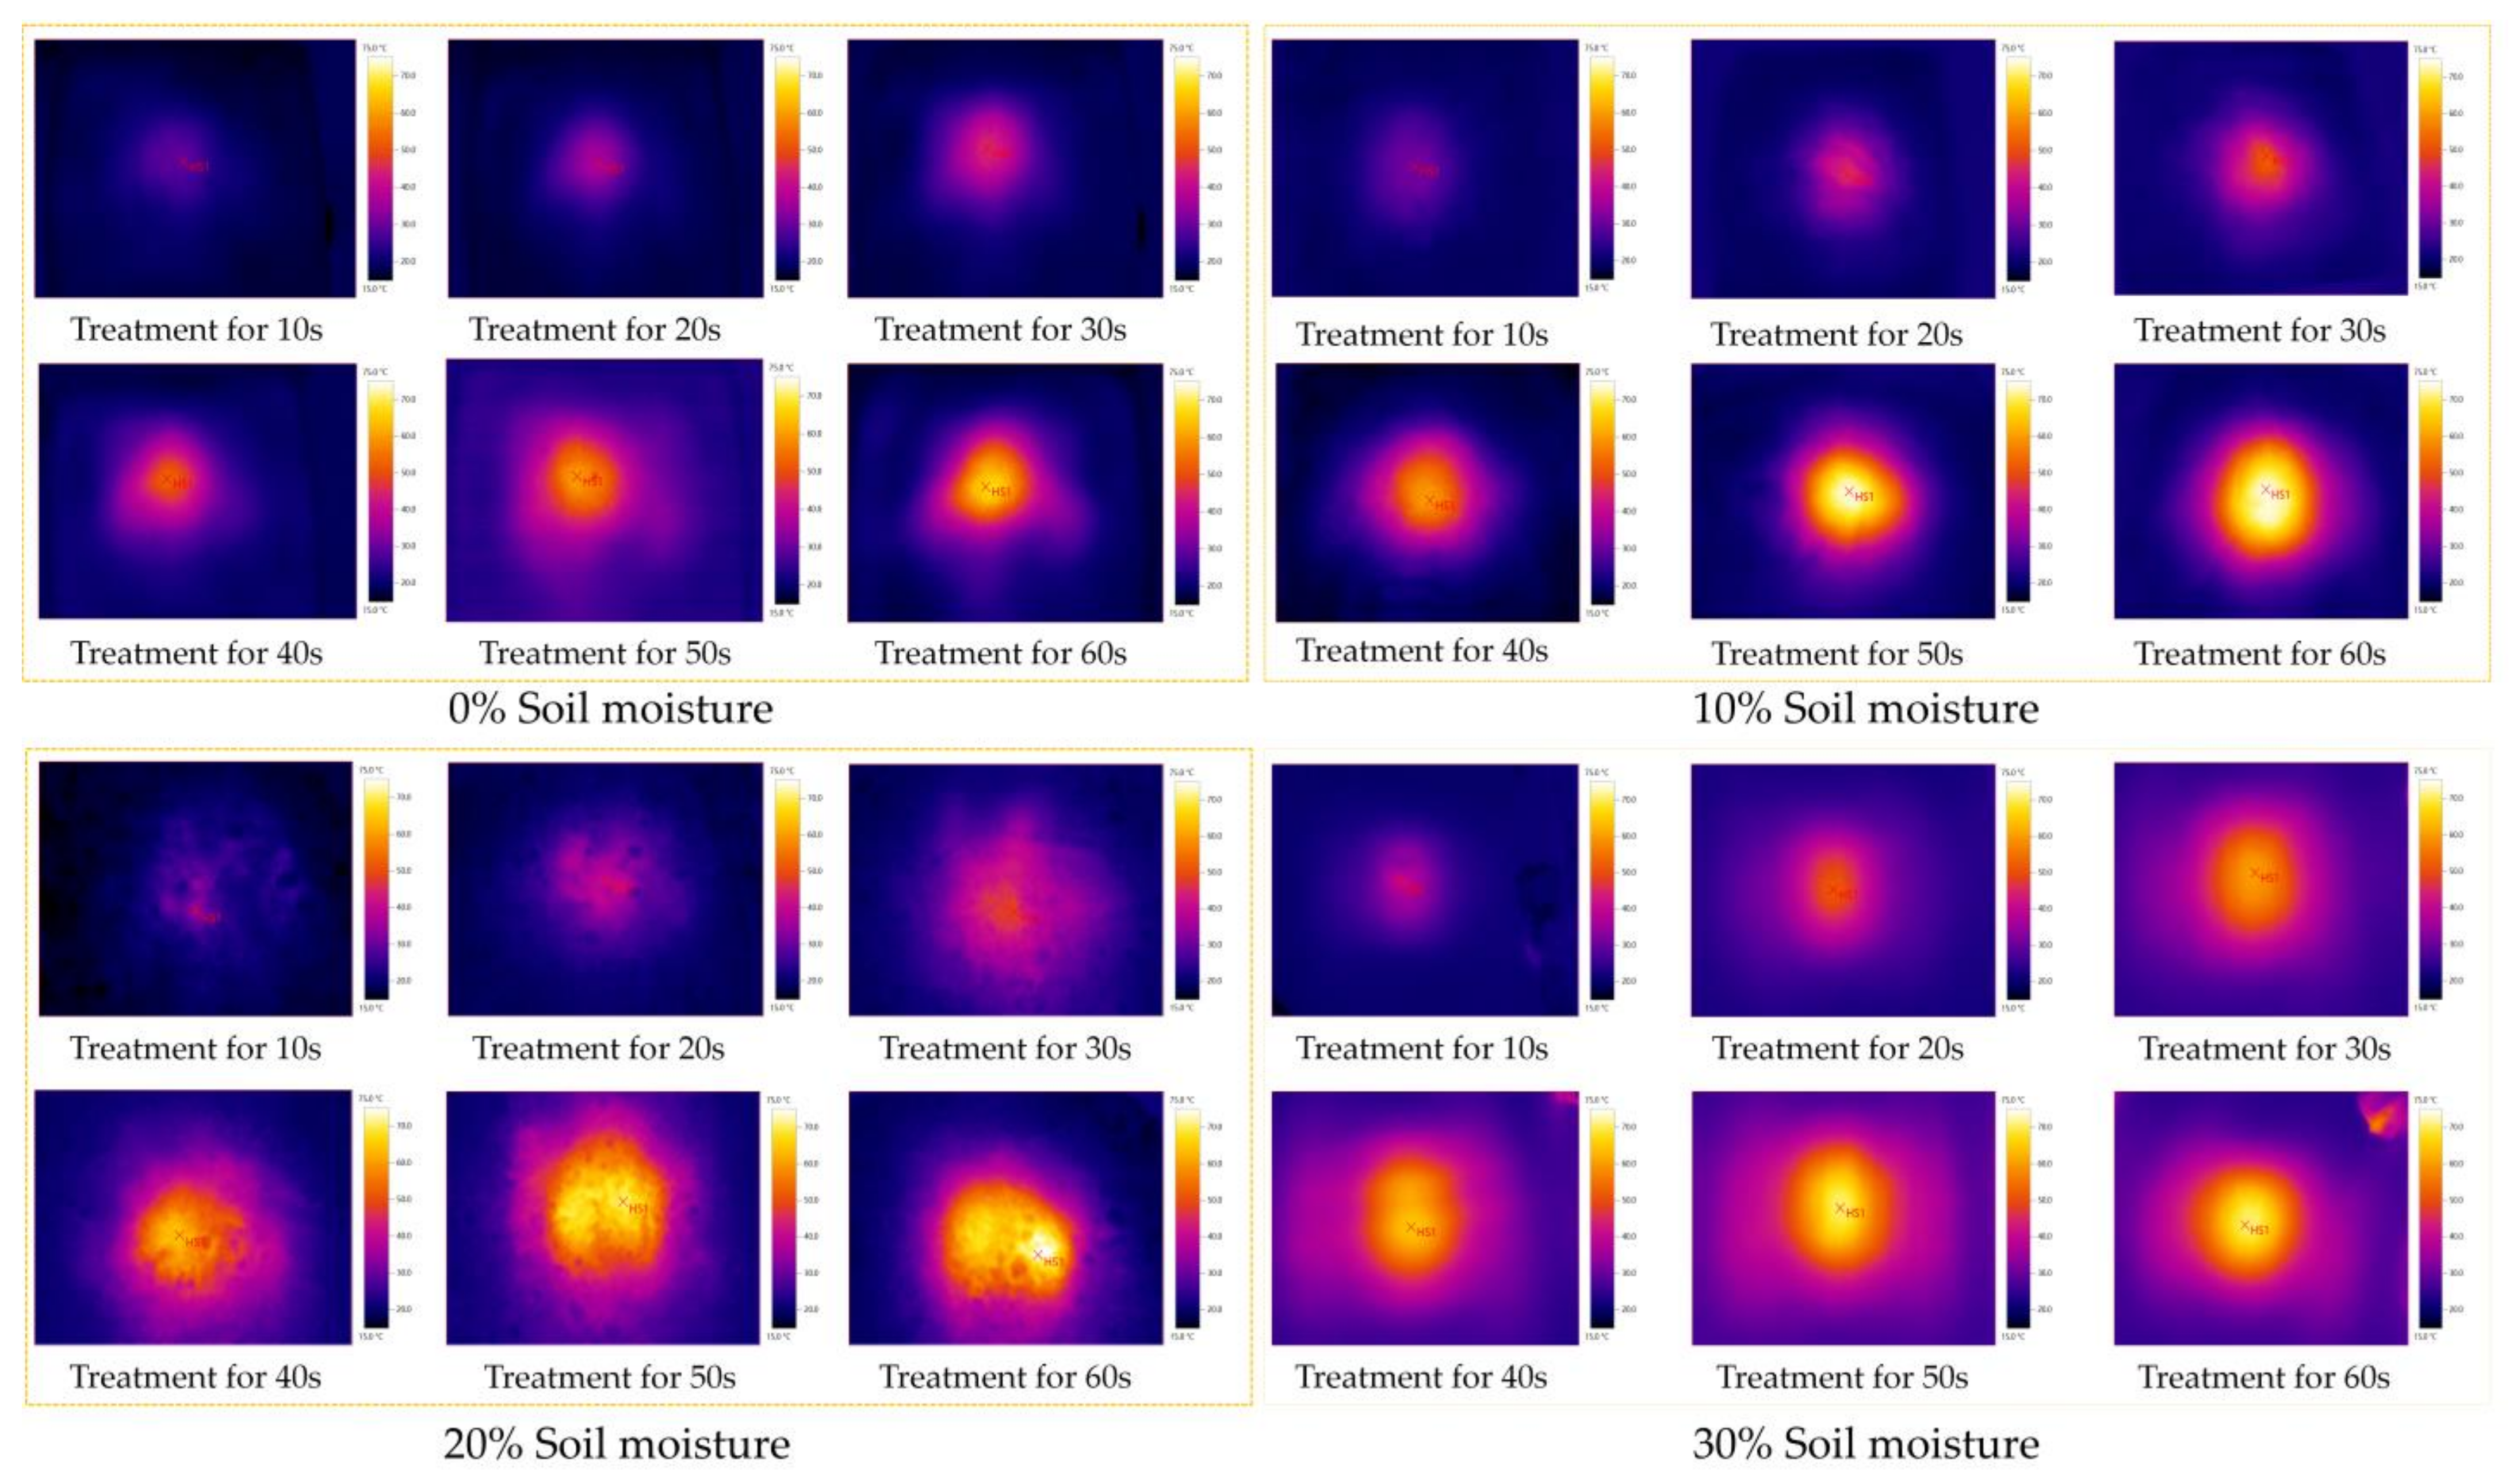
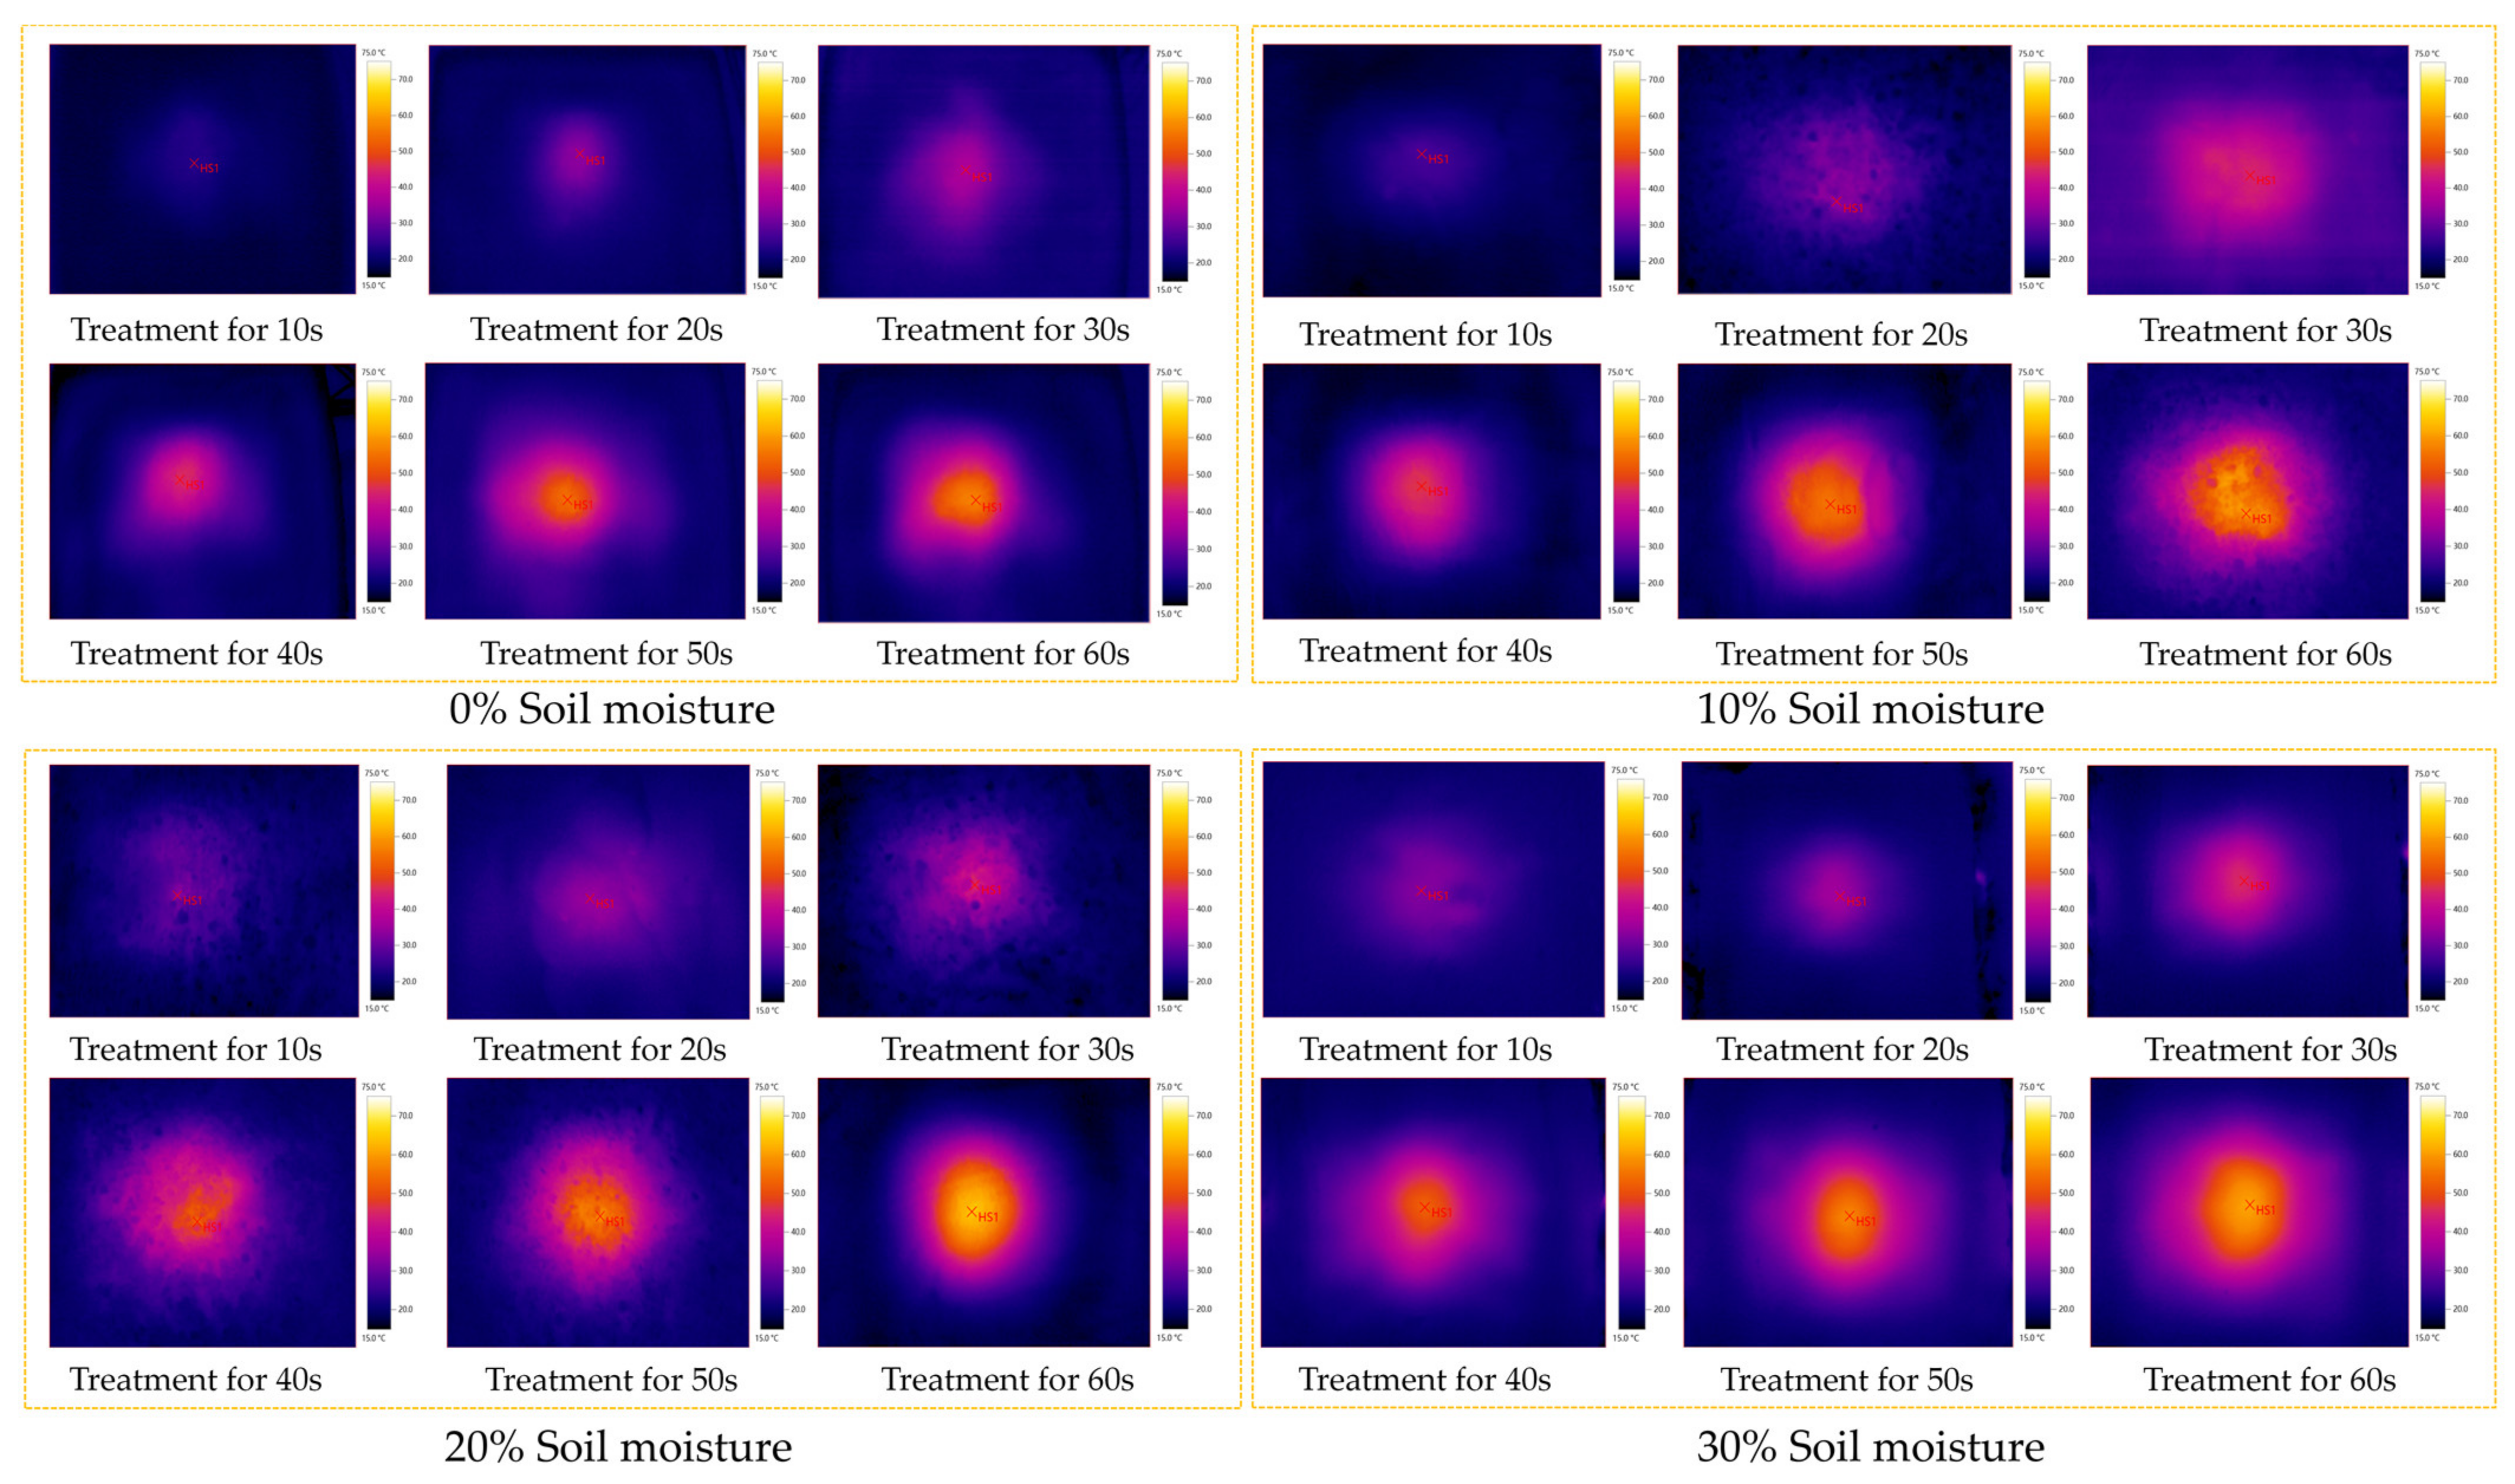
A thermal imager was employed to obtain thermal images of the soil surface after microwave treatment, as shown in Figure 10, Figure 11 and Figure 12. The soil temperature is distinguished according to the different colors of the temperature scale. The thermal imager captured soil surface temperature images at microwave output power levels of 2, 1.8, and 1.6 kW. Areas with a higher soil surface temperature appeared as circles in the thermal images, and the diameter was equivalent to the long side of the horn antenna. The highest temperature generally occurred near the centerline of the horn antenna. With increasing treatment time and microwave output power, the soil surface temperature increased, and the bright orange circular area in the image further expanded.
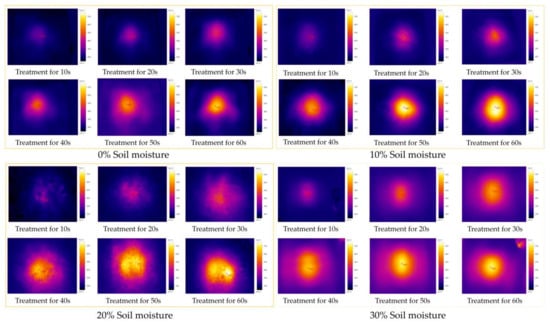
Figure 10.
Thermal images of the soil surface under 2 kW microwave output power.
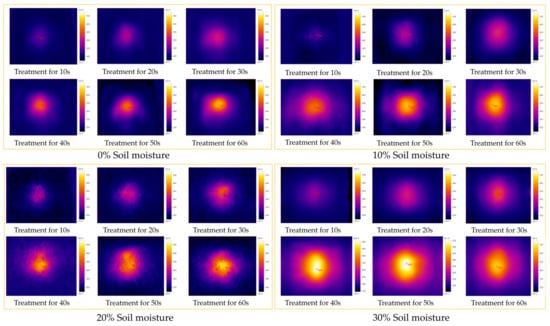
Figure 11.
Thermal images of the soil surface at a microwave output power level of 1.8 kW.
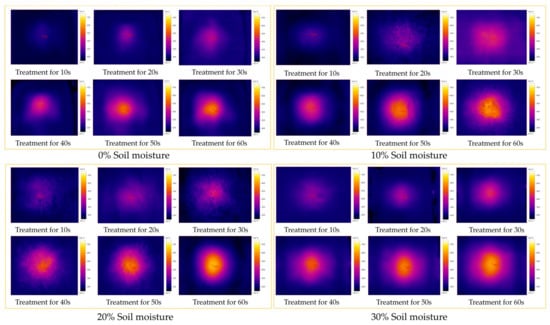
Figure 12.
Thermal images of the soil surface at a microwave output power level of 1.6 kW.
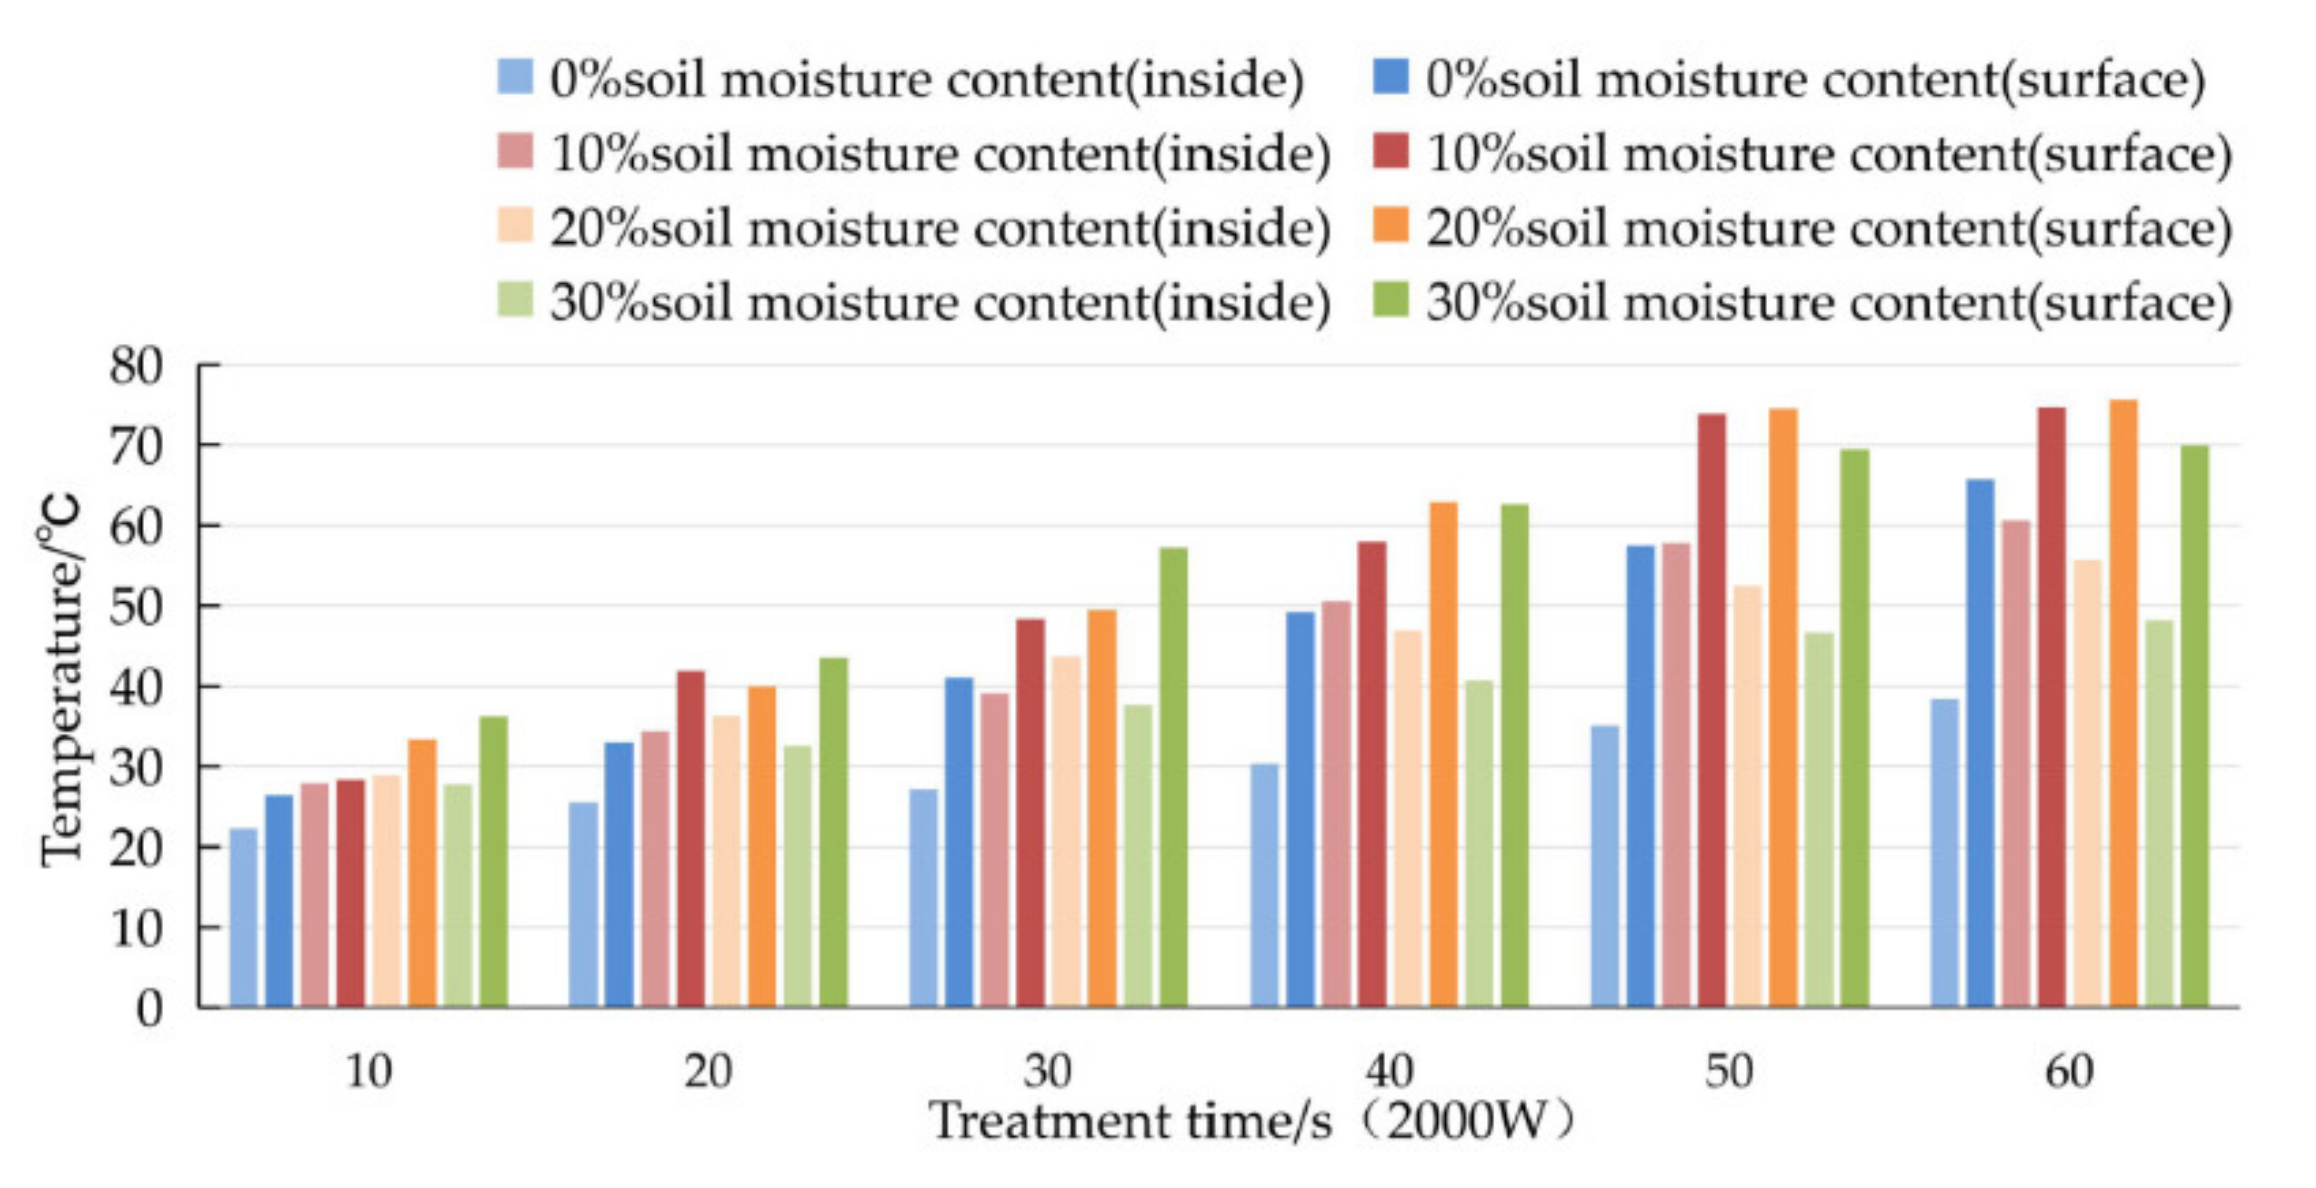
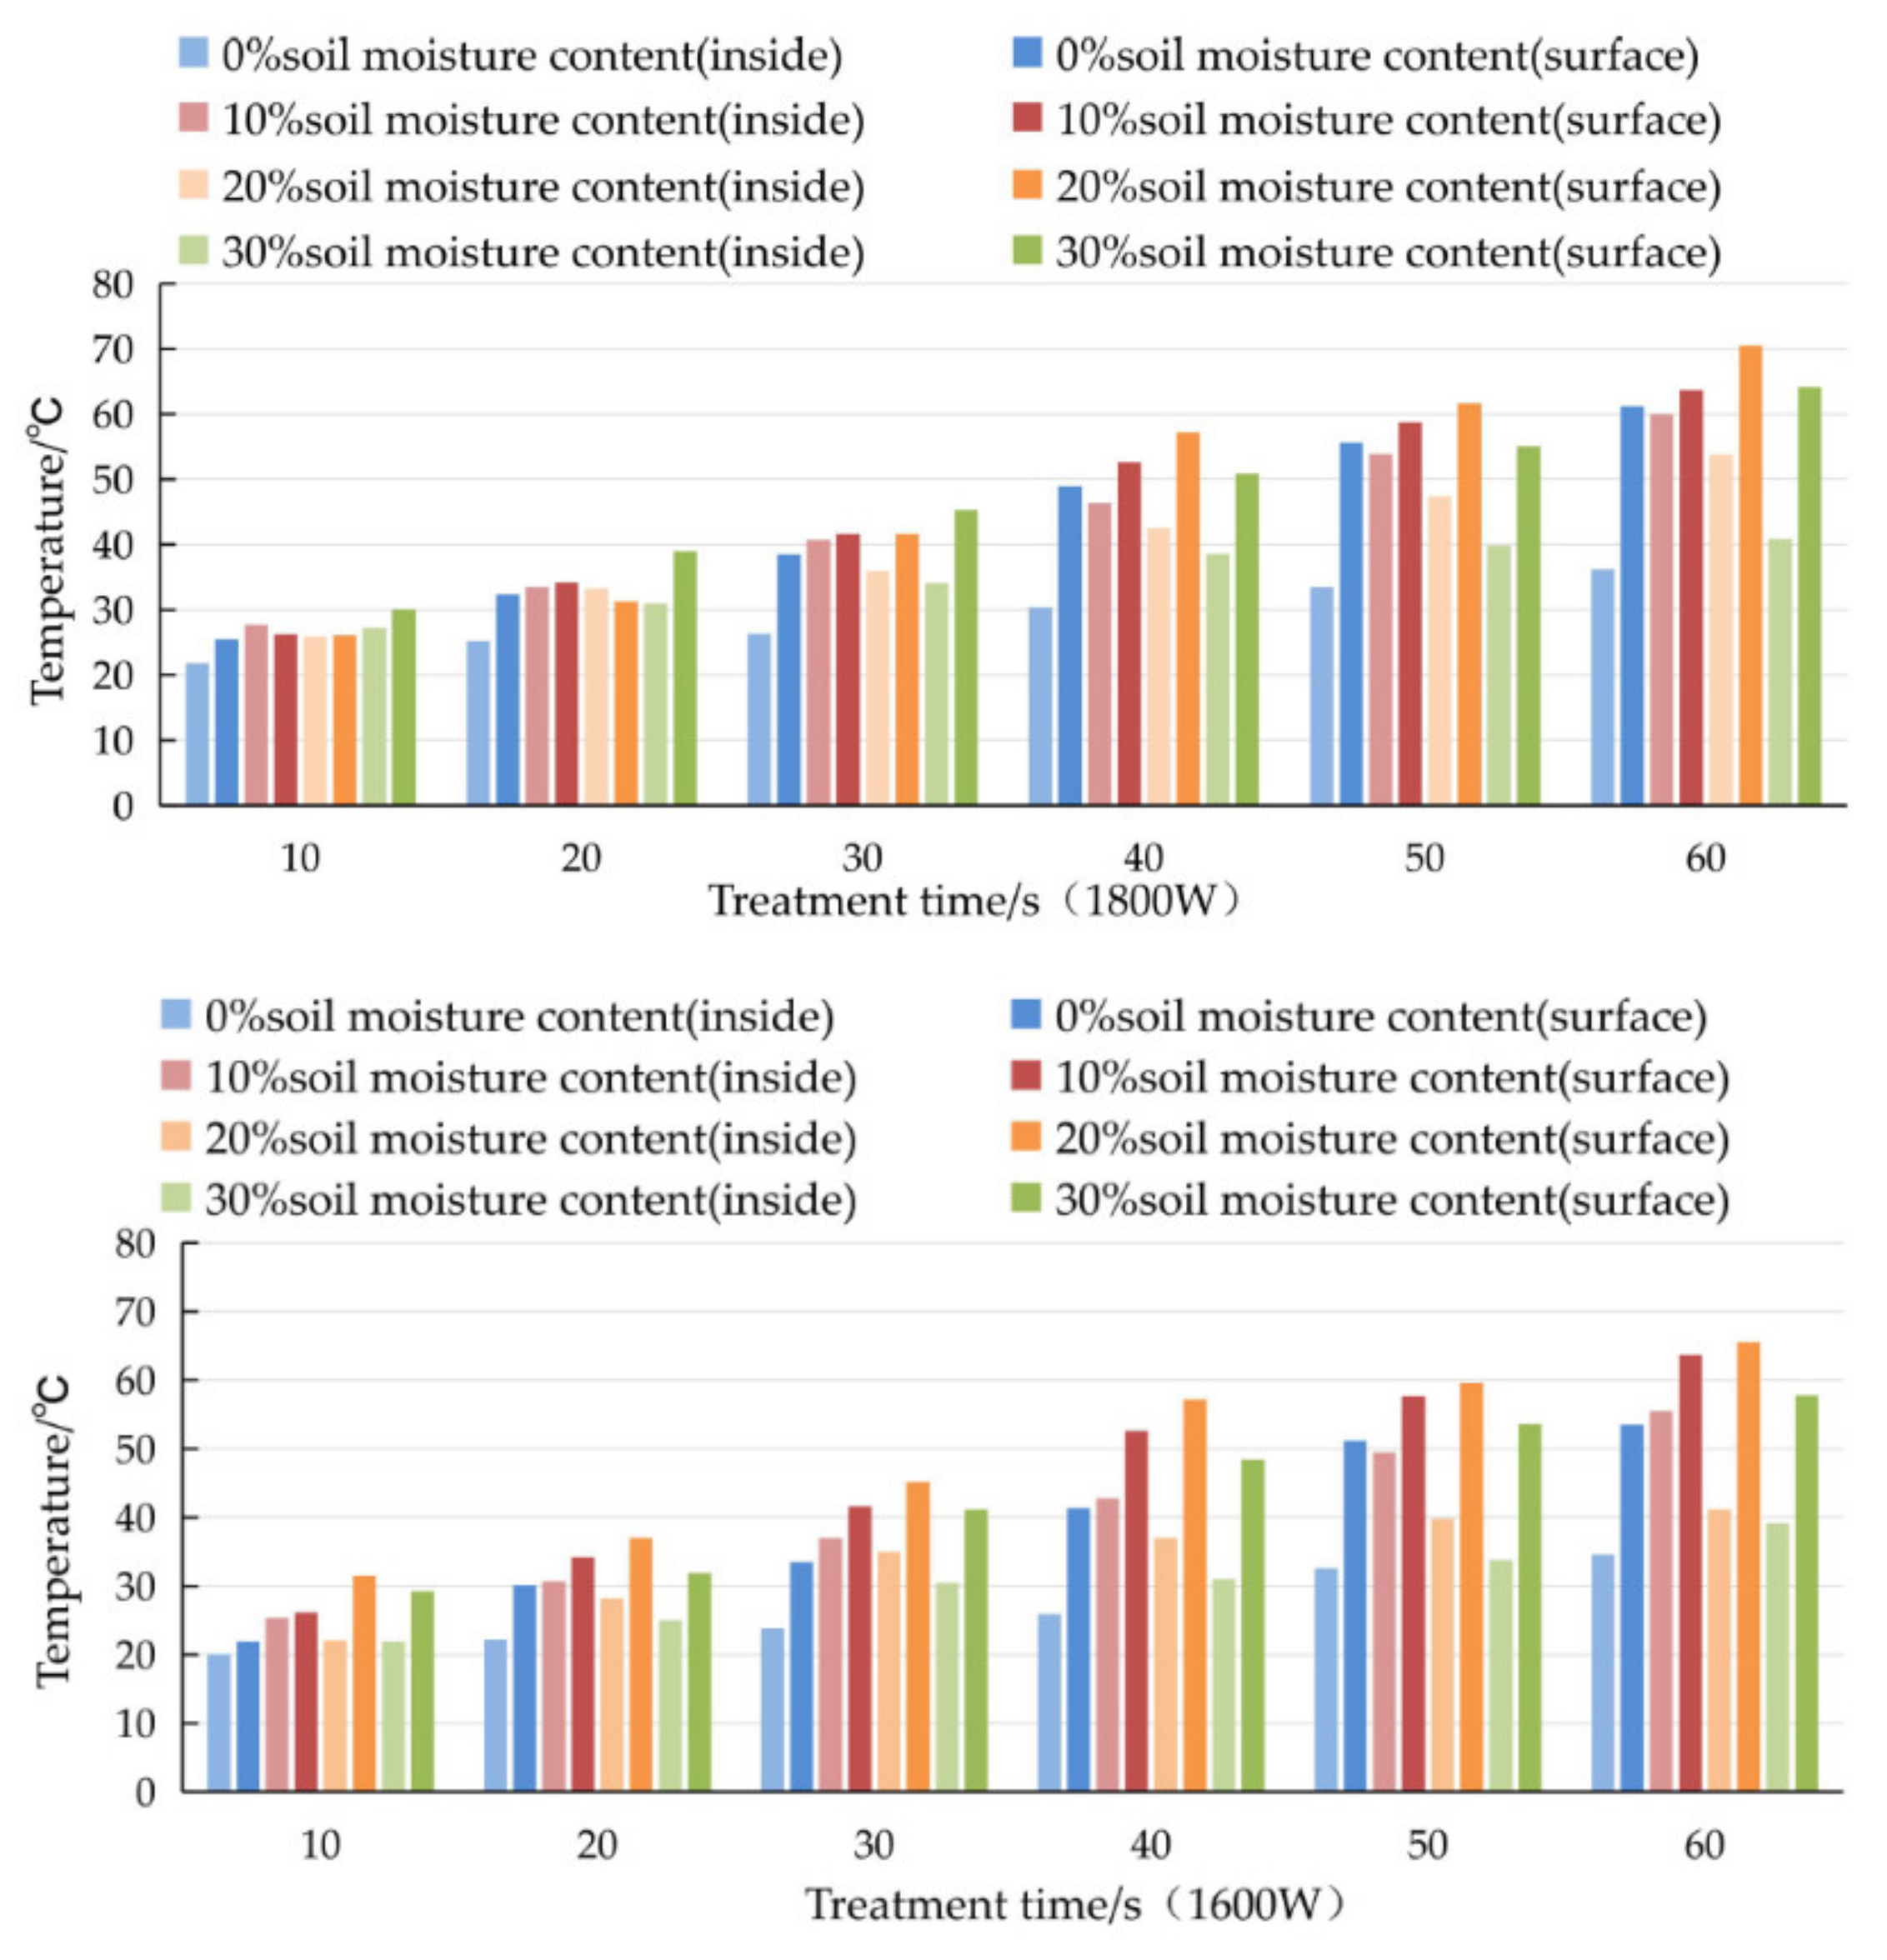
The relationship between the soil surface temperature and treatment time at the three microwave output power levels is shown in Figure 13, Figure 14 and Figure 15. When the same water-containing soil is treated with microwaves for different times, the maximum period of soil surface temperature rise lasts 30~40 s and 40~50 s. At a soil moisture content of 20%, the 60 s microwave treatment yields the highest soil surface temperature among the three microwave output power levels. When the output power reaches 2 kW, the highest soil surface temperature is 75.6 °C, and when the output power is 1.8 kW, the highest soil surface temperature reaches 70.5 °C. The highest soil surface temperature reaches 59.5 °C when the output power is 1.6 kW.
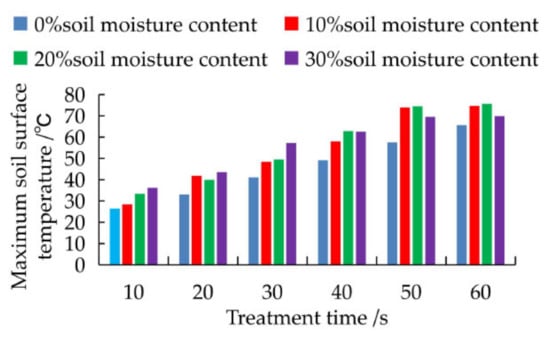
Figure 13.
Soil surface temperature under 2 kW microwave output power.
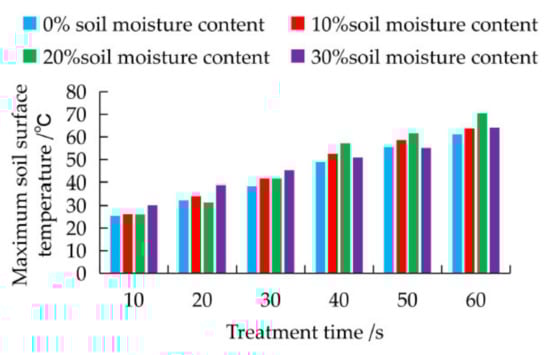
Figure 14.
Soil surface temperature under 1.8 kW microwave output power.
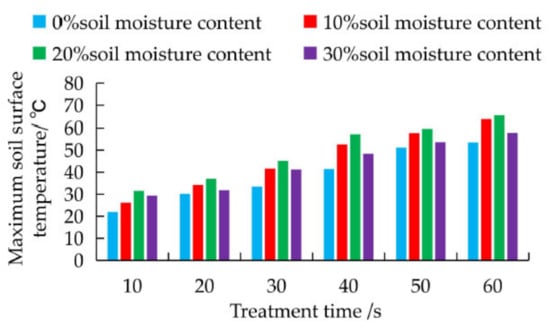
Figure 15.
Soil surface temperature under 1.6 kW microwave output power.
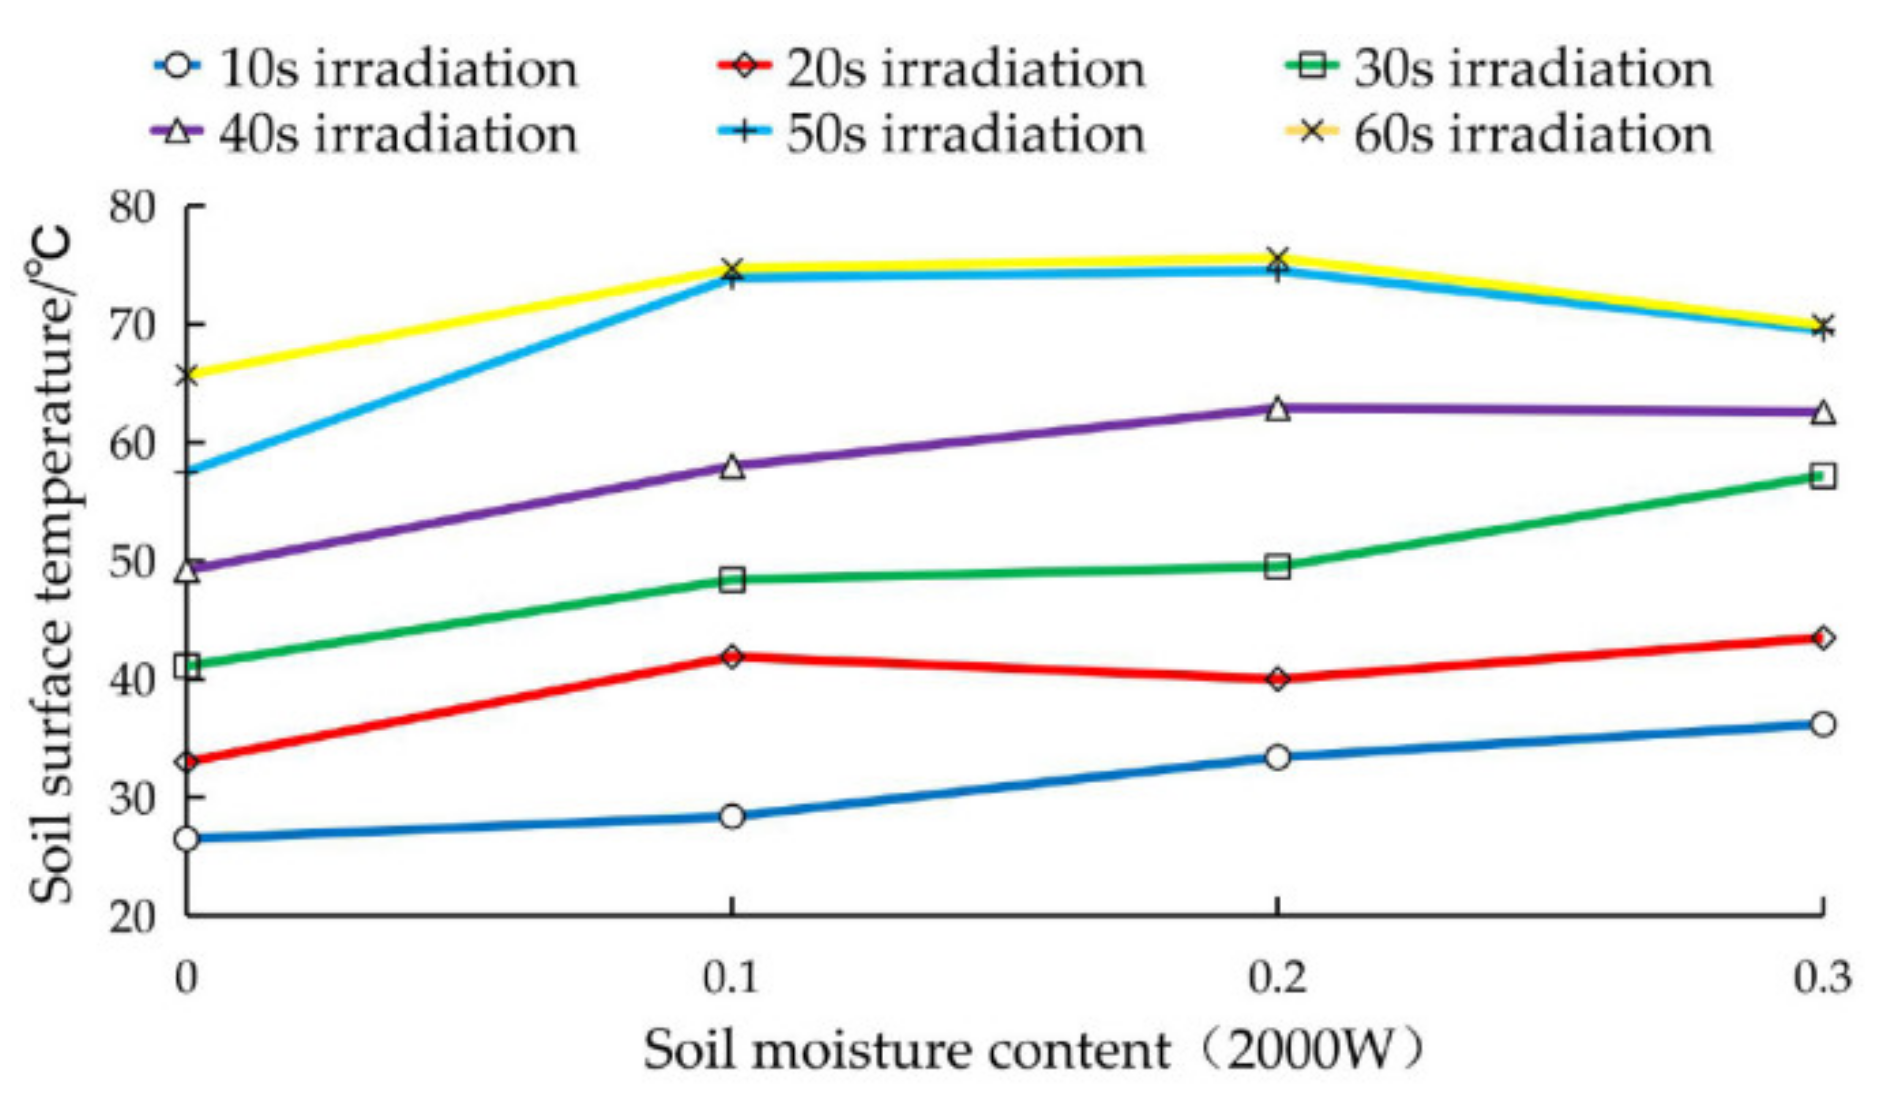
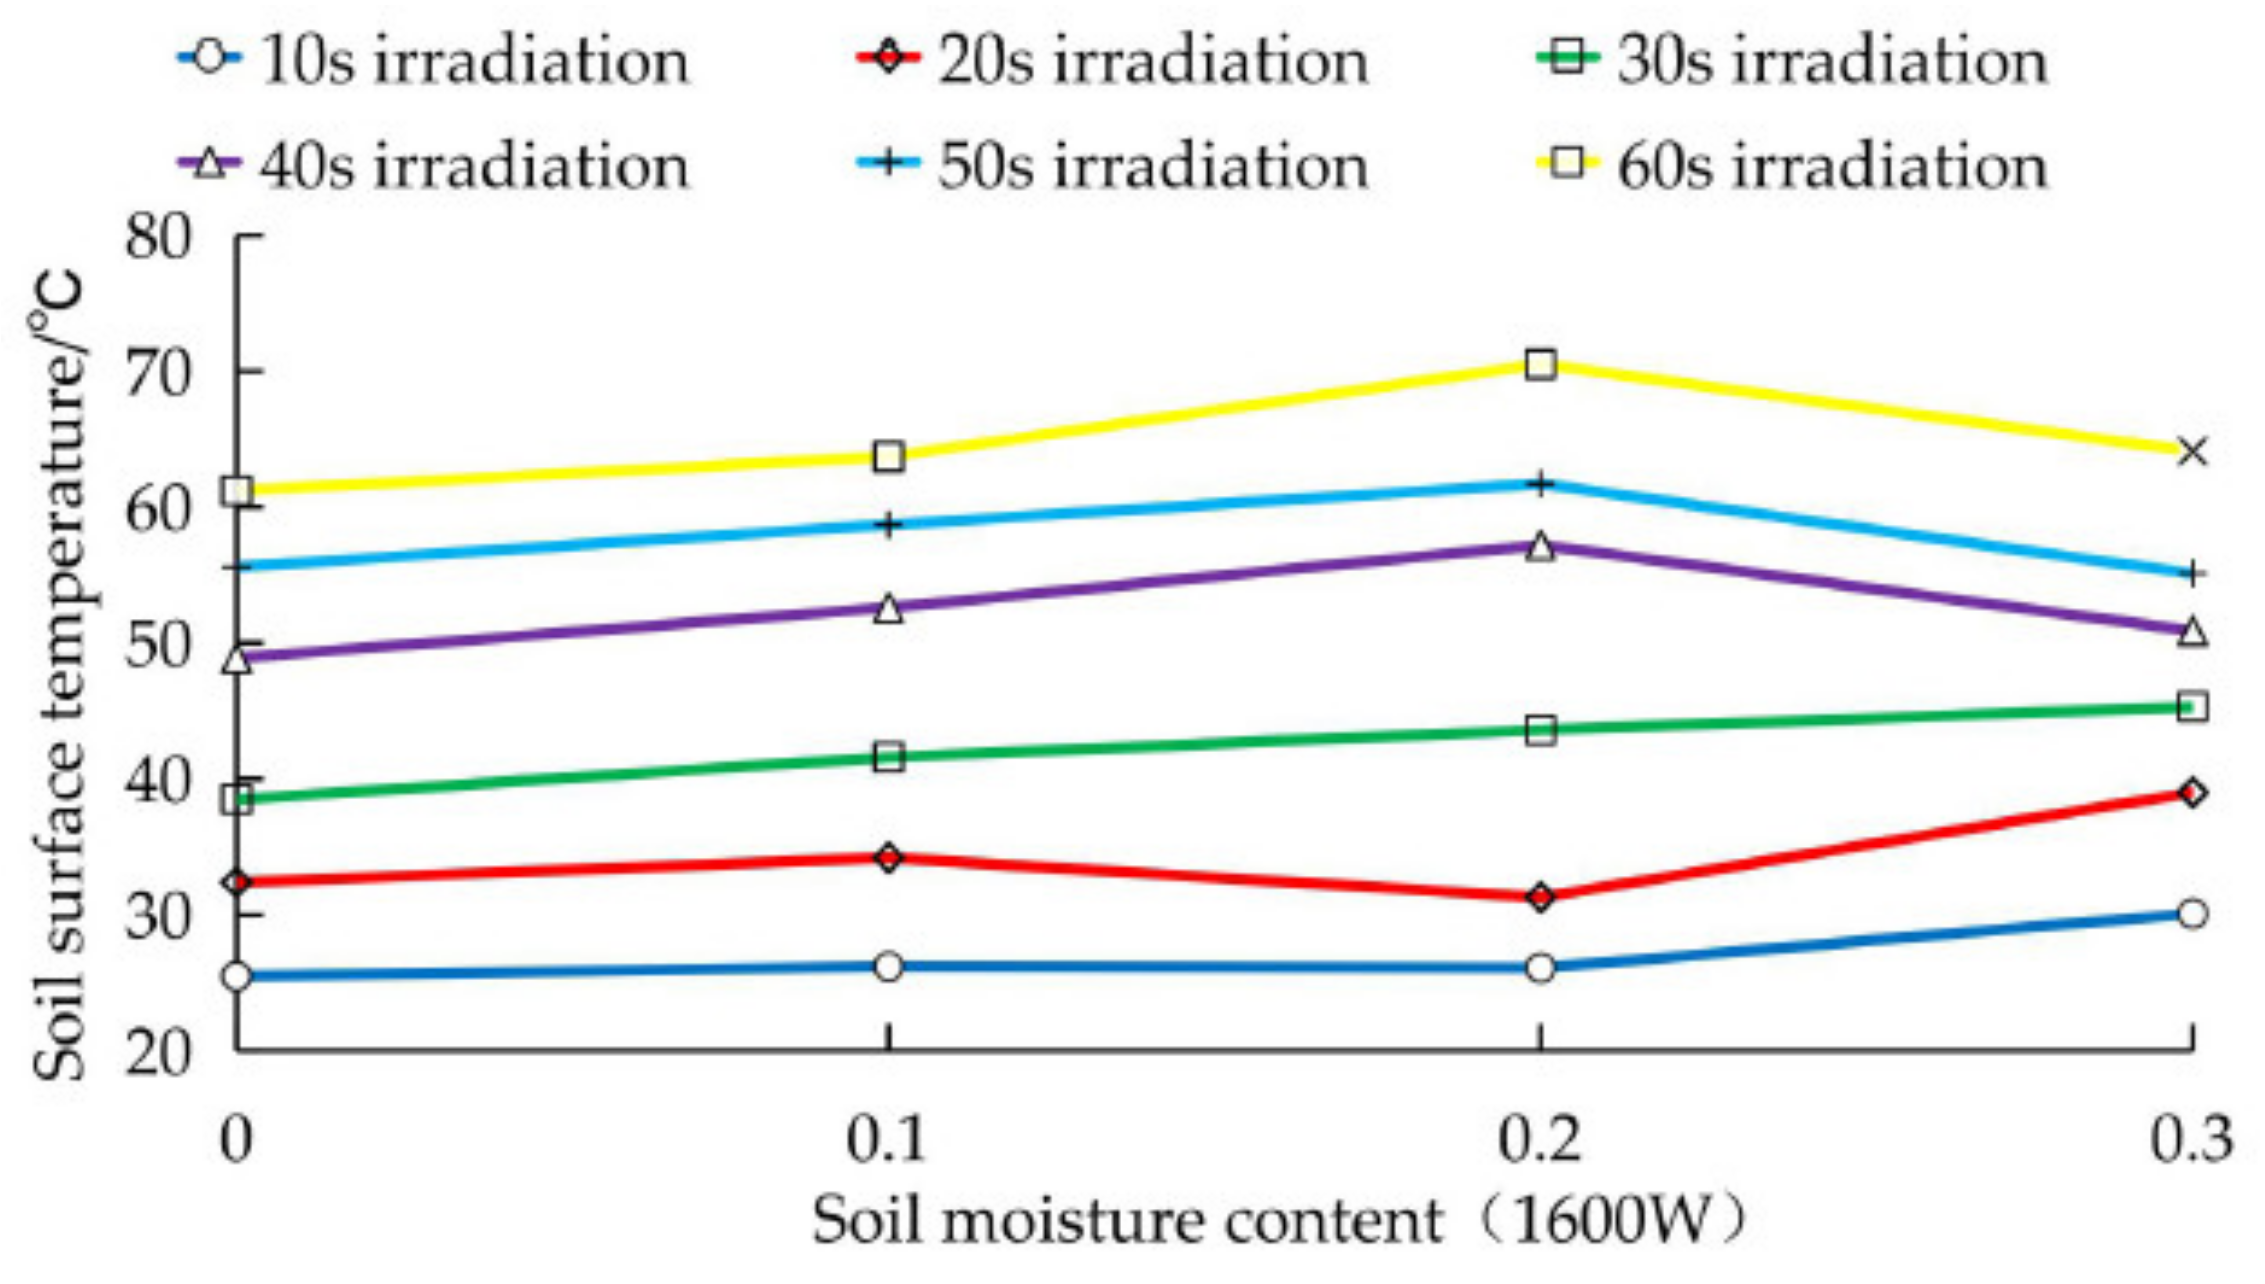
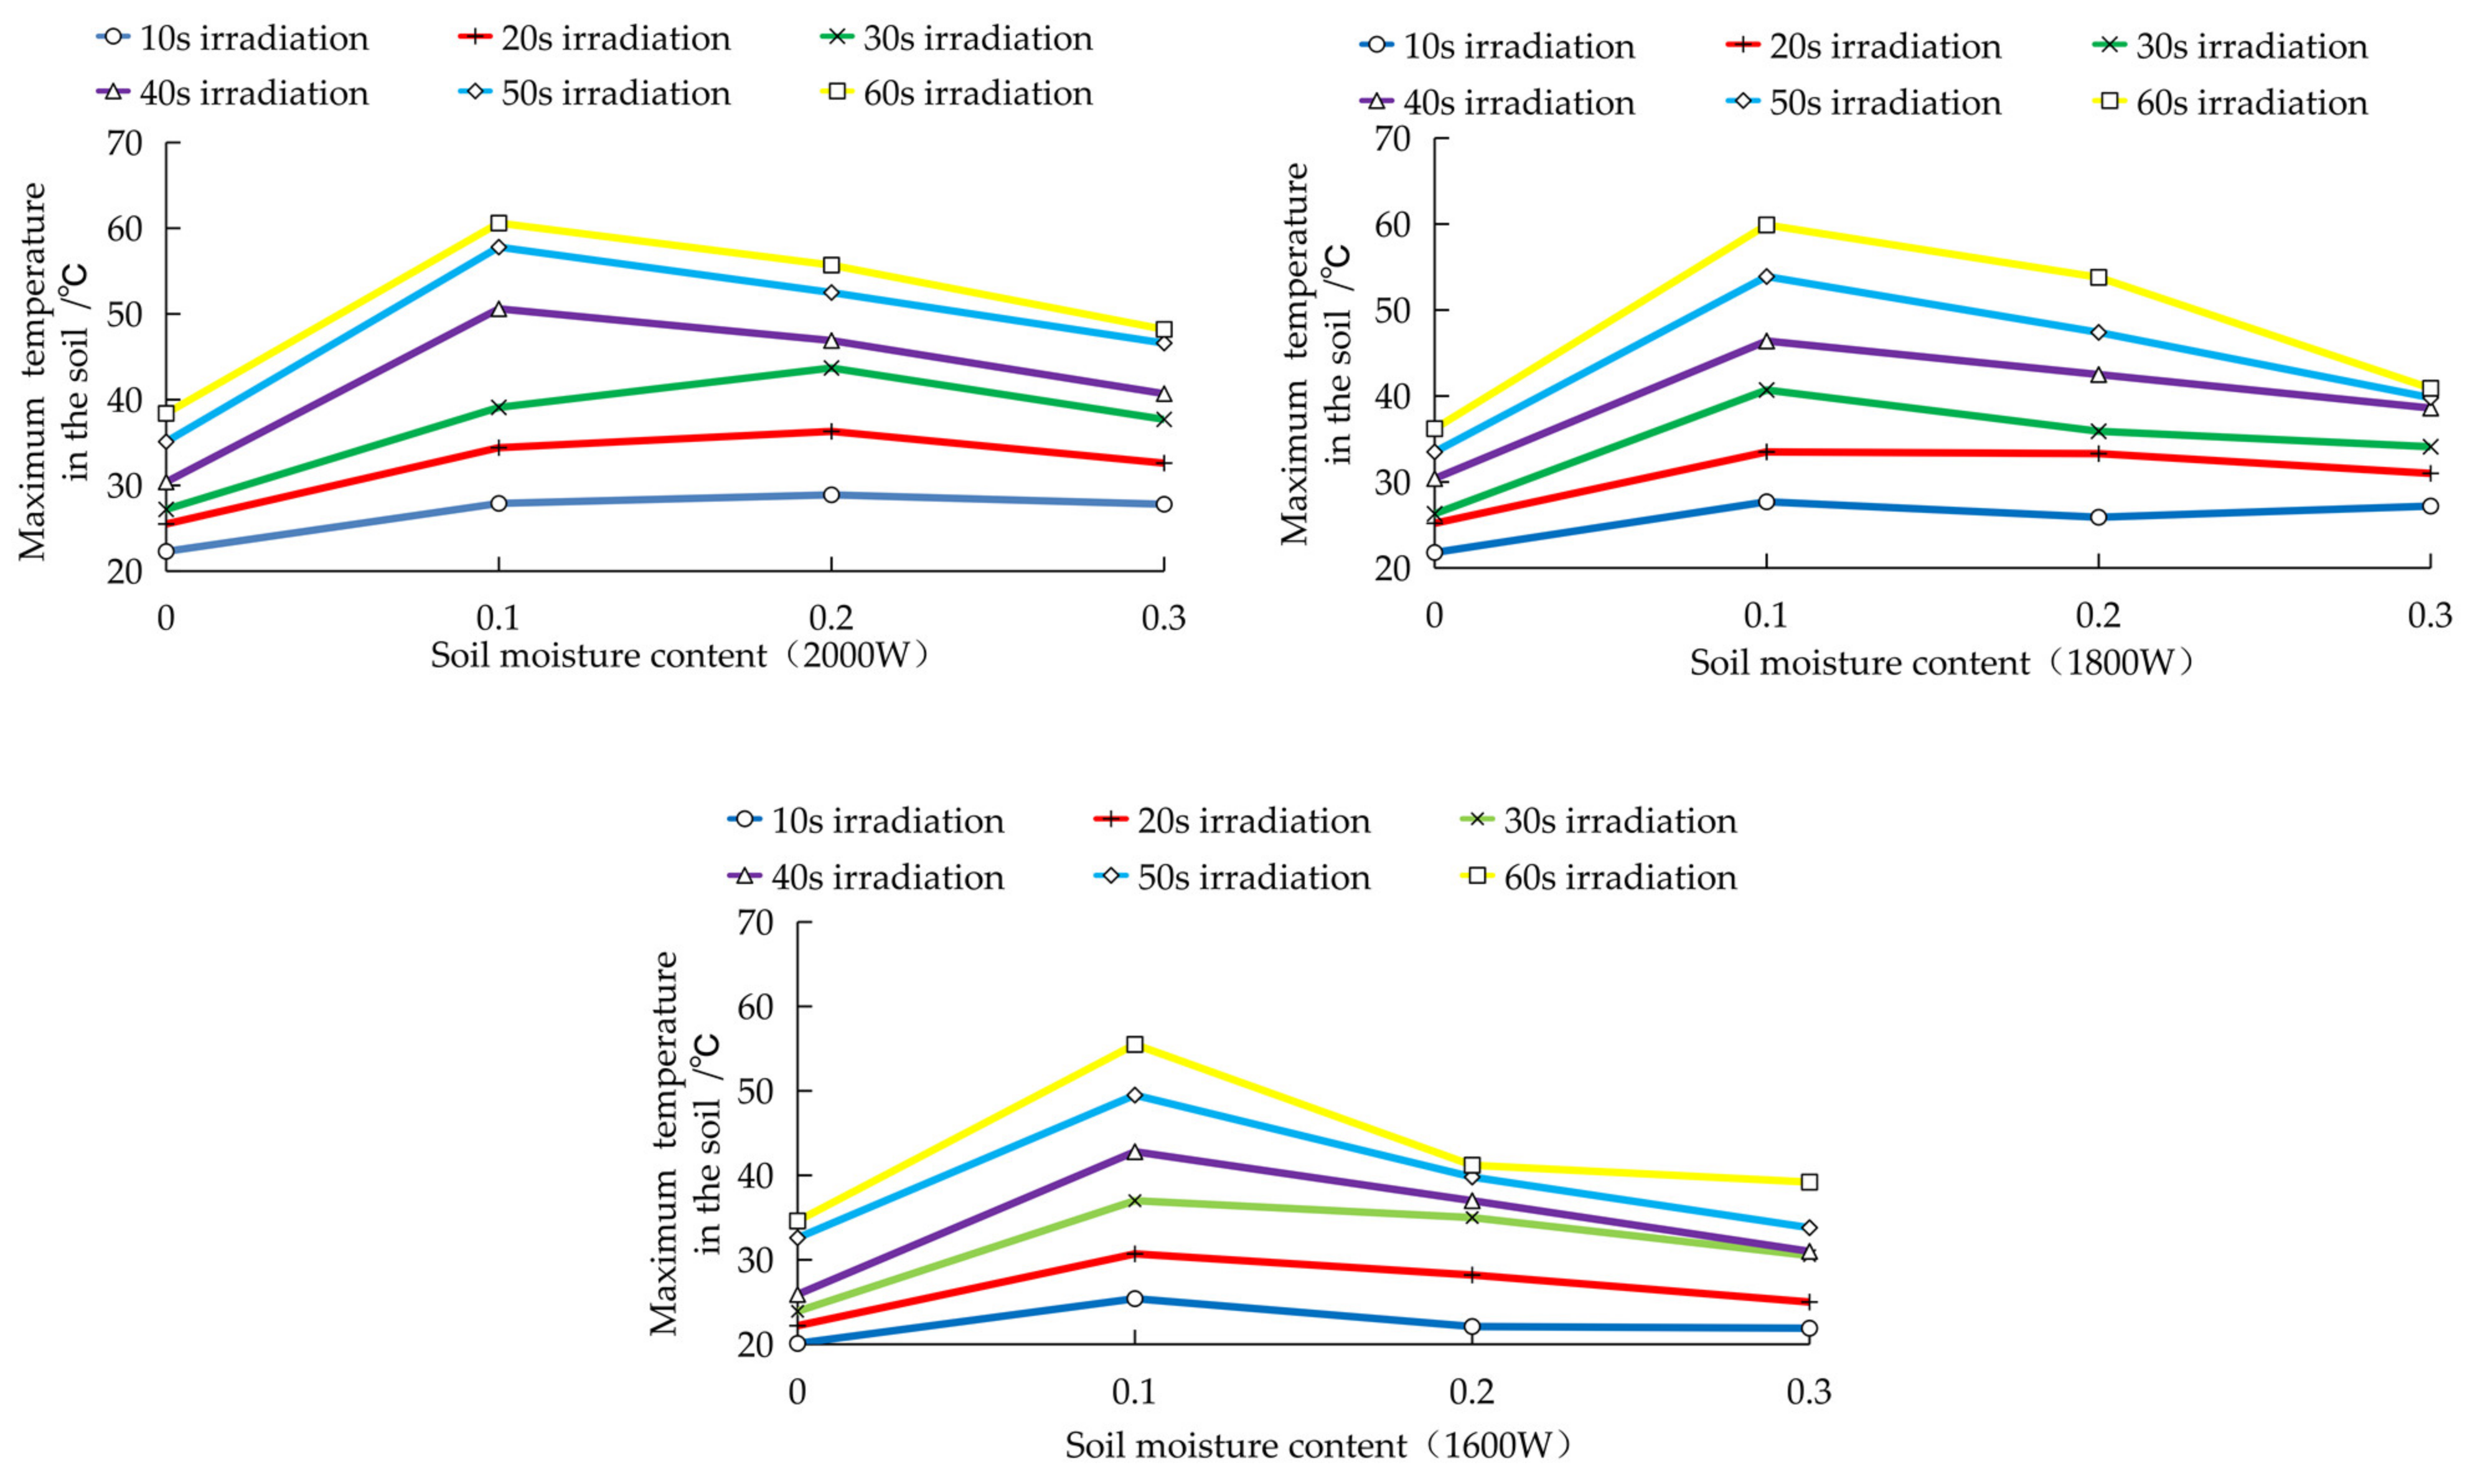
The change patterns of the soil moisture content and soil surface temperature are shown in Figure 16, Figure 17 and Figure 18. When the microwave treatment time remained the same, because of the absence of free water, the surface temperature was the lowest at a soil moisture content of zero. With increasing soil moisture content, the soil surface temperature exhibited an upward trend, but this increase was constrained. In the microwave treatment experiment, when the treatment time ranged from 40~60 s, the soil surface temperature at a soil moisture content of 30% was lower than that at soil moisture contents of 20% and 10%, and the highest surface temperature value was obtained at a 20% soil moisture content. Therefore, according to the experimental results, it could be inferred that the soil surface temperature experiences a rising trend when the soil moisture content ranges from 0–20%, and the soil surface temperature decreases after reaching a maximum value between soil moisture contents of 20% and 30%.Polynomial fitting results of the soil moisture content and soil surface temperature at microwave output power levels of 2, 1.8, and 1.6 kW as shown in Table 3.
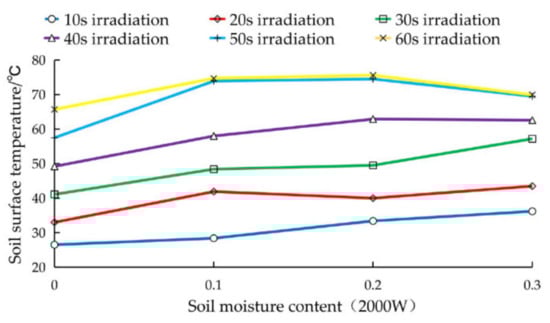
Figure 16.
Change in soil moisture content and soil surface temperature (2000 W).
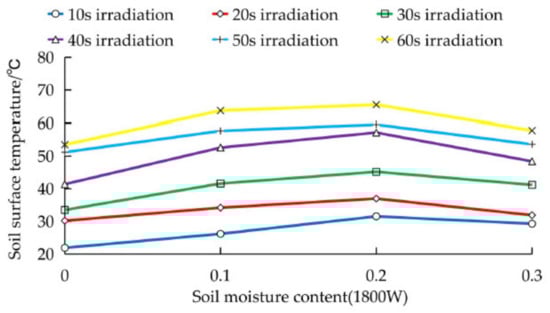
Figure 17.
Change in soil moisture content and soil surface temperature (1800 W).

Figure 18.
Change in soil moisture content and soil surface temperature (1600 W).
Table 3.
Polynomial fitting results of the soil moisture content and soil surface temperature at microwave output power levels of 2, 1.8, and 1.6 kW.
The above experimental results mainly depend on the soil moisture content. When the soil moisture content varies, the soil dielectric constant ε′, incident frequency of microwaves to the soil, and air–soil interface reflection coefficient all change. The complex permittivity of the free space can be expressed as:
In the above equation, ε′ is the dielectric constant, j = (−1)1/2 denotes the complex operator, and ε″ is the dielectric loss factor.
Regarding the air–soil interface, the reflection coefficient can be expressed via the relative permittivity of the soil [26]:
Under normal circumstances, the soil moisture content at depths from 0~200 mm is approximately 20%, and the saturated moisture content reaches 23.3%. The soil adopted in the experiment did not reach a soil moisture content higher than 30% in the field. In the experiment, the higher soil surface temperature obtained at soil moisture contents of 10% and 20% undoubtedly yielded a positive microwave soil disinfection effect.
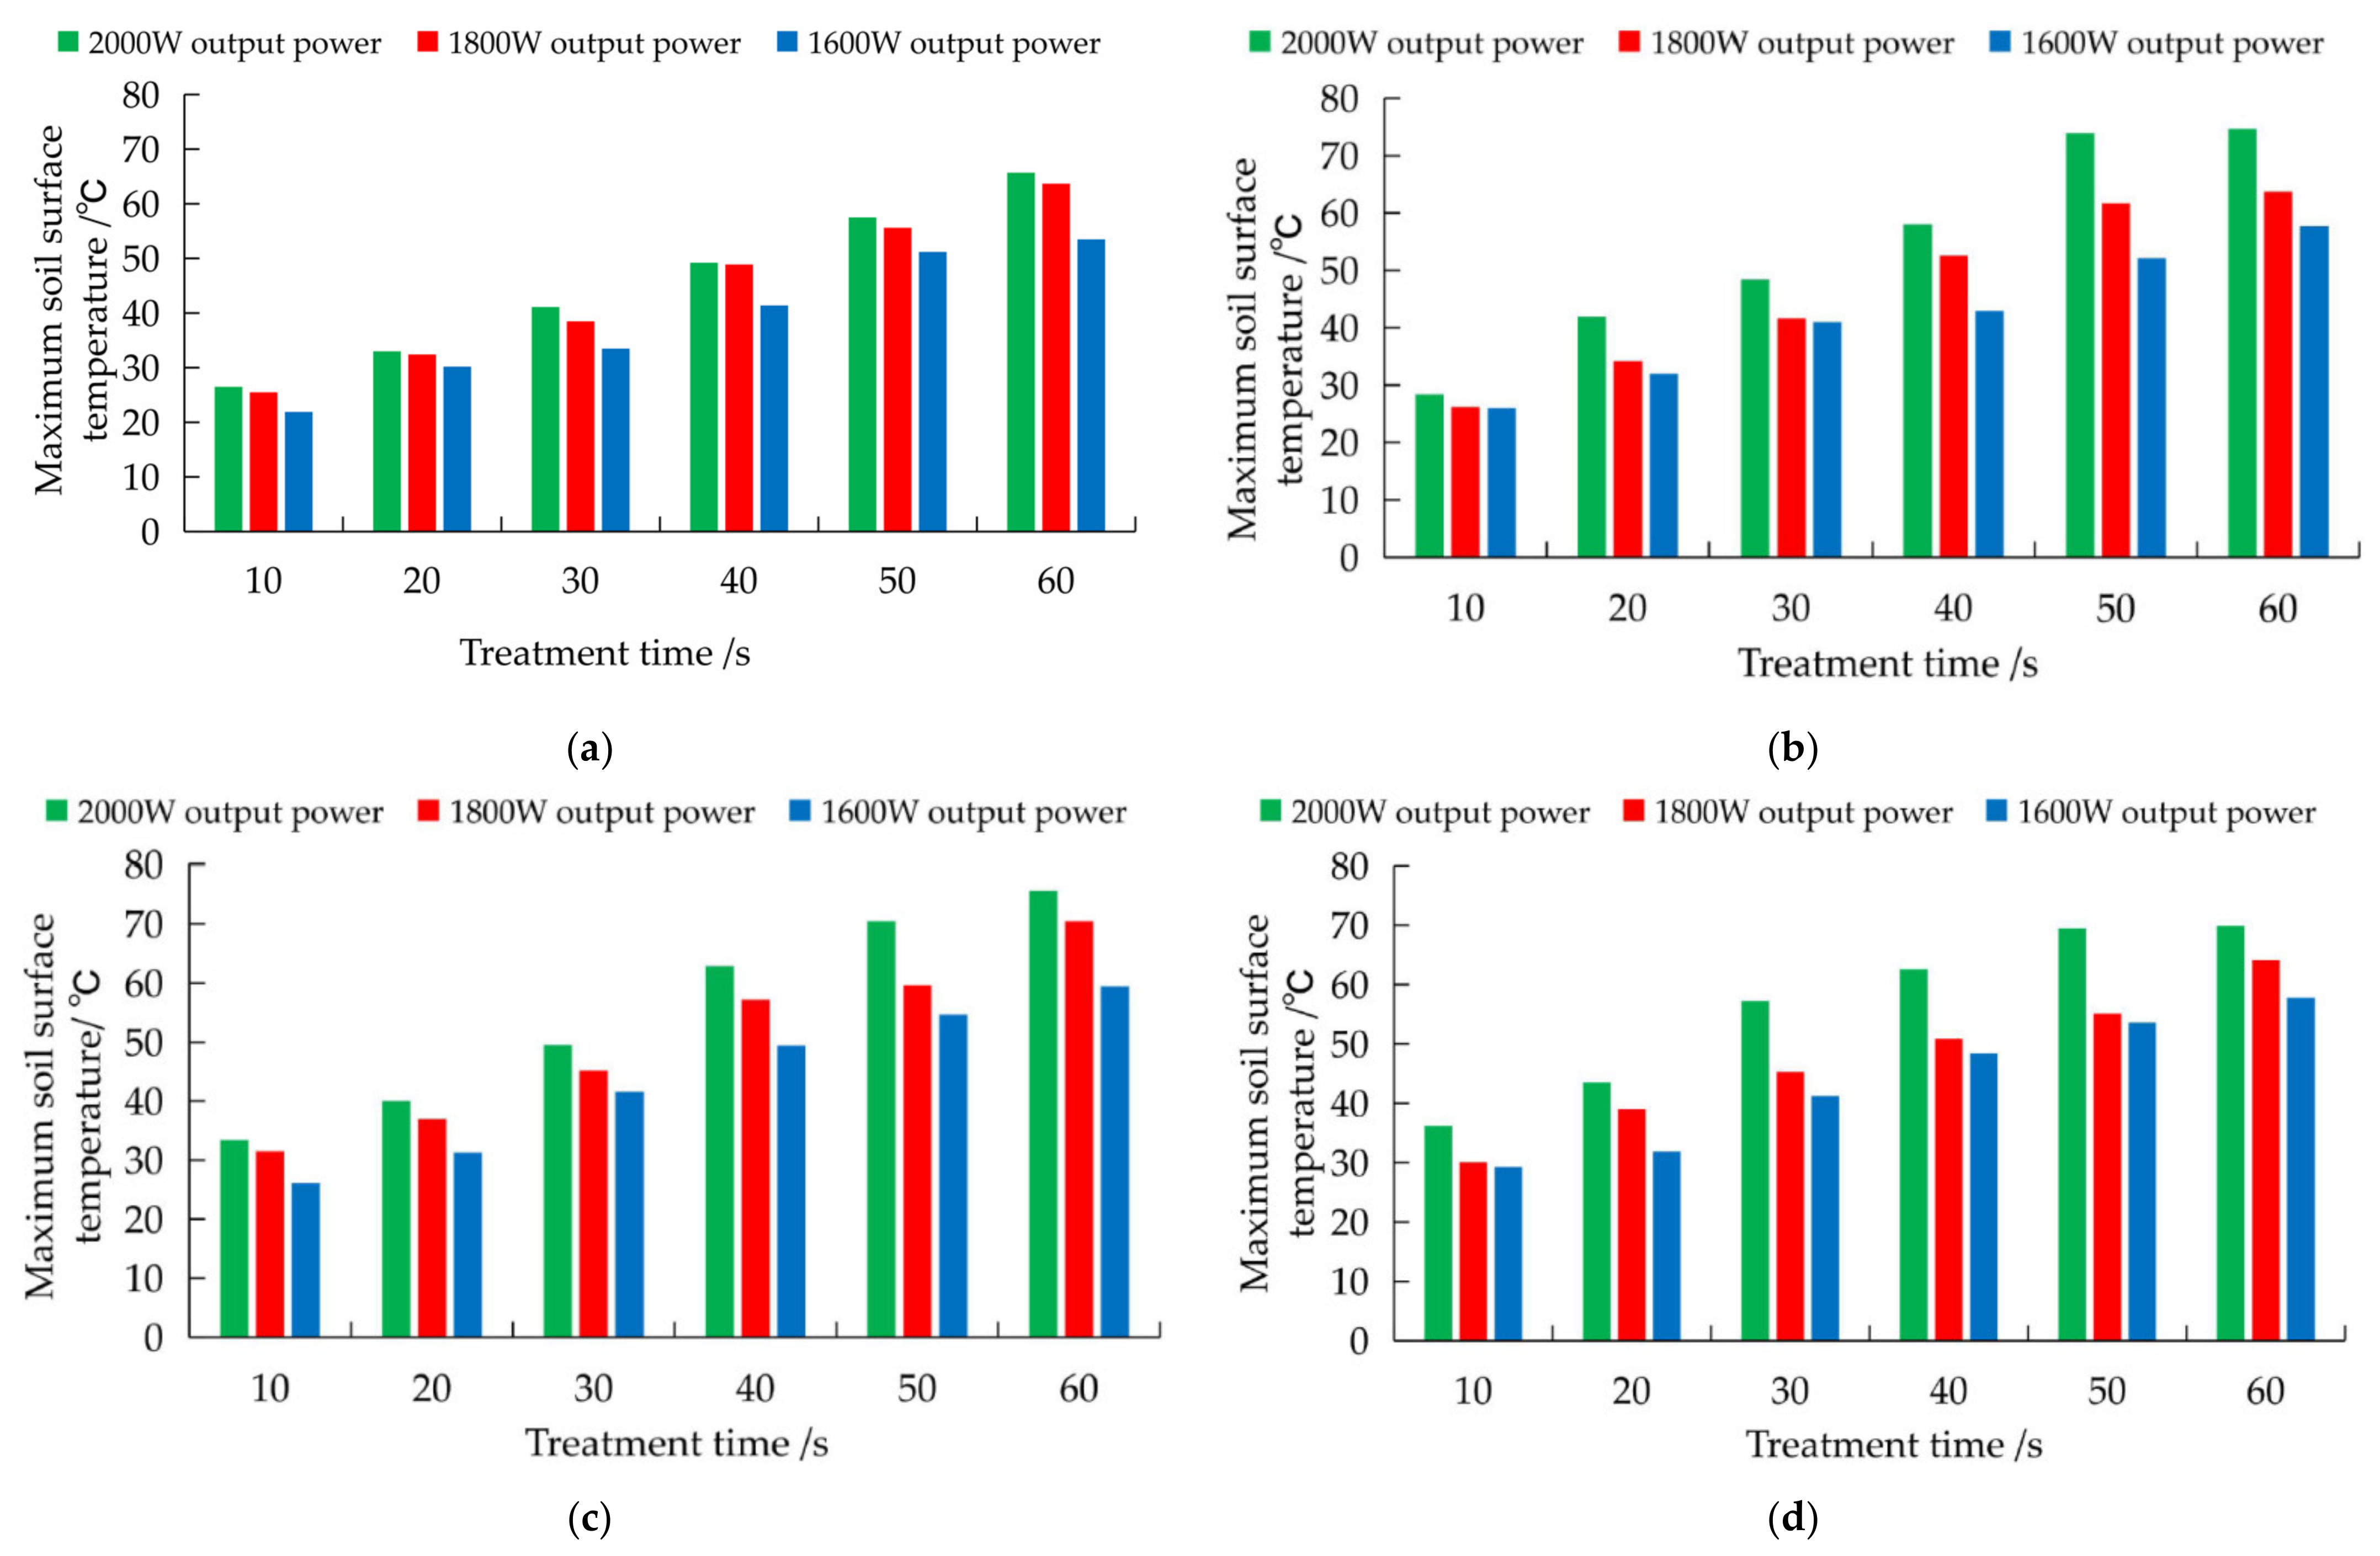
The influence of the microwave output power on the highest soil surface temperature is shown in Figure 19. In the study of the influence of the microwave output power on the soil surface temperature, this article applies the following method to compare the difference in soil surface temperature between the various output power levels:
where temp1 denotes the average value of the temperature difference of the soil surface treated by different power microwaves, denotes the average value of the highest soil surface temperature after 2 kW microwave treatment for 10, 20, 30, 40, 50, and 60 s. The same applies to and . In the experiment, short treatment times ranging from 10~30 s resulted in large fluctuations in the soil surface temperature, while the change in soil surface temperature after 40~60 s treatment remained relatively stable, so the treatment time was divided into 10~30 s and 40~60 s intervals for analysis.
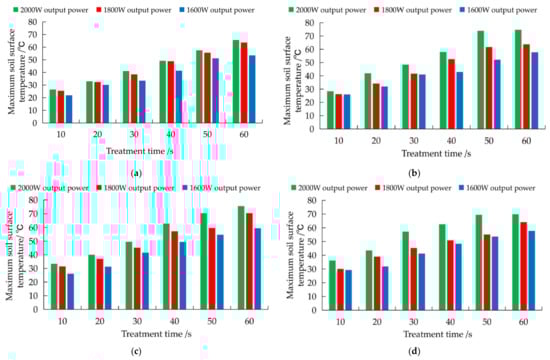
Figure 19.
Effect of the microwave output power on the maximum soil surface temperature: (a) diagram of the treatment time and maximum soil surface temperature for a 0% soil moisture content; (b) diagram of the treatment time and maximum soil surface temperature for a 10% soil moisture content; (c) diagram of the treatment time and maximum soil surface temperature for a 20% soil moisture content; (d) diagram of the treatment time and maximum soil surface temperature for a 30% soil moisture content.
Table 4 provides the difference in the average soil surface temperature between the 10~30 s and 40~60 s treatments. When the treatment time ranges from 40~60 s and the soil moisture content is 0%, 10%, and 30%, 3Temp1 > 0 is satisfied. Only when the soil moisture content reaches 20% does 3Temp1 < 0 apply. The difference is only 0.67. The higher the microwave output power is, the higher the energy obtained by the soil, the higher the temperature and the better the insulation effect [27]. In summary, the maximum microwave output power is 2 kW.
Table 4.
Average difference in the soil surface temperature.
3.2.2. Experimental Results of the Soil Internal Temperature
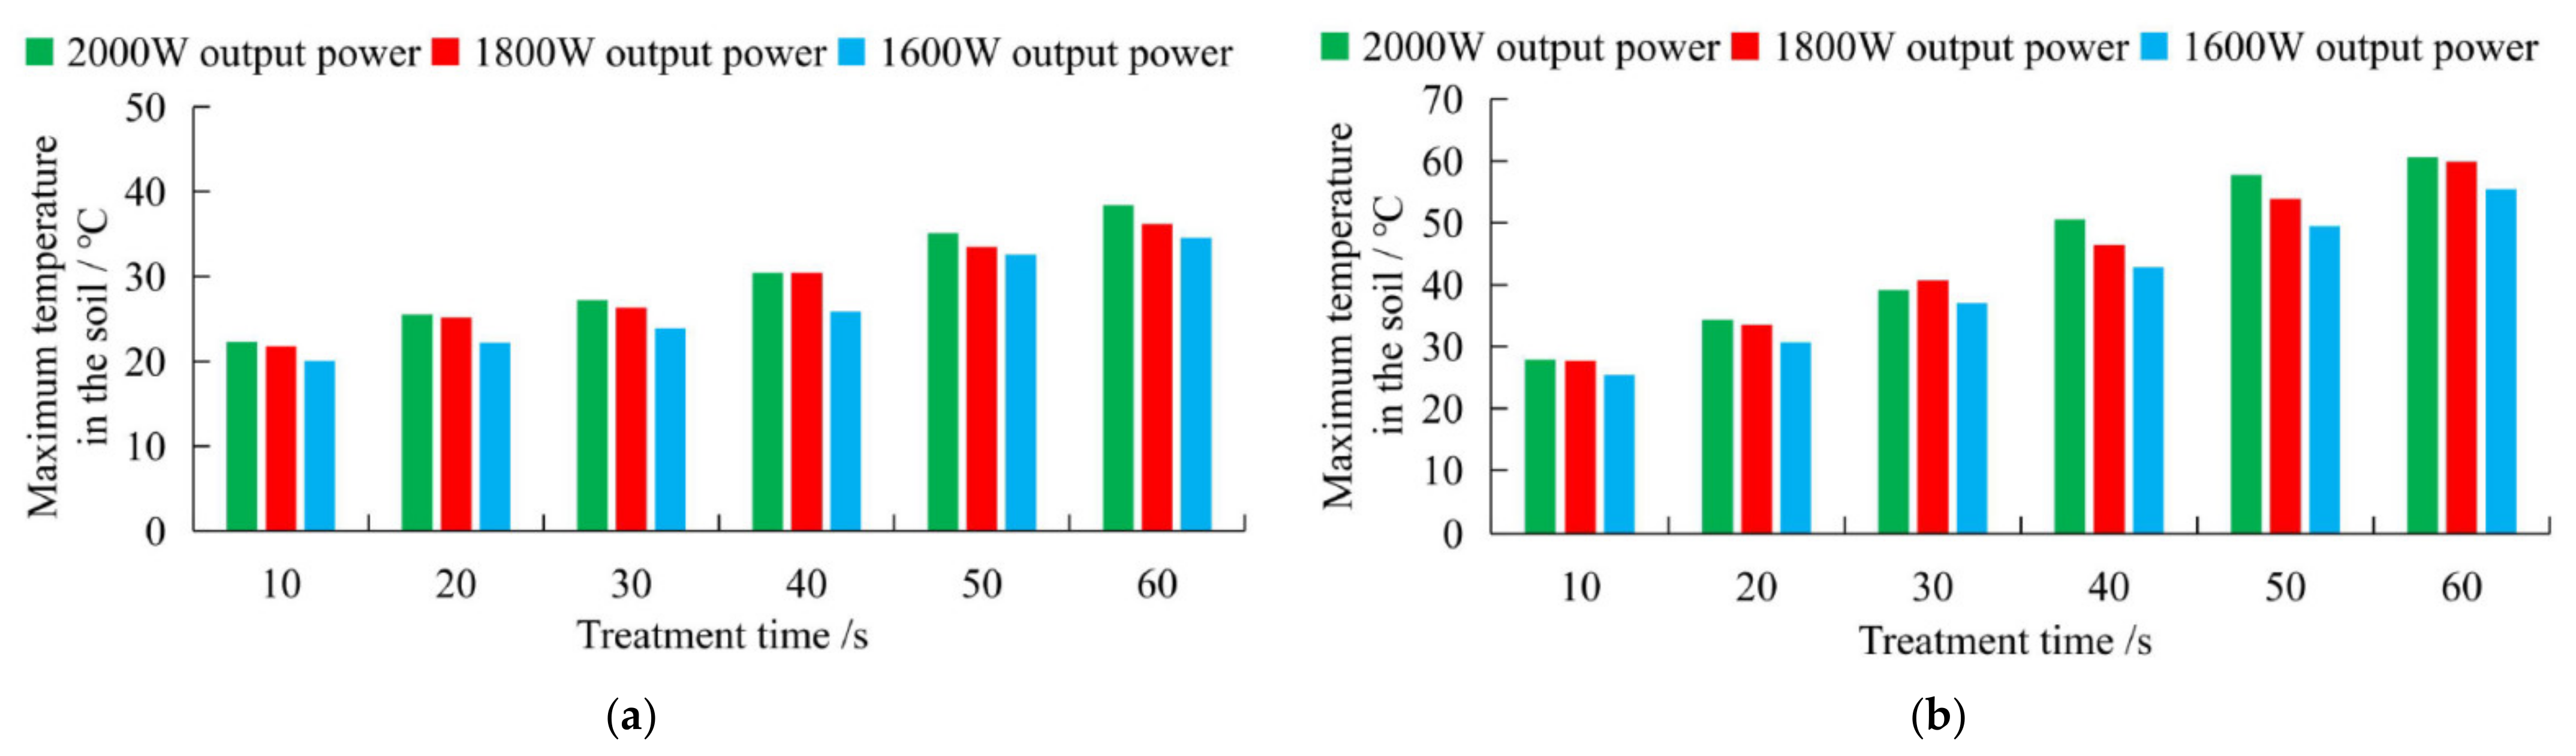
To ensure the accuracy of the results of the soil internal temperature experiments, it is necessary to verify the accuracy of the temperature data obtained with the PT100 sensor. The PT100 sensor and a mercury thermometer with an accuracy of 0.1 °C were employed to obtain the soil temperature at a depth of 3 cm with a moisture content of 10%. Under the same soil conditions, soil temperature measurements were performed at room temperature and after 2 min of microwave treatment. The results are shown in Figure 20a,b. Among the results, the average temperature based on 30 points measured with the PT100 sensor under normal soil conditions is 25.46 °C and that measured with the mercury thermometer reaches 25.37 °C. After 2 min of microwave treatment, the average temperature based on 30 points measured with the PT100 sensor is 33.97 °C, and the average temperature measured with the mercury thermometer is 34.08 °C.
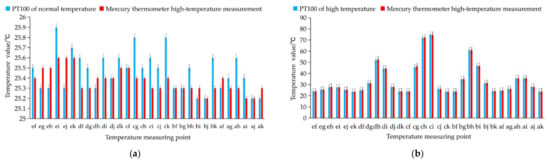
Figure 20.
Normal temperature soil and soil temperature after microwave irradiation measured by two kinds of sensors: (a) soil temperature at room temperature; (b) soil temperature after 2 min of microwave treatment.
In the experiment, the maximum treatment time was 60 s, so when exploring the relationship between the maximum soil internal temperature, soil moisture content, and microwave output power, only the soil internal temperature above 10 cm was measured. The influence of the microwave treatment time on the maximum temperature inside the water-bearing soil is shown in Figure 21. In the study of the influence of the microwave output power on the soil internal temperature, the same method as that for the soil surface temperature was adopted:
where temp2 denotes the average value of the temperature difference inside the soil treated by different power microwaves, denotes the average value of the highest soil internal temperature after microwave treatment for 10, 20, 30, 40, 50, and 60 s under a microwave output power of 2 kW. The same applies to and . In the analysis process, the treatment time was divided into 10~30 s and 40~60 s intervals.
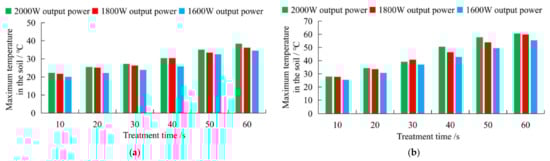
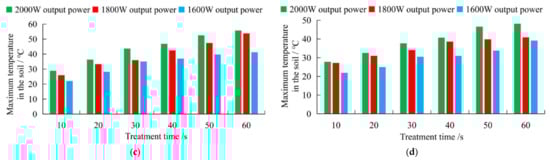
Figure 21.
Influence of the microwave output power on the maximum temperature inside the soil: (a) 0% soil moisture content; (b) 10% soil moisture content; (c) 20% soil moisture content; (d) 30% soil moisture content.
The average difference in soil internal temperature after microwave treatment is listed in Table 5. When the treatment time ranges from 10~30 s, all the test soils satisfy 3Temp2 > 0, except for the soil with a water content of 20%. Therefore, when selecting the microwave output power, the soil internal temperature and soil surface temperature follow the same law. Compared to the 200 W power gradient, a microwave output power of 2 kW yields greater benefits in terms of the soil internal temperature.
Table 5.
Average difference in the soil internal temperature.
The change patterns of the soil moisture content and the highest soil internal temperature are shown in Figure 22. When the microwave treatment time remained the same, the soil internal temperature generally followed T10% > T20% > T30% > T0%. Due to the lack of free water, the soil internal temperature is the lowest at a soil moisture content of zero among the three microwave output power levels. When the soil moisture content ranges from 0~10%, the soil internal temperature exhibits an upward trend after microwave treatment. In the experiments, a soil moisture content of 10% yields the maximum soil internal temperature value. When the soil moisture content ranges from 20~30%, the soil internal temperature exhibits a downward trend. Therefore, the maximum soil internal temperature value should be obtained within the interval of 10~20%. Polynomial fitting results of the soil moisture content and soil internal temperature at microwave output power levels of 2, 1.8, and 1.6 kW as shown in Table 6.
Figure 22.
Change in the soil moisture content and the highest soil internal temperature.
Table 6.
Polynomial fitting results of the soil moisture content and soil internal temperature at microwave output power levels of 2, 1.8, and 1.6 kW.
In this study on the variation in soil thermal diffusivity with the moisture content, the trend of the thermal diffusivity with the soil moisture content is as follows: When the soil moisture content ranges from 0–20% (dry basis), with increasing moisture content, the soil thermal diffusivity increases. A peak value is attained within the range from 20% to 30%, and the value gradually decreases after 30% [28]. In this paper, the influence of microwaves on the soil internal temperature adheres to the above heating law.
With increasing soil moisture content, the location of the maximum soil internal temperature becomes increasingly closer to the soil surface. The location of the highest soil internal temperature after microwave treatment is shown in Figure 23. The position of the highest temperature occurs 3~5 cm away from the soil surface. At a soil moisture content of 10%, the location of the highest temperature is 4~2 cm away from the soil surface, while at a soil moisture content of 20%, the location of the highest temperature is 3~2 cm away from the soil surface. At a soil moisture content of 30%, the location of the highest temperature is 2~1 cm away from the soil surface. In the microwave soil treatment process, a portion of the energy is dissipated into the loess medium [29], so an increase in soil water content impedes the entry of microwave energy into the soil. This attenuation phenomenon within the soil is also the main reason why not all the energy reaches the deeper soil layers.
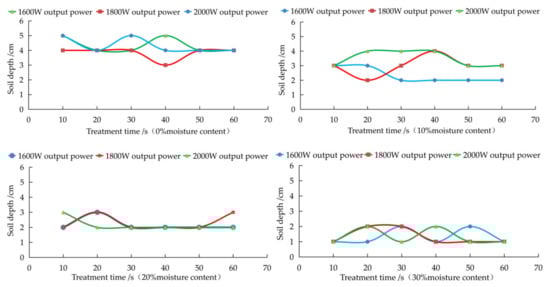
Figure 23.
Location of the highest soil internal temperature after microwave treatment.
Brodie reported that the highest temperature after microwave soil treatment occurs 2~5 cm below the soil surface along the centerline of the horn antenna [30]. Through simulations and experiments of microwave soil treatment, it is found that the location of the highest soil internal temperature after microwave treatment is located 1~5 cm below the soil surface along the centerline of the horn antenna. In addition, the highest soil temperature after microwave irradiation often occurs at the soil surface and not within the soil. Even if the soil surface temperature was affected by environmental factors, the energy quickly dissipated. Figure 24 shows the maximum soil internal temperature and soil surface temperature.
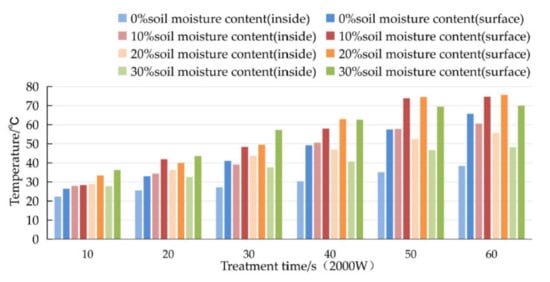
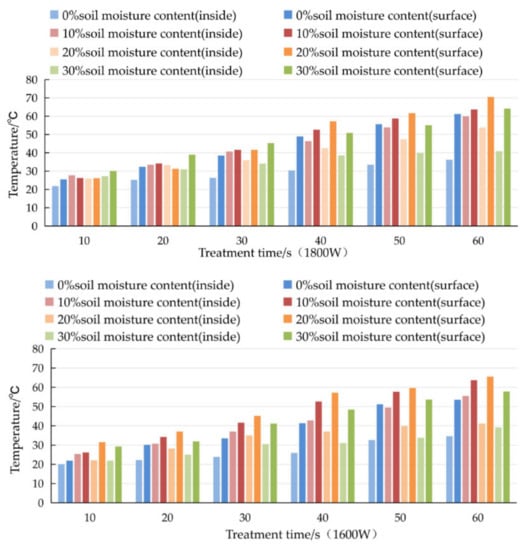
Figure 24.
Maximum internal soil temperature and soil surface temperature.
Researchers have pointed out that the high degree of energy attenuation in the microwave soil treatment process leads to unsatisfactory effects of microwave soil disinfection and explains the infeasibility of microwave soil disinfection operations based on the energy cost [29,31]. However, in a study on the application of microwaves to control walnut diseases, insects, and pests, a radio frequency of 27 MHz was adopted to heat fifth-instar navel orange worms, which represents the most heat-resistant life stage, and complete eradication was achieved within 5 min at a temperature of 55 °C [32]. Nematodes in soil can be terminated in only 15 min at 45 °C or a few seconds at 55 °C. Most soil organisms perish at 70 °C. Studies have indicated that when the microwave output power is maintained at 2 kW for 8 min or at 4 kW for 4 min, the maximum soil temperature after microwave treatment can reach 85 °C. Based on this study of the soil temperature change after short-term microwave treatment, the maximum soil surface temperature after 60 s of microwave treatment reached 75 °C, and the maximum soil internal temperature reached 60.6 °C. It seems feasible to increase the soil internal temperature and extend the high soil temperature range to the cultivated layer by increasing the microwave treatment time and power or superimposing multiple microwave-emitting devices.
In terms of crops and medicinal materials, the overall cost of soil disinfection cannot only be considered in terms of energy and cost. It is also necessary to pay attention to the intake of pesticides, because the consumption of agricultural products containing unsafe pesticide residues could cause neurological diseases [33]. Even if strict maximum residue limits were defined for each pesticide and permitted agricultural product, under frozen storage, pesticide residues remained stable or slowly degraded. Drying may increase the residue content due to concentration. In certain cases, the degradation product may be more toxic than the initial compound [34]. Long-term ingestion may undoubtedly cause great harm to the human body, especially in patients ingesting medicinal materials containing excessive pesticide residues and infants with low resistance.
Studies have demonstrated that different soil textures affect the heat transfer process inside soil. For example, dry clay heats faster than dry sand [24]. Various types of soils exhibit differences in parameters due to their unique physical and chemical properties, which affects the heating law in soil. This paper acquired soil samples from the National Experimentation for Precision Agriculture base in Beijing. However, the investigation of the temperature distribution in different soils after microwave irradiation remains highly important to guide microwave soil disinfection in various regions.
The treatment effect of microwave soil disinfection is closely related to the soil moisture content. Studies have investigated soil in Jiaozuo, Henan Province, North China. With ground cover and protective measures to suppress evaporation after rainfall occurrence, the water content of the 0~20 cm cultivated layer ranges from 12~15.8%, and the saturated soil water content reaches 23.3% [35]. Therefore, the conventional soil moisture content is conducive to microwave soil disinfection. Combining the temperature distribution law and actual demand of microwave treatment of the different water-containing soils in the experiments, it seems more beneficial to fine-tune the moisture content through irrigation, drying, and other methods before the implementation of microwave soil disinfection [36].
4. Conclusions
The electric field and temperature values when the microwave output power is 2.0 kW, 1.8 kW and 1.6 kW are shown in Table 7. According to the above experimental results, a change in microwave output power does not impact the location of the highest soil internal temperature, but the soil moisture content does affect the location of the maximum soil internal temperature. Notably, with increasing soil moisture content, the location of the highest soil internal temperature becomes increasingly closer to the soil surface. The soil surface temperature is higher than the soil internal temperature under the same microwave treatment conditions. Since the soil internal temperature is the main factor of pest and disease deactivation, if the soil internal temperature meets the pest deactivation conditions, the soil surface temperature also satisfies these requirements. The above conclusions are in line with the expected results of the simulations.
Table 7.
Electric field and temperature values at a microwave output power of 2.0 kW,1.8 kW and 1.6 kW.
Microwave soil treatment for the same duration revealed that the soil surface temperature followed T20% > T10% > T30% > T0%. In the experiments, the maximum surface temperature reached 75.6 °C in the water-bearing soil with a moisture content of 20% after 2 kW microwave treatment for 60 s, and the soil internal temperature followed T10% > T20% > T30% > T0%. In the experiments, water-bearing soil with a moisture content of 10% was irradiated under a 2-kW microwave output power for 60 s to obtain a maximum soil temperature of 60.6 °C.
Based on the experiments in this article, it is found that microwave soil disinfection generates a certain feasibility, because this approach provides a fumigation effect similar to that provided by chemical methods that can affect deeper soil. In contrast to the chemical fumigation method, microwaves exhibit the advantages of no pollution or residue after treatment, and microwaves can be generated after the residual energy has dissipated into the soil. Compared to other physical soil disinfection methods, such as steam disinfection, this method does not require expensive and complicated supporting facilities. Today, with the rapid development of smart agricultural techniques, the microwave treatment method can be applied with a navigation system to fully realize autonomous operation, which saves manpower and prevents the operator from being harmed by electromagnetic radiation.
Author Contributions
Conceptualization, C.Z. (Chunjiang Zhao) and X.S.; Methodolgy, X.S., C.Z. (Changyuan Zhai), S.Y., C.Z. (Chunjiang Zhao); Validation, S.Y.; Formal analyses, S.Y., H.M.; Investigation, X.S., H.M.; Resources, C.Z. (Chunjiang Zhao), C.Z. (Changyuan Zhai); Data curation, X.S.; Writing—original draft, X.S.; Writing—review & editing, C.Z. (Chunjiang Zhao), C.Z. (Changyuan Zhai), S.Y.; Funding aquistion, C.Z. (Chunjiang Zhao), C.Z. (Changyuan Zhai); Supervision, C.Z. (Chunjiang Zhao), C.Z. (Changyuan Zhai). All authors have read and agreed to the published version of the manuscript.
Funding
The support provided by (1) The National Key Research and Development Plan Project, Robotic Systems for Agriculture (RS-Agri) (2019YFE0125200); (2) 2021 Beijing Innovation Team of Modern Agricultural Industrial Technology System; (3).The Young Talent Program of the Beijing Academy of Agriculture and Forestry Sciences.
Institutional Review Board Statement
Not applicable.
Informed Consent Statement
Not applicable.
Data Availability Statement
The data presented in this study are available on request from the corresponding author.
Conflicts of Interest
The authors declare no conflict of interest.
References
- Lazarova, S.; Coyne, D.; Rodríguez, M.G.; Peteira, B.; Ciancio, A. Functional diversity of soil nematodes in relation to the impact of agriculture—A review. Diversity 2021, 13, 64. [Google Scholar] [CrossRef]
- Veerman, C.; Correia, T.P.; Bastioli, C.; Biro, B.; Bouma, J.; Cienciela, E. Caring for Soil Is Caring for Life—Ensure 75% of Soils Are Healthy by 2030 for Healthy Food, People, Nature and Climate; EU Soil Health and Food Mission Board: Brussels, Belgium, 2020. [Google Scholar]
- Haller, H.E. Microwave Energy Applicator. U.S. Patent 20020090268A1, 11 July 2002. [Google Scholar]
- Vela, G.R.; Wu, J.F.; Smith, D. Effect of 2450 MHz microwave radiation on some soil microorganisms in situ. Soil Sci. 1976, 121, 44–51. [Google Scholar] [CrossRef]
- Wang, X.N.; Cao, A.C.; Yan, D.D.; Qian, W.A.; Huang, B.; Zhu, J.H.; Wang, Q.X.; Yuan, L.I.; Ouyang, C.B.; Guo, M.X. Evaluation of soil flame disinfestation (SFD) for controlling weeds, nematodes and fungi. J. Integr. Agric. 2020, 19, 164–172. [Google Scholar] [CrossRef]
- Mingyou, W.; Hongru, X.; Weidong, S.; Ting, Z.; Run, Z.; Suwei, X. Effects of microwave treatment on root-knot nematode in greenhouse continuous cropping soil. Chin. J. Agric. Mech. 2013, 34, 95–99. [Google Scholar]
- Kissell Charles, W.; Clark William, J. Systems and Methods for in Situ Soil Sterilization, Insect Extermination and Weed Killing. U.S. Patent AU2002330263, 12 December 2003. [Google Scholar]
- Fanti, A.; Spanu, M.; Lodi, M.B.; Desogus, F.; Mazzarella, G. Nonlinear analysis of oil microwave heating: Application to agricultural oils disinfection. IEEE J. Multiscale Multiphysics Comput. Tech. 2017, 2, 105–114. [Google Scholar] [CrossRef]
- O’Brien, M. Microwave: A Fresh Look at Old Technology for Weed Control. Aust. Cottongrower 2017, 38, 26–28. [Google Scholar]
- Wang, M.; Song, W.; Wang, J.; Fei, S.; Chen, H.; Zhou, H. Application of Physical Prevention and Control Technology. Agric. Eng. 2010, 5, 18–20. [Google Scholar]
- Fu, D.; Zhou, T.; Qian, K.J. Study on Microwave Sterilization and Its Mechanism for Biosolids. J. Microw. Sci. 2003, 19, 70–72,82. [Google Scholar]
- Nelson, S.O.; Stetson, L.E. Comparative effectiveness of 39- and 2450-MHz electric fields for control of rice weevils in wheat. J. Econ. Entomol. 1974, 67, 592–595. [Google Scholar] [CrossRef]
- Ferriss, R. Effects of microwave oven treatment on microorganisms in soil. Phytopathology 1984, 74, 121–126. [Google Scholar] [CrossRef]
- Speir, T.W.; Cowling, J.C.; Sparling, G.P.; West, A.W.; Corderoy, D.M. Effects of microwave radiation on the microbial biomass, phosphatase activity and levels of extractable N and P in a low fertility soil under pasture. Soil Biol. Biochem. 1986, 18, 377–382. [Google Scholar] [CrossRef]
- Hendricks, C.W.; Pascoe, N. Soil mcirobial biomass estimates using 2450 MHz microwave irradiation. Plant Soil 1988, 110, 39–47. [Google Scholar] [CrossRef]
- Li, G. Research and Experimental Device Design of Microwave Pest Control in Grain; Dalian University of Technology: Dalian, China, 2011. [Google Scholar]
- Taflove, A. Computational Electrodynamics: The Finite-Difference Time-Domain Method; Artech House: Boston, MA, USA, 1998. [Google Scholar]
- Mironov, V.L.; Bobrov, P.P.; Fomin, S.V.; Karavaiskii, A.Y. Generalized refractive mixing dielectric model of moist soils considering ionic relaxation of soil water. Russ. Phys. J. 2013, 56, 319–324. [Google Scholar] [CrossRef]
- Rahi, G.S.; Rich, J.R. Effect of Moisture on Efficiency of Microwaves to Control Plant-Parasitic Nematodes in Soil. J. Microw. Power Electromagn. Energy 2011, 45, 86–93. [Google Scholar] [CrossRef]
- Rahi, G.S.; Rich, J.R. Potential of Microwaves to Control Plant-Parasitic Nematodes in Soil. J. Microw. Power Electromagn. Energy 2007, 42, 5–12. [Google Scholar] [CrossRef]
- Khan, M.J.; Brodie, G.; Gupta, D. Effect of microwave (2.45 GHz) treatment of soil on yield components of wheat (Triticum aestivum L.). J. Microw. Power Electromagn. Energy 2016, 50, 191–200. [Google Scholar] [CrossRef]
- Rajamannan, A.H.J. Method for killing soil pathogens with micro-wave energy. U.S. Patent US5287818A, 22 February 1994. [Google Scholar]
- Li, X.; Yi, X. Method for the Determination of Soil Water Content GB 7172-87; Beijing Agricultural University: Beijing, China, 1987. [Google Scholar]
- Brodie, G.; Pasma, L.; Bennett, H.; Harris, G.; Woodworth, J. Evaluation of microwave soil pasteurization for controlling germination of perennial ryegrass (Lolium perenne) seeds. Plant Prot. Q. 2007, 22, 150–154. [Google Scholar]
- Cooper, A.P.; Brodie, G. The effect of microwave radiation on keyoil parameters. Plant Prot. Q. 2009, 24, 67–70. [Google Scholar]
- Stratton, A.J. Electromagnetic Theory; Wiley: New Jersey, NJ, USA, 1941. [Google Scholar]
- Fan, R. Research on Raisin Radio Frequency Sterilization Technology; Northwest A&F University: Xianyang, China, 2019. [Google Scholar]
- Li, Y.; Shao, M.; Wang, W.; Wang, Q.; Zhang, J.; Lai, J. Effects of texture on soil thermal properties. Trans. Chin. Soc. Agric. Eng. 2003, 4, 62–65. [Google Scholar]
- Nelson, S.O. A review and assessment of microwave energy for soil treatment to control pests. Trans. ASAE 1996, 39, 281–289. [Google Scholar] [CrossRef]
- Brodie, G.; Hamilton, S.; Woodworth, J. An assessment of microwave oil pasteurization for killing weeds and weeds. Plant. Prot. Q. 2007, 22, 143–149. [Google Scholar]
- Brodie, G.; Ryan, C.; Lancaster, C. Microwave technologies as part of an integrated weed management strategy: A review. Int. J. Agron. 2012, 2012, 636905. [Google Scholar] [CrossRef]
- Wang, S.; Tang, J.; Johnson, J.A.; Mitcham, E.; Hansen, J.D.; Cavalieri, R.P.; Bower, J.; Biasi, B. Process protocols based on radio frequency energy to control field and storage pests in in-shell walnuts. Postharvest Biol. Technol. 2002, 26, 265–273. [Google Scholar] [CrossRef]
- Wahid, F.A.; Wickliffe, J.; Wilson, M.; van Sauers, A.; Bond, N.; Hawkins, W.; Mans, D.; Lichtveld, M. Presence of pesticide residues on produce cultivated in Suriname. Environ. Monit. Assess. 2017, 189, 303. [Google Scholar] [CrossRef]
- Yigit, N.; Velioglu, Y.S. Effects of processing and storage on pesticide residues in foods. Crit. Rev. Food Sci. Nutr. 2020, 60, 3622–3641. [Google Scholar] [CrossRef]
- Liu, Z.; Gao, Y.; Liu, Z.; Duan, A. Effects of rainfall characteristics and mulching patterns on soil moisture in wheat fields. Trans. Chin. Soc. Agric. Eng. 2012, 28, 113–120. [Google Scholar]
- Léonard, J.; Ancelin, O.; Ludwig, B.; Richard, G. Analysis of the dynamics of soil infiltrability of agricultural soils from continuous rainfall-runoff measurements on small plots. J. Hydrol. 2006, 326, 122–134. [Google Scholar] [CrossRef]


Publisher’s Note: MDPI stays neutral with regard to jurisdictional claims in published maps and institutional affiliations. |
© 2021 by the authors. Licensee MDPI, Basel, Switzerland. This article is an open access article distributed under the terms and conditions of the Creative Commons Attribution (CC BY) license (https://creativecommons.org/licenses/by/4.0/).