Article

Comprehensive Evaluation of Soil Moisture Sensing Technology Applications Based on Analytic Hierarchy Process and Delphi

1
College of Information and Electrical Engineering, China Agricultural University, Beijing 100083, China
2
College of Information Science and Engineering, Shandong Agriculture and Engineering University, Jinan 250100, China
3
National Engineering Laboratory for Agri-Product Quality Traceability, Beijing Technology and Business University, Beijing 100083, China
4
Leibniz Institute for Agricultural Engineering and Bioeconomy, 14469 Potsdam, Germany
*
Authors to whom correspondence should be addressed.
Agriculture 2021, 11(11), 1116; https://doi.org/10.3390/agriculture11111116
Submission received: 30 August 2021 / Revised: 23 October 2021 / Accepted: 28 October 2021 / Published: 9 November 2021
(This article belongs to the Section Digital Agriculture)

Abstract

:
The demand for smart irrigation and water-saving practices in agriculture has triggered the development of different soil moisture sensing techniques that can operate under harsh field conditions. In this study, a soil moisture sensing technology appropriate for the field applications was comprehensively evaluated. From a qualitative and quantitative perspective, the Delphi and analytic hierarchy process methods were used to construct an index system involving technological advantage, economic benefit, risk analysis, policy support, four second-level indicators, and 23 fourth-level indicators. The results showed that economic benefits account for the largest weight. The practical evaluation resulted in 12 farms that showed that the selected soil water sensing methods performed reasonably and exhibited obvious water-saving irrigation benefits, which are usually used for scheduling irrigation. The overall score of M4 in different soil types was 0.2% lower than that of M5. Farms with reasonable economic conditions and a high awareness scored 5.3% higher on technology than those with modest economic conditions, which clearly affects the evaluation scores of the two technologies. The evaluation results help farmers and government decision-making bodies in technology selection, production decision-making, and risk control.

1. Introduction

The demand for smart irrigation and water-saving practices in agriculture has triggered the development of different soil moisture sensing techniques that can operate under harsh field conditions. Continuous monitoring of soil moisture is a common practice in digital agriculture to minimize the effects of waterlogging and drought, and increase yield and profitability. Soil moisture measurement methods include the gravity [1], tension [2], neutron [3], γ-ray projection [4], dielectric [5], remote sensing [6], and optical [7] methods. Indeed, each method has its own characteristics and application scenarios. The effect of each method can also be completely different from that of the other methods depending on the soil type, temperature, and salinity [5]. Many studies have investigated the performance of soil water sensing technologies [8]; this is a continuous process as the performance of sensors is constantly improving [9]. Several sensors were tested in different soils to evaluate the measurement accuracy of each sensor in different soils. The exiting studies have primarily focused on the precision and performance improvements in certain applications. However, the application effect in large-scale planting areas has not been studied sufficiently; thus, the current evaluation methods cannot meet the comprehensive applicability evaluation requirements.
Moreover, Lin adopted an expert method to build a technology–organization–environment framework, and discussed the factors influencing the application of internet of things (IoT) technology in China’s agricultural supply chain [10]. Xuerui et al. [11] designed an evaluation index system for agricultural engineering technology applications with 24 indices in a four-layer framework using the relation matrix, criterion matrix, and optimization methods. Asghari et al. conducted a comparative evaluation of the IoT applications considering technical characteristics, such as the quality of service, case studies, and evaluation environment [12], to obtain indicators reflecting the application level of IoT in macro agriculture from different perspectives.
In the fields of greenhouse agriculture, aquaculture, and field transmission networks, Lin et al. [13] developed an applicability evaluation index system for greenhouse intelligent control systems, adopting 22 indices for a practical application in the Shouguang vegetable base in Shandong Province. Xiaoqing et al. [14] constructed an index screening model and optimized it for IoT applications in aquaculture by reducing the indices from 40 to 14, providing a reference for the evaluation of IoT applications in aquaculture. In addition, Niina Kotamaki developed SoilWeather, a catchment-scale wireless sensor network, for agriculture and water monitoring. The network performance can be evaluated from the perspective of users and maintenance personnel, with a focus on the data quality, network maintenance, and application itself. The operation of the SoilWeather network was proved to be moderately reliable. However, maintaining the quality of data using automatic algorithms and calibrated samples, particularly in large-scale continuous water monitoring applications, requires a considerable amount of work [15]. Rui et al. evaluated the performance of three soil water sensors in Mississippi, USA [9], using experimental methods to assess their performance. The establishment of these specific evaluation indices not only improves technical evaluation but also provides a reference for a comprehensive evaluation of soil water sensing technologies based on the characteristics of a particular field.
The current methods for evaluating soil moisture sensor technologies are primarily based on technical improvements and experiments, and thus a comprehensive method is needed for evaluating complex environments and the requirements for their use. Therefore, we employed the Delphi method and analytic hierarchy process (AHP). A comprehensive evaluation model for soil moisture sensing technologies was developed from qualitative and quantitative perspectives, which involves technological advantages, economic benefits, risk analysis, policy support, four second-level indicators, and 23 four-level indicators. The developed indicator system can evaluate soil water sensing technologies in the field. The evaluation results would be beneficial to farms and government decision-making bodies in technology selection, production decision-making, and risk control. In addition, the study results can be used by researchers and agricultural IoT companies.

2. Materials and Methods

2.1. Overview of Soil Moisture Sensor Technology

The measurement of soil moisture in the field is currently based on sensing technologies, such as dielectric [5], remote [16], and thermal [17] sensing, all of which employ different technical methods; their measurement principles and technical characteristics are shown in Table 1. In this study, the technical characteristics of the technology were fully examined considering their measurement principles to quantify the evaluation indices. As the capacitive sensors have been extensively applied in digital agriculture, two commercially available probes, ECH2O EC-5 and ECHO 10HS (Decagon Devices Inc., Pullman, WA, USA) interfaced with a WiFi datalogger (Adaptive AgroTech, Potsdam, Germany) for excitation are shown in Figure 1. Both probes incorporate high-frequency oscillations to deliver accurate results and determine volumetric water content by measuring the charge time of a capacitor using the soil as a dielectric (i.e., utilization of the capacitance/frequency domain technology) and generating an analog output. The dimensions (length, width, thickness) for ECH2O EC-5 are 8.9, 1.8, 0.7 cm, and for ECHO 10HS are 16, 3.3, and 0.8 cm, making them appropriate candidates for different field applications. The AgroTech WiFi datalogger has been optimized for operation under harsh field conditions; thus, it was capable of delivering an excitation signal of 3.6 V to the sensor probes at a user-defined interval (typically every 10 min), log the analog output on an onboard SD card, and upload the measurement results to a private cloud storage via a WiFi connection. Moreover, the sampling volume of each sensor probe and calibration equations are defined by the manufacturer or determined using laboratory tests; thus they may change depending on the datalogger employed.

2.2. Construction of Evaluation Index System

2.2.1. Construction Principles of Evaluation Index System

The index system [18] is the foundation for evaluation, directly affecting the reliability and validity of the evaluation results. A mature evaluation index system should be scientific, systematic, concise, comparable, and operable. In addition, it should be complete, comprehensive, and fully reflect the applicability of the soil water sensing technology. All indicators should be concise and simultaneously reflect their relationship with the objects. The index system structure should be rigid, and the definition of indices be clear. Moreover, an index should provide accurate comparative information to be used as an evaluation index system. Finally, all metrics should be actionable.
The applicability engineering theory, economic principles, and system analysis methods are used to prove that the selection principle of a single index should be based on the following eight criteria [19], which are also used in ecology. That is, it is measurable (M) [20], sensitive (V) [21], predictable (P) [19], typical (T), controllable (C) [19], integrative (I), responsible (R), and stable (S). Among these criteria, I indicates the construction of the entire index system, whereas the remaining seven criteria are requirements for the selection of each index [22].

2.2.2. Influencing Factors of Comprehensive Evaluation

The influencing factors of a comprehensive technology evaluation [23] include the technology itself, economic benefit, risk analysis, and policy support. A technology is applied primarily to reduce production inputs and increase outputs, while its applicability, advancement, and application capability are key characteristics. Sustainable policy support is an important motive force in the application of a technology. The economic benefit is the index measurement of the technology inputs and outputs. The application of technologies is often risky, and thus the application characteristics of the field should be fully considered when determining certain indices. The field environment includes natural and artificial environments. The natural environment is inherited from the natural ecosystem; however, it is regulated and controlled by humans to varying degrees. Features of natural environments include the temperature, light, and physical and chemical properties of the soil in the crop population. The artificial environment refers to the input of various social resources to farmland, such as intelligent irrigation, pest control, and online soil moisture testing. Furthermore, field environmental information technology has been widely promoted, in which field soil moisture measurement devices are used to obtain real-time and stable soil moisture data to ultimately realize the online detection of soil moisture for crop growth. In general, the equipment is buried in soil to obtain the soil moisture content at different depths and fulfill different requirements.

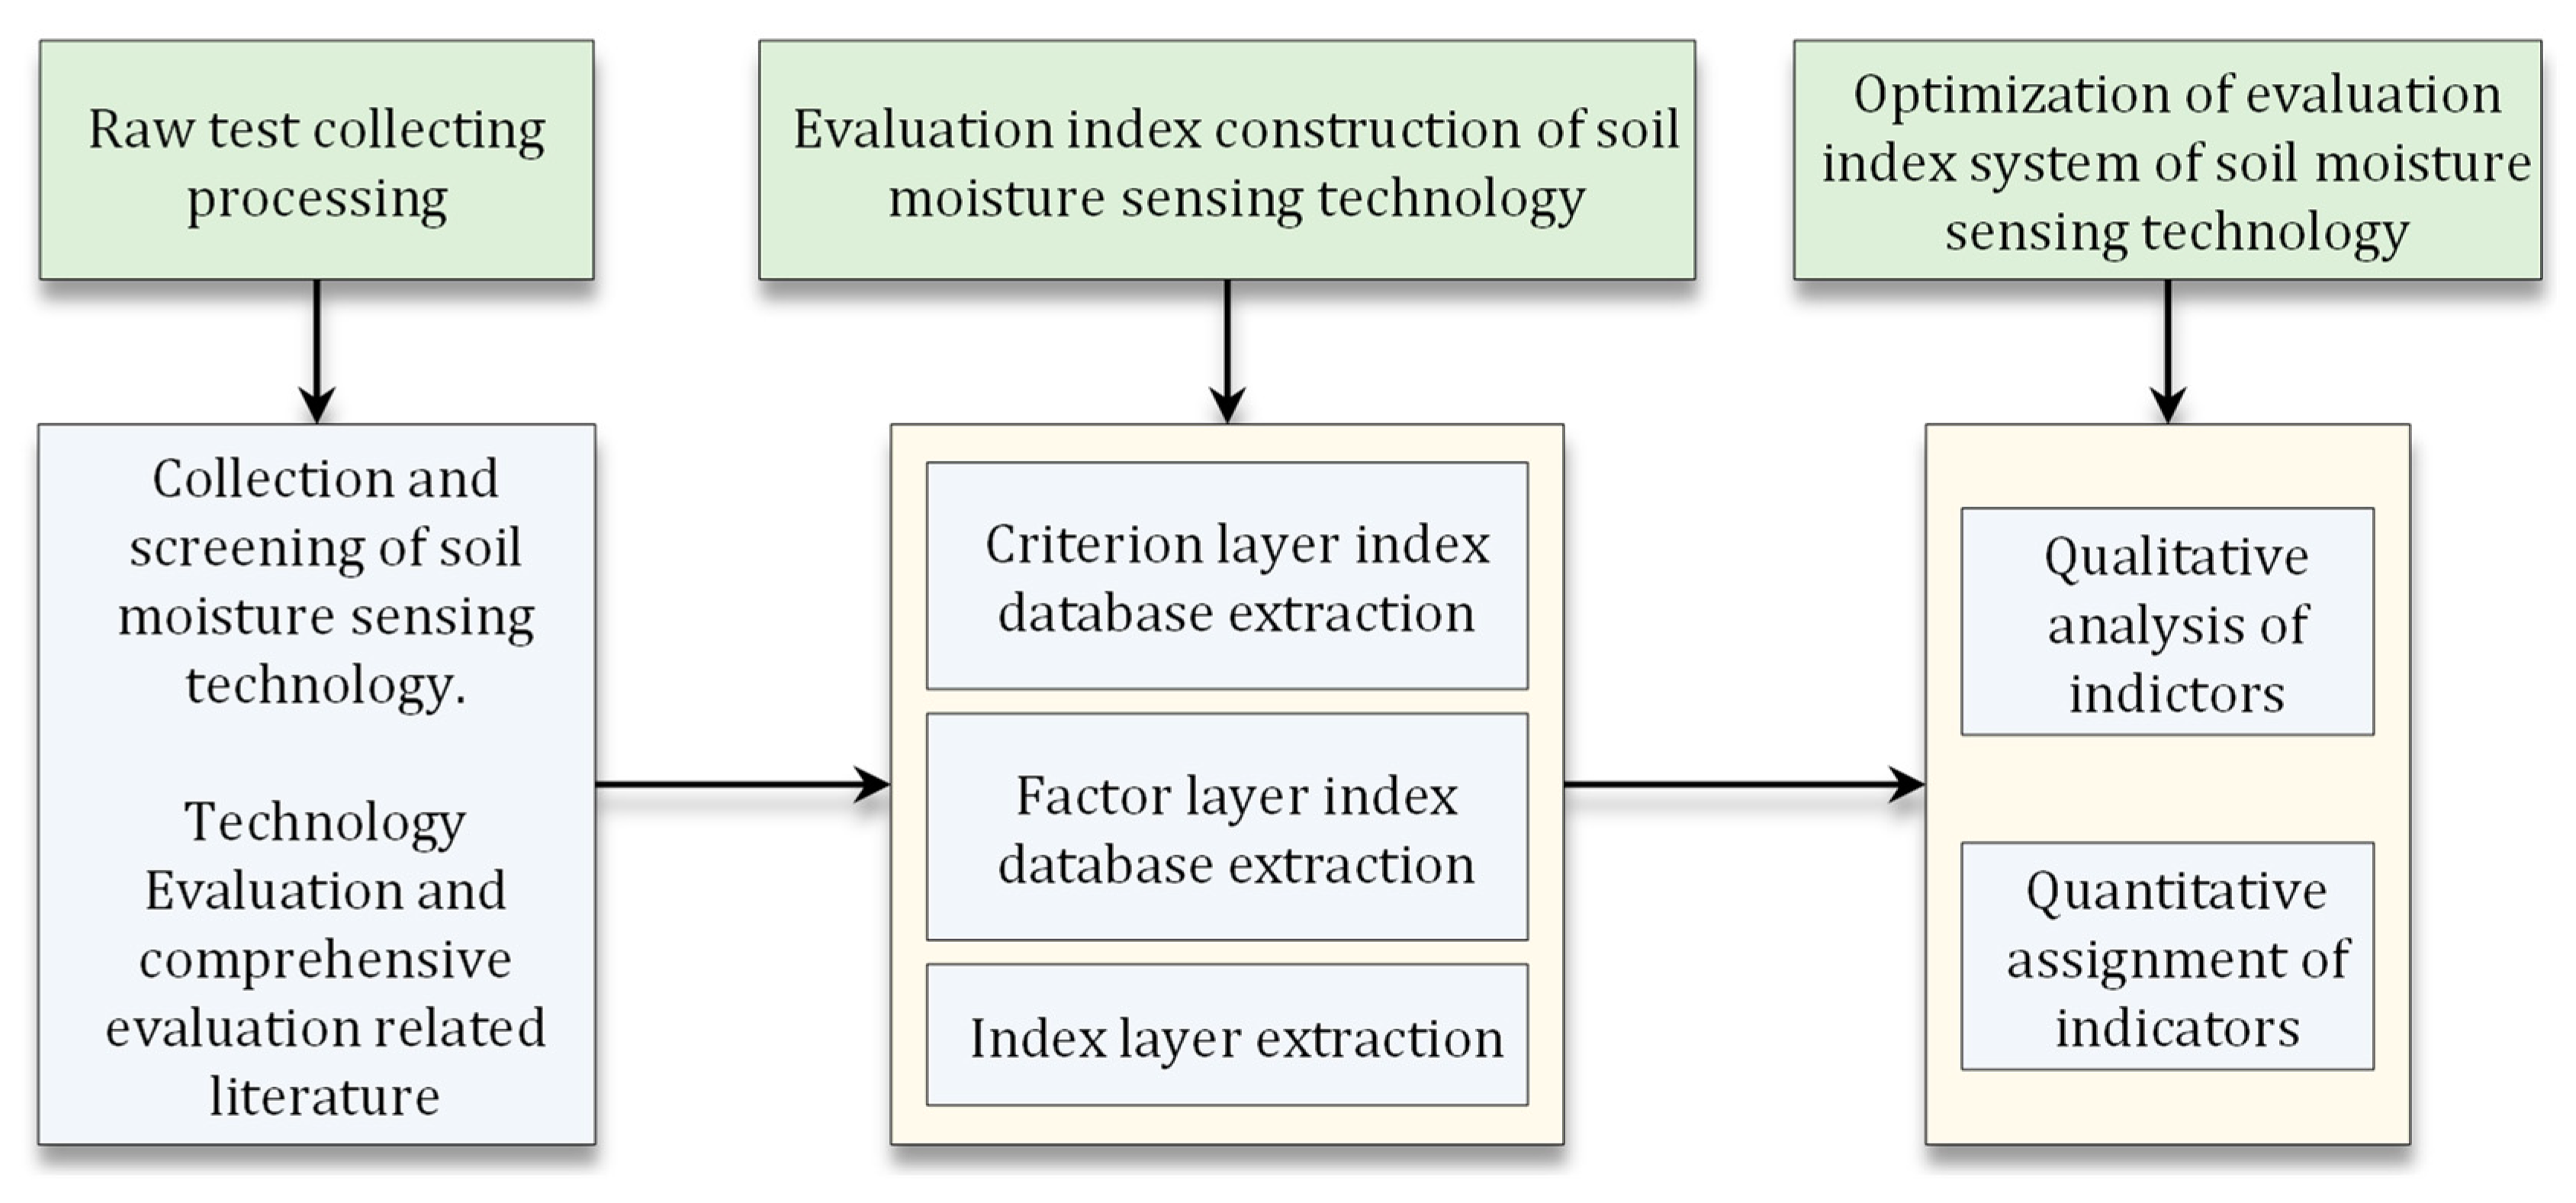
2.2.3. Construction Method of Evaluation Index System

According to the characteristics of the soil water sensing technology, influencing factors, and the selection principles of evaluation indices, the selection of evaluation factors should not only meet the technical evaluation strategic standards at a macro-industry level but also reflect the requirements of micro users at the project and operational level, effectively integrating the evaluation index system.
Forty-six articles were found by searching the keywords “soil water sensing technology,” “technology evaluation,” and “comprehensive evaluation.” The framework of the proposed comprehensive technology evaluation index system was constructed considering the results presented in the existing studies. Consequently, the Delphi method was employed to screen and optimize evaluation indices of the proposed soil water sensing technology, as shown in Figure 2.
The presented results assist technology exporters who reference academic studies, agricultural IoT companies, and technology users who mainly reference agricultural business entities, family farms, farmers cooperatives, corporate farms, leading planting enterprises, and high-level managers who reference the relevant government departments. Various stakeholders in Daejeon use the environmental information technology evaluation for different purposes. Consequently, certain stakeholders including six IoT information technology specialists (P1) from scientific research institutions, 20 cooperative heads (P2) involved in agricultural cultivation, 20 people in the field of farming technology (P3), six agricultural IoT technology suppliers (P4), and six government technical personnel from the industry sector (P5) were selected to participate in the survey. When over 70% of the personnel of a certain category considered that an indicator should be selected, the personnel of this category were deemed to have approved that indicator. An indicator was selected when the experts of three or more categories had approved it.
Index optimization and quantification were completed considering the basic index system. Experts measured each indicator based on the seven principles for its inclusion, which were developed in the construction principles of the evaluation index system. An indicator was retained when it conformed to five or more principles. The degree of recognition and standards appropriate for the stakeholders revealed that many indicators could not meet the important criteria, which were being measurable (M), sensitive (V), typical (T), controllable (C), responsible (R), or impossible to quantify. Indicators that did not deal with the soil moisture sensing technology, or incorporated the content of overlapping indicators, were deleted. After determining the evaluation index system, indices were quantified to score the standard.

2.3. Weight Calculation Method of Index System

The AHP [24] and Delphi [25] methods were used to determine the weights of each indicator. The minimum number of appropriate experts is seven to eight [26], with more than 10 experts being able to obtain a moderately accurate outcome. Therefore, we designed questionnaires for 10 experts from the categories P1–5, who had at least 10 years of experience in the use of agricultural IoT. The weight analysis of each index was performed based on the nine-degree relative importance score of the AHP method. The relative importance evaluation was divided into nine grades (1–9 points), while the comprehensive evaluation results were divided into five grades. The evaluation process was as follows:
The indices are compared pair by pair, and the comparison results are written in a matrix form based on the AHP method constructed using the judgment matrix, as shown in Equation (1), where ui is the evaluation index ( u i U ( i = 1 , 2 , n ) ), and uij is the relative importance of ui to uj (j = 1, 2, …, m). The value is expressed on a scale in the range of 1–9, where 9 indicates an increased importance and 1 indicates the equality. The higher the score, the higher is the importance. When uji = 1/ uij, then we can write,
U = ( U 1 U 2 U M ) ( u 11 u 12 u 1 m u 21 u 22 u 2 m u m 1 u m 2 u m m )
The judgment matrix is employed to calculate the weight of factor i (Wi1) using Equations (2)–(6), where m is the number of factors in row i or column j of the matrix, λmax is the maximum eigenvalue of the matrix, Wi is the weight of factor i in the comprehensive evaluation index level, and Wi1 is the final weight of factor i at the entire level, which can be calculated as the product of the weight of each factor and that of the corresponding element.
M i = j = 1 m u i j i = 1 m j = 1 m u i j
M = [ M 1 M 2 M i ]
λ max = ( U M ) i n M i
W i = ( U M ) i i = 1 m ( U M ) i
W 1 = [ W 1 1 W 1 2 W 1 i ]
The judgment matrix must be evaluated for consistency because of the subjectivity of the AHP method, as expressed in Equation (7). A random consistency ratio (CR) of less than 0.1 indicates a satisfactory consistency; otherwise, the matrix must be adjusted. CI is an indicator of the judgment matrix consistency, as expressed in Equation (8). This is the same when CI = 0; however, when CI ≠ 0, the results are not consistent.
C R = C I R I
C I = λ max n n 1

2.4. Grade of Comprehensive Evaluation Results

In particular, levels 3–5 are appropriate for technological classification. After expert consultation, the evaluation results of the soil moisture sensing technology in the field were divided into five levels together with evaluation indexes, calculation methods, and classification standards, as shown in Table 2.

2.5. Empirical Program Design

In this study, the performance of the capacitance (M4) and resistance (M5) soil moisture sensing methods, which are typically used in the market, were evaluated in different areas. Family farms are typical large-scale farmers in China, which mainly employ soil moisture sensing technologies in agriculture. Therefore, a family farm was chosen as the scoring subject in this study. Six types of soil in Shandong Province include brown, cinnamon, tidal, sandy ginger black, saline-alkali, and paddy soils. For instance, paddy soil is mainly planted with rice, and saline-alkali soil is planted with sunflower and wolfberry. To eliminate the differences in planting crops, we selected three farms in each of brown, cinnamon, tidal, and sandy ginger black soils that could all grow corn. The specific conditions of each farm are listed in Table 3.

3. Results and Discussion

3.1. Determination of Evaluation Index System

After collecting and screening the soil water sensing technologies, including technical and comprehensive evaluations, the second, third, and fourth indices of the basic index system were selected, as shown in Table 4. Sixty-two questionnaires on a technical basic index system were distributed to the participants, sixty-two were retrieved with a recovery rate of 100%, and 10 were interviewed onsite. The survey and interview results are listed in Table 4.
Based on the results shown in Table 4, the indices were selected and optimized for the comprehensive evaluation of soil water sensing technology in the field. C6 is changed to the soil type and shall apply C6*, C7 to apply the ambient temperature C7*, C8 to the existing facilities ability C8*, C9 to operation complexity C9*, and C10 to operational dependence C10*. B4 is the renamed use efficiency B4*. C11 is changed to an increasing efficiency C11*, C12 to save labor C12*, C13 to water-saving irrigation benefit C13*. B8, B9, B12, C19, C20, C23, C24, and C25 are deleted. Five new indices are named technology to implement supply chain stability C17–1, technological environment stability using C17–2, further development to disable risk technology C17–3, technical implementation of the natural environment risk C18–1, and technology implementation of artificial environment risk C18–2. Moreover, codes are used instead of index names. Finally, 23 level–4 indicators were selected. The characteristics of the indicators and scoring instructions were determined using the technical characteristics listed in Table 1. The results are listed in Table 5.

3.2. Weight Results of Comprehensive Evaluation

Ten questionnaires were disseminated and collected, with a recovery rate of 100%. Figure 3 presents the index weight results after applying the AHP method, where G is the overall target with a weight of 1.0000.

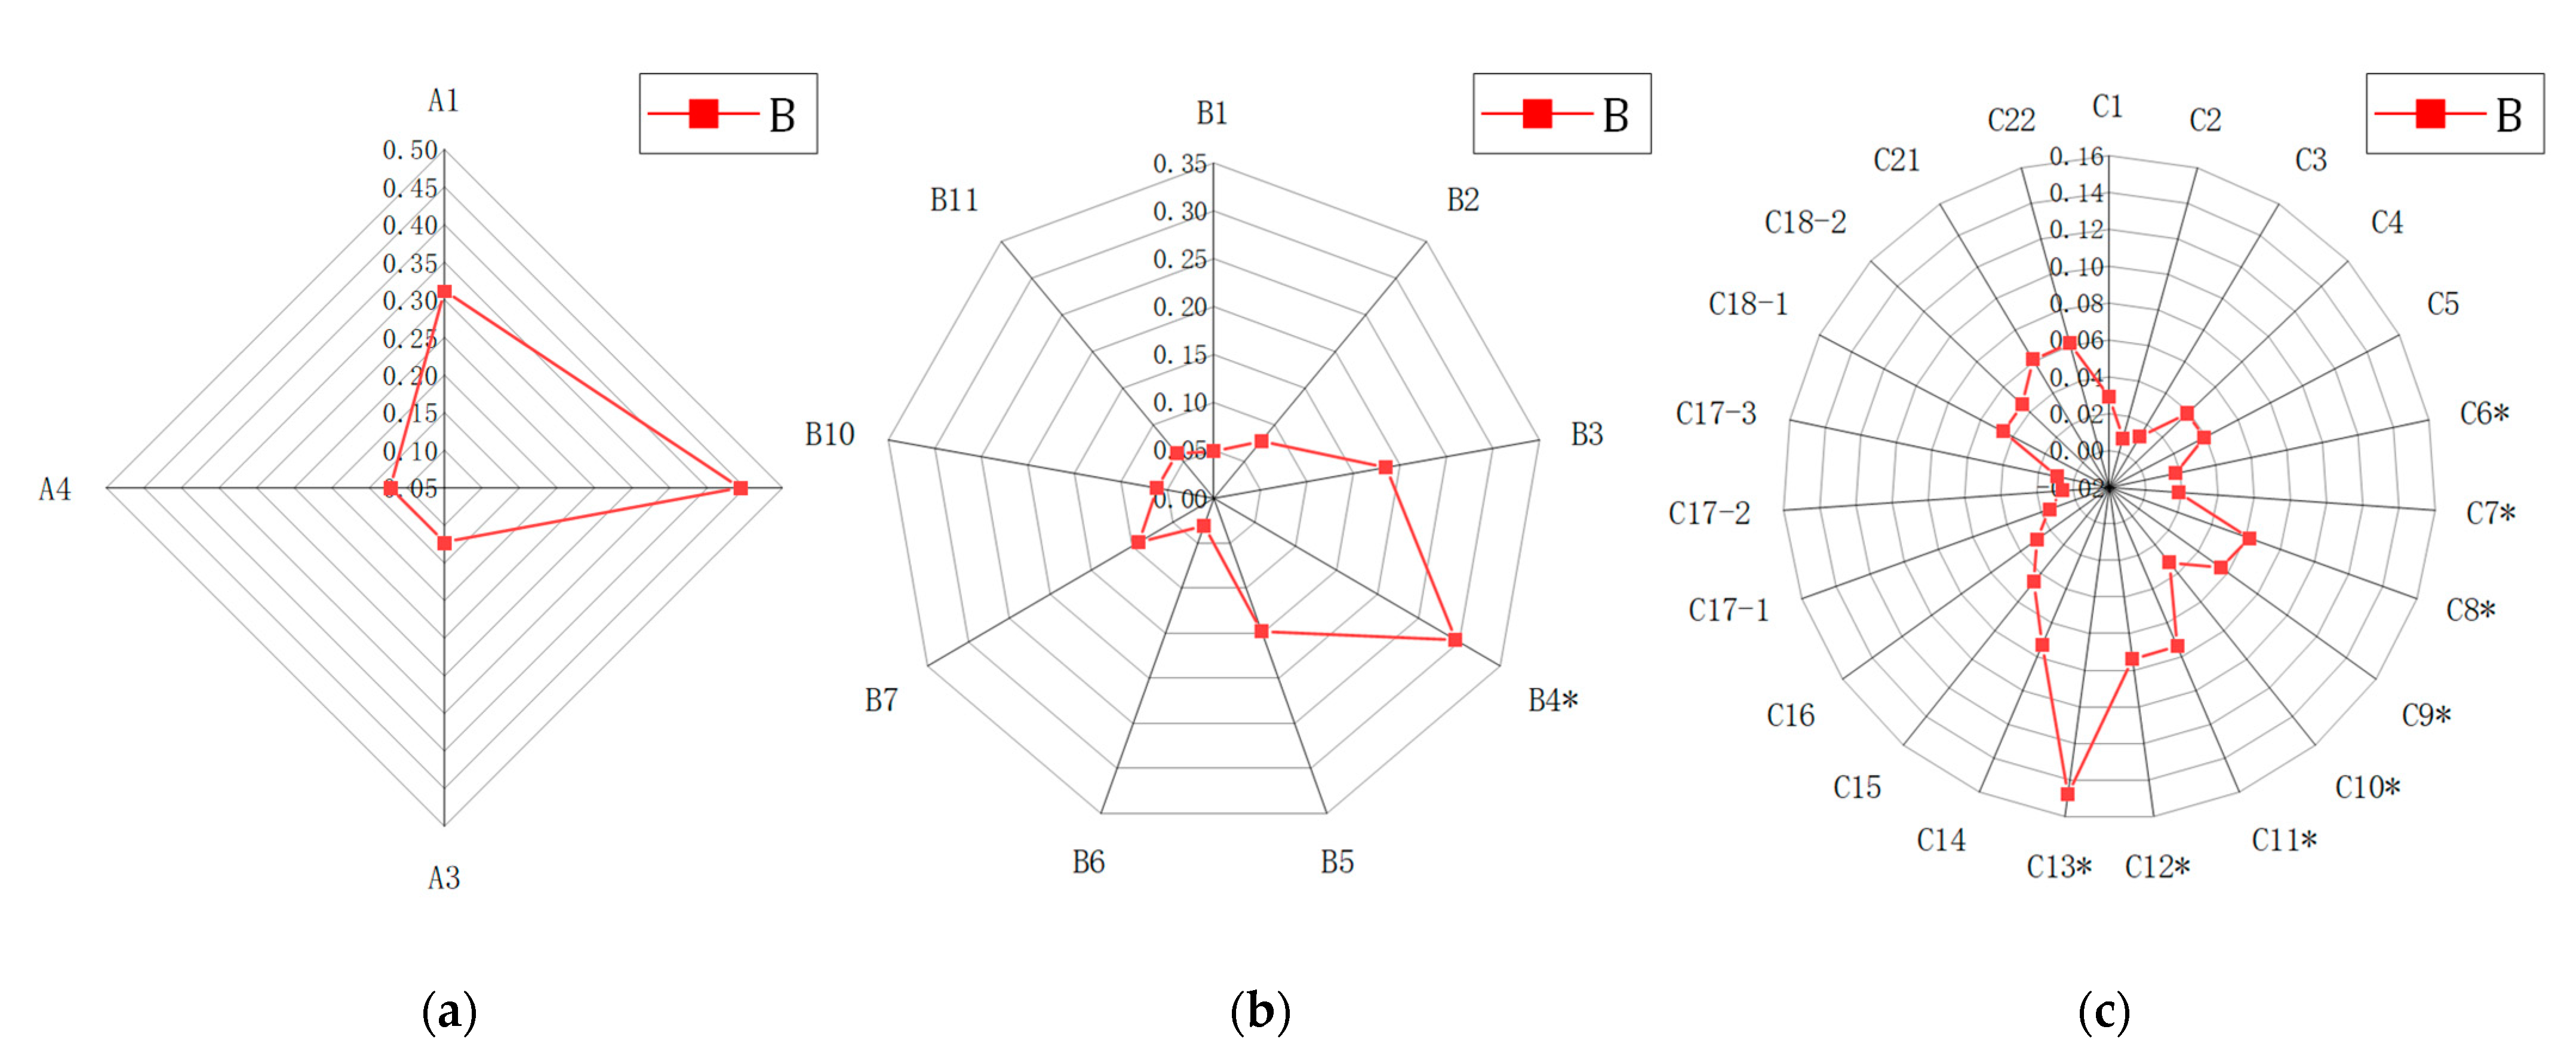
3.3. Comprehensive Evaluation Influence Weight Analysis

The calculated scoring weights of 10 experts revealed that the proportion of economic benefits in the entire index system was 0.44351, accounting for approximately half of the total; thus, the ultimate purpose of the proposed technology is to improve the economic benefits. The weight distributions of the second, third, and fourth indices are shown in Figure 4.
The applicability of the proposed technology is even more important. Applicability refers to the extent to which a product meets the needs of users. In part 11 of the standard ISO9241 (Guide on Usability, 1998), applicability is defined as follows: “the effectiveness, efficiency, and satisfaction of a given user using a product to achieve a given goal in a given context.” The applicability of a technology is an important factor in the application and promotion of mature technological industries [27].
As for the economic benefits, an increase in the yield and efficiency accounted for the largest proportion of all indicators. The evaluation results showed that the proportion of water-saving irrigation benefits was 0.148, which was the largest among all the indicators. Moreover, the use of information technology is intended to increase the efficiency of agricultural production and output, and simultaneously reduce inputs. Many existing studies have shown that dynamic irrigation yields obvious gains compared to uniform irrigation [28], and improper irrigation time for cotton can lead to a yield loss [29]. Dioudis conducted experiments for 2 years and proved that the use of TDR sensors to monitor the soil moisture and realize water-saving irrigation could significantly reduce management costs, including irrigation water, manpower, energy, etc. [30], and the sensor-based method was an excellent irrigation scheduling strategy [31]. Moreover, the proportion of water-saving irrigation evaluation in this study is consistent with those presented in the existing studies on the benefits of water-saving.
As for the risk analysis, the risks of implementation outweigh those of the technology itself. The soil moisture sensing technology is a conventional technology with an excellent maturity and stability. Consequently, the ability of the operator and the risk of the application environment in the implementation can significantly affect the efficiency of the application. As for the policy management, the state subsidy policy is also a factor in the adoption of technologies for agricultural operators.

3.4. Empirical Research

3.4.1. Comprehensive Results in One Farm

The comprehensive scores of the capacitance (M4) and resistance (M5) soil water sensing methods are shown in Table 6.
As shown in Table 6, the comprehensive evaluation results of the soil water sensing methods in corn planting were 0.73991 and 0.73836, respectively. Thus, M4 performed slightly better than M5. Both methods are mature with comparable market prices. In the corn planting scenario, M4 exhibits a better effect on the soil profile water monitoring considering its technical characteristics [5], which is conducive to monitoring the water changes near the deep roots of corn. The multi-depth real-time system introduced by Sui et al. for monitoring corn, soybean, and cotton using capacitive sensors could guide irrigation scheduling [32], indicating that soil moisture sensors could effectively guide water-saving irrigation and obtain economic benefits, which is consistent with the evaluation results of this study.

3.4.2. Comprehensive Results in All Farms

Results of evaluation of 12 farms are below figure.
Figure 5 illustrates that the evaluation results of M4 and M5 were both above 0.7, indicating that the farmers recognized the performance of the two methods. In gray-ginger black soil, M5 is significantly superior to M4 because M4 is more sensitive to the physical properties of the gray-ginger black soil [33]. In the brown, cinnamon, and tidal soils, a small difference exists between them, which is determined by the characteristics of the two methods [34,35].
Figure 6 shows that the score of the two methods in unfortunate economic conditions is the lowest (0.702) for the farmers with a poor awareness of information technology (Heze Yuncheng), whereas the highest score (0.755) is achieved by the Weifang Anqiu region. Therefore, the score of farms with acceptable economic conditions and farmers’ awareness of information technology is 5.3% higher than that of farms with poor economic conditions. In addition, Linyi Linshu is a region with poor economic conditions that gains a score value of 0.717. The score values for the regions with moderate economic conditions and farmers’ information technology awareness are in the range of 0.724–0.731, while those of the regions with acceptable economic conditions and farmers’ information technology awareness range from 0.740 to 0.751. Therefore, the choice of the two methods largely depends on the regional economic conditions and farmers’ awareness of information technology [36,37,38,39].

4. Conclusions

In this study, a comprehensive method was introduced to evaluate the performance of a soil moisture sensing technology applied to a field environment. First, the principles, methods, and influencing factors of the soil water sensing technology were examined and analyzed, and an evaluation index system was preliminarily established. The Delphi method was used to qualitatively and quantitatively screen the proposed evaluation index system. The irrelevant and similar indices were removed and combined, respectively. Finally, four second-level indices and 23 fourth-level indices were retained, and the AHP and Delphi methods were used to construct index weights. A comprehensive evaluation model of the soil moisture sensing technology was used in 12 farms in Shandong Province to apply the comprehensive high-standard field environmental information technology. The results showed that M4 (average score = 0.734) based on the capacitance method was slightly worse than M5 (average score = 0.736) based on the resistance method, both of which were above the medium level. However, M5 outperformed M4 in the sand ginger black soil. Therefore, the method is generally applicable and can provide certain economic benefits. Simultaneously, economic conditions and farmers’ awareness of information technology significantly affect the evaluation scores of the two methods. The score of farms with acceptable economic conditions and farmers’ awareness of information technology is 5.3% higher than that of farms with poor economic conditions. The results provide agricultural operators with a guidance and suggestions in terms of the selection of an appropriate soil moisture sensing technology. The next study will be conducted to examine the differences in the application of information technology in different fields, optimize the evaluation index system, and evaluate other types of field information technologies, such as weather stations, UAVs, pest monitoring, and intelligent irrigation.

Author Contributions

L.Y. and S.T. wrote and edited the manuscript; W.G. proposed the idea; Y.R., Y.H. and R.R.S. administered the project and reviewed and edited the manuscript; X.L. carried out the empirical research. All authors have read and agreed to the published version of the manuscript.

Funding

This research was funded by the Research and Development Program of Shandong Province (grant number 2019GSF111035) and and the Open Project Program of National Engineering Laboratory for Agri-product Quality Traceability, Beijing Technology and Business University (BTBU, No. AQT-2019-YB10).

Institutional Review Board Statement

Not applicable.

Informed Consent Statement

Not applicable.

Data Availability Statement

Not applicable.

Conflicts of Interest

The authors declare no conflict of interest.

References

  1. Jackson, T.J. Measuring surface soil moisture using passive microwave remote sensing. Hydrol. Process. 1993, 7, 139–152. [Google Scholar] [CrossRef]
  2. Chow, L.; Xing, Z.; Rees, H.W.; Meng, F.R.; Monteith, J.; Stevens, L. Field performance of nine soil water content sensors on a sandy loam soil in New Brunswick, Maritime Region, Canada. Sensors 2009, 9, 9398–9413. [Google Scholar] [CrossRef] [PubMed]
  3. Gardner, W.; Kirkham, D. Determination of soil moisture by neutron scattering. Soil Sci. 1952, 73, 391–402. [Google Scholar] [CrossRef]
  4. Bogena, H.R.; Huisman, J.A.; Güntner, A.; Hübner, C.; Kusche, J.; Jonard, F.; Vey, S.; Vereecken, H. Emerging methods for noninvasive sensing of soil moisture dynamics from field to catchment scale: A review. Wiley Interdiscip. Rev. Water 2015, 2, 635–647. [Google Scholar] [CrossRef] [Green Version]
  5. Yu, L.; Gao, W.; Shamshiri, R.R.; Tao, S.; Ren, Y.; Zhang, Y.; Su, G. Review of research progress on soil moisture sensor technology. Int. J. Agric. Biol. Eng. 2021, 14, 32–42. [Google Scholar]
  6. Yin, Z.; Lei, T.W.; Yan, Q.H.; Chen, Z.P.; Dong, Y.Q. A near-infrared reflectance sensor for soil surface moisture measurement. Comput. Electron. Agric. 2003, 99, 101–107. [Google Scholar] [CrossRef]
  7. Hassan-Esfahani, L.; Torres-Rua, A.; Jensen, A. Assessment of surface soil moisture using high-resolution multi-spectral imagery and artificial neural networks. Remote Sens. 2015, 7, 2627–2646. [Google Scholar] [CrossRef] [Green Version]
  8. Shamshiri, R.R.; Weltzien, C. Development and field evaluation of a multichannel LoRa sensor for IoT monitoring in berry orchards. 41. GIL-Jahrestagung. In Informations- und Kommunikationstechnologien in Kritischen Zeiten; Gesellschaft für Informatik: Bonn, Germany, 2021; pp. 289–294. [Google Scholar]
  9. Sui, R.; Pringle, H.C.; Barnes, E.M. Soil moisture sensor test with Mississippi Delta soils. Trans. ASABE 2019, 62, 363–370. [Google Scholar] [CrossRef]
  10. Lin, D.; Lee, C.K.M.; Lin, K. Research on effect factors evaluation of internet of things (IOT) adoption in Chinese agricultural supply chain. In Proceedings of the 2016 IEEE International Conference on Industrial Engineering and Engineering Management (IEEM), Bali, Indonesia, 5–7 December 2016; pp. 612–615. [Google Scholar]
  11. Chen, X.R.; Jia, J.D.; Gao, W.L. Selection of an index system for evaluating the application level of agricultural engineering technology. Pattern Recognit. Lett. 2018, 109, 12–17. [Google Scholar] [CrossRef]
  12. Asghari, P.; Rahmani, A.M.; Javadi, H. Internet of Things applications: A systematic review. Comput. Netw. 2019, 148, 241–261. [Google Scholar] [CrossRef]
  13. Li, L.; Zhang, L.; Li, D. Indicators selecting model for applicability evaluation of greenhouse intelligent control system. Trans. CSAE 2012, 28, 143–153. [Google Scholar]
  14. Yuan, X.; Kong, Q.; Li, Q. Evaluation method for application of internet of things for aquaculture. Trans. CSAE 2015, 31, 258–265. [Google Scholar]
  15. Kotamäki, N.; Thessler, S.; Koskiaho, J.; Hannukkala, A.O.; Huitu, H.; Huttula, T.; Havento, J.; Järvenpää, M. Wireless in-situ sensor network for agriculture and water monitoring on a river basin scale in Southern Finland: Evaluation from a data user’s perspective. Sensors 2009, 9, 2862–2883. [Google Scholar] [CrossRef] [PubMed]
  16. Peng, J.; Loew, A.; Merlin, O.; Verhoest, N.E. A review of spatial downscaling of satellite remotely sensed soil moisture. Rev. Geophys. 2017, 55, 341–366. [Google Scholar] [CrossRef]
  17. Zhang, D.; Zhou, G. Estimation of soil moisture from optical and thermal remote sensing: A review. Sensors 2016, 16, 1308. [Google Scholar] [CrossRef] [PubMed] [Green Version]
  18. Yu, C.; Yao, Y.; Hayes, G. Quantitative assessment of groundwater vulnerability using index system and transport simulation, Huangshuihe catchment, China. Sci. Total Environ. 2010, 408, 6108–6116. [Google Scholar] [CrossRef] [PubMed]
  19. Dale, V.H.; Beyeler, S.C. Challenges in the development and use of ecological indicators. Ecol. Indic. 2001, 1, 3–10. [Google Scholar] [CrossRef] [Green Version]
  20. Lorenz, C.M.; Gilbert, A.J.; Cofino, W.P. Indicators for transboundary river management. Environ. Manag. 2001, 28, 115–129. [Google Scholar] [CrossRef] [Green Version]
  21. Karr, J.R. Biological integrity: A long-neglected aspect of water resource management. Ecol. Appl. 1991, 1, 66–84. [Google Scholar] [CrossRef]
  22. Lin, T.; Lin, J.; Cui, S. Using a network framework to quantitatively select ecological indicators. Ecol. Indic. 2009, 9, 1114–1120. [Google Scholar] [CrossRef]
  23. Beuscart-Zephir, M.C.; Brender, J.; Beuscart, R. Cognitive evaluation: How to assess the usability of information technology in healthcare. Comput. Methods Programs Biomed. 1997, 54, 19–28. [Google Scholar] [CrossRef]
  24. Song, H.; Lu, B.; Ye, C.; Li, J.; Zhu, Z.; Zheng, L. Fraud vulnerability quantitative assessment of Wuchang rice industrial chain in China based on AHP-EWM and ANN methods. Food Res. Int. 2021, 140, 109805. [Google Scholar] [CrossRef] [PubMed]
  25. Sourani, A.; Sohail, M. The Delphi method: Review and use in construction management research. Int. J. Constr. Educ. Res. 2015, 11, 54–76. [Google Scholar] [CrossRef]
  26. Horner, K.; Islam, M.; Flygare, L. Basic principles for use of dental cone beam computed tomography: Consensus guidelines of the European Academy of Dental and Maxillofacial Radiology. Dentomaxillofac. Radiol. 2009, 38, 187–195. [Google Scholar] [CrossRef] [PubMed] [Green Version]
  27. Garg, A.; Munoth, P.; Goyal, R. Application of soil moisture sensor in agriculture. In Proceedings of the International Conference on Hydraulic, Pune, India, 8–10 December 2016; pp. 8–10. [Google Scholar]
  28. Vellidis, G.; Liakos, V.; Liang, X. On-farm testing of soil moisture sensor-based dynamic variable rate irrigation. In Precision Agriculture ’21; Wageningen Academic Publishers: Wageningen, The Netherlands, 2021; pp. 475–499. [Google Scholar]
  29. Vellidis, G.; Tucker, M.; Perry, C. A Soil moisture sensor-based variable rate irrigation scheduling system. In Precision Agriculture ’13; Wageningen Academic Publishers: Wageningen, The Netherlands, 2013; pp. 713–720. [Google Scholar]
  30. Dioudis, P.S.; Filintas, A.T.; Papadopoulos, A.H. Corn yield response to irrigation interval and the resultant savings in water and other overheads. J. Irrig. Drain. 2009, 58, 96–104. [Google Scholar] [CrossRef]
  31. Filho, J.F.D.C.L.; Ortiz, B.V.; Damianidis, D. Irrigation scheduling to promote corn productivity in central Alabama. J. Agric. Sci. 2020, 12, 34. [Google Scholar] [CrossRef]
  32. Sui, R. Use of soil moisture sensors for irrigation scheduling. Presented at 2016 Irrigation Show & Education Conference, Las Vegas, NV, USA, 6–7 December 2016. [Google Scholar]
  33. Mittelbach, H.; Lehner, I.; Seneviratne, S.I. Comparison of four soil moisture sensor types under field conditions in Switzerland. J. Hydrol. 2012, 430, 39–49. [Google Scholar] [CrossRef]
  34. Kumar, M.S.; Chandra, T.R.; Kumar, D.P.; Manikandan, M.S. Monitoring moisture of soil using low-cost homemade Soil moisture sensor and Arduino UNO. In Proceedings of the 2016 3rd International Conference on Advanced Computing and Communication Systems (ICACCS), Coimbatore, India, 22–23 January 2016; pp. 1–4. [Google Scholar]
  35. González-Teruel, J.D.; Torres-Sánchez, R.; Blaya-Ros, P.J.; Toledo-Moreo, A.B.; Jiménez-Buendía, M.; Soto-Valles, F. Design and calibration of a low-cost SDI-12 soil moisture sensor. Sensors 2019, 19, 491. [Google Scholar] [CrossRef] [PubMed] [Green Version]
  36. Wang, Y.; Jin, L.; Mao, H. Farmer cooperatives’ intention to adopt agricultural information technology—Mediating effects of attitude. Inf. Syst. Front. 2019, 21, 565–580. [Google Scholar] [CrossRef]
  37. Pathak, S.; Shah, D.; Shah, N.; Shah, V.; Ughade, S. Farmer awareness and cost estimation. In Proceedings of the 2nd International Conference on Advances in Science & Technology (ICAST), Mumbai, India, 8–9 April 2019. [Google Scholar]
  38. Skevas, T.; Kalaitzandonakes, N. Farmer awareness, perceptions and adoption of unmanned aerial vehicles: Evidence from Missouri. Int. Food Agribus. Manag. Rev. 2020, 23, 469–485. [Google Scholar] [CrossRef]
  39. Yu, L.; Ren, Y.; Tao, S.; Gao, W.; Song, X.; Zhang, X.; Yang, S. Eco-climate intelligent monitoring system of an agricultural science-and-technology park based on internet of things. In Proceedings of the 2021 IEEE International Conference on Artificial Intelligence and Computer Applications (ICAICA), Dalian, China, 28–30 June 2021; pp. 708–715. [Google Scholar]
Figure 1. Internet of Things (IoT) monitoring of soil moisture data using two capacitive soil moisture probes interfaced with a WiFi datalogger that has been custom-built to withstand harsh field conditions.
Agriculture 11 01116 g001
Figure 2. Construction process of the evaluation index system.
Agriculture 11 01116 g002
Figure 3. Index weight tree. The indicators marked with * refer to the adjusted indicators.
Agriculture 11 01116 g003
Figure 4. Weight distribution of the second (a), third (b), and fourth (c) indices.
Agriculture 11 01116 g004
Figure 5. Evaluation results of the two sensing methods in different soil areas.
Agriculture 11 01116 g005
Figure 6. Average score of M4 + M5.
Agriculture 11 01116 g006
Table 1. Soil moisture sensing technology methods.
MethodsTechnical NameMeasuring PrincipleTechnical Characteristics
Dielectric method [5] The soil dielectric constant is indirectly measured to determine soil moisture content.Advantages: fast, convenient, pollution-free, precise measurement, etc.
Disadvantages: expensive, often needs specific calibration for soil.
Time domain reflection method (TDR) (M1)TDR can be measured because velocity changes with the dielectric permittivity of physical phenomena.Advantages: easy to operate, fast measurement, high accuracy, automation without disturbance, etc.
Disadvantages: expensive, need for checking and calibration, distance measurements.
Frequency domain reflectometry (FDR) (M2)FDR uses the electromagnetic pulse principle to determine the soil dielectric constant of a medium.Advantages: fast, continuity, automation, wide range, less calibration.
Disadvantages: vulnerable to soil texture, bulk density, and the influence of salt content in low-frequency operation. Realization of the soil profile of moisture measurement is difficult.
Standing wave principle (SWR) (M3)SWR is based on high-frequency electromagnetic wave propagation along the transmission line; owing to the probe impedance and impedance mismatch, a standing wave is formed on a transmission line, changing the voltage amplitude on both ends of the of transmission line to realize the soil moisture measurement.Advantages: high precision, fast and continuous measurement, low cost, can be applied to a variety of soil moisture measurement systems.
Disadvantages: affected by the soil salinity, measurement precision uses the TDR method.
Capacitance method (M4)This method is based on the change of dielectric constant of the object being measured and associated changes in capacitance.Advantages: timely and accurate measurements.
Disadvantages: affected by the soil salinity.
Resistance method (M5)This method measures the resistance between electrodes inserted into a medium. Humidity is determined, and then a calibration curve is developed using voltage–water ratios to estimate the soil water content.Advantages: low cost, anti-corruption, adjustable point embedding, and automatic monitoring.
Disadvantages: destroys soil structure, making it vulnerable to the influence of the soil temperature, salinity, and soil texture for calibration purposes.
Remote sensing method [16] The soil surface is monitored using remote sensor measurements of reflected or emitted electromagnetic energy, which is analyzed to establish the relationship between the soil moisture and soil water content.Advantages: all-day, all-weather, and multi-polar applications.
Hyperspectral remote-sensing method (M6)Hyperspectral remote sensing technology can directly establish a relationship between the soil moisture and soil reflectance to monitor the soil moisture.Advantages: high spectral resolution within a specific band (range).
Microwave remote sensing method (M7)The microwave remote sensing method uses the soil moisture contrast in the dielectric constant to invert the soil moisture.Advantages: all-day, all-weather, multi-polar applications, high resolution, penetrability, sensitivity to the soil moisture content.
Disadvantages: The vegetation and soil moisture monitoring precision are low.
Heat pulse sensing method [17]Heat pulse sensing method (M8)The heat pulse method uses the linear relationship between soil moisture content and volumetric heat capacity.Advantages: accuracy, less influenced by salinity.
Note: M1 denotes the TDR code. The technical name is replaced by the corresponding code.
Table 2. Comprehensive evaluation grade.
LevelCommentsScoreEvaluation Class
AOptimal≥0.90advanced, reasonable applicability, excellent economic benefits, ease of use, and acceptable environmental adaptability
BGood0.90 > B ≥ 0.75more advanced better applicability, certain economic benefits, ease of use, and acceptable environmental adaptability
CMedium0.75 > C ≥ 0.60advanced, applicable, certain economic benefits, ease of use, and acceptable environmental adaptability
DPoor0.60 > D ≥ 0.45unconvincing applicability, economic benefits, difficult to use, and weak environmental adaptability
EBadE < 0.45bad applicability, no economic benefits, difficult to use, and bad environmental adaptability
Table 3. Farm and cropping characteristics.
Soil Type CharacteristicsFarm NameFarm Characteristics: Acreage, Planting Methods, Local Economic Conditions, The Farmer’s Information Technology Consciousness
Brown soil: deep soil, moderate texture, good drainage, non-salinization.Yantai laizhou160 square yards, corn and peanut intercropping base, 10 years, reasonable, strong.
Zibo yiyuan640 square yards, corn and peanut intercropping base, 15 years, reasonable, strong.
Linyi linshu480 square yards, corn and wheat rotation base, 10 years, poor, poor.
Cinnamon soil: loam, deep soil, good configuration, water retention and fertility, drainage, non-salinization.Jinan zhangqiu800 square yards, corn and wheat rotation base, 15 years, reasonable, strong.
Zaozhuang tengzhou640 square yards, corn and wheat rotation base, 10 years, medium, medium.
Binzhou wudi480 square yards, corn and wheat rotation base, 14 years, medium, medium.
Tidal soil: flat terrain, deep soil, also known as alluvial soil or meadow soil.Dongying lijin1280 square yards, corn and wheat rotation base, 20 years, good, strong.
Jining jiaxiang1280 square yards, corn and wheat rotation base, 15 years, medium, medium.
Heze yuncheng240 square yards, corn and peanut intercropping base, 15 years, poor, poor.
Sand ginger black soil: plough layer thick and solid, soil permeability is poor.Qingdao pingdu160 square yards, corn and wheat rotation base, 10 years, reasonable, strong.
Weifang anqiu800 square yards, corn and wheat rotation base, 20 years, reasonable, strong.
Jining weishan320 square yards, corn and wheat rotation base, 12 years, medium, medium.
Table 4. Soil water sensing technology index system questionnaire.
Second-Level IndexThree-Level IndexFour-Level IndexRespondentsStandard “Fit”
Technical advantages (A1)Technology advanced (B1)The technical level (C1)P1, P2, P3, P4, P5MVPTCRS
Intellectual property rights situation (C2)P1, P2, P3, P4, P5MVPTCRS
Standard conditions (C3)P1, P2, P3, P4, P5MVPTCRS
Technical maturity (B2)Research and application stage (C4)P1, P2, P3, P4, P5MVPTCRS
Stability of the technology (C5)P1, P2, P3, P4, P5MVPTCRS
Technical applicability (B3)Diffusion effect (C6)P1, P2, P3, P4, P5MVCRS
Matching of relevant technology (C7)P1, P2, P3, P4, P5MVPTCS
Degree of practicality (C8)P1, P2, P3, P4, P5MVPTCRS
Formation of the technological advantag e (C9)P4, P5MVCRS
Scalability of technology (C10)P1, P2, P3, P4, P5MVPTCS
Economic benefits (A2)Efficiency (B4)Cost of investment (C11)P1, P2, P3, P4, P5MVPTCRS
Profit margin (C12)P2, P3, P4MVPTCRS
Investment efficiency (C13)P2, P3, P4MVPTCRS
Use cost (B5)Cost of equipment (C14)P2, P3, P5MVPTCS
Operational costs (C15)P1, P2, P3, P4, P5MVPTCS
Personnel training (C16)P1, P2, P3, P4, P5MVPRS
Risk analysis (A3)Technical risk (B6)Technical maturity risk (C17)P2, P3, P4MVPCS
Implementation risk (B7)Implementation risk (C18)P2, P3, P4MVPTCS
Policy risk (B8)Policy change risk (C19)P2, P3, P4MVPRS
Market risk (B9)Market volatility risk (C20)P2, P3, P5MVPCS
Sustainability (A4)State subsidies policy (B10)Relevant technology policy subsidies (C21)P2, P3, P5MVPTCS
National promotional policy (B11)Technology promotion policy documents (C22)P2, P4, P5MVPTCS
Technical personnel requirements (B12)User experience (C23)P1, P2, P4, P5MVPTRS
User technical proficiency (C24)P2, P3, P4MVPTRS
User acceptance of new technology (C25)P2, P4, P5MVPTRS
Note: P1–5 are the five types of the participants. MVPTCRS indicates the principles used for selecting each index.
Table 5. Evaluation index system of soil water sensing technology.
Second-Level IndexThree-Level IndexFour-Level IndexIndex Score Shows that All Indexes Are Set to 0 to 1 Grade
A1B1C1Leading internationally (1.00), internationally advanced (0.90), leading domestically (0.80), domestically advanced (0.70)
C2Technology and equipment for the number of patents and other intellectual property: > 5 (1.00), 5–3 (0.90–0.8), 2–1 (0.7–0.6), 0 (0)
C3Technology and the corresponding equipment adopt the standard of country, industry, group: >5 (1.00), 5–3 (0.90–0.8), 2–1 (0.7–0.6), 0 (0)
B2C4Present industrialization stage of the technology: Industry stage (0.80–1.00), the engineering stage (0.60–0.80), research and experimental stage (0–0.60) level 3
C5Technology and corresponding equipment quality stability and reliability: Stable and reliable (0.80–1.00), stable and reliable, stable, and reliable (0.60–0.80), unstable and unreliable (0–0.60) level 3
B3C6*Influence of different soil types on technology: Sandy loam and clay loam, clay (according to the soil category)
C7*Affected by the ambient temperature: low (0.80–1.00), medium (0.60–0.80), high (0–0.60) level 3
C8*Degree of match order from a complete set of application technologies: Excellent (0.80–1.00), good (0.70–0.80), medium (0.60–0.70), low (0–0.60) level 4
C9*Technology and the operability of the corresponding mechanism: Simple and easy to use (0.80–1.00), complex operation medium (0.60–0.80), complex operation (0–0.60) level 3
C10*Technology and the corresponding device maintenance dependence on technical personnel: low (0.80–1.00), medium (0.60–0.80), high (0–0.60) level 3
A2B4*C11*Adoption of the technology, increase in production efficiency: Sharp increase (0.80–1.00), medium (0.70–0.80), slightly increase (0.60–0.70) 3, zero increase (0–0.60)
C12*Using the technology to save labor: Significant (0.80–1.00), medium (0.70–0.80), small (0.60–0.70), zero (0–0.60) level 4
C13*Using the technology to save water, for water conservancy; equipment efficiency: Significant 0.80–1.00), medium (0.70–0.80), small (0.60–0.70) 3, zero (0–0.60) level 4
B5C14The corresponding equipment sale price (USD): <10 (1.00), 10–100 (0.90–0.8), 100–500 (0.7–0.6), >500 (0)
C15In the process of using the corresponding equipment maintenance cost (USD): <10 (1.00), 10–100 (0.90–0.8), 100–500 (0.7–0.6), >500 (0)
C16Technology of corresponding equipment in use need personnel training (USD): <10 (1.00), 10–100 (0.90–0.8), 100–500 (0.7–0.6), > 500 (0)
A3B6C17-1Stability of the technology supply chain: Excellent (0.80–1.00), good (0.70–0.80), (0.60–0.70), poor (0–0.60) level 4
C17-2Technology continues to develop environmental stability: Excellent (0.80–1.00), good (0.70–0.80), (0.60–0.70), poor (0–0.60) level 4
C17-3Risk of technological maturity: Low (0.80–1.00), medium (0.60–0.80), high (0–0.60) level 3
B7C18-1Different crops on the depth of a technical measure of risk: Low (0.80–1.00), medium (0.60–0.80), high (0–0.60) level 3
C18-2In the field, the risk of damage to the outside environment: Low (0.80–1.00), medium (0.60–0.80), high (0–0.60) level 3
A4B10C21Whether the technology and the corresponding equipment receive government subsidies: have (1.00), no (0)
B11C22Whether the technology and the corresponding equipment receive government recommendation and recognition: have (1.00), no (0)
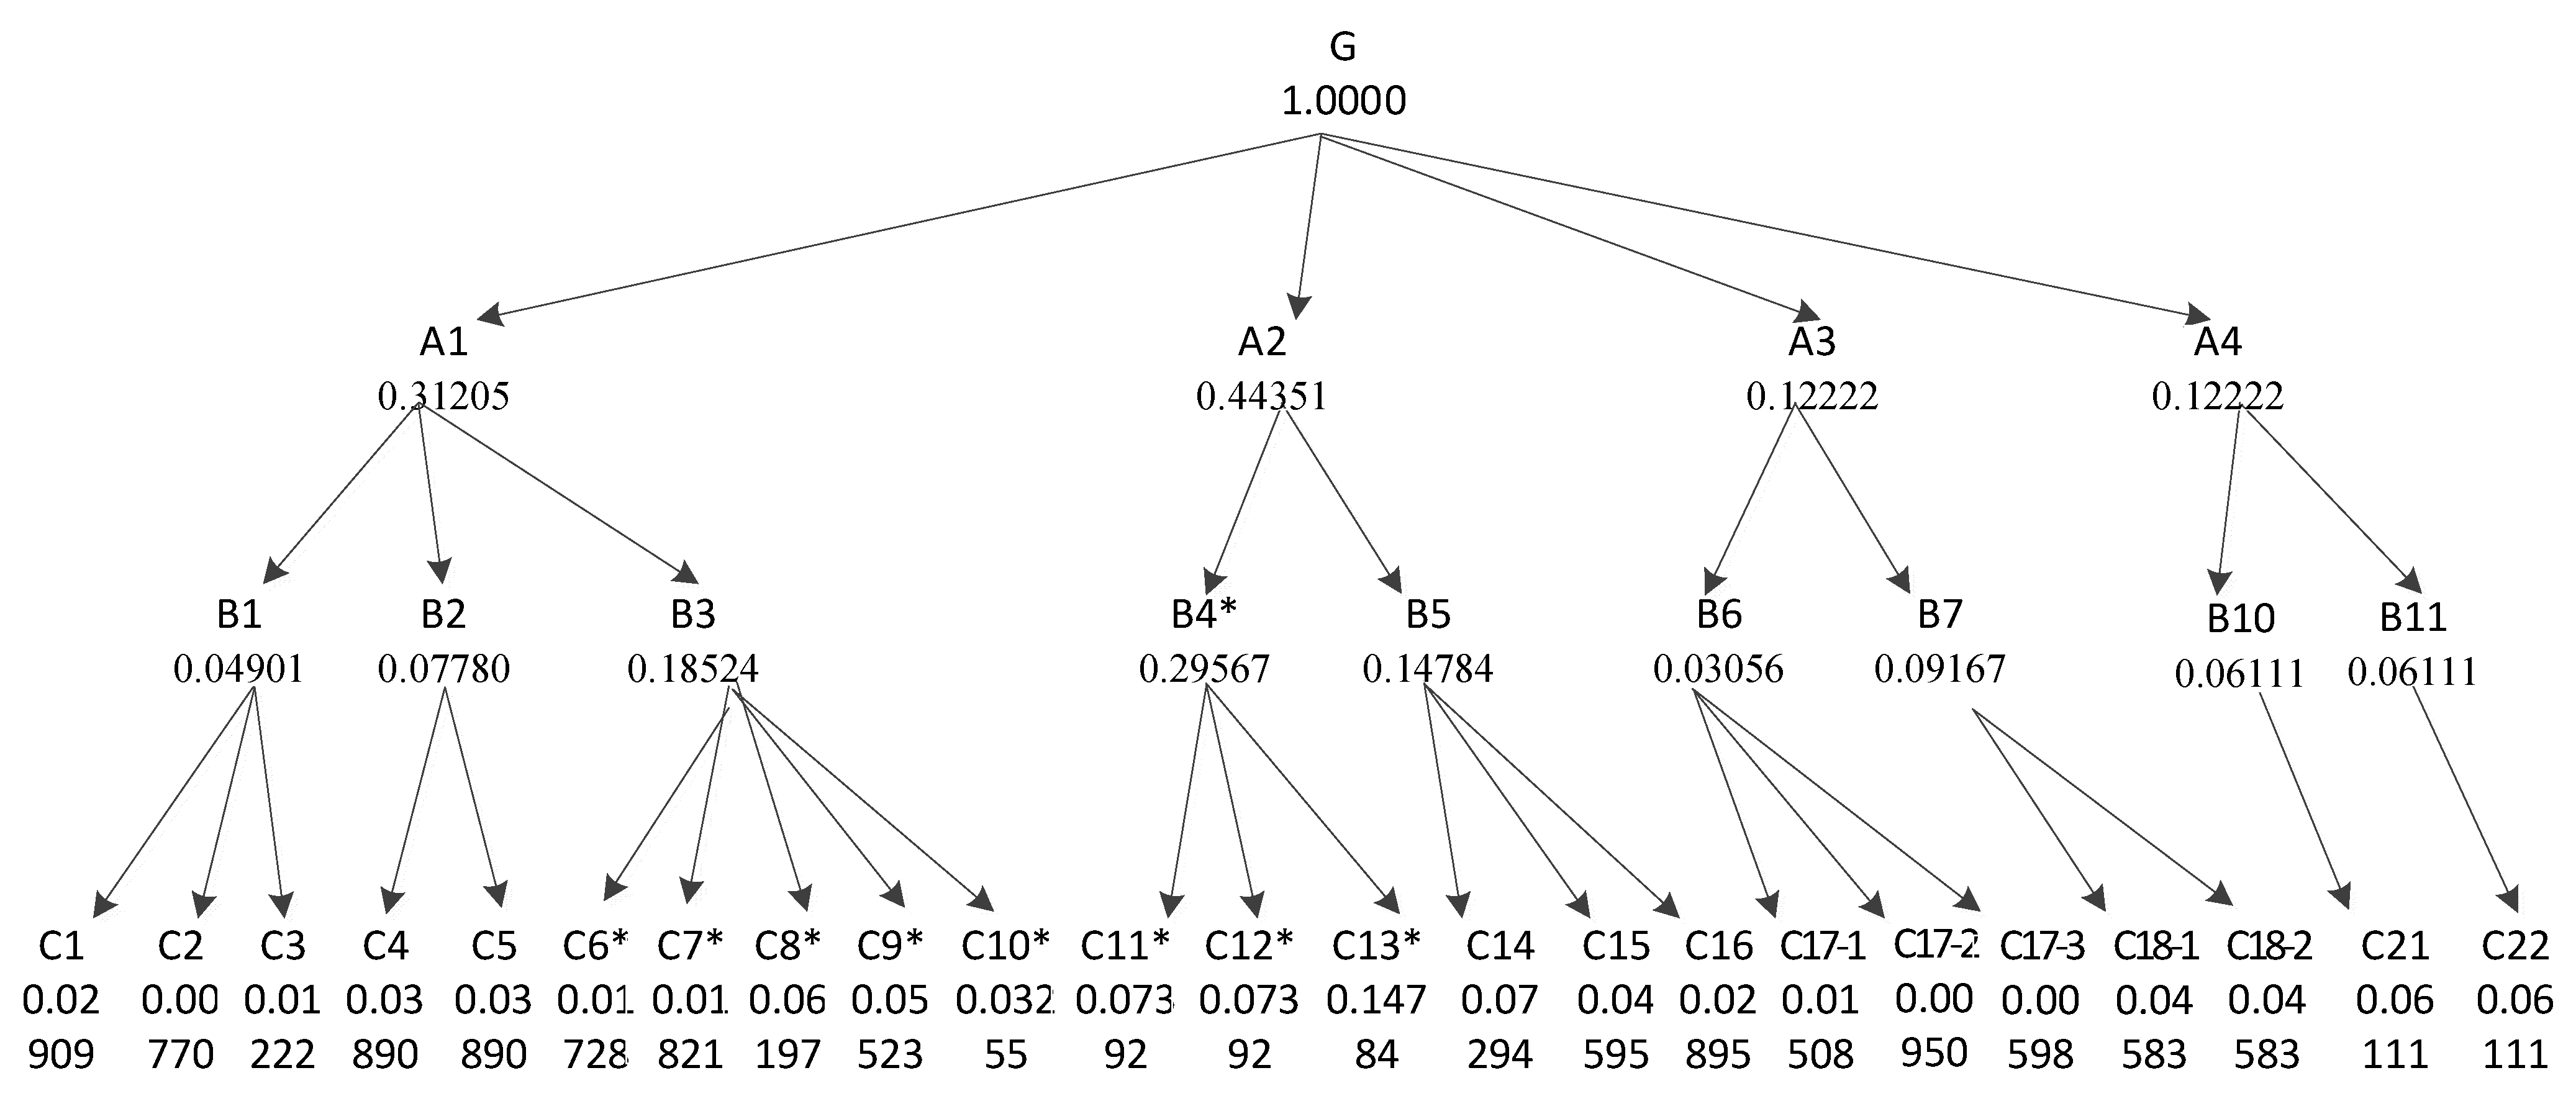
Note: A1–C22 are the codes of the index names. The indicators marked with * refer to the adjusted indicators, which have the same means in the following Tables and Figures.
Table 6. Results of the comprehensive evaluation grade in the Jinan zhangqiu farm.
Second-Level IndexWeightThree-Level IndexWeightFour-Level IndexWeightM4 ScoreM5 ScoreM4 Overall ScoreM5 Overall Score
A10.31205B10.04901C10.029090.90.90.026180.02618
C20.00770110.007700.00770
C30.012220.70.70.008550.00855
B20.07780C40.03890110.038900.03890
C50.038900.80.80.031120.03112
B30.18524C6*0.017280.60.80.010370.01382
C7*0.018210.80.60.014570.01093
C8*0.061970.70.90.043380.05577
C9*0.055230.80.80.044180.04418
C10*0.032550.80.80.026040.02604
A20.4435B4*0.29567C11*0.073920.30.30.022180.02218
C12*0.073920.60.60.044350.04435
C13*0.147840.60.60.088700.08870
B50.14784C140.072940.80.80.058350.05835
C150.045950.80.80.036760.03676
C160.028950.80.80.023160.02316
A30.12222B60.03056C17-10.015080.80.80.012060.01206
C17-20.005980.80.80.004790.00479
C17-30.009500.80.80.007600.00760
B70.09167C18-10.045830.90.60.041250.02750
C18-20.045830.60.60.027500.02750
A40.12222B80.06111C210.06111110.061110.06111
B90.06111C220.06111110.061110.06111
Overall Score 0.739910.73836
The indicators marked with * refer to the adjusted indicators.
Publisher’s Note: MDPI stays neutral with regard to jurisdictional claims in published maps and institutional affiliations.

