Article

Optimization of the Fermentation Conditions for Brewing Yeast Biomass Production Using the Response Surface Methodology and Taguchi Technique

by
Iuliana Diana Bărbulescu
1,2,
Mihaela Violeta Ghica
3,*,
Mihaela Begea
4,*,
Mădălina Georgiana Albu Kaya
5,
Răzvan Ionuț Teodorescu
2,
Lăcrămioara Popa
3,
Simona Ioana Mărculescu
1,
Alexandru Ionuț Cîrîc
4,6,
Corina Dumitrache
1,2,
Dumitru Lupuliasa
7,
Florentina Matei
8 and
Cristina-Elena Dinu-Pîrvu
3
1
Pharmacorp Innovation SRL, 313 Splaiul Unirii Blvd., 030138 Bucharest, Romania
2
Faculty of Land Reclamation and Environmental Engineering, University of Agronomic Sciences and Veterinary Medicine of Bucharest, 59 Mărăști Blvd., 011464 Bucharest, Romania
3
Department of Physical and Colloidal Chemistry, Faculty of Pharmacy, University of Medicine and Pharmacy “Carol Davila”, 6 Traian Vuia Str., 020956 Bucharest, Romania
4
Faculty of Biotechnical Systems Engineering, University Politehnica of Bucharest, 313 Splaiul Independenței, 060042 Bucharest, Romania
5
Department of Collagen, Division Leather and Footwear Research Institute, National Research and Development Institute for Textile and Leather, 93 Ion Minulescu Str., 031215 Bucharest, Romania
6
ICA Research & Development SRL, 202 Splaiul Independenței, 060021 Bucharest, Romania
7
Department of Pharmaceutical Technology and Biopharmacy, Faculty of Pharmacy, University of Medicine and Pharmacy “Carol Davila”, 6 Traian Vuia Str., 020956 Bucharest, Romania
8
Biotechnology Department, Faculty of Biotechnology, University of Agronomic Sciences and Veterinary Medicine of Bucharest, 59 Mărăști Blvd., 011464 Bucharest, Romania
*
Authors to whom correspondence should be addressed.
Agriculture 2021, 11(12), 1237; https://doi.org/10.3390/agriculture11121237
Submission received: 3 November 2021 / Revised: 2 December 2021 / Accepted: 5 December 2021 / Published: 9 December 2021

Abstract

:
Yeast (including brewing yeast) and yeast-based preparations derived from bioprocesses or agroindustrial byproducts represent valuable feed additives and ingredients for ruminants. The optimization of brewing yeast biotechnological processing through fermentation mediated by the brewing yeast strain Saccharomyces pastorianus ssp. carlsbergensis W34/70 was investigated. The cultivation conditions (temperature, pH, carbon source, and nitrogen source) were selected and designed according to a Taguchi fractional experimental plan, with four factors on three levels, and their influence on the evolution of the bioprocess of obtaining the brewing yeast biomass was evaluated. The dependent variables were the yeast biomass amount in wet form, yeast biomass amount in dried form after lyophilization, dried yeast biomass wettability assayed through the contact angle (CA), protein content (PC), and dry matter content (DS). The effects that the experimental conditions had on the system responses were visualized in tridimensional space using the response surface methodology, and the combination of biotechnological parameters that ensured process quality and robustness was then determined using the Taguchi technique through its performance indicator, i.e., the signal-to-noise ratio. By optimizing the biotechnological parameters, this study provides a valuable contribution in the area of brewing yeast biomass processing, with the aim of producing probiotic yeast for ruminant nutrition.

1. Introduction

There is increasing interest in the development of valuable animal feeds that improve digestibility and dry matter utilization, based on the positive effects of yeast-based preparations as natural additives and ingredients [1,2]. This is mainly due to the high nutritional value that results from the balanced amino acid profile, which is characterized by high lysine and threonine contents. One of the most commonly used yeast-based products is brewing yeast biomass, which can be used in different forms (e.g., as liquid yeast, active dry yeast, and inactivated dry yeast). Brewing yeast biomass is one of the main byproducts of the brewing industry, and extensive studies have been conducted in relation to yeast products and their derivates as nutritional yeast products used as feed supplements. This interest is due to their relevant nutritional value, represented by proteins (amino acids), nucleic acids, vitamins (especially the vitamin B complex), minerals, nutraceutical compounds (e.g., β-glucans, mannan-oligosaccharides, and nucleotides), and their ability to prevent digestive acidosis in ruminants. They have been demonstrated to have benefits when included in ruminant diets in terms of improving animal health and growing performance [2,3]. Thus, the ruminant food manufacturing industry is one of the best developed in terms of utilizing yeasts [4].
Environmentally friendly fabrication processes relying on raw materials, such as biomass and agroindustrial byproducts, as primary resources are tending to replace the industrial chemical processes used to obtain important commercial biobased products [5]. The bioprocesses usually take place in mild conditions, in bioreactors with different configurations and operating systems (batch, continuous, and semicontiguous), depending on their application purpose, and use microorganisms as biocatalysts [6]. It is well known that yeasts are at the cutting edge of worldwide biotechnologies [7] and have been widely used for the production of various bioproducts, including alcoholic beverages (beer and wine), bread, biofuels [8], and biopharmaceuticals (insulin and its analogs) [9]. Among the yeasts, the Saccharomyces cerevisiae strains are preferentially used in controlled fermentation and are now widely marketed as a supplement in animal feed [3]. While brewing yeast products are used in both dried and wet forms, the main issues concerning the marketing of wet spent yeast biomass are its short preservation time, the high risk of contamination, and the high costs of shipping and storage. Thus, various drying techniques are applied to reduce the impact of these inconveniences. Although expensive, lyophilization is one of the most advantageous drying techniques, mostly due to the fact that the dried product is a powder with high water solubility/a high wetting degree that maintains its initial properties even after rehydration [10].
The available yeast-based products vary widely in terms of formulation [11], and the brewing yeast biomass obtained from the controlled fermentation process in bioreactors for nutrition purposes could successfully complement or replace brewers’ spent yeast biomass, thus obtaining yeast-based preparations formulated for animal feed [5]. Yeast biomass is produced in a multistage process mainly consisting of the propagation of the yeast cells (pure cultures) in the appropriate substrate in bioreactors. The effective techniques for obtaining yeast biomass through controlled fermentation assume lower costs and increased biomass production, and the procedure for obtaining industrial yeast biomass follows a well-established protocol in order to attain high yields and ensure the quality of the final products [6].
This study aimed to model and optimize the biotechnological process of obtaining brewing yeast biomass through fermentation mediated by the brewing yeast strain Saccharomyces pastorianus ssp. carlsbergensis W34/70. Although this yeast strain is widely used in brewing industry to produce bottom-fermented beer specialties, the optimization study was conducted in a different environment in comparison with the classical brewing process, since the main goal was to obtain brewing yeast biomass. For example, the culture medium that has been tested was a synthetic one (sucrose) and not the malt wort; a temperature range of 28–32 °C instead of 11–12 °C (10–14 °C) which is recommended as suitable for beer fermentation process, however similar with that applied in the propagation plants within the industrial breweries. The response surface methodology (RSM) and the Taguchi approach were used to ensure a robust process for producing brewing yeast biomass, including the selection of the best process parameters [12,13,14,15,16,17]. The study also allowed for the evaluation of the simultaneous effects of cultivation conditions, and the manner in which interaction effects influence system responses. In the proposed statistical approach and the selection of the optimal biotechnological parameters, this study provides a valuable contribution in the area of brewing yeast biomass processing, with the aim of producing yeast-based preparations for the nutrition of ruminants. From the production standpoint, the focus of this research was to identify and develop better solutions linked to the sustainable available biomass resources and side-streams, in order to unlock large amounts of cheaper, better, and more sustainable feedstocks resulted from agriculture and food industry, with the final aim to improve or create new sustainable value chains in agriculture, food, and feed industry.

2. Materials and Methods

2.1. Materials

The yeast strain S. pastorianus ssp. carlsbergensis W34/70, which was the stock culture, was purchased from Hefebank Weihenstephan (Au in der Hallertau, Germany) as pure culture yeast on agar slant.
Agar–agar, sucrose, glucose, yeast extract, malt extract, Peptone Hy-Soy, KCl, MgSO4, and NH4OH were obtained from Merck KGaA (Darmstadt, Germany). The culture medium used for strain conservation was YMSP based on yeast extract–malt extract–sucrose–Peptone Hy-Soy agar, with the following composition: 0.5 g yeast extract; 2 g malt extract; 2 g; sucrose; 0.5 g Peptone Hy-Soy; 2 g agar; and 100 mL distilled water.
A culture medium YPG based on yeast extract–glucose–Peptone Hy-Soy-agar was used for the preinoculum and for the plate colony-counting method, with the following composition: 0.5 g yeast extract; 2 g glucose; 1 g Peptone Hy-Soy; 2.5 g agar; and 100 mL distilled water. The plate colony-counting method was determined by the pour plate technique.
A culture medium YPS based on yeast extract–sucrose–Peptone Hy-Soy was used for the inoculum (submerged culture), with the following composition: 0.5 g yeast extract; 6 g sucrose: 0.5 g Peptone Hy-Soy; and 100 mL distilled water.

2.2. Methods

2.2.1. Upstream and Downstream Fermentation Process

For the optimization study, the liquid inoculum obtained from the yeast strain W34/70 (Saccharomyces pastorianus ssp. carlsbergensis) was tested using a fermentation medium, relying mainly on sucrose as carbon source (CS) and yeast extract as the nitrogen source (NS). The fermentation medium is based on sucrose as carbon source and yeast extract as nitrogen source and was used for the fermentation experiments at pilot level, with the concentrations of sucrose and yeast extract detailed in the fractional factorial Taguchi 34 plan (see Table 1). In addition, the following components have been added: potassium chloride (0.05 g%); magnesium sulfate heptahydrate (0.07 g%); ammonium phosphate monobasic (0.1 g%); and 100 mL distilled water. The pH was corrected with 5% NaOH solution. The liquid inoculum was used afterwards as seed material for the fermentation medium.

Cultivation Conditions

The preinoculum culture was obtained from the stock culture in a MEMERT incubation chamber. The stock culture and the preinoculum were placed in tubes containing 10 mL of sloped solid culture medium. They were then incubated at 30 °C for 48 h.
The liquid inoculum cultures, in 500 mL Erlenmayer flasks with an average of 150 mL in each, were incubated at 28–30 °C, in an orbital shaker (Optic Ivymen System, Auxilab, Spain) at 140–170 rpm, for 20 h (overnight).

Pilot Fermentation

The pilot-phase experiments were performed in a batch cultivation system, in a 4 L Biostat B PLUS fermenter from Sartorius (Göttingen, Germany). The inoculation ratio was 10–15% based on the previously developed YSP liquid inoculum. The pH level was corrected with 5% NH4OH.

Post-Fermentation Processing

The yeast biomass was separated from the fermentation medium by centrifugation at 3500–4500 rpm for 10 min, using a Sorvall centrifuge. The yeast biomass was then washed three times with distilled water by vigorous stirring, followed by centrifugation and the discharge of the water.

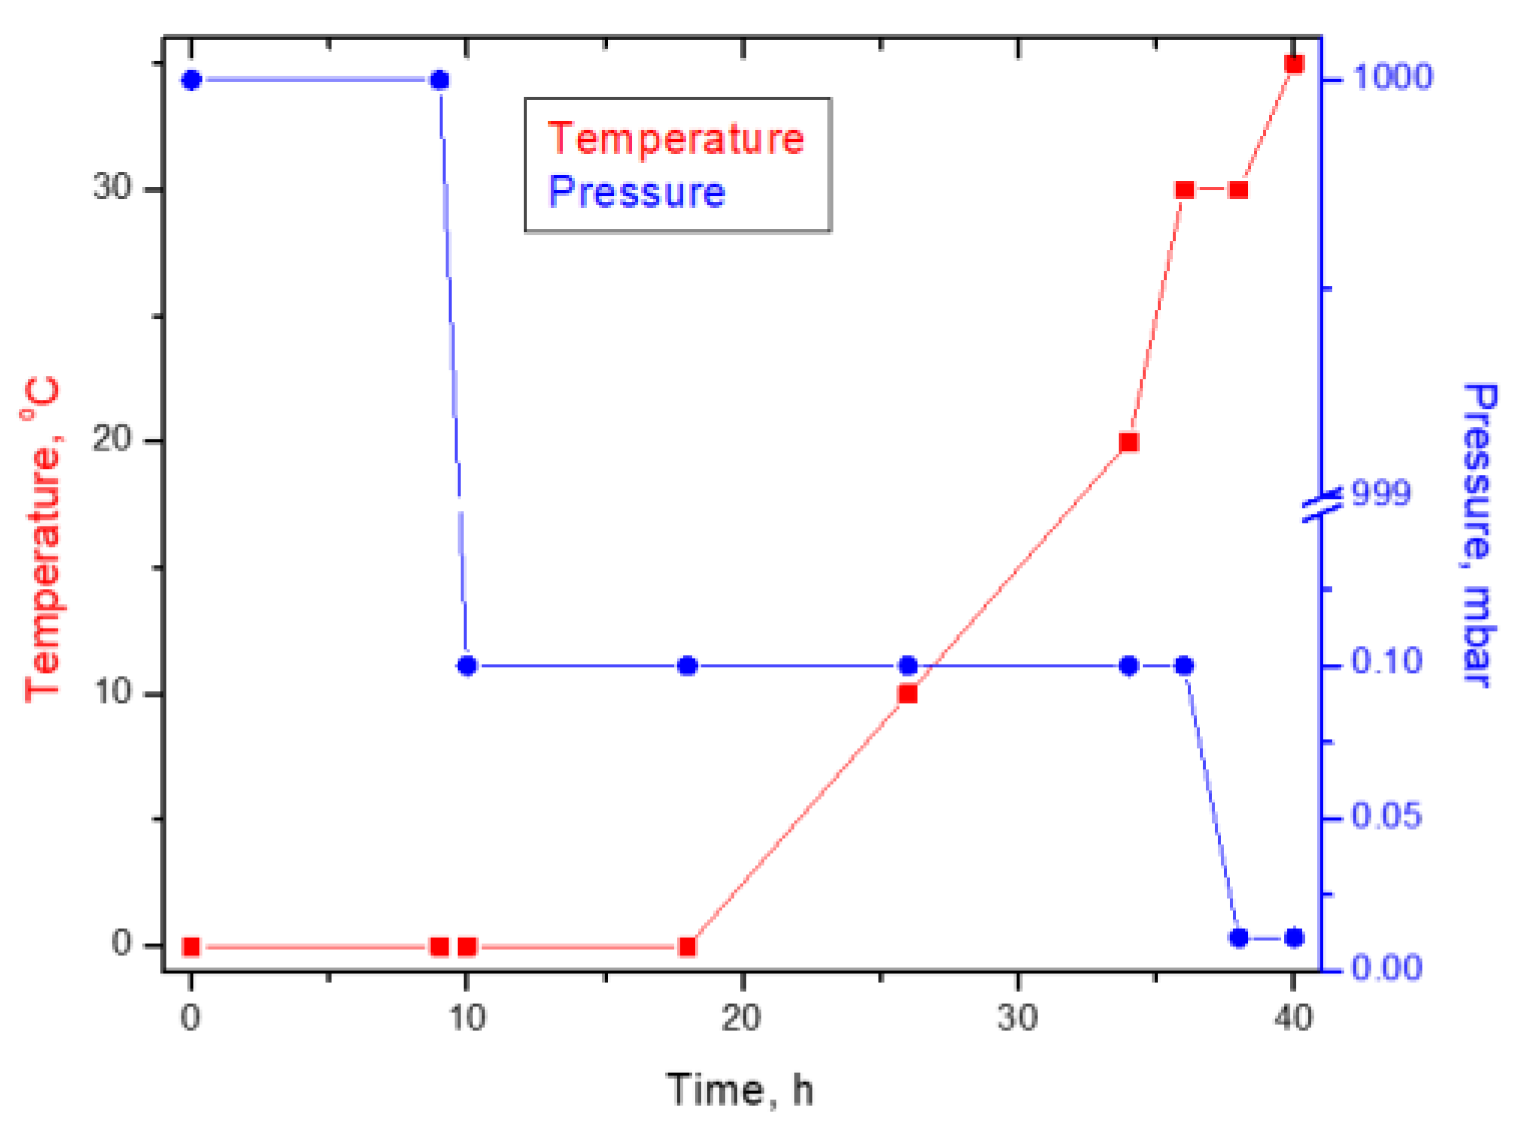
2.2.2. Biomass Drying by Freeze Drying

The obtained wet yeast biomass was dried by lyophilization. The operational drying parameters were the lyophilization time, freezing temperature, and pressure. The wet yeast biomass was poured into glass Petri dishes, with a capacity of 200 mL, and dried by lyophilization, using the Delta LSC 2-24 Martin Christ lyophilizer (Osterode am Harz, Germany), following the program presented in Figure 1.

2.2.3. Determination of the Moisture and the Crude Protein Content for the Yeast Biomass

The moisture content was determined through drying the samples at 103 °C for 4 h.
The crude protein was obtained based on the nitrogen content as determined by the Kjeldahl method, and multiplied by a factor of 6.25.

2.2.4. Determination of the Dry Cell Weight and the Wet Cell Weight for the Yeast Biomass

For the determination of the wet cell weight (WCW), the fermented medium was centrifuged at 4000 rpm for 5 min, washed twice with distilled water, and weighed.
For the determination of the dry cell weight (DCW), the resulting wet biomass was dried in an oven at 105 °C for 4 h; this was continued until the biomass reached a constant weight, and then, it was weighed.
The number of viable yeast cells was determined using the plate colony-counting method, using YGP agar as the culture medium.

2.2.5. Dried Yeast Biomass Wettability

The wettability degree of the dried yeast biomass obtained by lyophilization was quantified in terms of the contact angle (CA) at the solid/liquid interface. The CA (degrees) measurements were performed using a KSV Cam 101 Scientific Instrument (Helsinky, Finland), with the pendant drop technique, as outlined in our previous work [18,19]. Briefly, the powder bed was fixed on a glass slide covered with double-sided adhesive tape. The CAs of the distilled water, dispensed with a Hamilton syringe on the dried yeast powder beds, were measured at least six times on various powder bed locations and averaged, at room temperature (25  ±  1 °C). The shape of the droplet was captured using a digital camera, and the recorded images were analyzed using the tangent method and the built-in analysis software. The values for the CAs were computed using the Young equation [20].

2.2.6. Design of Experiments and Data Statistical Analysis

To set the optimum cultivation conditions for brewing yeast biotechnological processing through fermentation mediated by the brewing yeast strain Saccharomyces pastorianus ssp. carlsbergensis W34/70, a Taguchi fractional experimental plan, with four factors on three levels (34), was applied. The independent variables selected as the cultivation conditions were as follows: temperature—X1 (°); pH—X2; carbon source (CS)—X3 (g/100 mL); and nitrogen source (NS)—X4 (g/100 mL) (Table 1 and Table 2). The system responses set as the dependent variables were as follows: yeast biomass amount in wet form (WCW)—Y1 (g/L); yeast biomass amount in dried form resulting from lyophilization (DCW)—Y2 (g); dried yeast biomass wettability assayed through contact angle (CA)—Y3 (degrees, °); protein content (PC)—Y4 (%); and dry substance (DS)—Y5 (%) (Table 1). The experiments were randomly performed. The statistical analysis of the data was conducted by applying different routines of the Statistica StatSoft Release software package, version 10. The steps of the optimization analysis are presented in detail in our previous papers [12,13,14,15,16,17]. Summarily, to establish the quadratic polynomial model for each response, a stepwise regression analysis with a backward elimination subroutine was applied to the experimental data (only the significant terms with p < 0.05 were selected). For each regression equation, the correlation (R) and determination (R2) coefficients were evaluated, and the analysis of variance (ANOVA) and residual analysis were determined. The effects that the experimental conditions had on the system responses were visualized in tridimensional space using the response surface methodology. The combination of biotechnological parameters that ensured process quality and robustness was then set using the Taguchi technique through its performance indicator, i.e., the signal-to-noise ratio.

3. Results and Discussion

3.1. Responses of Brewing Yeast Biotechnological Processing

The evolution dynamics of the process of obtaining brewer’s yeast biomass were explored by evaluating the protein content and biomass content (both DCW and WCW). Thus, changes in biomass content in response to the optimization of the cultivation conditions, including certain culture medium components that positively influenced the biomass content and protein content, were explored.
The wettability assessment of the powders, including the dried brewing yeast biomass utilized to produce probiotic yeast for ruminant nutrition, was of considerable interest regarding the performance of the final product, for example, for the release of the active principles [21,22], for the interfacial interactions guiding the formulation components [23], and for the stability studies [24].
CA (Y3) remains one of the crude indicators for the wettability degree [25]. However, evaluating the CA for powders remains a challenge because powders are mostly heterogeneous, have a rough surface, and can undergo rapid property changes [26]. There are various different approaches for CA assessment [27], but the classic technique using a sessile or pendant drop remains the first choice as a result of its simplicity and reproducibility [28]. The images of the drop shape assessed for the wet biomasses are shown in Figure 2a–i, corresponding to the contact angle listed in Table 3.

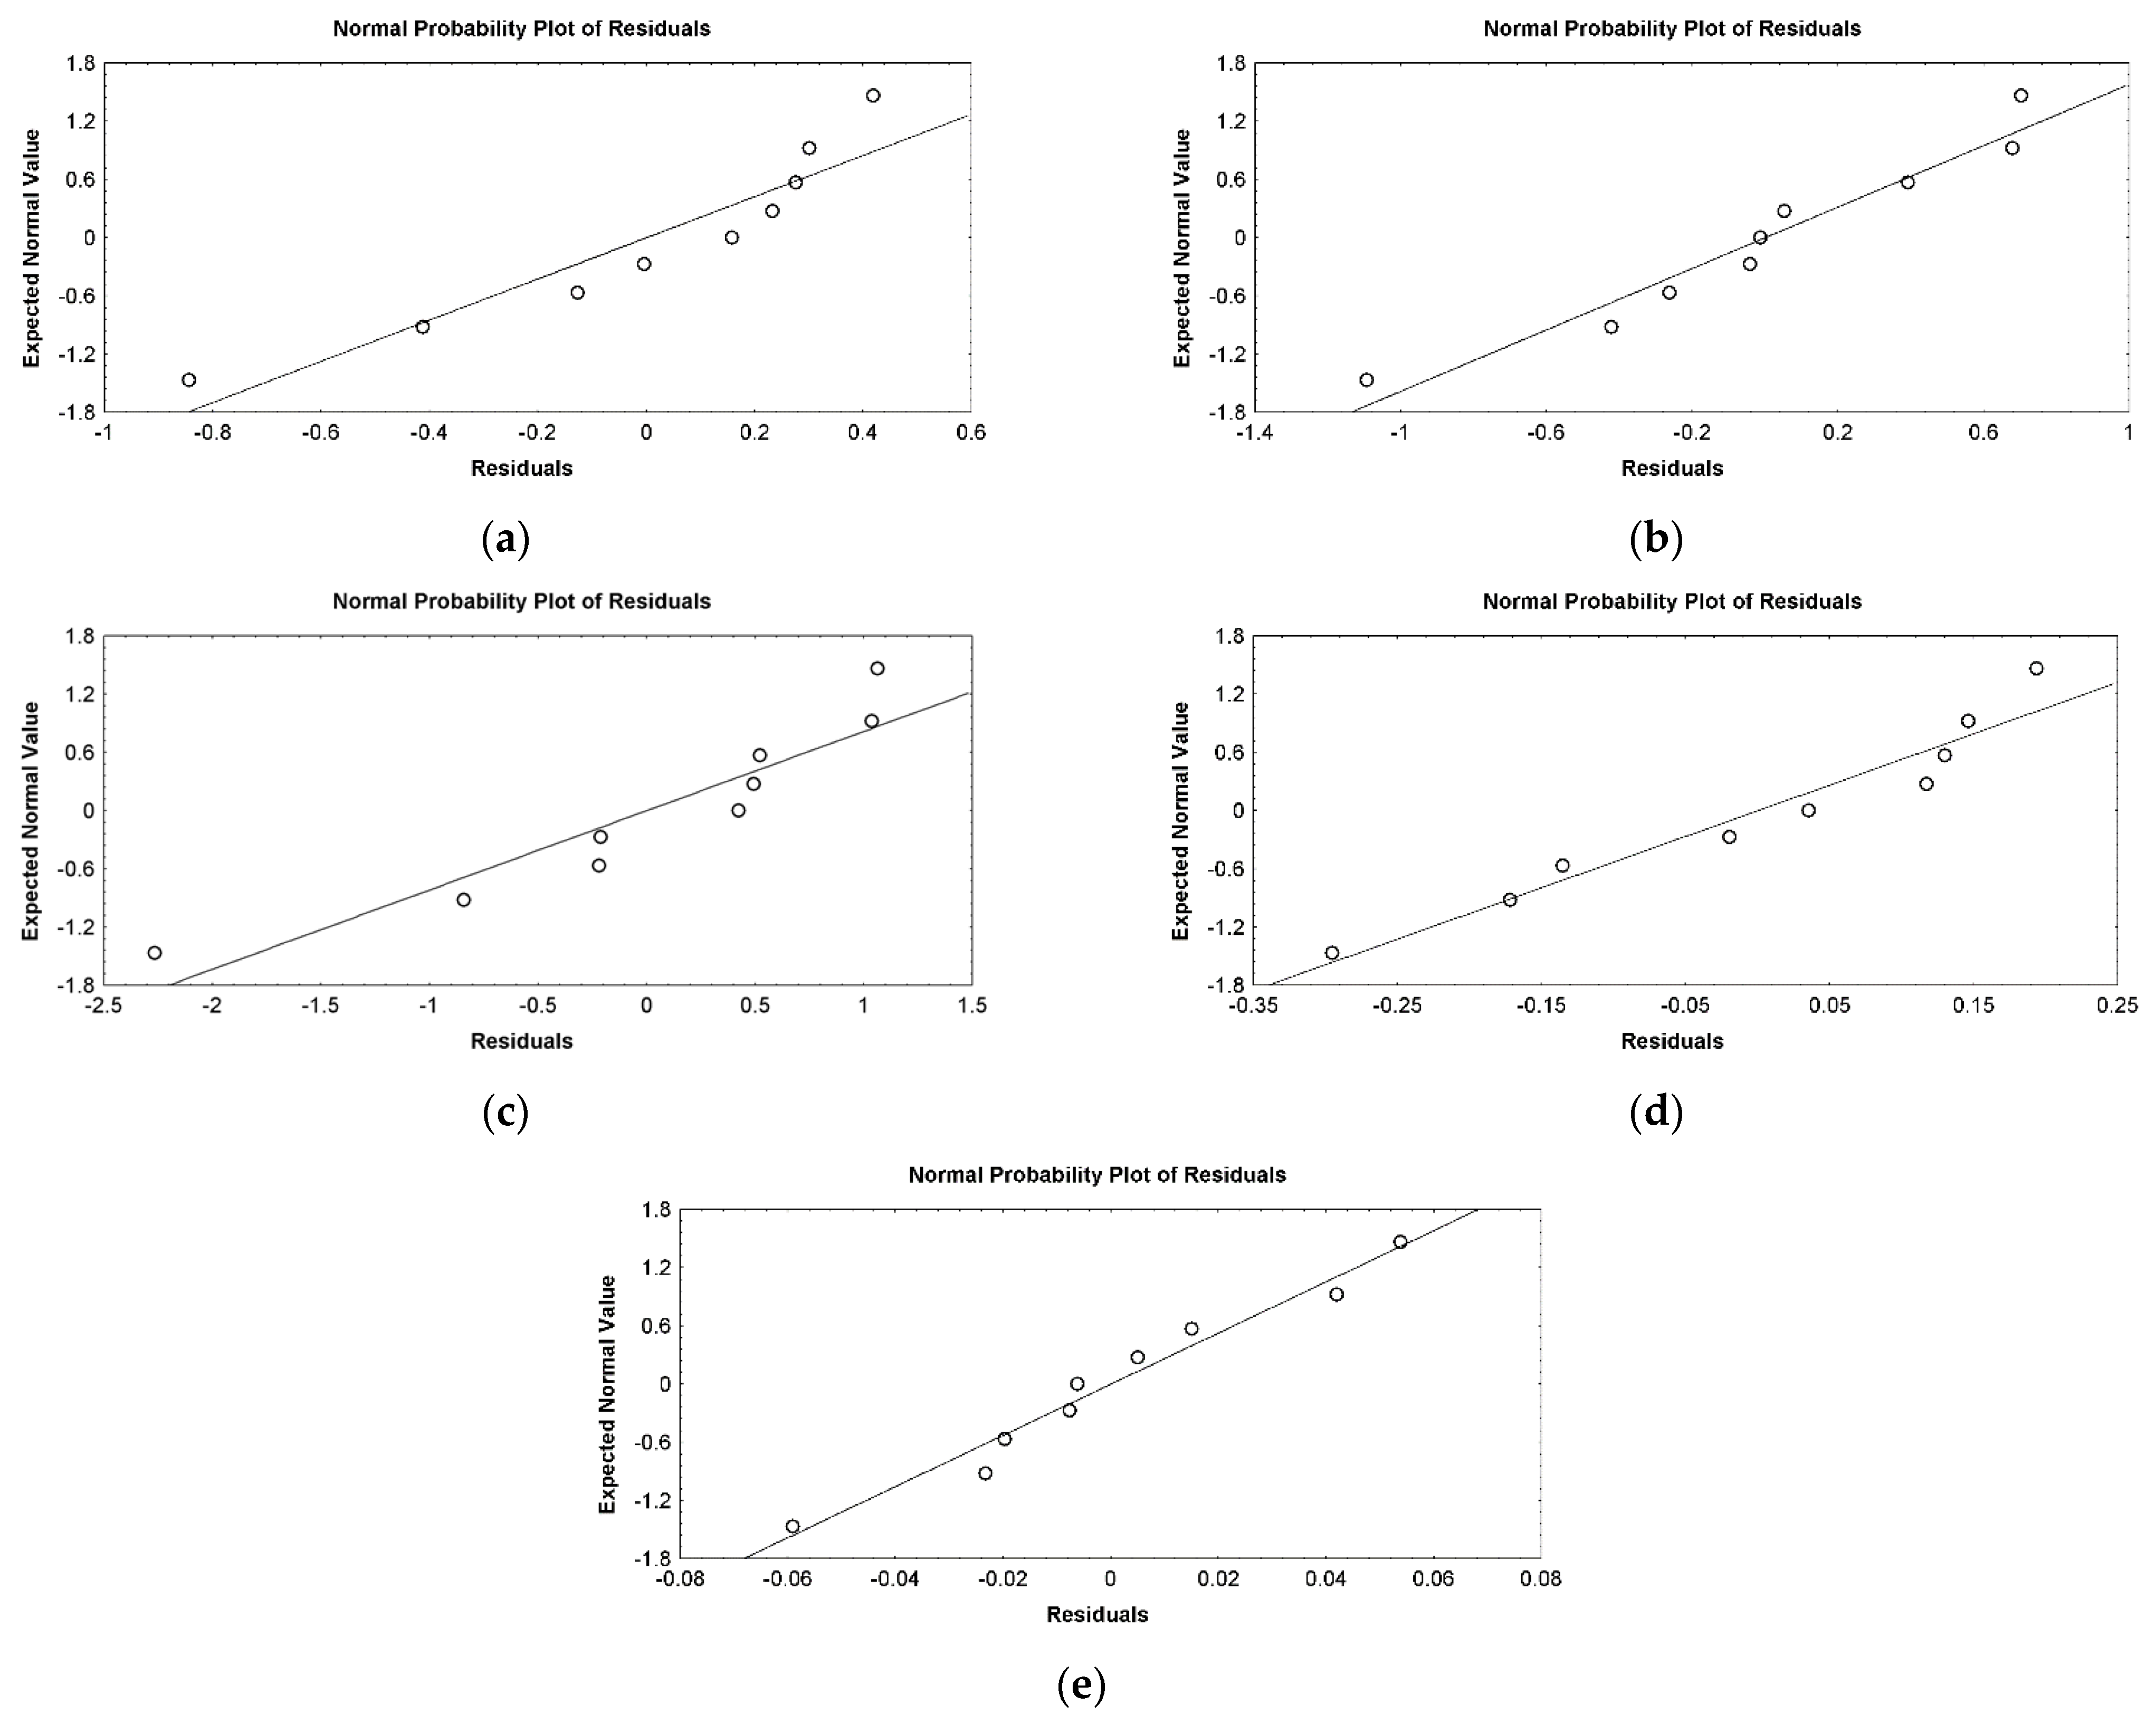
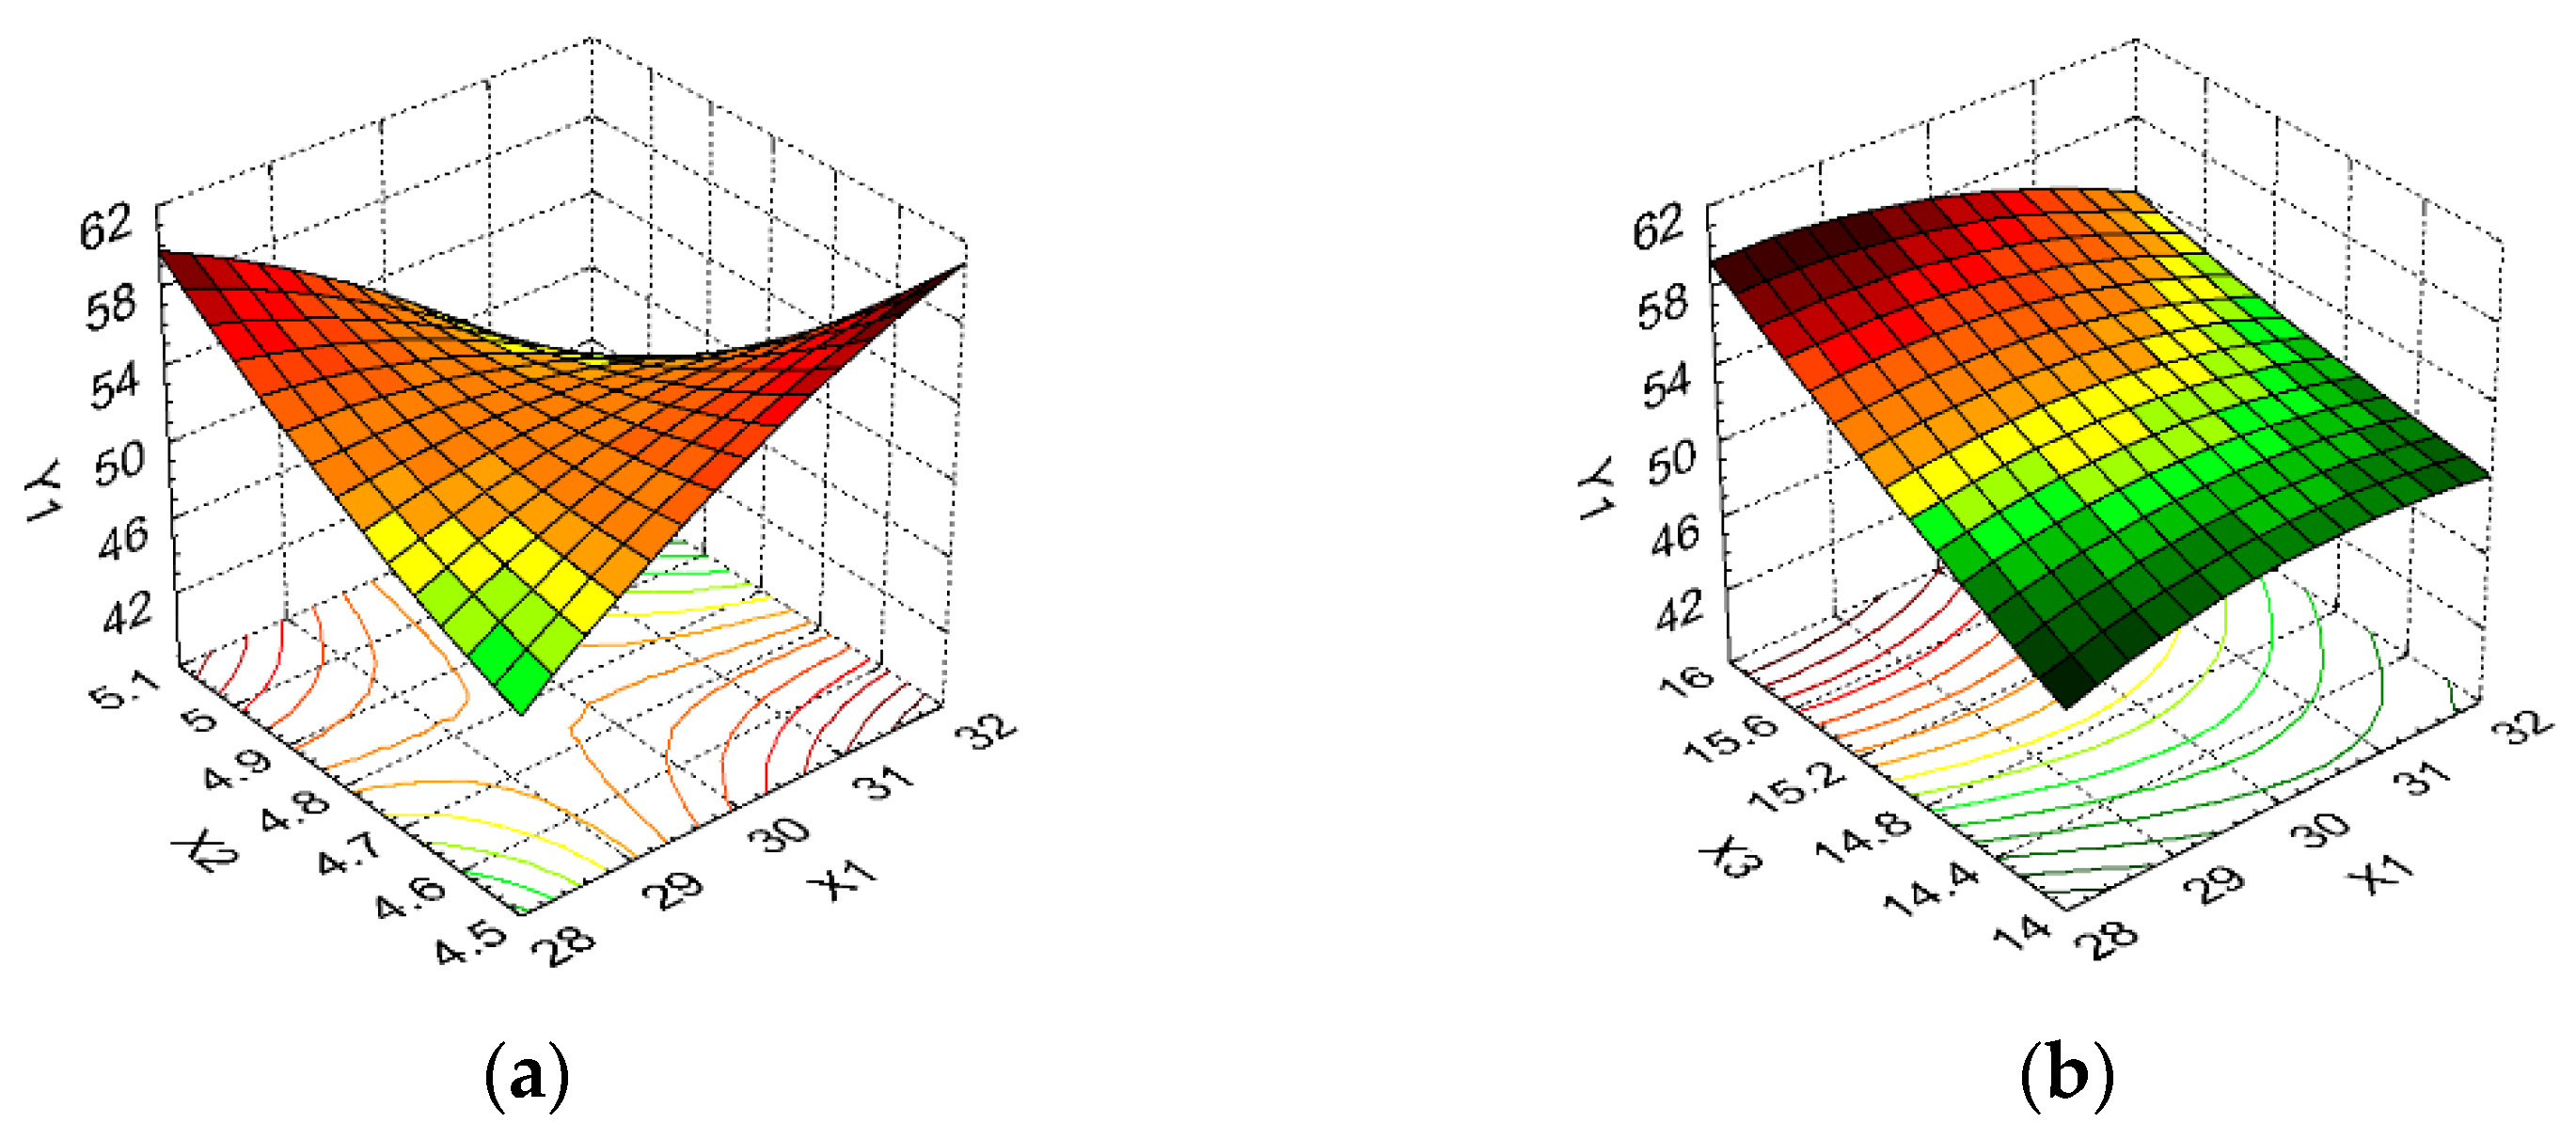
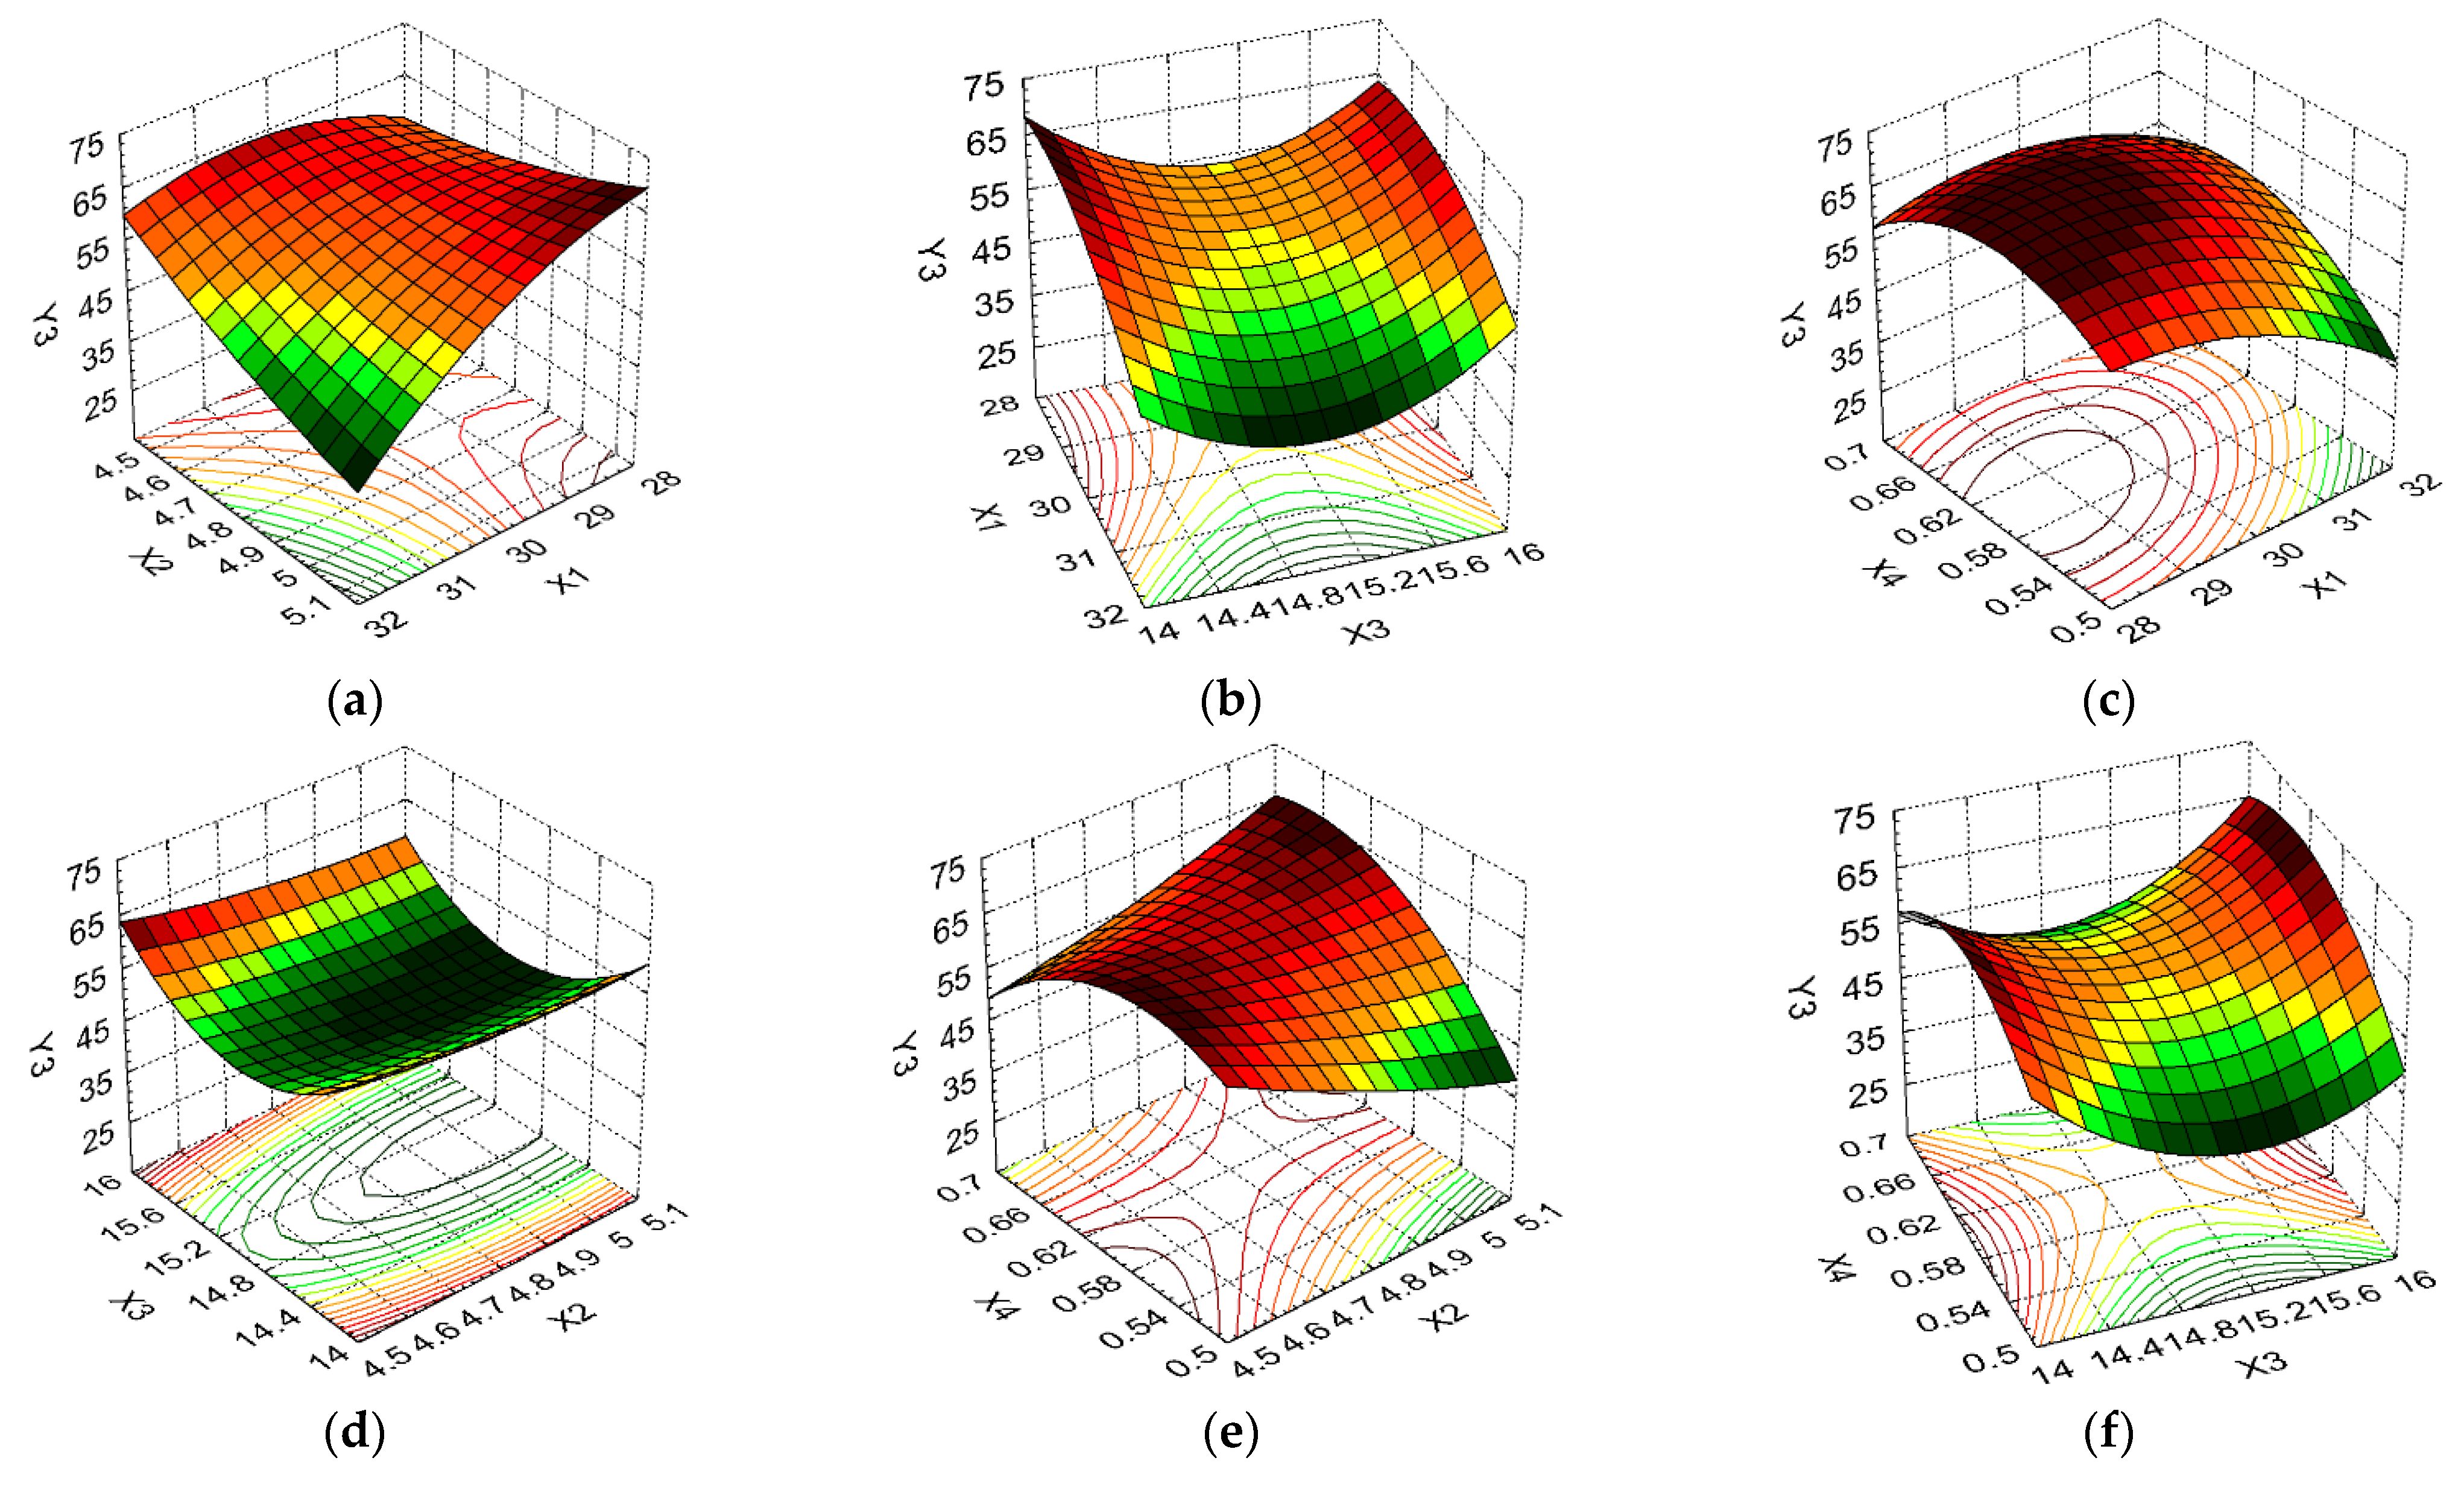
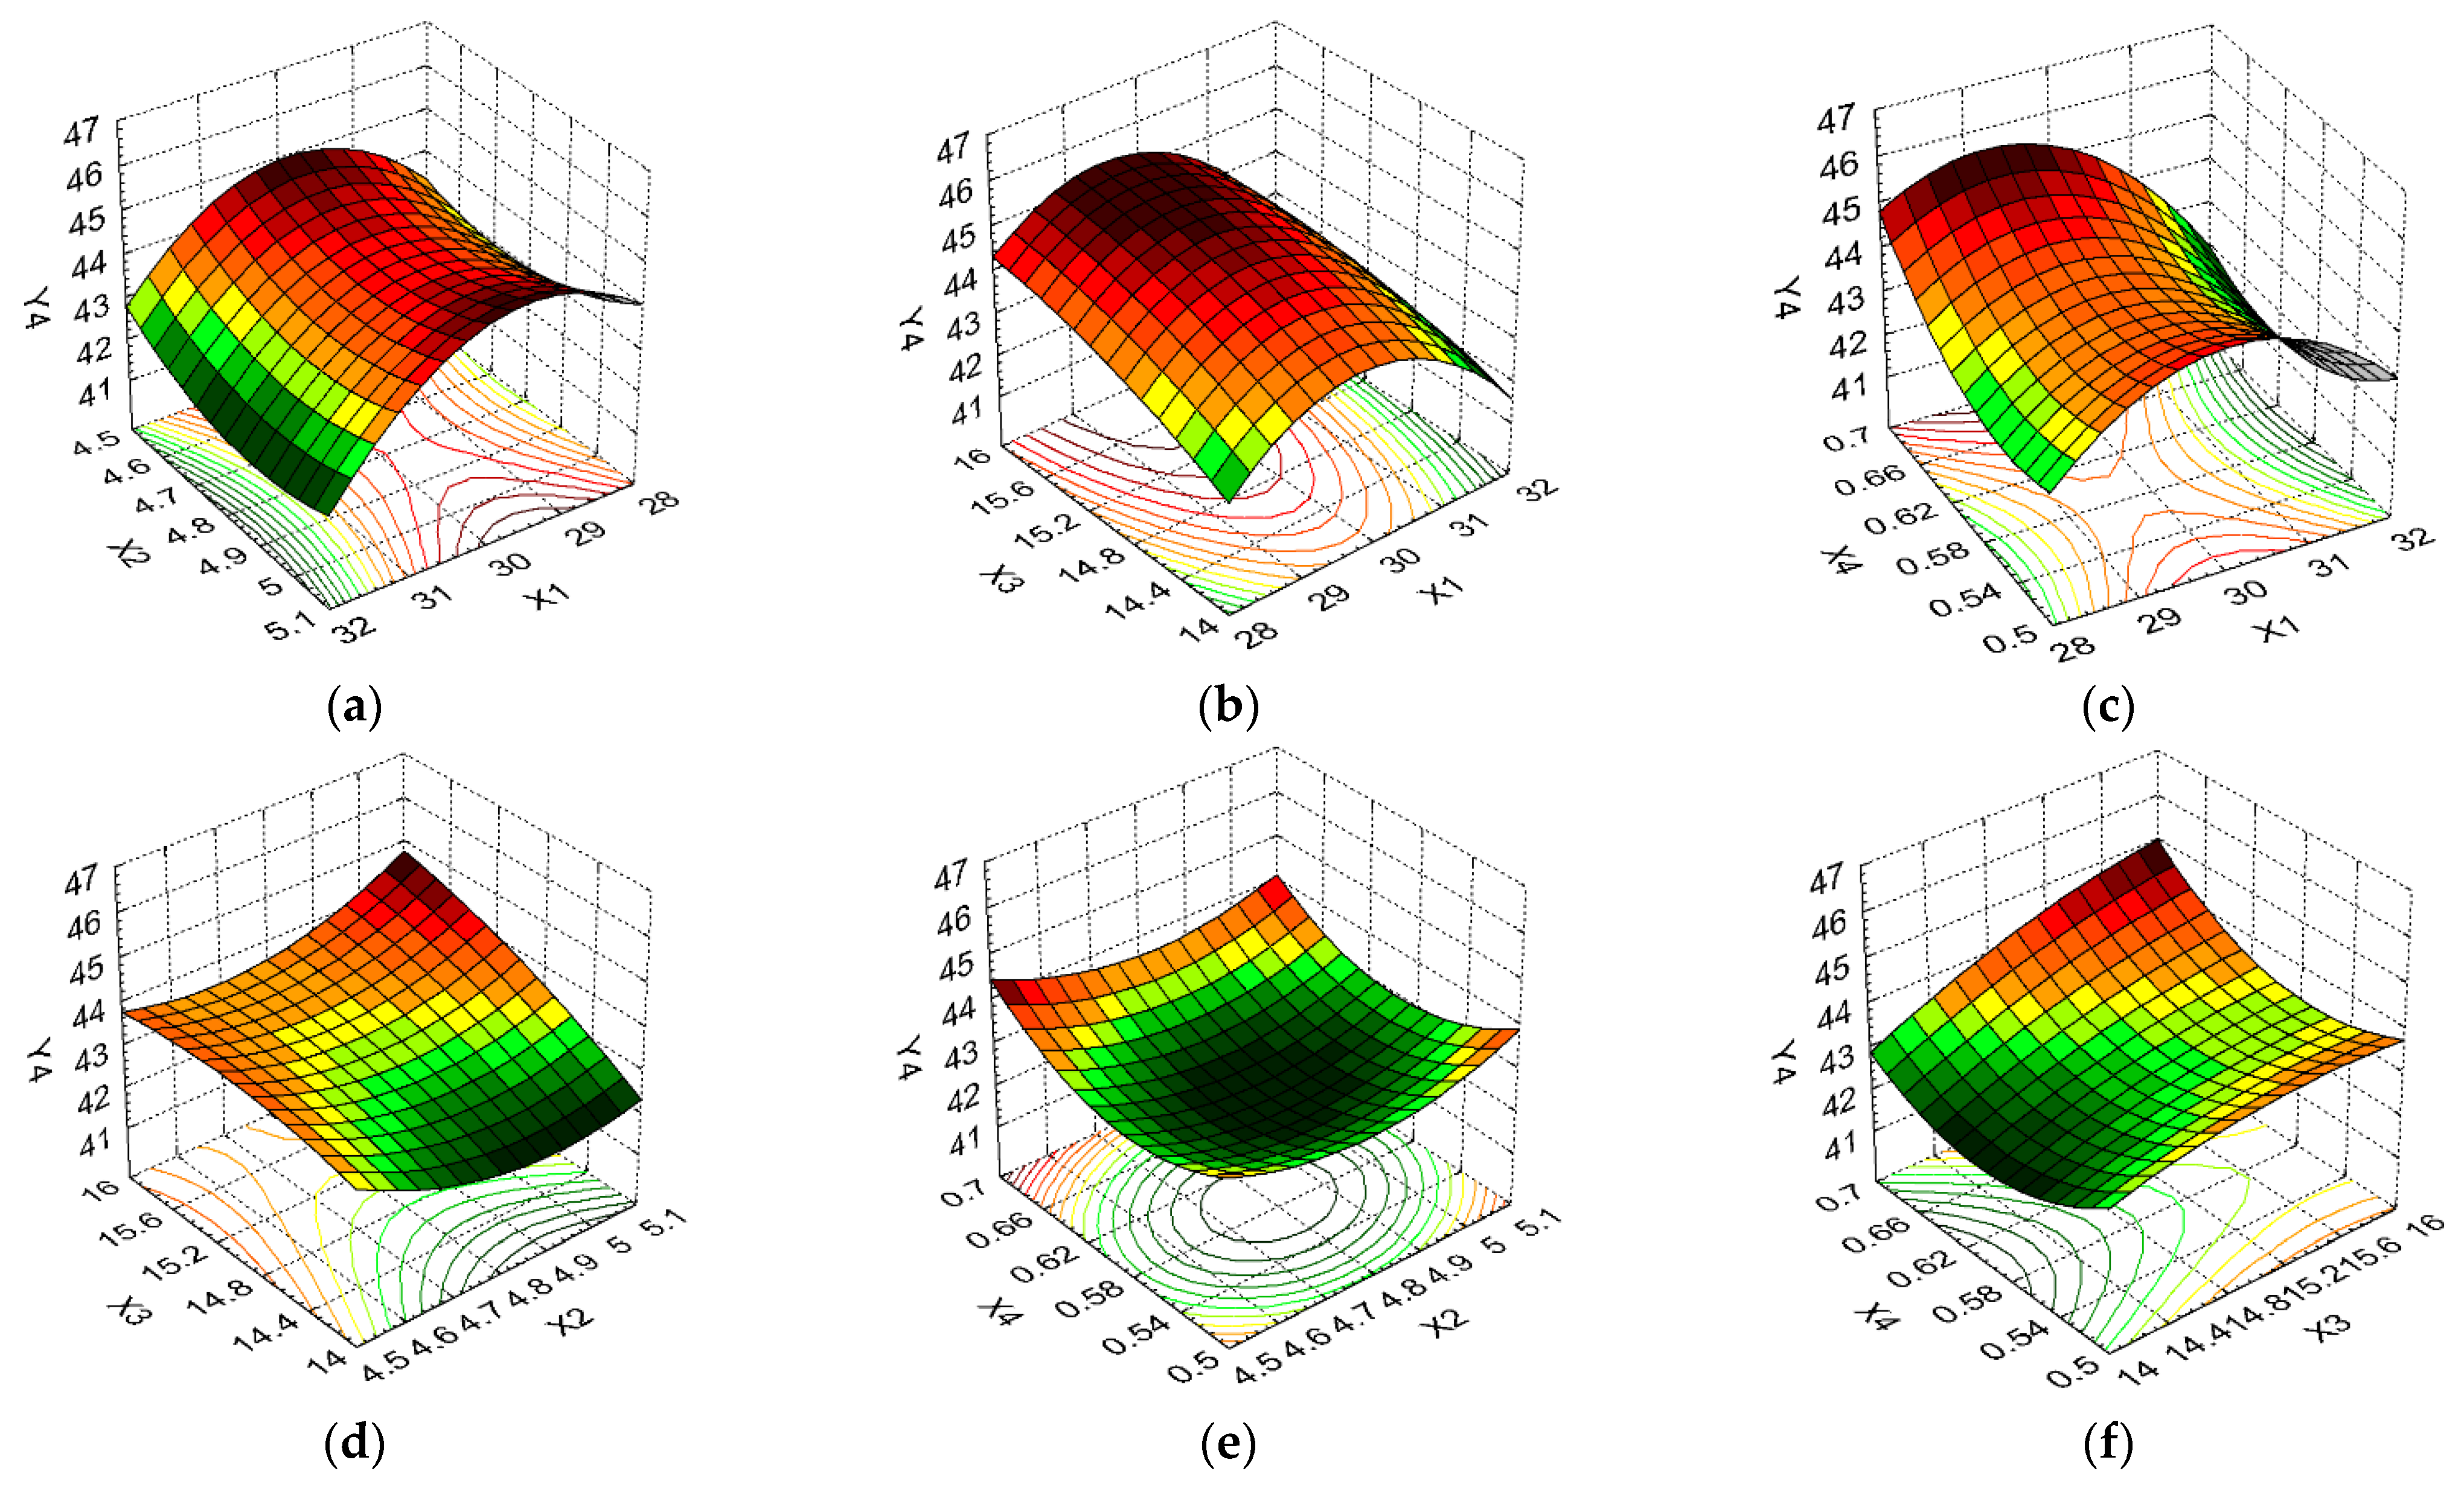
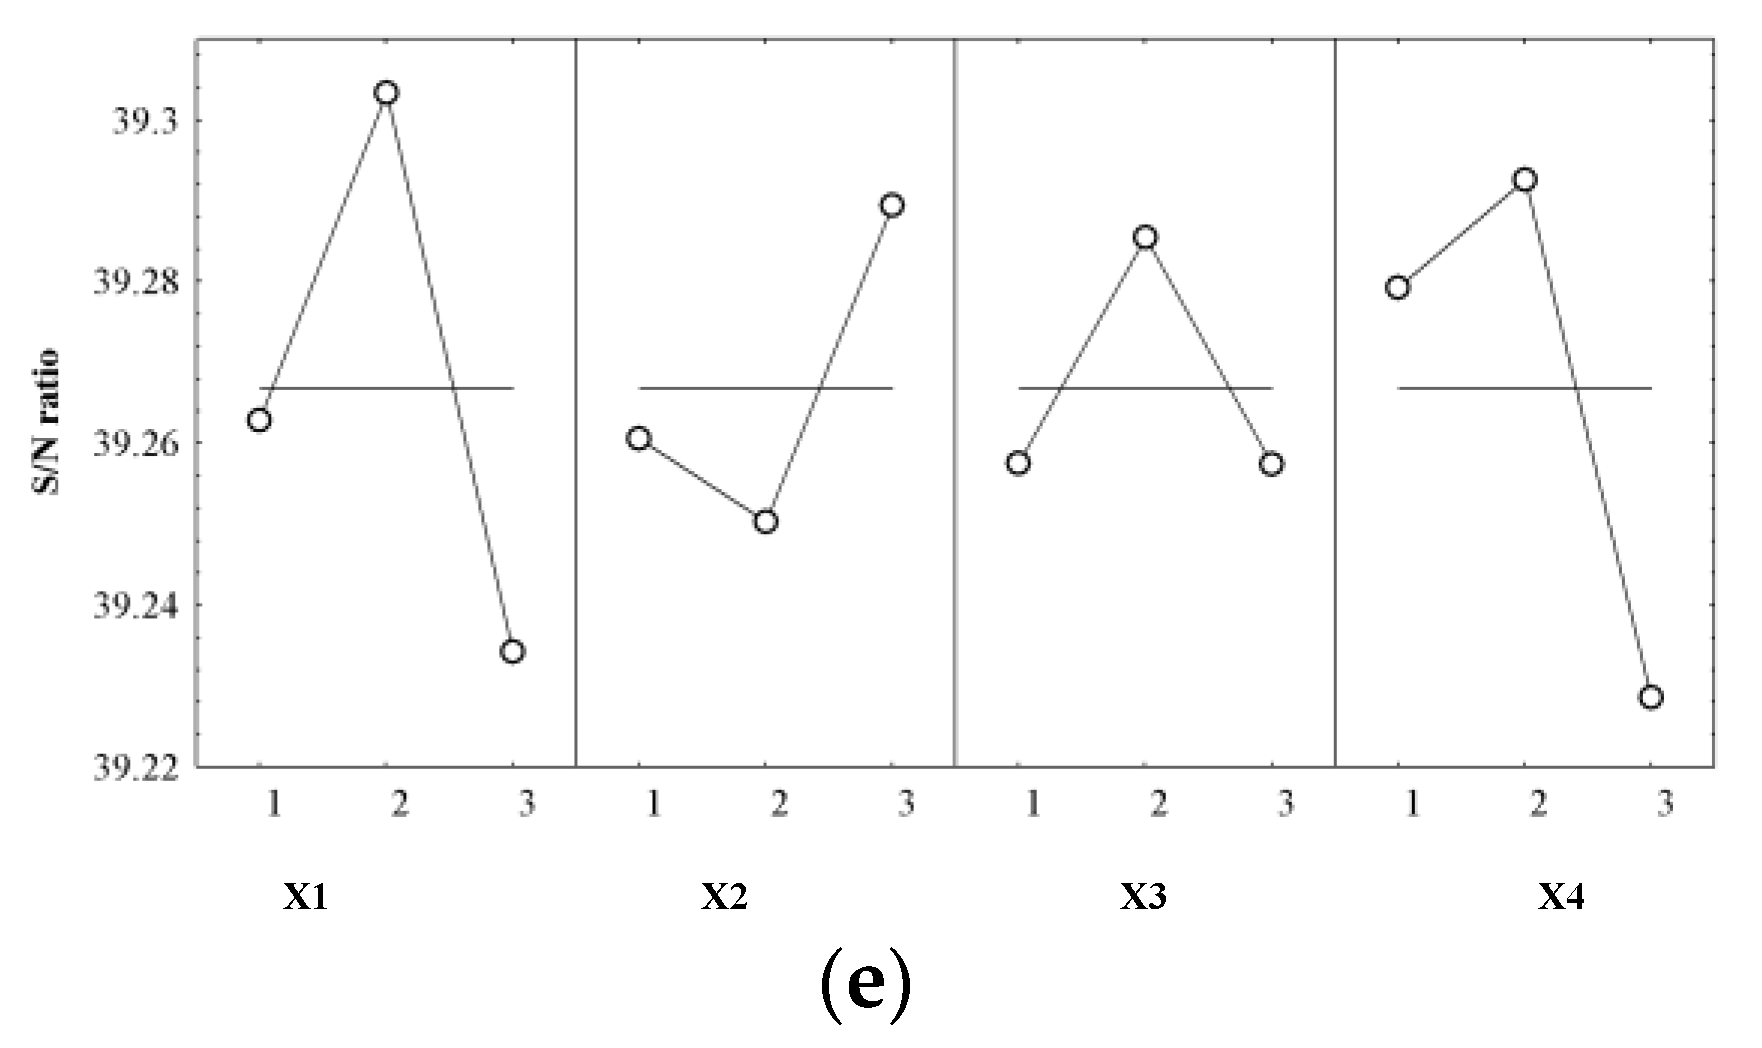
3.2. Design of Experiments and Data Statistical Analysis

The experiments included in the fractional factorial Taguchi 34 plan, for brewing yeast biotechnological processing through fermentation mediated by the brewing yeast strain Saccharomyces pastorianus ssp. carlsbergensis W34/70, led to the experimental results presented in Table 3. Furthermore, the responses obtained were the basis for the optimization statistical analysis based on the classical experimental design combined with the analysis of response surfaces and the Taguchi technique. This was used to determine the influence of cultivation parameters on different types of biomass (WCW and DCW) and on the CA, PC, and DS of the dry biomass obtained by lyophilizing the wet biomass.
To determine the reduced quadratic polynomial models for the system responses, a stepwise regression analysis was performed with the backward elimination subroutine. These reduced regression models are presented as Equations (1)–(5), in which only significant terms (p < 0.05) were kept.
Y 1 = 597.116 + 130.657 X 2 + 42.991 X 3 0.211 X 1 X 2 8.623 X 2 X 3 + 3.294 X 3 X 4
Y 2 = 23.667 0.561 X 1 5.625 X 2 + 0.535 X 1 X 4 + 0.342 X 2 X 3
Y 3 = 163.531 + 43.944 + 6.657 X 3 2 9.862 X 1 X 4 36.729 X 2 X 3 + 198.252 X 2 X 4 41.480 X 3 X 4
Y 4 = 49.587 0.207 X 1 2 + 1.125 X 3 2 + 193.511 X 4 2 + 3.331 X 1 X 2 7.322 X 1 X 4 6.830 X 2 X 3
Y 5 = 21.863 + 29.436 X 2 0066 X 1 2 + 32.448 X 4 2 + 0.247 X 1 X 3 1.5472 X 2 X 3 8.154 X 2 X 4
The influence of the cultivation conditions on the responses in the biotechnological processing of brewer’s yeast is also reflected in the regression models from Equations (1)–(5). These regression models, through the values of the coefficients of the regression terms, show the quantitative effects of the independent variables (in linear and quadratic form), and the interactions between them, on the system responses (Yi). For a response to be maximized (X1, X2, X4, and X5), the positive coefficient values indicate a synergistic effect, while negative values denote an antagonistic effect.
For a response to be minimized (X3), the synergistic effect is given by the negative coefficients and the antagonistic effect, by the positive coefficients. Thus, the response Y1 is positively influenced by the variables X2 and X3 in linear form and by the interaction between the process variables X3 and X4, while the interactions between the variable X2 and the variable X1, respectively X3, have a negative influence on it. The response Y2 is negatively influenced by the variables X1 and X2 in linear form, while the interactions between the variables X1 and X4, and between the variables X2 and X3, have a positive influence on it.
It was found that, for wet biomass, in the reduced regression model, the variables X2 and X3, i.e., the pH and the carbon source, respectively, had an increased weighting, and for dry biomass, the variables X1 and X2, i.e., the temperature and pH, respectively, predominated. It was observed that the pH value had an increased weight for both responses. The response Y3 was positively influenced by the interaction between the process variables X1 and X4, X2 and X3, and X3 and X4, respectively, while the variables X2 and X3 in quadratic form had a negative influence on it.
The response Y4 was negatively influenced by the variable X1 in quadratic form and by the interactions between variables X1 and X4, and X2 and X3, respectively, while the variables X3 and X4 in quadratic form and the interaction between variables X1 and X2 had a positive influence on it. Regarding the dry matter content, Y5 was positively influenced by the variable X2 in linear form, X4 in square form, and the interaction between the variables X1 and X3, an antagonistic effect being found for variable X1 in square form and the interactions between variables X2 and X3, and X2 and X4, respectively.
The predictive power of these models was evaluated by the correlation coefficient (R) and determination (R2) values, ANOVA analysis of variance, and residual analysis.
The R values recorded for each model, i.e., 0.9975, 0.9629, 0.9954, 0.9930, and 0.9976, respectively, were close to 1, and the R2 values, i.e., 0.9950, 0.9272, 0.9909, 0.9861, and 0.9953, respectively, were higher than 0.90, showing a good correlation between the observed and predictive values.
The suitability of the regression models was also supported by the ANOVA (Table 4) and the residual analysis results (Table 3; Figure 3 and Figure 4).
The statistical tests performed indicate that these reduced regression models possess good predictive power and could be used to determine the wet biomass, the dry biomass, the contact angle, the protein and dry matter contents of the dry biomass, and other combinations of process variables represented by the cultivation parameters.
The relationship between each response and the cultivation parameters selected to obtain wet or dry biomass with certain characteristics is further illustrated by the use of response surfaces that allow the effects of the independent variables on dependent variables to be visualized in three-dimensional space (Figure 5a–f; Figure 6a–f; Figure 7a–f; Figure 8a–f; Figure 9a–f).
From Figure 5a, it can be seen that high wet biomass values were observed for the minimum temperature in combination with the maximum pH (60.5 g/L), which is similar to the biomass values for the maximum temperature and minimum pH (59.25 g/L). A high wet biomass value was also recorded for the combination of temperature factors at the minimum level/carbon source at the maximum level, wherein parameter X3 had a greater influence on the Y1 response (Figure 5b). Thus, the wet biomass value increased from 46.25 to 60.5 g/L as the carbon source increased between the minimum and maximum levels (an increase of 1.31 times), i.e., from 46.25 to 51.925 g/L, respectively, when the carbon source was at the minimum level and the temperature varied between the minimum and maximum levels (an increase of 1.12 times). From Figure 5c, we observe the same evolution for parameter Y1 for the variation in the temperature and nitrogen source parameters. Regarding the combination of pH and carbon source as formulation factors, Figure 5d indicates that X3 had a greater influence on the wet biomass response, with its maximum value (59.25 g/L) being obtained for the pH at the minimum level and carbon source at the maximum level. A small variation in the Y1 parameter was determined by the evolution of the pH between the minimum and maximum levels when the nitrogen source was kept at the same level of variation. In this sense, Figure 5e indicates the change in wet biomass from 60.50 to 60.00 g/L for the maximum level of variation in factor X4, from 59.25 to 51.25 g/L for the average level of variation in X4, and from 46.25 to 44.725 g/L for the minimum level of variation in the same parameter. The maximum carbon source levels and nitrogen source variations resulted in the maximum wet biomass values, i.e., 60.5 g/L, which decreased by 23.14% for the minimum variation levels in the same parameters when the wet biomass value was 46.25 g/L (Figure 5f).
The variation in the dry biomass response, which depends on the same combinations of cultivation conditions, is illustrated in Figure 6a–f. Figure 6a indicates that low dry biomass values were obtained for minimum temperature values and maximum pH values, and for maximum temperature values and minimum pH values. From Figure 6b,c, it can be seen that the carbon source and nitrogen source parameters had a greater influence on the dry biomass than temperature, with the maximum Y2 response value (17.65 g/L) being obtained for the minimum temperature level and X3 and X4 at the maximum level of variation. Similar variations in the dry biomass dependent variable according to pH and carbon source, and pH and nitrogen source, were observed, as shown in Figure 6d,e, with X2 exhibiting a low influence in both cases. Regarding the evolution of the dry biomass response, according to the independent carbon source and nitrogen source variables, the maximum Y2 value was obtained for X3 and X4 at the higher variation level (17.65 g/L); this decreased significantly, by 34.05%, for the minimum level of variation in these independent variables (up to 11.64 g/L), as shown in Figure 6f.
From Figure 7a, it is observed that the maximum temperature and pH levels result in low contact angle values, with the values of this response increasing more than twice for X1 at the minimum level when X2 was kept at the maximum level. Figure 7b indicates that the maximum temperature level caused low CA values when the carbon source was at the average level, with the minimum and maximum X3 levels resulting in significant increases in the CA for the same level of variation in X1. Increased, undesirable CA values were induced by the temperature variation from the maximum level to the average level, and the preservation of the nitrogen source at the average level (an increase of 1.16 times), according to Figure 7c. Figure 7d shows that Y3 was more influenced by the variation in the formulation variable X3 than X2, with favorable CA values being noted for the maximum pH level and average carbon source values. Figure 7e indicates that the minimum nitrogen source level in combination with the maximum pH level led to the minimum CA value, with the variations of these formulation variables being antagonistic. Thus, the CA value decreased from 62.44 to 31.05 (50.27%) for the variation in the pH between the minimum and maximum levels when the nitrogen source was kept at the minimum level; moreover, it increased from 54.97 to 64.05 (16.52%) for the same direction of X2 variation. Figure 7f indicates that the variation between the minimum and maximum levels of the carbon source formulation and nitrogen source variables had a similar influence on the CA; it further indicates that the average X4 values determine the increase in Y3 values, while the average X3 values favored the decrease in the values to this response.
Figure 8a–c indicate that elevated protein content values were induced by the average temperature in combination with pH, carbon source, and nitrogen source at all levels of variation. For all these formulation factor combinations, the PC had a low variation, i.e., between 43.41% and 45.74% (5.37%). From Figure 8d, it can be seen that, for the maximum pH and carbon source levels, a high PC was obtained, with the formulation variable X3 having a greater influence on this response. Figure 8e indicates that a high PC was determined by the minimum and maximum pH and nitrogen source levels, with the average levels of these formulation variables causing the Y4 value to decrease from 45.74% to 42.48% (decrease of 7.13%). Regarding the combination of carbon source/nitrogen source formulation factors (Figure 8f), the maximum level of both formulation variables favored high PC values, i.e., 44.83%, which decreased to 43.41% for X3 at the minimum level and X4 at the average level (a decrease of 3.17%).
The variation in dry matter response, which depended on the same combinations of formulation factors, is illustrated in Figure 9a–f. The DS was favored by an average temperature and pH at all levels of variation (Figure 9a), with the Y5 value varying slightly between the minimum and maximum X2 levels (from 92.02% to 92.71%; an increase of 0.7%). Figure 9b indicates a maximum Y5 response value for the average levels of the temperature and carbon source formulation factors, while Figure 9c,f show that the percentage of dry matter was favored by the minimum and medium nitrogen source levels in combination with temperature and a medium level carbon source, respectively. Figure 9d,e show similar variation profiles for the interactions between the pH formulation factors and the carbon source and nitrogen source, respectively, with high Y5 values (92.71% and 92.13%) being obtained for X2 at the maximum level and X3/X4 at the minimum level.
As a final step in determining the quality of the optimization process, the influence of controlled factors (Yi) on the signal-to-noise ratio (S/N) for each response was evaluated, resulting in the optimal combination of cultivation conditions (Table 5 and Figure 10a–e).
From the data analysis presented in Table 5, we can see that the carbon source and nitrogen source cultivation conditions had the greatest influence on the dependent variables Y1 and Y2, i.e., the dry biomass and wet biomass, with at least double the effect of the other cultivation conditions. In terms of the temperature and carbon source, X1 had a low influence on Y1 and a medium influence on Y2, while X2 had a low influence on both responses. For the Y3–Y5 responses, temperature exhibited the greatest influence on them. The CA was also strongly influenced by the carbon source and nitrogen source, with the pH having a reduced effect on this response. X2 had a low effect on the PC and a medium effect on the dry matter content. Y4 was similarly influenced by the carbon source and nitrogen source, while for Y5, the carbon source was determined to have the minimum effect.
By applying the Taguchi technique as the final stage of the optimization process, we selected four cultivation parameter combinations which led to different biomass characteristics and were minimally affected by the noise factors. From these cultivation condition combinations, three were not included in the initial fractional Taguchi experimental matrix (the number of experiments was reduced from 81, corresponding to the full factorial design, to 9). These were coded as described in Table 2: exp. 10—2:1:3:3 for wet biomass and PC; exp. 11—1:1:3:3 for dry biomass; exp. 9—3:3:2:1 for the CA (a combination included in the initial fractional matrix); exp. 12—2:3:2:2 for the dry matter content. It was observed that, for both wet biomass and PC, the same optimal combination of cultivation parameters was obtained, i.e., exp. 10—2:1:3:3.
The experimental values of the responses obtained by applying these combinations of cultivation condition are given in Table 6, together with the predictive values obtained by applying the regression models (Equations (1)–(5)).
Brewing yeast biotechnological processing through fermentation mediated by the brewing yeast strain Saccharomyces pastorianus ssp. Carlsbergensis W34/70 proceeded under similar conditions to the processing of brewer’s yeast from the Taguchi fractional matrix, through the utilization of the optimal cultivation parameter combinations (Experiments 10–12). The regression models applied proved to have a high predictive power according to the values presented in Table 6, with the errors recorded being in the range −8.56 ÷ 6.17%.

4. Conclusions

Experiments regarding the production and validation of technological solutions with which to produce sustainable protein sources with applications in animal feeding include the utilization of micro-organisms recognized for their capacity to convert renewable sources using industrial biotechnologies.
The overall scope of our research was to obtain brewing yeast biomass that can be mixed with the spent brewing yeast biomass and can be enriched or supplemented with different other bioactive ingredients or nutrients (such as minerals, for example), making the resulted biomass a valuable ingredient to be used for the nutrition of ruminants in wet or dried form. This study explored the optimization of the fermentation conditions used to obtain brewing yeast biomass, which is characterized by high concentrations of dry biomass and protein and a low contact angle.
The results presented in this study indicate that the best fermentation condition combination is not necessarily made up of the highest/smallest values for the responses, but is the combination that leads to responses that are stable, robust, and insensitive to noise factors. This is based on the selection of an optimal product or its cultivation conditions, which consists not only of obtaining the best response values, but also of identifying the conditions that produce characteristics that vary to the minimum extent.
The biomass obtained through the application of the optimal cultivation conditions will be used in suspensions; however, additional studies are necessary to deepen our understanding of the biotechnological processes and to further optimize the biotechnological parameters of the brewing yeast biomass processing (including the final cultivation conditions), as well as to verify the efficiency of the proposed solutions on different substrates based on cheaper and more sustainable feedstock biomass residues and side streams resulted from agriculture and food industry (for example cheaper and more sustainable carbon feedstock than refined sugars), with the final scope to validate and upscale these solutions. The results of this study are expected to benefit the brewing industry, as well as the overall agriculture, food, and feed industry operators to valorize in a sustainable way their resulted side streams.

Author Contributions

Conceptualization: M.V.G., I.D.B., M.B., L.P. and R.I.T.; formal analysis: M.V.G., I.D.B., M.G.A.K., C.D., S.I.M. and A.I.C.; methodology: M.V.G., I.D.B., M.B., L.P., C.-E.D.-P., A.I.C., M.G.A.K., D.L. and R.I.T.; software: M.V.G., L.P. and C.-E.D.-P.; supervision: M.V.G., I.D.B., M.B., L.P. and R.I.T.; visualization: M.V.G., I.D.B., M.B., L.P. and R.I.T.; writing—original draft: M.V.G., I.D.B. and M.B.; writing—review and editing: M.V.G., I.D.B., M.B., S.I.M., F.M. and C.D. All authors have read and agreed to the published version of the manuscript.

Funding

This work was supported by a grant from the Romanian Ministry of Research and Innovation, CCCDI—UEFISCDI, Bridge Grant 26BG/2016, within PNCDI III, and a grant from the Romanian Ministry of Research and Innovation, CCCDI—UEFISCDI, project number PN-III-P3-3.5-EUK-2017-D-0111, within PNCDI III. This paper was financially supported by the Carol Davila University of Medicine and Pharmacy Bucharest through Contract No. CNFIS-FDI-2021-0300 and RDI Capability consolidation at the Institutional level of the multidisciplinary research teams involved in the sustainability of UMFCD priority research directions.

Institutional Review Board Statement

Not applicable.

Informed Consent Statement

Not applicable.

Data Availability Statement

Not applicable.

Conflicts of Interest

The authors declare no conflict of interest.

References

  1. Barrera, O.R.; Salinas-Chavira, J.; Castillo, Y.C. Yeasts as Dietary Additives to Manipulate Ruminal Fermentation: Effect on Nutrient Utilization and Productive Performance of Ruminants. Yeasts Biotechnol. 2019. [Google Scholar] [CrossRef] [Green Version]
  2. Shurson, G. Yeast and yeast derivatives in feed additives and ingredients: Sources, characteristics, animal responses, and quantification methods. Anim. Feed. Sci. Technol. 2018, 235, 60–76. [Google Scholar] [CrossRef]
  3. Retta, K.S. Role of probiotics in rumen fermentation and animal performance: A review. Int. J. Livest. Prod. 2016, 7, 24–32. [Google Scholar] [CrossRef] [Green Version]
  4. Zhu, W.; Zhang, B.X.; Yao, K.; Yoon, I.; Chung, Y.H.; Wang, J.K.; Liu, J.X. Effects of Supplemental Levels of Saccharomyces cerevisiae Fermentation Product on Lactation Performance in Dairy Cows under Heat Stress. Asian Australas. J. Anim. Sci. 2016, 29, 801–806. [Google Scholar] [CrossRef] [PubMed] [Green Version]
  5. Philippini, R.R.; Martiniano, S.E.; Ingle, A.P.; Marcelino, P.R.F.; Silva, G.M.; Barbosa, F.G.; Santos, J.; Da Silva, S.S. Agroindustrial Byproducts for the Generation of Biobased Products: Alternatives for Sustainable Biorefineries. Front. Energy Res. 2020, 8, 152. [Google Scholar] [CrossRef]
  6. Kennes, C. Bioconversion Processes. Fermentation 2018, 4, 21. [Google Scholar] [CrossRef] [Green Version]
  7. Walker, G.M.; Walker, R.S. Enhancing Yeast Alcoholic Fermentations. In Advances in Applied Microbiology; Gadd, G., Sariaslani, S., Eds.; Academic Press: London, UK, 2018; pp. 87–129. [Google Scholar] [CrossRef]
  8. Willaert, R.G. Yeast Biotechnology. Fermentation 2017, 3, 6. [Google Scholar] [CrossRef] [Green Version]
  9. Nielsen, J. Production of biopharmaceutical proteins by yeast: Advances through metabolic engineering. Bioengineered 2013, 4, 207–211. [Google Scholar] [CrossRef] [PubMed] [Green Version]
  10. Ciurzyńska, A.; Lenart, A. Freeze-Drying—Application in Food Processing and Biotechnology—A Review. Pol. J. Food Nutr. Sci. 2011, 61, 165–171. [Google Scholar] [CrossRef] [Green Version]
  11. Aberle, C.; Lewis, M.; Yu, G.; Lei, N.; Xu, J. Liquid marbles as thermally robust droplets: Coating-assisted Leidenfrost-like effect. Soft Matter 2011, 7, 11314–11318. [Google Scholar] [CrossRef] [Green Version]
  12. Ghica, M.V.; Moisescu, S.; Albu, M.G. Design and optimization of some collagen-minocycline based hydrogels potentially applicable for the treatment of cutaneous wound infections. Pharmazie 2011, 66, 853–861. [Google Scholar] [CrossRef] [PubMed]
  13. Ghica, M.V.; Popa, L.; Saramet, G.; Leca, M.; Lupuliasa, D.; Moisescu, S. Optimization of the pharmaceutical products and process design applying Taguchi quality engineering principles. Farmacia 2011, 59, 321–328. [Google Scholar]
  14. Ghica, M.V.; Albu, M.G.; Popa, L.; Moisescu, S. Response surface methodology and Taguchi approach to assess the combined effect of formulation factors on minocycline delivery from collagen sponges. Pharmazie 2013, 68, 340–348. [Google Scholar] [CrossRef]
  15. Ghica, M.V.; Kaya, M.G.A.; Dinu-Pîrvu, C.-E.; Lupuleasa, D.; Udeanu, D.I. Development, Optimization and In Vitro/In Vivo Characterization of Collagen-Dextran Spongious Wound Dressings Loaded with Flufenamic Acid. Molecules 2017, 22, 1552. [Google Scholar] [CrossRef]
  16. Kaya, D.A.; Ghica, M.V.; Dănilă, E.; Öztürk, S.; Türkmen, M.; Kaya, M.G.A.; Dinu-Pîrvu, C.-E. Selection of Optimal Operating Conditions for Extraction of Myrtus Communis L. Essential Oil by the Steam Distillation Method. Molecules 2020, 25, 2399. [Google Scholar] [CrossRef] [PubMed]
  17. Marin, M.M.; Kaya, M.G.A.; Iovu, H.; Stavarache, C.E.; Chelaru, C.; Constantinescu, R.R.; Dinu-Pîrvu, C.-E.; Ghica, M.V. Obtaining, Evaluation, and Optimization of Doxycycline-Loaded Microparticles Intended for the Local Treatment of Infectious Arthritis. Coatings 2020, 10, 990. [Google Scholar] [CrossRef]
  18. Prisada, R.M.; Dinu-Pirvu, C.E.; Moldovan, H.; Ghica, M.V.; Avrămescu, R.E.; Popa, L. Perspectives to describe surface properties of raw pharmaceutical materials. A fractal approach on the wetting of powders. Farmacia 2020, 68, 354–361. [Google Scholar] [CrossRef]
  19. Ghica, M.V.; Albu, M.G.; Kaya, D.A.; Popa, L.; Öztürk, Ș.; Rusu, L.C.; Dinu-Pîrvu, C.; Chelaru, C.; Albu, L.; Meghea, A.; et al. The effect of lavandula essential oils on release of niflumic acid from collagen hydrolysates. Korean J. Chem. Eng. 2016, 33, 1325–1330. [Google Scholar] [CrossRef]
  20. Nowak, E.; Combes, G.; Stitt, E.H.; Pacek, A.W. A comparison of contact angle measurement techniques applied to highly porous catalyst supports. Powder Technol. 2013, 233, 52–64. [Google Scholar] [CrossRef]
  21. Liu, T.; Hao, J.; Yang, B.; Hu, B.; Cui, Z.; Li, S. Contact angle measurements: An alternative approach towards understanding the mechanism of increased drug dissolution from ethylcellulose tablets containing surfactant and exploring the relationship between their contact angles and dissolution behaviors. AAPS PharmSciTech 2018, 19, 1582–1591. [Google Scholar] [CrossRef] [PubMed]
  22. Yang, B.; Wei, C.; Qian, F.; Li, S. Surface wettability modulated by surfactant and its effects on the drug release and absorption of fenofibrate solid dispersions. AAPS PharmSciTech 2019, 20, 234. [Google Scholar] [CrossRef] [PubMed]
  23. Gu, H.; Wang, C.; Gong, S.; Mei, Y.; Li, H.; Ma, W. Investigation on contact angle measurement methods and wettability transition of porous surfaces. Surf. Coat. Technol. 2016, 292, 72–77. [Google Scholar] [CrossRef]
  24. Avrămescu, R.E.; Ghica, M.V.; Dinu-Pîrvu, C.E.; Prisada, R.; Popa, L. Superhydrophobic natural and artificial surfaces—A structural approach. Materials 2018, 11, 866. [Google Scholar] [CrossRef] [Green Version]
  25. Lazghab, M.; Saleh, K.; Pezron, I.; Guigon, P.; Komunjer, L. Wettability assessment of finely divided solids. Powder Technol. 2005, 157, 79–91. [Google Scholar] [CrossRef]
  26. Buckton, G. Assessment of the wettability of pharmaceutical powders. J. Adhes. Sci. Technol. 1993, 7, 205–219. [Google Scholar] [CrossRef]
  27. Alghunaim, A.; Kirdponpattara, S.; Zhang Newby, B. Techniques for determining contact angle and wettability of powders. Powder Technol. 2016, 287, 201–215. [Google Scholar] [CrossRef]
  28. Bormashenko, E. General equation describing wetting of rough surfaces. J. Colloid Interface Sci. 2011, 360, 317–319. [Google Scholar] [CrossRef]
Figure 1. Freeze-drying chart for Saccharomyces pastorianus ssp. carlsbergensis W34/78.
Agriculture 11 01237 g001
Figure 2. Image of the drop shape for the wet biomasses obtained through brewing yeast biotechnological processing for the experiments within the fractional experiment matrix 34 (Table 2): (a) exp. 1; (b) exp. 2; (c) exp. 3; (d) exp. 4 (e) exp. 5; (f) exp. 6; (g) exp. 7; (h) exp. 8; and (i) exp. 9.
Agriculture 11 01237 g002
Figure 3. Plot showing correlation between the observed and predicted values for (a) WCW (g/L), (b) DCW (g), (c) CA (°), (d) PC (%), and (e) DS (%).
Agriculture 11 01237 g003
Figure 4. Plot showing correlation between the expected normal values and residuals for (a) WCW (g/L), (b) DCW (g), (c) CA (°), (d) PC (%), and (e) DS (%).
Agriculture 11 01237 g004
Figure 5. 3D response surface and contour plot showing the effects of different cultivation conditions on the wet biomass response (Y1): (a) temperature (X1) and pH (X2); (b) temperature (X1) and carbon source (X3); (c) temperature (X1) and nitrogen source (X4); (d) pH (X2) and carbon source (X3); (e) pH (X2) and nitrogen source (X4); and (f) carbon source (X3) and nitrogen source (X4).
Agriculture 11 01237 g005aAgriculture 11 01237 g005b
Figure 6. 3D response surface and contour plot showing the effects of different cultivation conditions on the dry biomass response (Y2): (a) temperature (X1) and pH (X2); (b) temperature (X1) and carbon source (X3); (c) temperature (X1) and nitrogen source (X4); (d) pH (X2) and carbon source (X3); (e) pH (X2) and nitrogen source (X4); and (f) carbon source (X3) and nitrogen source (X4).
Agriculture 11 01237 g006
Figure 7. 3D response surface and contour plot showing the effects of different cultivation conditions on the CA (Y3): (a) temperature (X1) and pH (X2); (b) temperature (X1) and carbon source (X3); (c) temperature (X1) and nitrogen source (X4); (d) pH (X2) and carbon source (X3); (e) pH (X2) and nitrogen source (X4); and (f) carbon source (X3) and nitrogen source (X4).
Agriculture 11 01237 g007
Figure 8. 3D response surface and contour plot showing the effects of different cultivation conditions on the response regarding protein content (Y4): (a) temperature (X1) and pH (X2); (b) temperature (X1) and carbon source (X3); (c) temperature (X1) and nitrogen source (X4); (d) pH (X2) and carbon source (X3); (e) pH (X2) and nitrogen source (X4); and (f) carbon source (X3) and nitrogen source (X4).
Agriculture 11 01237 g008
Figure 9. 3D response surface and contour plot showing the effects of different cultivation conditions on the response regarding dry matter content (Y5): (a) temperature (X1) and pH (X2); (b) temperature (X1) and carbon source (X3); (c) temperature (X1) and nitrogen source (X4); (d) pH (X2) and carbon source (X3); (e) pH (X2) and nitrogen source (X4); and (f) carbon source (X3) and nitrogen source (X4).
Agriculture 11 01237 g009
Figure 10. Control factors’ effects on S/N for (a) WCW (g/L); (b) DCW (g); (c) CA (°); (d) PC (%); and (e) DS (%).
Agriculture 11 01237 g010aAgriculture 11 01237 g010b
Table 1. Process variables and experimental conditions in the four-factor, three-level Taguchi design.
Independent VariablesCoded SymbolCoded and Uncoded Variation Levels
Low (1)Middle (2)High (3)
Temperature, T (C°)X1283032
pHX24.54.85.1
Carbon source, CS (g/100 mL)X3141516
Nitrogen source, NS (g/100 mL)X40.50.60.7
Dependent VariablesCoded SymbolConstraints
WCW (g/L)Y1Maximize
DCW (g)Y2Maximize
CA (°)Y3Minimize
PC (%)Y4Maximize
DS (%)Y5Maximize
Table 2. The 34 Taguchi design; coded values for the independent variables.
Exp. No.Independent Variables (Coded Level)
X1 TemperatureX2 pHX3 CSX4 NS
11111
21222
31333
42123
52231
62312
73132
83213
93321
Table 3. Fractional experiment matrix 34—coded and physical independent variable values; the observed and predicted responses of the various parameters obtained by brewing yeast biotechnological processing.
Exp. No.Independent Variables (Coded Level/Physical Level)Responses
X1–T (°C)X2–pHX3–CS (g%)X4–NS (g%)Y1–WCW (g/L)Y2–DCW (g)Y3–CA (°)Y4–PC (%)Y5–DS (%)
Obs.Pred.Obs.Pred.Obs.Pred.Obs.Pred.Obs.Pred.
11 (28)1 (4.5)1 (14)1 (0.5)46.25045.94911.64011.68162.4461.9242.9942.8691.8391.84
21 (28)2 (4.8)2 (15)2 (0.6)54.50055.34415.27214.56859.0861.3442.4842.7792.1692.10
31 (28)3 (5.1)3 (16)3 (0.7)60.50060.22417.65017.66264.0563.5644.8344.7191.6091.61
42 (30)1 (4.5)2 (15)3 (0.7)60.00059.76715.89715.84354.9753.9145.7445.8792.0292.01
52 (30)2 (4.8)3 (16)1 (0.5)51.50051.62613.03214.12556.5255.4844.8944.6992.1592.20
62 (30)3 (5.1)1 (14)2 (0.6)51.25050.83111.93512.19670.0169.5943.4143.3792.7192.74
73 (32)1 (4.5)3 (16)2 (0.6)59.25059.09215.69015.29760.0260.8642.3042.3291.6791.65
83 (32)2 (4.8)1 (14)3 (0.7)51.92552.33713.26013.68151.1351.3441.4541.3090.8990.91
93 (32)3 (5.1)2 (15)1 (0.5)44.72544.72912.42711.74831.0531.2742.6342.8192.1392.08
Table 4. Analysis of variance (ANOVA) for the reduced regression polynomial models.
ResponsesSources of VariationSum of SquaresdfMean SquaresF-Valuep-Value
Y1Regression264.814552.962
0.440
120.3460.00181
<0.05
Residual1.3203
Total266.1348
Y1Regression32.56248.140
0.638
12.7460.01511
<0.05
Residual2.5544
Total35.1168
Y2Regression963.8346160.639
4.416
36.3690.02699
<0.05
Residual8.8332
Total972.6678
Y4Regression16.13262.688
0.113
23.7680.04092
<0.05
Residual0.2262
Total16.3588
Y5Regression2.01160.335
0.004
71.1040.01393
<0.05
Residual0.0092
Total2.0208
Table 5. Optimal combinations of input variable coded levels, the sizes of their effects on the S/N ratio for the system responses, and the expected S/N values.
Control Factors (Input Variables)Y1Y2Y3Y4Y5
“Larger-the-Better”Effect Size“Larger-the-Better”Effect Size“Smaller-the-Better”Effect Size“Larger-the-Better”Effect Size“Larger-the-Better”Effect Size
X120.17210.41631.67320.25120.036
X210.28110.19130.57510.05230.023
X330.61630.82121.50930.11920.019
X430.67630.91011.26830.11420.026
S/N ratio expected (dB)36.23725.235−29.84133.28539.371
Table 6. Combination of optimal cultivation conditions and the observed (experimental) and predicted (theoretical) response variable values.
Exp. No.Combination of Optimal Cultivation ConditionsResponse VariableObserved ValuePredictive ValuePredicted Error (%)
X1:X2:X3:X4
Exp. 1030:4.5:16:0.7Y1 (g/L)62.8966.24−5.06
Y2 (g)16.2517.38−6.50
Y3 (°)63.8765.95−3.15
Y4 (%)47.0550.27−6.40
Y5 (%)91.9292.30−0.41
Exp. 1128:4.5:16:0.7Y1 (g/L)65.0068.14−4.61
Y2 (g)17.2817.75−2.65
Y3 (°)75.2979.72−5.56
Y4 (%)49.8854.55−8.56
Y5 (%)93.4592.05+1.52
Exp. 932:5.1:15:0.5Y1 (g/L)44.7244.73−0.02
Y2 (g)12.4311.75+5.78
Y3 (°)31.0531.27−0.70
Y4 (%)42.6342.81−0.42
Y5 (%)92.1392.08+0.06
Exp. 1230:5.1:15:0.6Y1 (g/L)53.8551.80+3.95
Y2 (g)14.8013.94+6.17
Y3 (°)48.0950.38−4.54
Y4 (%)42.8541.42+3.45
Y5 (%)93.0992.10+1.07
Publisher’s Note: MDPI stays neutral with regard to jurisdictional claims in published maps and institutional affiliations.

