Article

The Crucial Role of Soil Organic Matter in Satisfying the Phosphorus Requirements of Olive Trees (Olea europaea L.)

by
Niki Christopoulou
1,
Theocharis Chatzistathis
2,*,
Efimia M. Papatheodorou
3,
Vassilis Aschonitis
2 and
Nikolaos Monokrousos
1,*
1
Laboratory of Molecular Ecology, International Hellenic University, 57001 Thessaloniki, Greece
2
Institute of Soil and Water Resources, Hellenic Agricultural Organization-Demeter, 57001 Thessaloniki, Greece
3
Department of Ecology, School of Biology, Aristotle University, 54124 Thessaloniki, Greece
*
Authors to whom correspondence should be addressed.
Agriculture 2021, 11(2), 111; https://doi.org/10.3390/agriculture11020111
Submission received: 24 December 2020 / Revised: 21 January 2021 / Accepted: 27 January 2021 / Published: 1 February 2021
(This article belongs to the Special Issue Management Practices for Sustainable Crop Production)

Abstract

:
Under high organic matter content, even under low extractable soil P concentrations, sufficient or over-sufficient foliar P levels may be found. This multi-year study aimed at examining the effects of organic matter content and irrigation management on (a) soil fertility, (b) P-cycle related soil enzymes (acid and alkaline phosphatase, pyrophosphatase) and (c) foliar nutrient concentrations. Irrigated and non-irrigated groves of fully productive trees of the cultivar “Chondrolia Chalkidikis” with low organic matter (LOM < 1.5%), medium organic matter (1.5% < MOM < 2.5%) and high organic matter (HOM > 2.5%) were selected for the experimentation. It was hypothesized that olive groves receiving high inorganic fertilization and irrigation inputs (usually with medium to relatively low organic matter content) would show higher soil and foliar P concentrations compared to the non-irrigated groves with higher organic matter content receiving manure applications. Most of the soil variables (including the three enzymes’ activities) were affected by differences in organic matter content. However, organic matter content did not show a significant influence on foliar nutrient concentrations. Olive trees, especially those cultivated in soils with high organic matter content (receiving organic fertilization), can over-satisfy their P nutritional needs, even though soil analyses show low soil extractable P concentrations, probably due to the high enzymatic activity of acid and alkaline phosphatases. The practical conclusion of this study is that P fertilizer recommendations should be primarily based on foliar P rather than on extractable soil P.

Graphical Abstract

1. Introduction

In recent decades, olive tree cultivation has shifted from traditional, widely spaced and rain-fed orchards to intensive, irrigated orchards, with higher fertilization rates and tree density supported by mechanical harvesting to maximize productivity and profitability [1]. Enhanced yields and increased nutrient demands make nutrition and fertilization a vital part of the management of olive orchards [2]. Of all the essential nutrients, Nitrogen (N), Phosphorus (P), and Potassium (K) are the most crucial for olive trees’ nutrition.
Of these macronutrients, P is of high importance, since it plays a major role in numerous plant physiological processes. Insufficient P availability may significantly depress the photosynthetic rate, root growth and other functions related to plant growth; thus, P deficiency may become a limiting factor to the support of crop yields [3,4]. Soil P can be found in various organic or inorganic dynamic pools; nevertheless, P availability for plants is controlled by physical and chemical reactions, including desorption, precipitation and biological processes, such as the immobilization of P by other plants and soil microorganisms [5]. Despite its relative abundance, a high percentage of P becomes immobile and unavailable for plant uptake [6]. Thus, to overcome phosphate limitation in soils, extended use of inorganic fertilizers has become a common practice, especially in intensive olive groves. Nevertheless, due to the recognized lack of response of olive trees to P application, most fertilization programs overestimate the recommended rates of the applied P [7]. Excessive fertilization in many European countries has led to a build-up of an unavailable P for plant uptake, accumulating soil P pools at unacceptable environmental levels due to the risk of P transfer to aquatic ecosystems [8]. Thus, with the aim of decreasing the high (often unnecessary) P fertilization rates, discussions have recently increased regarding the role and importance of soil organic matter (SOM) on the P nutritional needs of crops.
High SOM content in agricultural soils is required to improve several physicochemical properties [9]. Additionally, increasing numbers of studies have indicated that soil fertility is significantly improved under increased SOM [10]. This effect is attributed to the positive effect that SOM exerts on soil microbial biomass and activity, as well as on soil enzyme activities, which are closely related to soil fertility [11,12]. Soil enzymes catalyze several biochemical reactions, such as the decomposition of soil organic matter and transition between different forms of nutrients [13]. Enzyme activities reflect the magnitude of these biochemical processes and are considered good indicators of soil quality. Since there is a strong correlation between soil enzyme activities, fertility and nutrient uptake, many researchers have studied the effect of fertilization management on plants’ nutritional status by investigating soil enzymatic activity [7]. A significant part of soil P can be found in several organic or inorganic chemical compounds, which are comprised of polyphosphates, orthophosphates, pyrophosphates, phosphonates, orthophosphate monoesters and diesters [14]. These forms of P can be used as a source of P for plant uptake after the release of phosphate, which is promoted by enzyme activity. Phosphatases are a broad group of enzymes that are produced by bacteria, fungi and plant roots and play a crucial role in organic P cycling, since they transform bounded and unavailable forms of organic P into assimilable phosphate, available for plant uptake [15]. However, under P deficiency, soil biota can enhance the production of extracellular phosphatases, while under high P concentrations, phosphatase production tends to be inhibited [16]. Inorganic pyrophosphatase also plays an important role in soil processes, since it catalyzes the hydrolysis of pyrophosphate to orthophosphate, which enables the absorption of P by plants [17]. Pyrophosphate is abundant in soils and it is mainly originated from soil microorganisms, especially fungi [18]. However, due to the difficulties in the quantification of pyrophosphate in soil solutions, its role in plant nutrition remains poorly understood.
Although the influence of P application/fertilization on olive trees’ nutrition and physiology has been studied extensively [7,19,20], no attention has been paid to the combinational effect of soil organic matter content and irrigation on the satisfaction of the P nutritional needs of olive trees. According to our knowledge, only Chatzistathis et al. [21] indicated the beneficial influence of organic matter on the satisfaction of P nutritional needs in fully productive olive trees; however, in their study, the effect of irrigation on foliar P nutrition was not included, and different SOM levels were not included. Thus, the novelty of this study consists of the combinational investigation of three organic matter levels (low, medium and high) and irrigation on soil and foliar P in mature olive trees. We hypothesized that olive groves receiving high inorganic fertilization and irrigation inputs (with a medium to relatively low organic matter content) would show higher soil and foliar P concentrations compared to the non-irrigated groves with higher organic matter content receiving manure applications. To investigate this, we determined soil and foliar P, and we also evaluated the activities of acid and alkaline phosphatases as well as those of pyrophosphatase, since they are all strongly involved in the P cycle and are indicators of soil quality.
The present study aimed at primarily investigating how soils with different organic matter contents (low, medium and high) under different fertilization (inorganic or organic fertilization) and irrigation (rain-fed and irrigated) regimes affect both soil and foliar P concentrations. Finally, another objective of this study was to investigate whether the determination of extractable soil P is sufficient for properly evaluating the nutritional status of olive trees to set the guidelines for proper fertilization recommendations, or if foliar P determination should be also included.

2. Materials and Methods

2.1. Olive Groves’ Management, Study Area and Experimental Design

The multi-year field experimentation was conducted in intensively managed, irrigated olive groves as well as in traditional, non-irrigated groves. All groves had been planted into a 6 × 6 or a 7 × 7 m system and were grown on soils with alkaline pH (varying from 7 to 8.2) and a texture varying from Loam to Sandy Clay Loam. Irrigation was performed with a drip irrigation system (with approximately 300–500 mm water, in five equal doses, during the period from May to September). Furthermore, weed cut and pruning material was left on the soil surface to enrich organic C and nutrient recycling [21,22]. The altitude of the experimental groves varied from 0 to 600 m above sea level. The climate type of the study area is characterized as sub-Mediterranean with hot, dry summers and rainy, mild winters. The mean annual precipitation is approximately 700 mm, with a maximum recorded in November (around 55 mm) and the minimum in August (less than 20 mm) [23]. Regarding the mean monthly temperature, the highest was recorded in August (24.1 °C), while the lowest was found in February (4.7 °C) (Technical Chamber of Greece, Athens, Greece, 2010). For the needs of the study, six fully productive olive groves (25-year-old trees) of the cultivar “Chondrolia Chalkidikis” were selected, whose size ranged from 1 to 1.6 ha.
The irrigated and non-irrigated olive groves of the studied area received either inorganic fertilizers or manures. The groves receiving manure applications showed high soil organic matter (HOM) content (>2.5%) compared to the others (OM < 2.5%) receiving inorganic fertilization. In the case of fields receiving inorganic fertilizers, there were also differences in soil organic matter, due to differences in soil texture (heavier soils have slower rates of mineralization due to lower aeration and thus higher values of organic matter compared to light soils). Thus, the fields receiving inorganic fertilizers were further divided into two groups, based on the OM content: low organic matter (LOM < 1.5%) fields and medium organic matter (1.5% < MOM < 2.5%) fields. The trees in the LOM and MOM fields were approximately fertilized for many years with 50–90 units of N, 3–10 units of P2O5, 80–150 units of K2O ha−1 and 6–12 units of B (borax 11.5%). Each of the three olive grove categories (LOM, MOM and HOM) was split into eight different plots, and each plot included at least 10 trees. From each plot, seven soil samples were collected randomly in the projection of the canopy of olive trees. After the soil samples were collected, they were intermingled, so that a single composite sample was formed for each replicate plot (eight mixed genuine samples). Leaf samples were also collected from the same plots from which soil samples were obtained. The leaves were also mixed so that a single composite sample was formed for each replicate plot. Samplings were conducted approximately three months after the application of inorganic fertilizers or manures.

2.2. Soil Chemical Analyses

Soil samples from the upper 60 cm layer were sieved to pass a 2 mm mesh to remove stones, roots and organic debris and were left to dry for 48 h at room temperature and then transferred to the laboratory. The chemical analysis included soil texture analysis, pH, CaCO3, organic matter, nitrate N (NO3-N), available P and concentrations of K, Ca, and Mg macronutrients as well as B, Fe and Zn micronutrients. The above-mentioned parameters were determined as follows [24]: soil texture analysis was conducted according to the Bouyoucos method, pH was measured in a soil-distilled water paste (1:1), % CaCO3 was determined with the acid neutralization method, organic matter was evaluated with potassium dichromate, nitrate (NO3)-N was determined by using KCl 0.5 mol/L, while extractable P (Pext) was measured according to the Olsen method. The concentrations of Ca, Mg, K, Fe, B and Zn were determined by ICP (Perkin Elmer Optical Emission Spectrometer, OPTIMA 2100 DV, Waltham, MA, USA) [25].

2.3. Leaf Chemical Analyses

Leaf samples were thoroughly washed both with tap and distilled water and then put into an oven at 75 °C for 48 h to dry. Afterwards, they were shuttered and placed in porcelain bowls and incinerated in a furnace at 515 °C for 5 h. The ash was then dissolved with 3 mL HCl 6 N and finally diluted with distilled water to reach the volume of 50 mL. Foliar P, K, Ca, Mg, Fe and Zn concentrations were determined by the ICP method [25]. Total N was evaluated by the method of Kjeldahl, while B was determined according to the method of azomethine-H [26]. Foliar macronutrient (N, P, K, Ca and Mg) concentrations were expressed in % dry weight (d.w.), while those of micronutrients (Fe, Zn, and B) were expressed in mg/kg d.w.

2.4. Determination of Acid, Alkaline and Pyrophosphatase Activity

For the determination of acid, alkaline and pyrophosphatase activities, fresh soil samples from the upper 30 cm were collected from all the experimental plots and transferred to the laboratory. The soil samples were stored at 4 °C and the enzyme activities were measured within a week. Acid (ACP) and alkaline (ALP) phosphatase activities were determined according to the method in [27] in 96-well microplates and 5 mM p-nitrophenyl-phosphate (185.6 mg/100 mL) was used as a substrate solution. A 50 mM sodium acetate buffer with a pH of 5 was used for the determination of ACP, whereas a 50 mM sodium acetate buffer with a pH of 11 was used for ALP. For the colorimetric determination of the product concentrations, we used a spectrophotometer (absorbance at 405 nm). Pyrophosphatase activity was determined as described by Dick and Tabatabai [17], and we used 50 mM pyrophosphate as a substrate solution. For the colorimetric determination of the product concentrations, we used a spectrophotometer at a wavelength of 700 nm.

2.5. Statistical Analysis
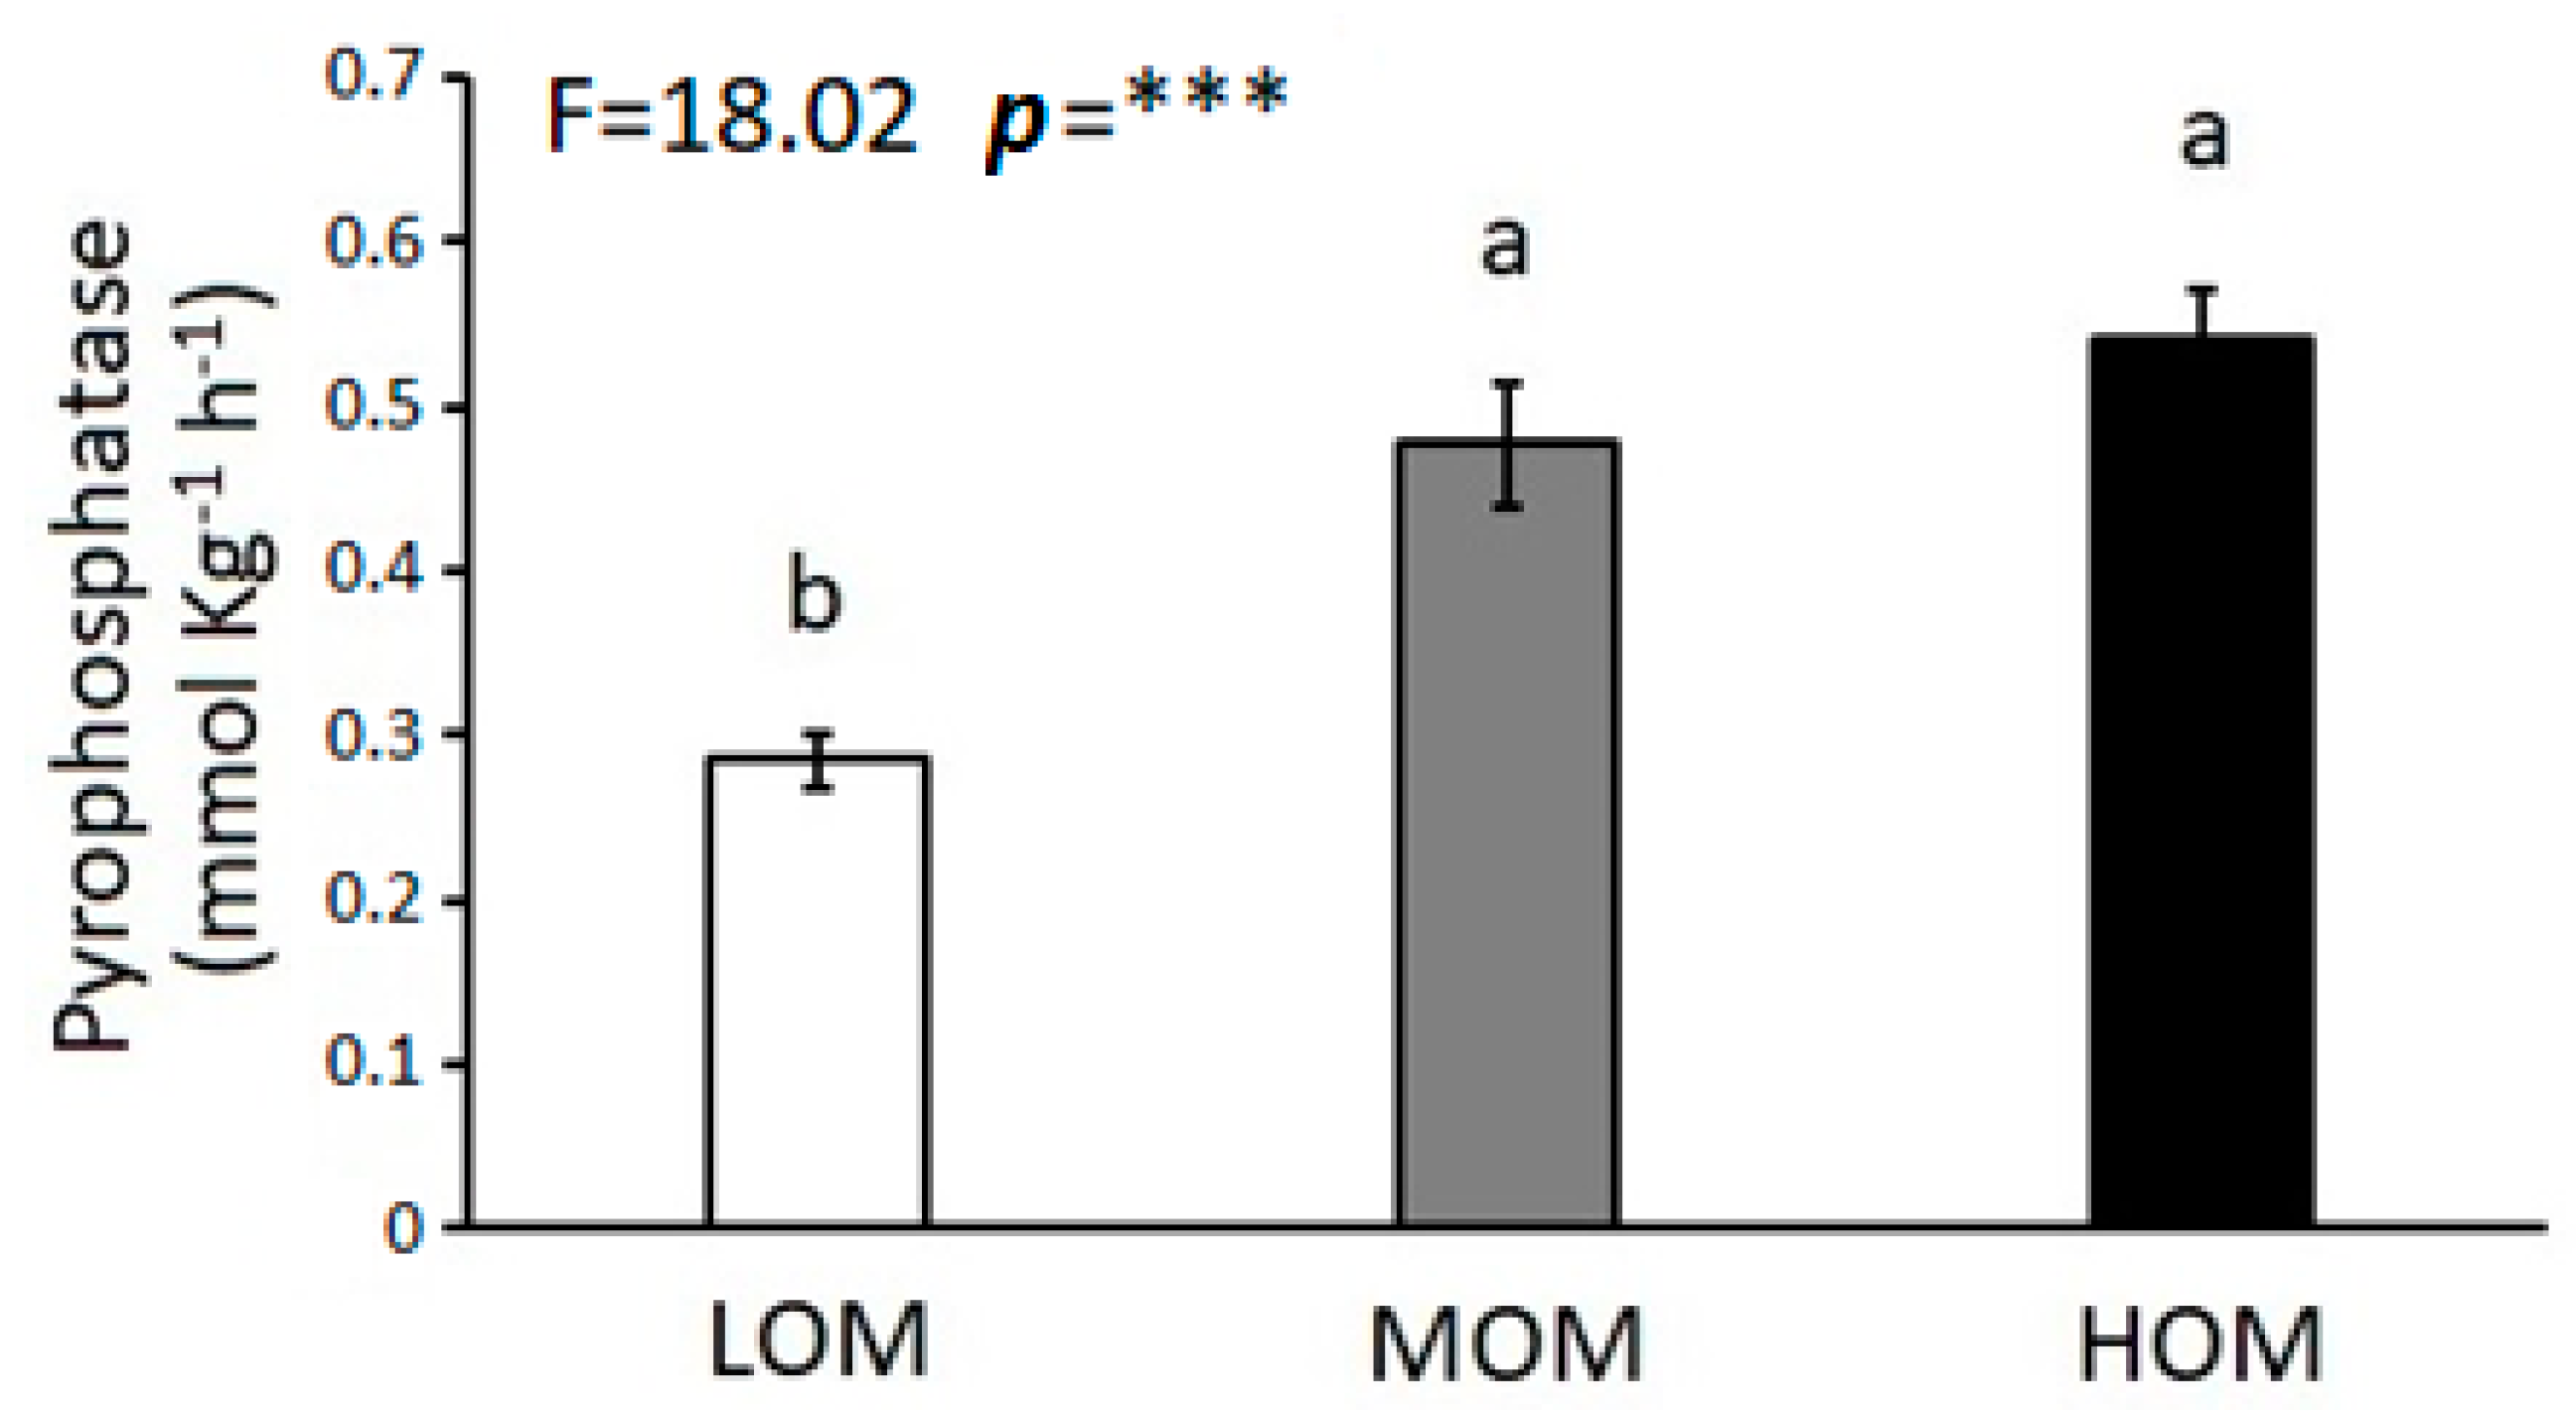
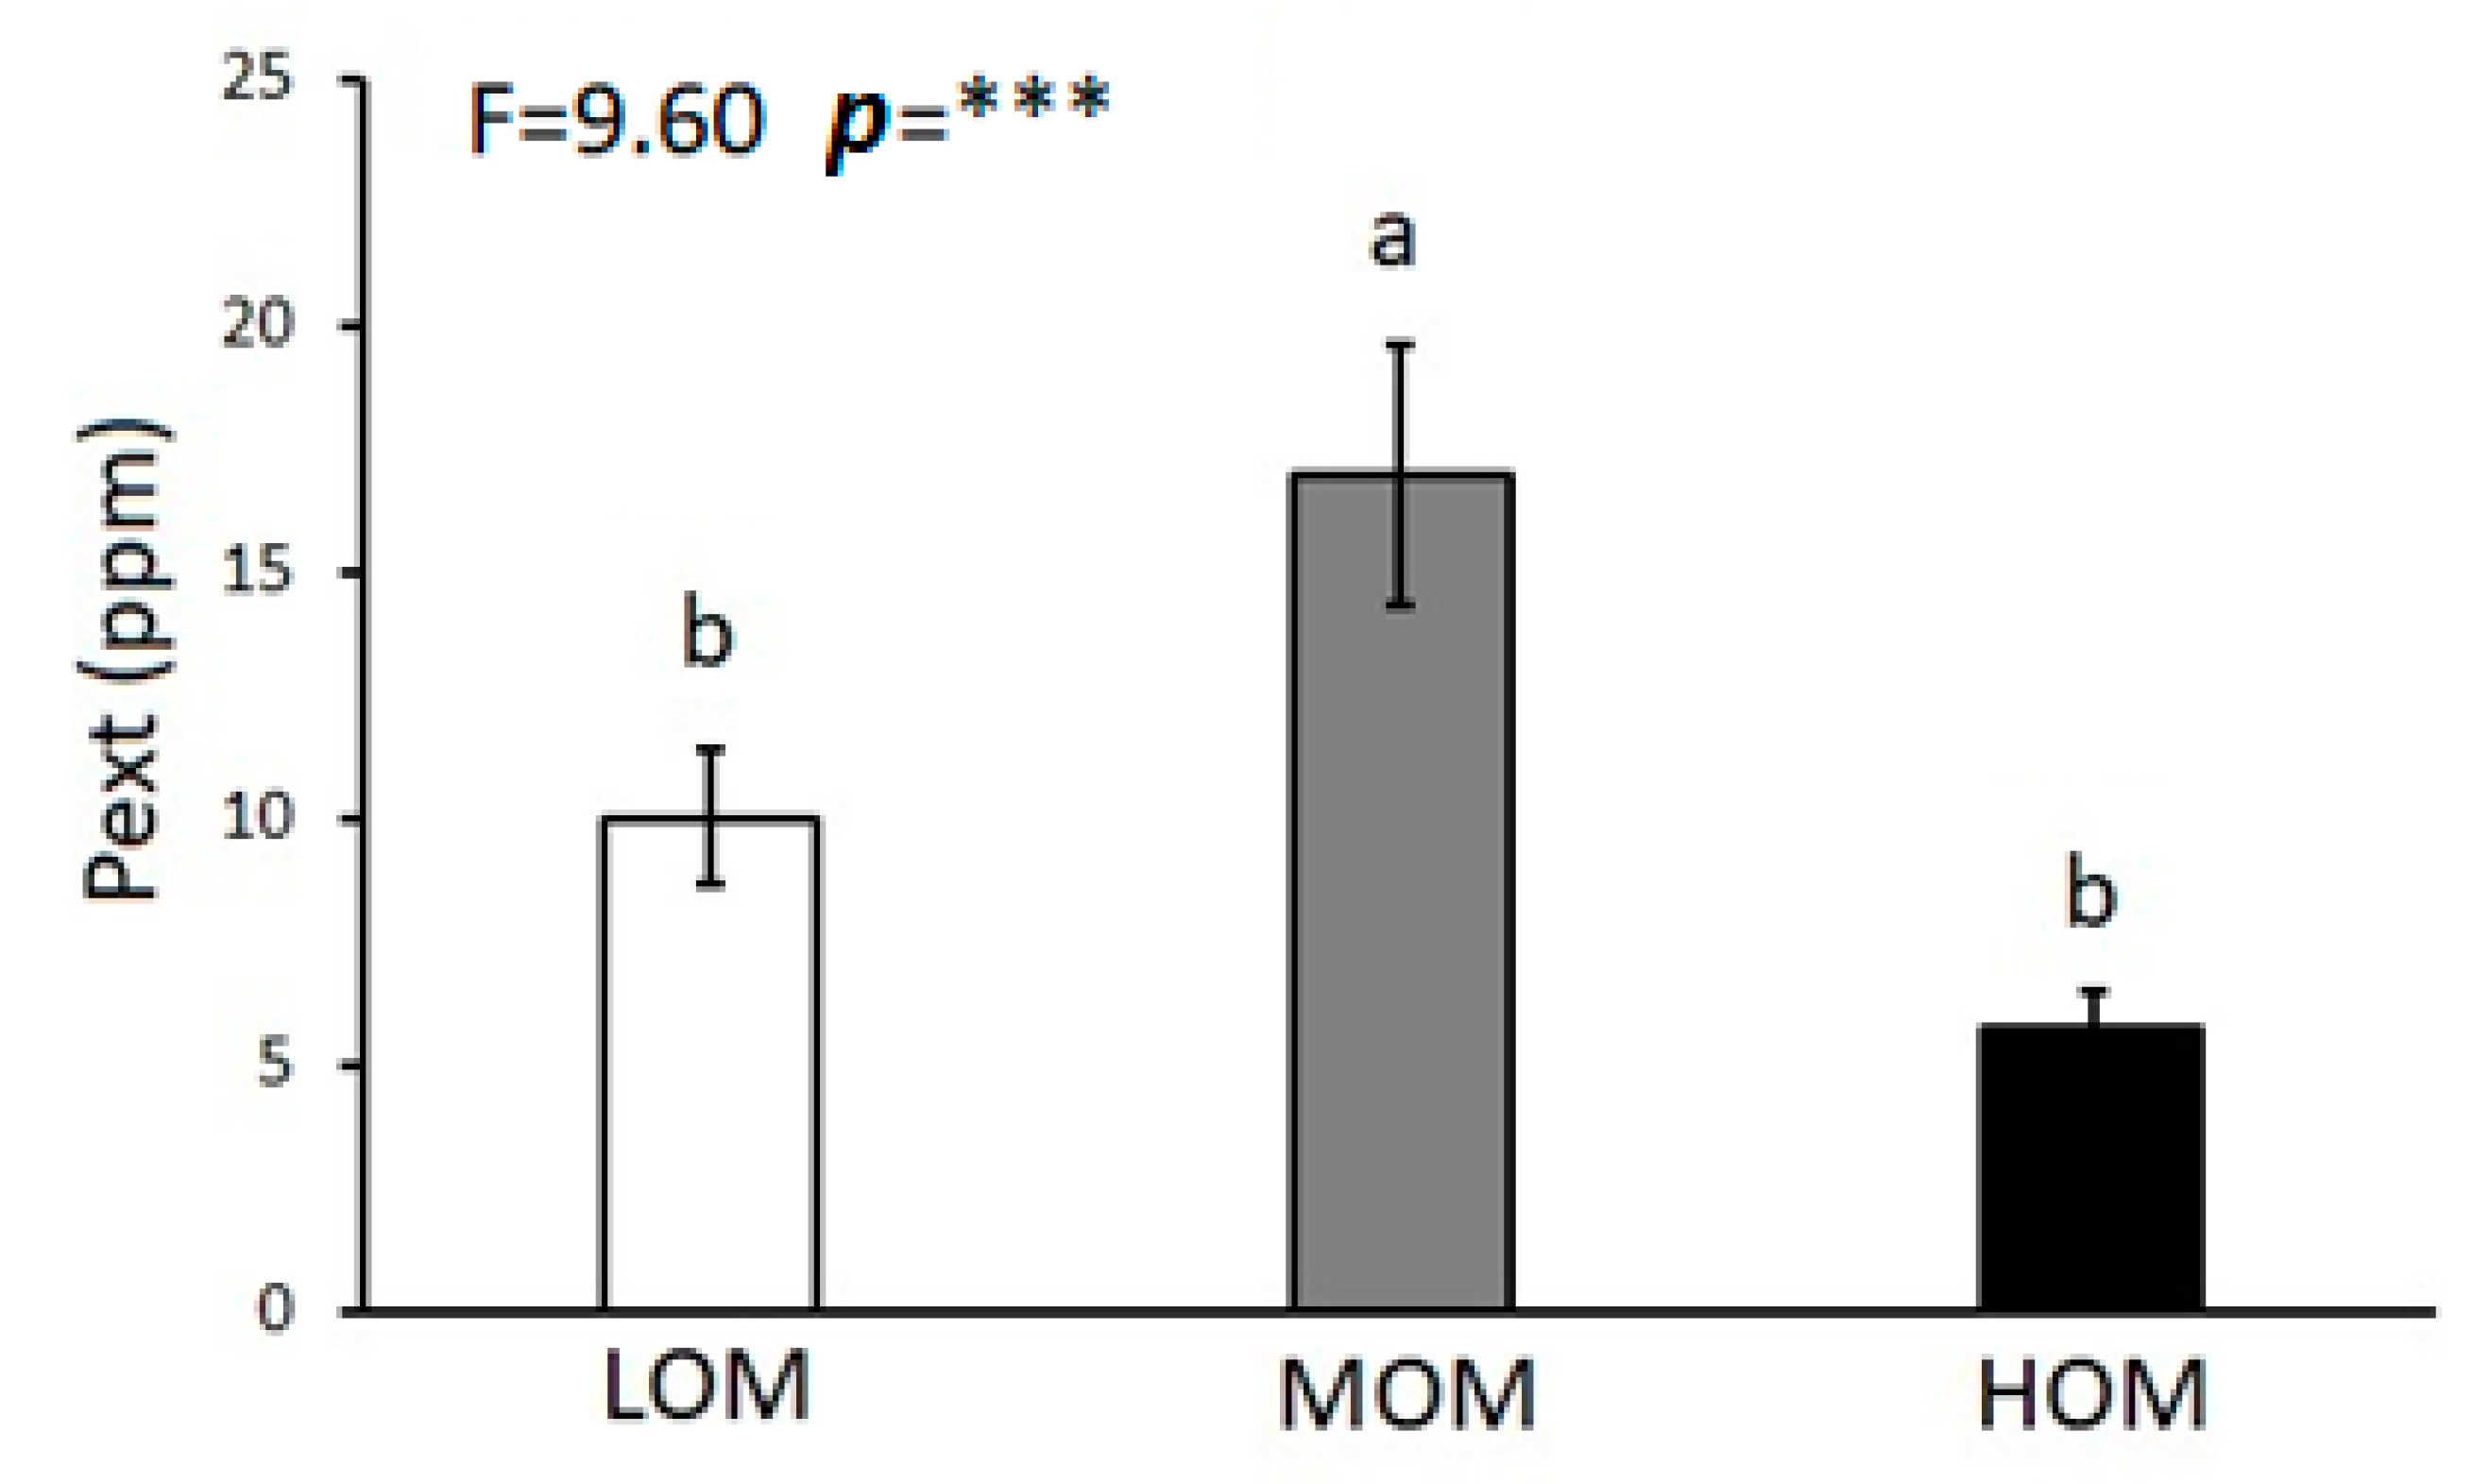
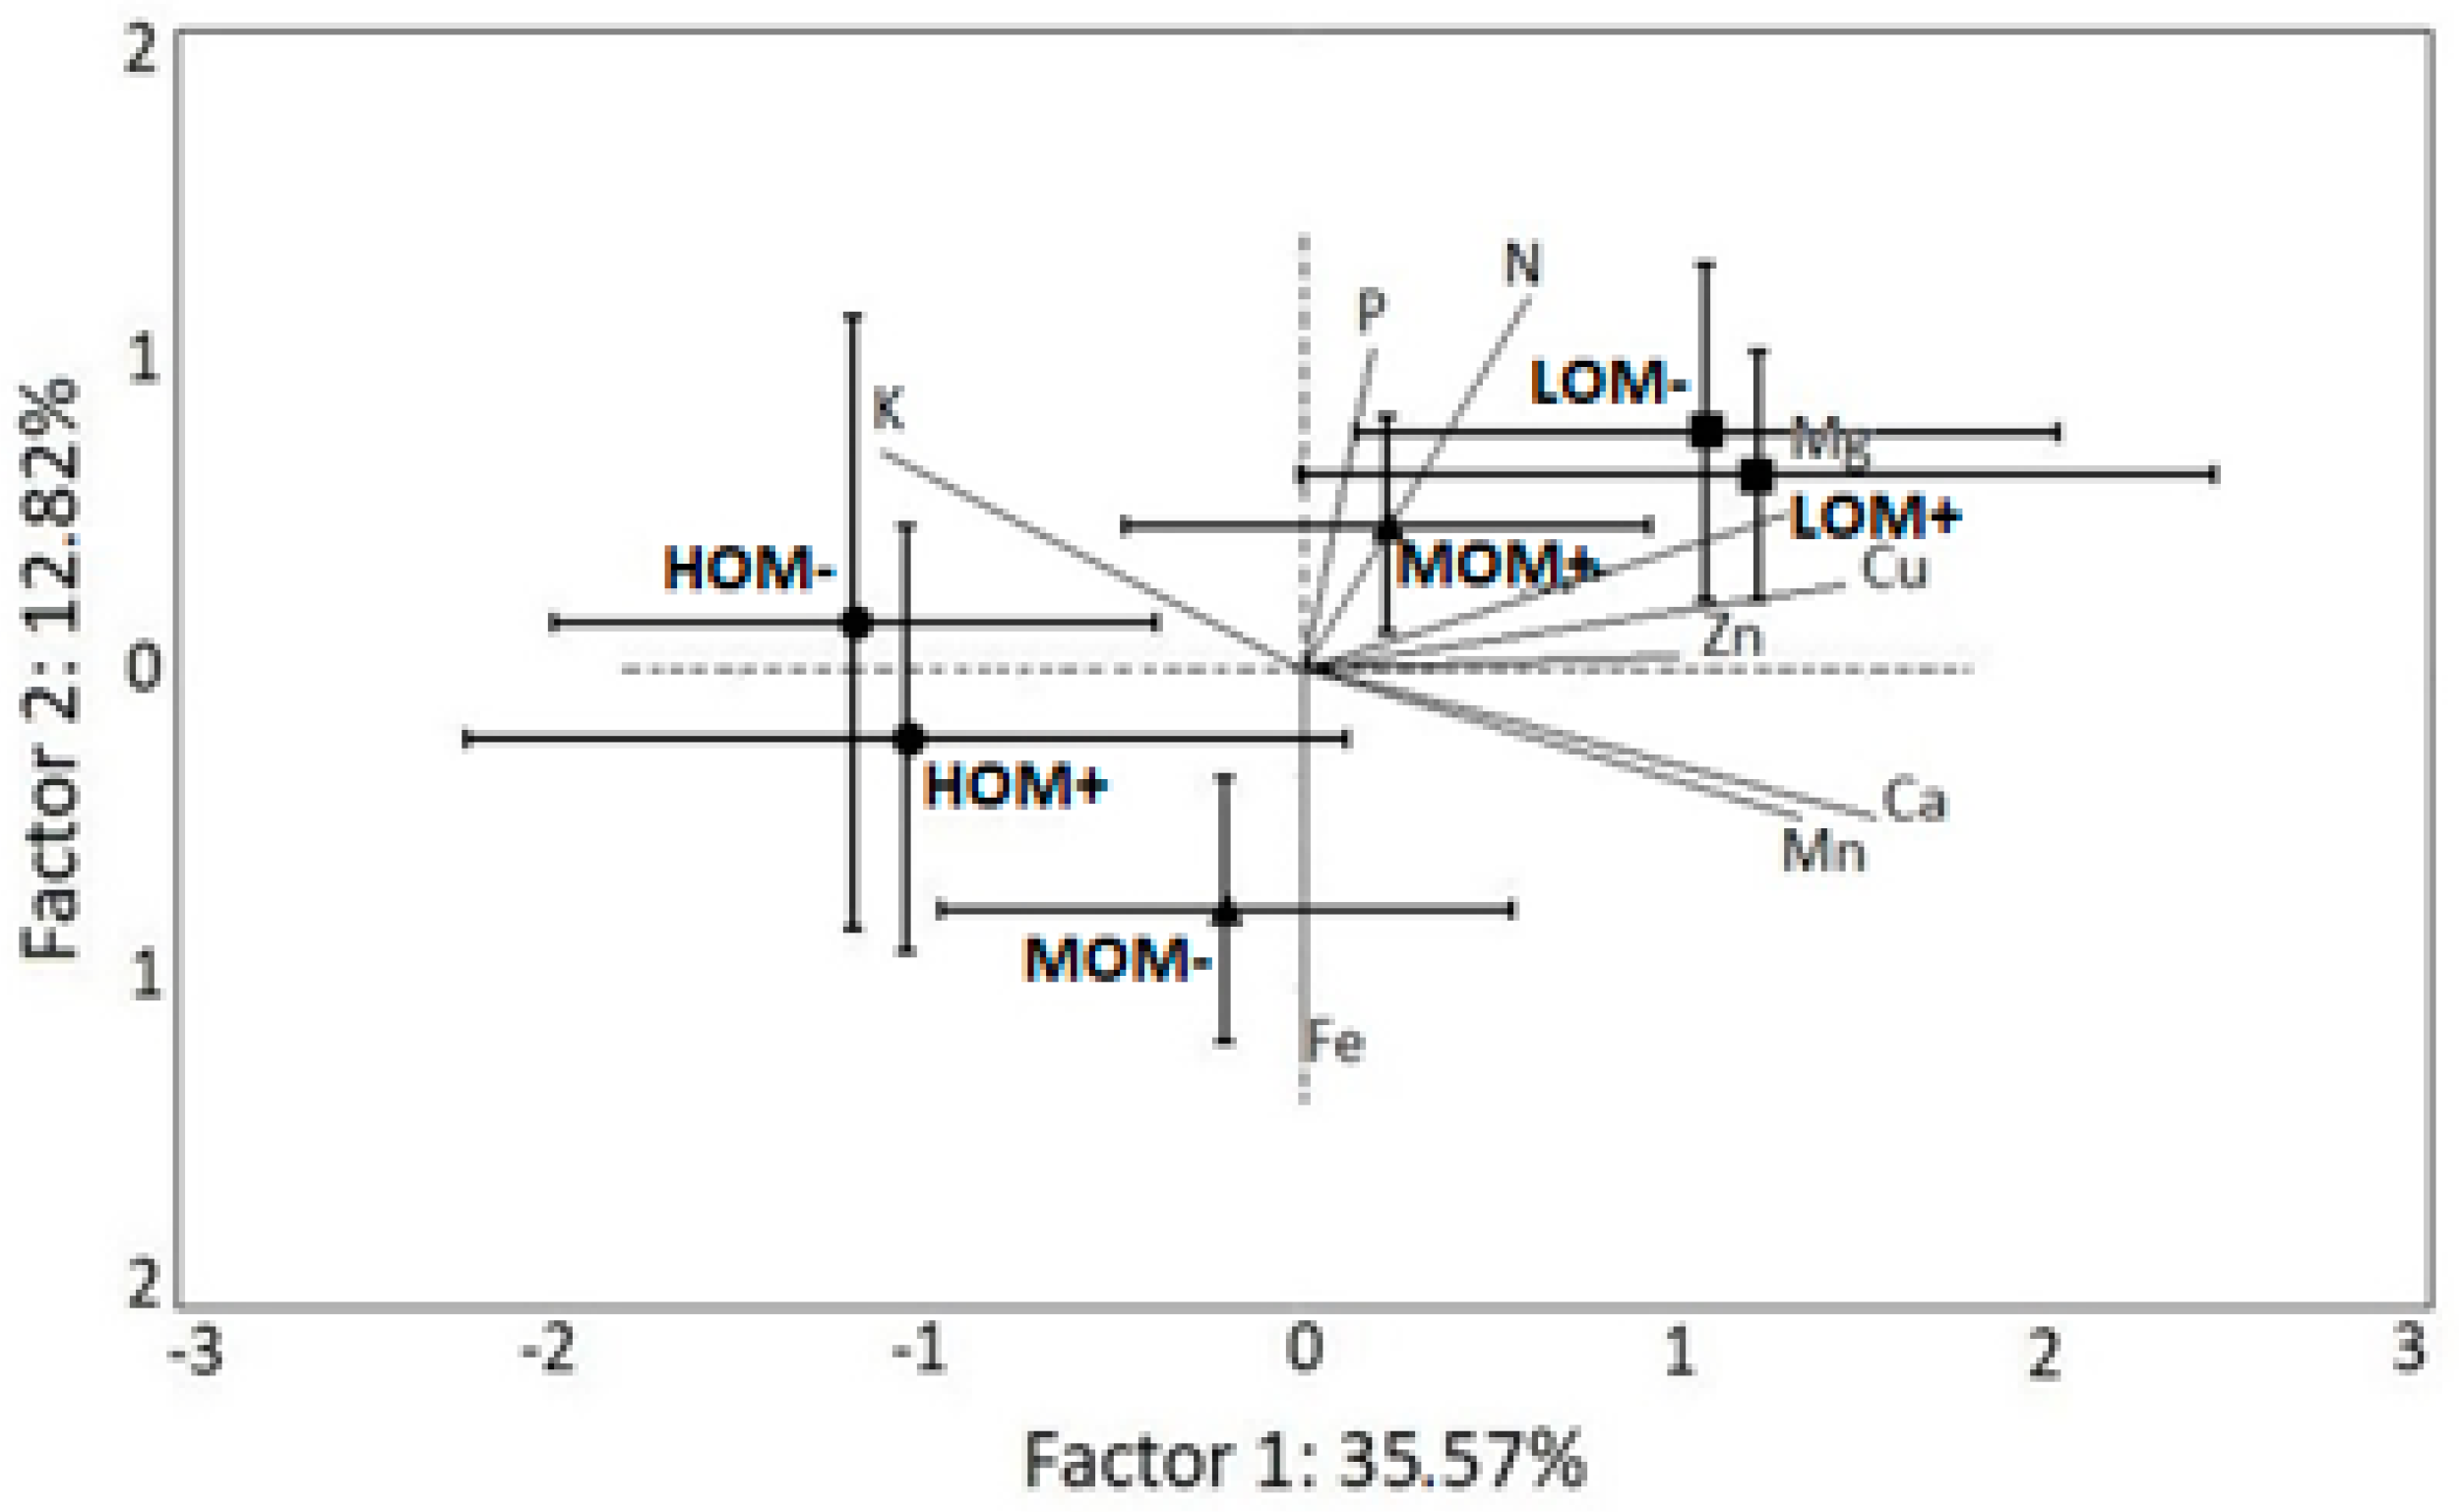
The overall full factorial experimental design consisted of three “SOM content” levels, with two irrigation regimes and eight replicates per treatment. The two-way ANOVA method was used to determine the effect of soil organic matter, irrigation and their interaction on soil physicochemical variables and enzyme activities, as well as on foliar nutrients. In the case of statistically significant effects, the Fisher least significant difference (LSD) post-hoc test was performed at p < 0.05. Furthermore, to examine the relationships among soil enzyme activities and foliar P to soil Pext, regression and Spearman correlation analyses were performed; these analyses served to identify the trends between explanatory and response variables. To further explore whether the organic matter concentration or the irrigation regime exerted the greatest influence on soil and foliar variables, we applied a Principal Component Analysis (PCA). Before analyses, the data were transformed appropriately when considered necessary to meet the assumptions of the ANOVA. Statistical analyses were performed by STATISTICA 9 software.

3. Results

The effects of soil organic matter (OM), irrigation (I) and their interaction on soil physicochemical variables and enzyme activities are presented in Table 1. The results indicated that the effect of irrigation, as well as the interactive effect (OM × I), had no significant impact on any of the estimated soil physicochemical variables. In contrast, most of the soil variables, including the concentrations of Mg, Ca, Fe, Zn and Pext as well as the enzyme activity of acid phosphatase (ACP), alkaline phosphatase (ALP) and pyrophosphatase (PYP), were significantly different under the effect of OM variation. Because irrigation had an insignificant impact on the measurements, the analysis mainly focused on how soil organic matter per se affected enzyme activities and Pext. The enzymatic activity of acid and alkaline phosphatase in the three soil types with low (LOM), medium (MOM) and high (HOM) organic matter content was evaluated (Figure 1a,b). The results of the one-way ANOVA revealed that ACP (Figure 1a) and ALP (Figure 1b) activities showed a similar pattern, presenting statistically significant lower activity values in LOM and MOM soil samples compared to HOM. PYP activity values also increased with the increase in organic matter, where MOM and HOM showed significantly higher values compared with LOM (Figure 2). Further analysis also focused on the effect of different organic matter contents on soil extractable phosphorus (Pext), where it was observed that Pext concentration was significantly higher in MOM than in LOM, while Pext in HOM was lower for both LOM and MOM (Figure 3).
Regarding the foliar nutrient concentrations, factorial ANOVA results indicated that there was no significant difference between the treatments, with the exceptions of N, K and Mg (Table 2). The one-way ANOVA analysis of leaf P concentrations also verified that there was no significant difference between LOM, MOM and HOM soil samples (Figure 4).
Furthermore, Spearman rank (r) correlations were performed to describe the relationship between (i) ACP, (ii) ALP, (iii) PYP and (iv) foliar P versus soil Pext (Figure 5a–d). The results showed that the Spearman r values for ACP, ALP and foliar P versus Pext were statistically significant. The activity values of ACP and ALP enzymes were reduced (Figure 5a,b), whereas foliar P values were increased with the increase of Pext (Figure 5b). In contrast, PYP values were found to be independent of Pext changes (Figure 5c).
To obtain an overall visualization of the multivariable interactions, a Principal Component Analysis (PCA) was also conducted. The ordination of soil treatments and soil variables on the PCA biplot is depicted in Figure 6. The first two axes of the PCA accounted for 46.1% of the data variability (the first axis explained 31.22% of the variability, while the second explained 14.88%). Samples from the HOM fields were ordinated within the left side of the biplot, while the LOM and MOM samples occupied the right side of the biplot irrespective of the irrigation regime. The high soil ACP, ALP and PYP enzyme activities were the main soil variables characterizing the HOM samples, while LOM and MOM samples were mostly characterized by the increased Pext concentrations. In relation to the second axis, the LOM samples were ordinated at the upper part and were separated from the MOM samples (bottom part). The PCA results indicated that the organic matter effect masked the effect of the irrigation management regime on soil biochemical variables. It is also clear that the HOM samples were much more coherent than the other two groups.
The ordination of treatments based on leaf nutrient variables is presented in Figure 7. The first two axes explained 38.39% of the variability (35.57% and 12.82%, respectively). The pattern of ordination differs in comparison to the PCA graph of the soil variables, as the treatments were not as clearly differentiated and mainly ordinated towards the center of the biplot. Pext was not among the variables that significantly affected the ordination of the leaf samples.

4. Discussion

Previous studies have indicated that irrigation favors several biochemical and biological soil properties that are correlated with increased olive tree yields [28]. However, our results showed that irrigation did not significantly affect most of the estimated parameters, including soil and foliar P concentrations (Table 1 and Table 2). Our findings agree with those of Ding et al. [29] for wheat plants. The results regarding the effect of irrigation may seem controversial as they depend on the climatic conditions and the precipitation in the study area. Kavvadias et al. [30] studied the effect of organic amendments and irrigation management on the soil chemical and microbial properties of olive groves in the region of Crete, with a mean annual precipitation of 460 mm. Most of the soil properties including total nitrogen, inorganic nitrogen (NO3), exchangeable K, Pext, soil microbial respiration and microbial biomass were favored by irrigation. Meanwhile, Kavvadias et al. [31] conducted a similar study in the south-western Peloponnese with an annual precipitation of 1.100 mm (AQUASTAT, 2017). In that case, due to the high loads of rain in the study area, any irrigation effect on the soil properties was masked, and no significant differences among the studied soil properties were recorded. Our study area, located in Chalkidiki (Central Macedonia, Northern Greece), also receives sufficient loads of rainfall, since the annual precipitation rate during the last 30 years is higher than 700 mm [23]. This could possibly explain our findings that there was practically no differentiation between irrigated and non-irrigated (rain-fed) plots.
Most of the estimated soil variables, including Pext concentration, were significantly higher in MOM and LOM soil samples compared to the HOM samples (Table 1, Figure 3). Since LOM and MOM fields received external inputs of inorganic P fertilizers, which is a direct way to increase the available P pools, Pext was expected to be higher in these than HOM, where only organic inputs were applied. Chatzistathis et al. [21] also studied the response of olive trees to P mineral fertilization and found that inorganic and total P, as well as Pext, were significantly increased compared to the non-fertilized trees. The foliar analysis (Figure 4) showed that the trees grown in HOM fields presented over-sufficient P concentrations, similar to those found in the LOM and MOM sites. Similarly, Ferreira et al. [7] reported that low levels of soil Pext do not necessarily mean low leaf P content, showing that the P nutritional status of olive trees was adequate even in fields showing soil P inadequacy. Our initial hypothesis seems to be partially verified since soils receiving high inorganic fertilization inputs showed higher concentration of soil Pext but not higher foliar P concentrations. This means that foliar nutrient determination may be a more representative procedure than soil analysis to evaluate the nutritional status of olive trees. These results are in accordance with those of Ferreira et al. [7] and Chatzistathis et al. [21] and verify the second objective of the study, suggesting that soil analysis is not sufficient to provide reliable results about proper fertilization guidelines.
Many researchers have also investigated the influence of soil organic matter on phosphorus availability; however, there are still controversial results in the literature, depending on the nature of organic amendments, plant systems, management practices and specific soil properties. Yusran [32] showed that phosphate was significantly higher in soils amended with organic materials than in unamended soil; other researchers [33] reported that organic amendments significantly increased the desorption of P from the soil, thus increasing P availability. The addition of organic amendments in soil may increase phosphate availability by abiotic processes, such as ligand-exchange effects on phosphate adsorption or biotic processes such as the decomposition and mineralization of organic P [34]. To interpret the effect of organic matter content and inorganic P fertilization on P availability, the enzymatic activity of acid and alkaline phosphatases and pyrophosphatase was also estimated. ANOVA results (Figure 1) revealed that acid and alkaline phosphatase activities were significantly higher in HOM samples, while their activity was suppressed in soils with low organic matter content (LOM and MOM). It is generally accepted that soil organic matter and microbial biomass are strongly associated with soil enzyme activities [35]. Many authors agree that soils treated with various types of organic amendments (e.g., plant residues, manure and vermicompost) showed higher phosphatase activity than soils treated only with inorganic fertilizers [36,37]. Reddy et al. [38] reported that the activities of acid and alkaline phosphatases among soils with different levels of soil organic carbon (SOC) were in the order of high SOC > medium SOC > low SOC soils. Tejada and Benítez [39] also studied the effect of three organic wastes on several enzymatic activities, including phosphatases, in an olive grove, and their results indicated that the stimulation of biochemical properties and phosphatase activity was higher in the organically amended soils. In this study, pyrophosphatase activity was also significantly higher in HOM (Figure 2), and this fact is also supported by earlier studies, indicating that pyrophosphatase activity is suppressed by decreased organic matter content [17].
The application of Spearman correlations indicated that acid and alkaline phosphatases followed the same pattern, showing a negative correlation to Pext (Figure 5a,b). These results are in agreement with those of Song et al. [40], who also found a negative correlation between acid and alkaline phosphatase activity with available P, thus indicating that Pext estimation may depict only the current status of available P but not the latent capability of the system to release P through phosphatase activity [21]. However, they found a positive correlation between phosphatase activity and organic P and suggested that organic P fractions may be more useful tools to evaluate phosphatase activity and the capacity of the system to obtain labile P. In our study, inorganic fertilization inputs in the LOM plots possibly suppressed the activity of phosphatases. Chatzistathis et al. [21] also reported that inorganic P fertilizers suppressed the activities of acid and alkaline phosphatase to much lower levels than those found in non-fertilized soil samples. On the other hand, it is widely accepted that soil P deficiency can significantly alter the composition of root exudates, leading to an increase in phosphatase production by plant roots and microorganisms [41]. Yadav and Tarafdar [42] revealed that, under P-deficient conditions, the secretion of acid phosphatase was found in several crops, including cereals, legumes and oilseed crops. In contrast, pyrophosphatase values practically remained constant and independent from Pext concentration variations (Figure 5c). Reitzel et al. [43], after testing the activity of pyrophosphatase with three inorganic and 14 different organic P compounds, found that pyrophosphatase was very specific to the target substrate (pyrophosphate). These results, in combination with the results of this study, indicate that the role of pyrophosphatase may be of great importance in soil; however, it is a poor indicator to evaluate biologically available phosphorus.
The PCA results in soil (Figure 6) showed that soil organic matter content was a factor that strongly affected most of the estimated soil variables. The ordination of the samples also revealed that HOM soils are characterized by high enzymatic activity, while MOM and LOM present a higher availability of Pext and N. Regarding leaf nutrient concentrations, PCA results (Figure 7) revealed that leaves presented a similar pattern, but the effect of the soil organic matter concentrations was not as strong as it was in relation to the soil physicochemical properties. This could be justified by the fact that foliar nutrient concentrations, and especially P, did not present high fluctuations, which was also verified by other studies [7,21]. These results partially verified the initial hypothesis that soils receiving inorganic fertilizer inputs can be expected to have higher soil and foliar P concentrations than organically amended soils.

5. Conclusions

Our study showed that LOM and MOM fields that received external inputs of inorganic P fertilizers presented greater soil Pext concentrations than HOM fields receiving only organic fertilization. On the contrary, olive trees grown in HOM fields presented over-sufficient foliar P concentrations, similar to those found in the LOM and MOM sites. These results could be attributed to the high enzymatic activity of acid and alkaline phosphatases in the HOM fields. Overall, our results indicate that soil analysis may underestimate the P nutritional needs of olive trees, in comparison to foliar P analysis; in that case, the oversupply of phosphate fertilizers is a common practice. Phosphorus fertilizer recommendations should be primarily based on foliar rather than on soil analysis. In addition, maintaining or even increasing soil organic matter should be a priority for farmers to support sustainable soil P management and production in olive groves. Furthermore, the effect of irrigation management in fields receiving sufficient rainfall rates is expected not to significantly affect soil chemical variables.

Author Contributions

Conceptualization, N.M., and T.C.; investigation, N.C.; data analysis, N.M.; writing—original draft preparation, N.C. and N.M.; writing—review and editing, T.C., E.M.P., and V.A. All authors have read and agreed to the published version of the manuscript.

Funding

This research received no external funding.

Institutional Review Board Statement

Not applicable for studies not involving humans or animals.

Informed Consent Statement

Not applicable for studies not involving humans.

Data Availability Statement

The data presented in this study are available on request from the corresponding author.

Conflicts of Interest

The authors declare no conflict of interest.

References

  1. Fernández-Escobar, R.; Guerreiro, M.; Benlloch, M.; Benlloch-González, M. Symptoms of nutrient deficiencies in young olive trees and leaf nutrient concentration at which such symptoms appear. Sci. Hortic. 2016, 209, 279–285. [Google Scholar] [CrossRef]
  2. Connor, D.J.; Fereres, E. The physiology of adaptation and yield expression in olive. Hortic. Rev. Am. Soc. Hortic. Sci. 2010, 31, 155–229. [Google Scholar] [CrossRef]
  3. Vance, C.P.; Uhde-Stone, C.; Allan, D.L. Phosphorus acquisition and use: Critical adaptations by plants for securing a nonrenewable resource. New Phytol. 2003, 157, 423–447. [Google Scholar] [CrossRef] [Green Version]
  4. Olivera, M.; Tejera, N.; Iribarne, C.; Ocaña, A.; Lluch, C. Growth, nitrogen fixation and ammonium assimilation in common bean (Phaseolus vulgaris): Effect of phosphorus. Physiol. Plant. 2004, 121, 498–505. [Google Scholar] [CrossRef]
  5. Meena, M.D.; Narjary, B.; Sheoran, P.; Jat, H.S.; Joshi, P.K.; Chinchmalatpure, A.R.; Yadav, G.; Yadav, R.K.; Meena, M.K. Changes of phosphorus fractions in saline soil amended with municipal solid waste compost and mineral fertilizers in a mustard-pearl millet cropping system. Catena 2018, 160, 32–40. [Google Scholar] [CrossRef]
  6. Holford, I.C.R. Soil phosphorus: Its measurement, and its uptake by plants. Aust. J. Soil Res. 1997, 35, 227–239. [Google Scholar] [CrossRef]
  7. Ferreira, I.Q.; Rodrigues, M.Â.; Moutinho-Pereira, J.M.; Correia, C.M.; Arrobas, M. Olive tree response to applied phosphorus in field and pot experiments. Sci. Hortic. 2018, 234, 236–244. [Google Scholar] [CrossRef] [Green Version]
  8. Haygarth, P.M.; Jarvie, H.P.; Powers, S.M.; Sharpley, A.N.; Elser, J.J.; Shen, J.; Peterson, H.M.; Chan, N.I.; Howden, N.J.K.; Burt, T.; et al. Sustainable phosphorus management and the need for a long-term perspective: The legacy hypothesis. Environ. Sci. Technol. 2014, 48, 8417–8419. [Google Scholar] [CrossRef]
  9. Robertson, G.P.; Gross, K.L.; Hamilton, S.K.; Landis, D.A.; Schmidt, T.M.; Snapp, S.S.; Swinton, S.M. Farming for ecosystem services: An ecological approach to production agriculture. Bioscience 2014, 64, 404–415. [Google Scholar] [CrossRef]
  10. Bechara, E.; Papafilippaki, A.; Doupis, G.; Sofo, A.; Koubouris, G. Nutrient dynamics, soil properties and microbiological aspects in an irrigated olive orchard managed with five different management systems involving soil tillage, cover crops and compost. J. Water Clim. Chang. 2018, 9, 736–747. [Google Scholar] [CrossRef]
  11. Moreno, B.; Garcia-Rodriguez, S.; Cañizares, R.; Castro, J.; Benítez, E. Rainfed olive farming in south-eastern Spain: Long-term effect of soil management on biological indicators of soil quality. Agric. Ecosyst. Environ. 2009, 131, 333–339. [Google Scholar] [CrossRef]
  12. Nieto, O.M.; Castro, J.; Fernández-Ondoño, E. Uso sustentável de solos de olival. Influência das técnicas de maneio nas suas propriedades. Spanish J. Soil Sci. 2012, 2, 70–77. [Google Scholar] [CrossRef]
  13. Burns, R.G.; DeForest, J.L.; Marxsen, J.; Sinsabaugh, R.L.; Stromberger, M.E.; Wallenstein, M.D.; Weintraub, M.N.; Zoppini, A. Soil enzymes in a changing environment: Current knowledge and future directions. Soil Biol. Biochem. 2013, 58, 216–234. [Google Scholar] [CrossRef]
  14. Turner, B.L.; Mahieu, N.; Condron, L.M. The phosphorus composition of temperate pasture soils determined by NaOH-EDTA extraction and solution 31P NMR spectroscopy. Org. Geochem. 2003, 34, 1199–1210. [Google Scholar] [CrossRef]
  15. Nannipieri, P.; Giagnoni, L.; Landi, L.; Renella, G. Role of phosphatase enzymes in soil. In Phosphorus in Action; Springer: Berlin/Heidelberg, Germany, 2011; pp. 215–243. [Google Scholar]
  16. Wang, J.B.; Chen, Z.H.; Chen, L.J.; Zhu, A.N.; Wu, Z.J. Surface soil phosphorus and phosphatase activities affected by tillage and crop residue input amounts. Plant Soil Environ. 2011, 57, 251–257. [Google Scholar] [CrossRef] [Green Version]
  17. Dick, W.A.; Tabatabai, M.A. Inorganic pyrophosphatase activity of soils. Soil Biol. Biochem. 1978, 10, 58–65. [Google Scholar] [CrossRef]
  18. Bünemann, E.K.; Smernik, R.J.; Marschner, P.; McNeill, A.M. Microbial synthesis of organic and condensed forms of phosphorus in acid and calcareous soils. Soil Biol. Biochem. 2008, 40, 932–946. [Google Scholar] [CrossRef]
  19. Jimenez-Moreno, M.J.; Fernandez-Escobar, R. Response of young olive plants (Olea europaea) to phosphorus application. Sci. Hortic. 2016, 51, 1167–1170. [Google Scholar] [CrossRef]
  20. Jimenez-Moreno, M.J.; Fernandez-Escobar, R. Influence of nutritional status of phosphorus on flowering in the olive (Olea europaea L.). Sci. Hortic. 2017, 223, 1–4. [Google Scholar] [CrossRef]
  21. Chatzistathis, T.; Monokrousos, N.; Psoma, P.; Tziachris, P.; Metaxa, I.; Strikos, G.; Papadopoulos, F.H.; Papadopoulos, A.H. How fully productive olive trees (Olea europaea L., cv. ‘Chondrolia Chalkidikis’) manage to over-satisfy their P nutritional needs under low Olsen P availability in soils? Sci. Hortic. 2020, 265, 109251. [Google Scholar] [CrossRef]
  22. Chatzistathis, T.; Delviniotis, A.; Panagakos, A.; Giannakoula, A.; Tranaka, V.; Molassiotis, A. Foliar manganese, zinc and boron application effects on mineral nutrition of an experimental olive grove (cv. “Chondrolia Chalkidikis”). J. Plant Nutr. 2017, 40, 1728–1742. [Google Scholar] [CrossRef]
  23. Stathis, D.; Mavromatis, T. Characteristics of precipitation in thessaloniki area, North Greece. Fresenius Environ. Bull. 2009, 18, 1270–1275. [Google Scholar]
  24. Allen, E. Chemical Analysis of Ecological Materials; Blackwell Scientific Publishing: Oxford, UK, 1976. [Google Scholar]
  25. Chyla, M.A.; Zyrnicki, W. Determination of metal concentrations in animal hair by the ICP method: Comparison of various washing procedures. Biol. Trace Elem. Res. 2000, 75, 187–194. [Google Scholar] [CrossRef]
  26. Wolf, B. Communications in Soil Science and Plant Analysis Improvements in the azomethine—H method for the determination of boron. Commun. Soil Sci. Plant Anal. 1974, 5, 37–41. [Google Scholar] [CrossRef]
  27. Allison, S.D.; Jastrow, J.D. Activities of extracellular enzymes in physically isolated fractions of restored grassland soils. Soil Biol. Biochem. 2006, 38, 3245–3256. [Google Scholar] [CrossRef]
  28. Martorana, A.; Di Miceli, C.; Alfonzo, A.; Settanni, L.; Gaglio, R.; Caruso, T.; Moschetti, G.; Francesca, N. Effects of irrigation treatments on the quality of table olives produced with the Greek-style process. Ann. Microbiol. 2017, 67, 37–48. [Google Scholar] [CrossRef] [Green Version]
  29. Ding, Z.; Kheir, A.M.S.; Ali, M.G.M.; Ali, O.A.M.; Abdelaal, A.I.N.; Lin, X.; Zhou, Z.; Wang, B.; Liu, B.; He, Z. The integrated effect of salinity, organic amendments, phosphorus fertilizers, and deficit irrigation on soil properties, phosphorus fractionation and wheat productivity. Sci. Rep. 2020, 10, 1–13. [Google Scholar] [CrossRef] [Green Version]
  30. Kavvadias, V.; Papadopoulou, M.; Vavoulidou, E.; Theocharopoulos, S.; Koubouris, G.; Psarras, G.; Manolaraki, C.; Giakoumaki, G.; Vasiliadis, A. Effect of sustainable management of olive tree residues on soil fertility in irrigated and rain-fed olive orchards. J. Water Clim. Chang. 2018, 9, 764–774. [Google Scholar] [CrossRef]
  31. Kavvadias, V.; Papadopoulou, M.; Vavoulidou, E.; Theocharopoulos, S.; Repas, S.; Koubouris, G.; Psarras, G.; Kokkinos, G. Effect of addition of organic materials and irrigation practices on soil quality in olive groves. J. Water Clim. Chang. 2018, 9, 775–785. [Google Scholar] [CrossRef]
  32. Yusran, F.H. Existing versus added soil organic matter in relation to phosphorus availability on lateritic soils. J. Trop. Soils 2008, 13, 23–34. [Google Scholar] [CrossRef]
  33. Sui, Y.; Thompson, M.L. Phosphorus sorption, desorption, and buffering capacity in a biosolids-amended Mollisol. Soil Sci. Soc. Am. J. 2000, 64, 164–169. [Google Scholar] [CrossRef]
  34. Yusran, F.H. The relationship between phosphate adsorption and soil organic carbon from organic matter addition. J. Trop. Soils 2018, 15, 1–10. [Google Scholar] [CrossRef]
  35. Monokrousos, N.; Papatheodorou, E.M.; Diamantopoulos, J.D.; Stamou, G.P. Soil quality variables in organically and conventionally cultivated field sites. Soil Biol. Biochem. 2006, 38. [Google Scholar] [CrossRef]
  36. Tang, H.M.; Xiao, X.P.; Tang, W.G.; Lin, Y.C.; Wang, K.; Yang, G.L. Effects of winter cover crops residue returning on soil enzyme activities and soil microbial community in double-cropping rice fields. PLoS ONE 2014, 9, 1–8. [Google Scholar] [CrossRef]
  37. Yadav, B.; Sr, N.; Bl, Y.; Sharma, S.; Meena, S.K. Effect of different fertility levels and organic manures on biological properties of soil in Pearl millet. J. Pharmacogn. Phytochem. 2020, 9, 210–213. [Google Scholar]
  38. Reddy, S.B.; Nagaraja, M.S.; Mallesha, B.C.; Kadalli, G.G. Enzyme Activities at Varied Soil Organic Carbon Gradients under Different Land Use Systems of Hassan District in Karnataka. Int. J. Curr. Microbiol. Appl. Sci. 2020, 9, 1739–1745. [Google Scholar] [CrossRef]
  39. Tejada, M.; Benítez, C. Application of vermicomposts and compost on tomato growth in Greenhouses. Compost Sci. Util. 2015, 23, 94–103. [Google Scholar] [CrossRef]
  40. Song, X.; Razavi, B.S.; Ludwig, B.; Zamanian, K.; Zang, H.; Kuzyakov, Y.; Dippold, M.A.; Gunina, A. Combined biochar and nitrogen application stimulates enzyme activity and root plasticity. Sci. Total Environ. 2020, 735, 139393. [Google Scholar] [CrossRef]
  41. Acosta-Martínez, V.; Tabatabai, M.A. Phosphorous cycle enzymes. In Methods of Soil Enzymology; Dick, R.P., Ed.; Soil Science Society of America: Madison, WI, USA, 2011; pp. 161–183. [Google Scholar]
  42. Yadav, R.; Tarafdar, J. Influence of organic and inorganic phosphorus supply on the maximum secretion of acid phosphatase by plants. Biol. Fertil. Soils 2001, 34, 140–143. [Google Scholar] [CrossRef]
  43. Reitzel, K.; Turner, B.L. Quantification of pyrophosphate in soil solution by pyrophosphatase hydrolysis. Soil Biol. Biochem. 2014, 74, 95–97. [Google Scholar] [CrossRef]
Figure 1. (a,b). Acid (ACP) and alkaline phosphatase (ALP) activities (± SE) in different soil organic matter contents. Different letters refer to statistically significant differences between treatments, revealed by ANOVA and Fischer least significant difference (LSD) test comparisons. (**: p ≤ 0.01; ***: p ≤ 0.001). LOM: low organic matter; MOM: medium organic matter; HOM: high organic matter.
Agriculture 11 00111 g001
Figure 2. Pyrophosphatase activity (±SE) in different soil organic matter contents. Different letters refer to statistically significant differences between treatments, revealed by ANOVA and Fischer LSD test comparisons. (***: p ≤ 0.001).
Agriculture 11 00111 g002
Figure 3. Extractable phosphorus (Pext) concentration (±SE) under different soil organic matter contents. Different letters refer to statistically significant differences between the treatments, as revealed by ANOVA and Fischer LSD test comparisons. (***: p ≤ 0.001).
Agriculture 11 00111 g003
Figure 4. Foliar phosphorus (P) concentrations (±SE) under different soil organic matter contents. No statistically significant differences between the treatments were revealed by the ANOVA (ns: non-significant).
Agriculture 11 00111 g004
Figure 5. (ad). Spearman correlations and regression analyses of acid and alkaline phosphatase, pyrophosphatase activity and foliar P concentration in relation to soil available P (Pext) (Spearman correlation coefficient: ns = non-significant; **: p ≤ 0.01; ***: p ≤ 0.001).
Agriculture 11 00111 g005
Figure 6. Ordination of the soil samples according to the soil physicochemical variables and enzyme activities on a PCA biplot. Each point corresponds to the mean value of the loadings of the eight samples belonging to the same treatment, at the first and the second axis; the first symbol corresponds to the organic matter content (LOM: low, MOM: medium, HOM: high), and the second to the specific irrigation regime (+: irrigation, -: no irrigation). Error bars indicate standard errors for both axes (n = 8).
Agriculture 11 00111 g006
Figure 7. Ordination of the leaf samples according to the leaf nutrient variables on a PCA biplot. Each point corresponds to the mean value of the loadings of the eight samples belonging to the same treatment for the first and the second axis; the first symbol corresponds to the organic matter content (LOM: low, MOM: medium, HOM: high) and the second to the specific irrigation regime (+: irrigation, -: no irrigation). Error bars indicate standard errors for both axes (n = 8).
Agriculture 11 00111 g007
Table 1. Mean values (± SE) of the soil nutrient concentrations and enzymatic activity at various treatments. +I and -I refer to irrigation and non-irrigation; OM: organic matter; ACP: Acid phosphatase; ALP: Alkaline phosphatase; PYP: pyrophosphatase. (ANOVA, ns: non-significant; *: p ≤ 0.05; **: p ≤ 0.01; ***: p ≤ 0.001).
LOM +ILOM -IMOM +IMOM -IHOM +IHOM -IOMIOM × I
NO3 (ppm)132.60 (86.89)64.12 (21.04)203.91 (50.25)79.41 (25.65)47.92 (13.28)62.84 (7.34)F = 1.14 p = nsF = 1.61 p = nsF = 0.73 p = ns
K (ppm)254.72 (39.46)272.50 (67.55)384.25 (74.33)416.12 (81.33)271.01 (125.11)343.57 (89.52)F = 1.36 p = nsF = 0.30 p = nsF = 0.04 p = ns
Mg (ppm)512.27 (81.44)577.01 (114.52)620.81 (127.68)717.87 (258.70)371.50 (167.99)199.85 (24.59)F = 3.67 p = * F = 0.01 p = nsF = 0.49 p = ns
Ca (ppm)101.10 (0.00)101.02 (0.00)299.40 (135.39)787.01 (268.98)316.75 (215.75)219.57 (118.57)F = 4.43 p = **F = 0.99 p = nsF = 2.09 p = ns
Fe (ppm)4.20 (0.49)5.45 (1.48)14.29 (4.09)22.03 (4.32)20.25 (5.45)21.20 (3.37)F = 9.30 p = ***F = 1.07 p = nsF = 0.53 p = ns
Zn (ppm)0.84 (0.13)1.04 (0.20)1.02 (0.11)1.08 (0.09)2.16 (0.29)1.48 (0.20)F = 12.21 p = ***F = 0.57 p = nsF = 3.06 p = ns
B (ppm)1.52 (0.44)1.71 (0.40)1.42 (0.27)2.71 (1.30)9.10 (7.18)2.01 (1.34)F = 2.88 p = nsF = 1.82 p = nsF = 3.28 p = ns
Pext (ppm)10.45 (1.67)9.32 (2.37)12.56 (2.30)11.04 (2.17)5.94 (1.21)5.70 (0.91)F = 4.29 p = * F = 0.33 p = nsF = 0.05 p = ns
ACP (mmol Kg−1h−1)0.25 (0.03)0.45 (0.04)0.33 (0.04)0.49 (0.06)0.71 (0.16)0.63 (0.04)F = 17.50 p = *** F = 4.48 p = * F = 3.44 p = ns
ALP (mmol Kg−1h−1)0.32 (0.03)0.42 (0.04)0.33 (0.05)0.54 (0.10)0.54 (0.04)0.60 (0.05)F = 4.89 p = ** F = 5.98 p = * F = 0.77 p = ns
PYP (mmol Kg−1h−1)0.27 (0.02)0.30 (0.03)0.39 (0.04)0.60 (0.05)0.55 (0.09)0.53 (0.03)F = 20.18 p = *** F = 4.56 p = * F = 4.35 p = ns
Table 2. Mean values (±SE) of foliar nutrient concentrations at various treatments. +I and -I refer to irrigation and non-irrigation; OM: organic matter. (ANOVA, ns: non-significant; *: p ≤ 0.05; **: p ≤ 0.01).
LOM +ILOM -IMOM +IMOM -IHOM +IHOM -IOMIOM × I
Νtotal %1.59 (0.06)1.55 (0.04)1.50 (0.07)1.17 (0.10)1.22 (0.18)1.29 (0.08)F = 6.24 p = *F = 1.92 p = nsF = 2.79 p = ns
P %0.36 (0.03)0.34 (0.04)0.38 (0.03)0.38 (0.03)0.37 (0.07)0.29 (0.03)F = 1.07 p = nsF = 1.22 p = nsF = 0.81 p = ns
Κ %0.72 (0.04)0.73 (0.05)0.77 (0.05)0.95 (0.06)0.89 (0.06)0.89 (0.05)F = 3.93 p = * F = 1.25 p = nsF = 2.02 p = ns
Ca %2.07 (0.12)1.94 (0.22)2.03 (0.21)1.40 (0.22)1.59 (0.17)1.55 (0.11)F = 2.46 p = nsF = 2.80 p = nsF = 1.49 p = ns
Mg %0.25 (0.02)0.25 (0.02)0.24 (0.03)0.22 (0.03)0.17 (0.01)0.16 (0.01)F = 5.18 p = ** F = 0.29 p = nsF = 0.08 p = ns
B (ppm)28.66 (3.10)28.15 (1.95)26.68 (2.72)22.08 (1.40)20.04 (0.80)23.26 (1.41)F = 3.04 p = nsF = 0.08 p = nsF = 1.09 p = ns
Zn (ppm)13.77 (1.40)15.79 (1.05)13.06 (0.88)11.59 (1.09)12.22 (0.96)13.53 (0.96)F = 2.23 p = nsF = 0.36 p = nsF = 1.21 p = ns
Fe (ppm)67.90 (7.55)61.82 (2.11)68.64 (4.47)85.88 (11.13)65.29 (11.27)92.28 (9.58)F = 1.27 p = nsF = 2.65 p = nsF = 1.51 p = ns
Publisher’s Note: MDPI stays neutral with regard to jurisdictional claims in published maps and institutional affiliations.

