Abstract
Rapeseed (Brassica napus L. ssp. oleifera Metzg) is attacked by a wide range of pests. Breeding of resistant cultivars is one of the best methods of protecting crops against insects, and non-cultivated species of Brassicaceae can be used as resistance donors. In this study, we investigated the relationship between nutrient content and resistance to two commonly occurring pests (Delia radicum and Brevicoryne brassicae) in 12 Brassicaceae hybrid combinations. The experiment was conducted at Poznań University of Life Sciences Experimental Station located in Dłoń. The assessment was carried out for three years (2017, 2018, and 2019) on randomly chosen individuals in two growth stages: vegetative stage and flowering stage. The resistance to B. brassicae and D. radicum was observed in all three years, however, macronutrient and micronutrient contents as well as total nitrogen, total sulfur, and sulfur sulfate were observed only in 2019. Statistically significant negative association between Ca and resistance to B. brassicae and D. radicum was discovered. Additionally, positive association between Cu and resistance to B. brassicae was observed. The importance of selected mineral elements in plant resistance is widely discussed.
1. Introduction
Rapeseed (Brassica napus L. ssp. oleifera Metzg) is a major crop plant and one of the most important oil sources in the world [1,2]. Currently, rapeseed growers face numerous problems that limit plant productivity, quality, and seed yield such as climate changes affecting the growth condition or increased pest infestation [3]. Rapeseed may be attacked by a large number of specialist insects. Cabbage aphid (Brevicoryne brassicae L.) (Homoptera: Aphididae) and cabbage root fly (Delia radicum L.) (Diptera: Anthomyiidae) are economically important pests in many regions of the world including Poland.
D. radicum is a pest originating from Europe, present across the entire Northern Hemisphere [4]. Larvae of D. radicum damage rapeseed plants by chewing mines in the roots, occasionally penetrating the stem and the head of the plant. Larvae feeding results in delayed growth, wilting, and stunting. Heavy infestation may result in reduced seed number or even plant death [5].
B. brassicae is a highly specialized pest, attacking only the Brassicaceae family. Insect is present in most temperate regions. Up to 15–20 generations can be completed during the growing season, depending on weather conditions [4,6]. Rapid development rate often results in severe infestation, leading to the death of young seedlings and wilting of adult plants. Other symptoms include yellowing and curling of the leaves, deformation of heads, and reduced yield, often followed by contamination caused by the presence of honeydew and dead aphids [4,6]. B. brassicae is also an important vector of virus diseases [7].
Breeding resistant cultivars is one of the best methods of protecting rapeseed against dangerous insects. It is also considered as the most economical and ecological friendly approach of reducing the number of many pests [8]. One of the limiting factors of this method is an insufficient number of resistance genes within the cultivated species of Brassicaceae family. On the other hand, non-cultivated species of Brassicaceae can be an interesting source of genetic variability, and serve as a donor of resistance to insects. Interspecific crosses between chosen wild genotypes and rapeseed plants may allow the transfer of useful agronomical traits such as resistance to certain pests or diseases. This is why our research team’s work in the Department of Genetics and Plant Breeding (Poznań University of Life Sciences) focuses on obtaining and studying hybrid Brassicaceae plants, especially analyzing the presence of resistance to commonly occurring insect pests. Recently, we concentrated our efforts on investigating the relationship between the amount of selected elemental minerals in hybrid plants and their field resistance to insects. Nutrients, both macro- and micronutrients, are essential for plant development. Traditionally, three nutrients (i.e., N, P and K) have been considered to be the most crucial, as most crops have high requirements for them. Apart from the above-mentioned elemental minerals, S, Ca, Mg and Na also play a significant role in plant metabolism. Moreover, micronutrients are responsible for increasing both the quantity and quality of crop yield through their involvement in the metabolism of N, P, K, Ca, Mg, and S as well as crop responses to environmental stress conditions [9,10]. Aside from significant influence on yield amount, some mineral elements play a major role in plant response to herbivores. For example, calcium ions act as a second messenger in signal pathways after herbivore attack. They activate calcium-sensitive proteins and eventually lead to the formation of jasmonates and activation of defense genes [11].
Macro- and micronutrients are responsible for various functions as structural components in macromolecules [12]. First of all, a special role is assigned to macronutrients because they are generally required at the concentration of greater than 0.1% of dry matter. In the case of the Brassicaceae family, the significance of sulfur is underlined. Sulfur, besides nitrogen, is involved in synthesizing plant defense compounds such as glucosinolates. These compounds are hydrolyzed as a result of plant cell damage under the influence of the enzyme myrosinase. Together with the enzyme glucosinolases, which breaks them down, they constitute the two-component defense system of plants against pathogens and pests [11,13,14]. Aside from its great effect on glucosinolate content, nitrogen also affects the potential attractiveness of a plant to pests as it plays a major role in determining plant architecture and quality [15]. A similar real meaning may be attached to many compounds that contain S because they have metabolic, structural, and regulatory functions and are ubiquitous [16,17].
As mentioned earlier, besides macronutrients, micronutrients are a necessary requirement by plants, although in smaller amounts—less than 0.01% of dry matter. Regardless, micronutrients play an important role in the growth and development of plants. Some metals (i.e., Cu and Zn) and their compounds show remarkable bactericidal and fungicidal activity [12].
Considering the significant roles of macro- and micronutrients in plant physiology, the potential influence of element concentrations in plant tissues of Brassicaceae hybrids on resistance to chosen pests was investigated as a main aim of the study. In detail, research was connected to the plants’ response to two different insects: Delia radicum (Cabbage root fly) and Brevicoryne brassicae (Cabbage aphid).
2. Materials and Methods
2.1. Plant Material
Twelve hybrid combinations (F5–F7) were used as research material (Table 1). All genotypes were obtained at the Department of Genetics and Plant Breeding, Poznań University of Life Sciences (PULS) with the use of in vitro technique described by Niemann et al. [18].

Table 1.
List of hybrid genotypes used in the study.
2.2. Field Conditions
The experiment was conducted at the Poznań University of Life Sciences Experimental Station located in Dłoń (51°41′23.835″ N 17°4′1.414″ E), on a typical heavy soil of III quality class. The experiment was carried out in a randomized complete block design with three replications. For plant analysis, we chose 10 plants per hybrid in each replication in each year of study. Agricultural practices were optimal for local agroecological conditions. Wheat (Triticum aestivum L.) was used as a forecrop in three preceding years. The pre-sowing fertilization consisted of ammonium phosphate (200 kg ha−1) and ammonium nitrate (100 kg ha−1). During spring, four more fertilizers were used: Saletrosan 26 (300 kg ha−1), ammonium nitrate (200 kg ha−1), and ADOB Bor, containing borum and nitrogen, which was also used as an autumn treatment. One fungicide—Caryx 240SL (1 L ha−1) was used during plant growth.
2.3. Assessment of Pest Resistance
Resistance to two insects, Delia radicum and Brevicoryne brassicae, was assessed during field trials. The assessment of general damage caused by D. radicum and B. brassicae infestation was performed in 2017, 2018, and 2019. The evaluation of direct damage on roots for D. radicum, and the percentage of infested plants by B. brassicae was executed according to the European and Mediterranean Plant Protection Organization (EPPO) standards [19] on randomly chosen individuals (Figure 1 and Figure 2). For every genotype, ten plants were assessed in each replication. The severity of insect damage and plant infestation were evaluated at physiological maturity on a one to nine scoring scale, used commonly by the Research Center for Cultivar Testing in Poland, which corresponds to the International Union for the Protection of New Varieties of Plants [20] system of assessment. According to this scale, for D. radicum, a score of nine means no visible damage on plants (highly resistant), a score of five means that lesions are visible on up to 25% of the roots and surface of the leaves (moderately resistant), and a score of one means a completely damaged plant (fully susceptible). For B. brassicae, a score of nine means no insects present on the plant (highly resistant), a score of five means small and medium sized colonies on the plant (moderately resistant), and a score of one means that the plant is completely covered by aphid colonies (fully susceptible). The average values from ten plants were calculated for each replication, which allowed us to obtain quantitative traits data with the normal distributions.
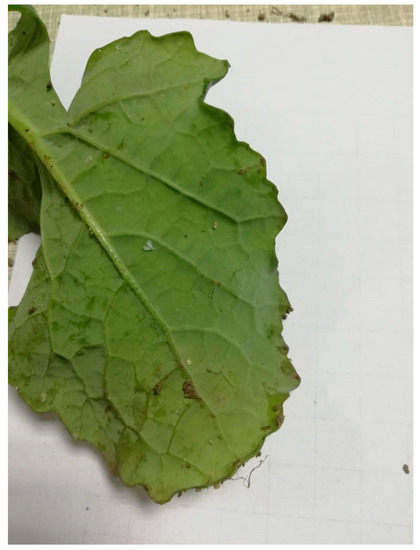
Figure 1.
B. brassicae infestation on the leaf of the Brassicaceae hybrid.
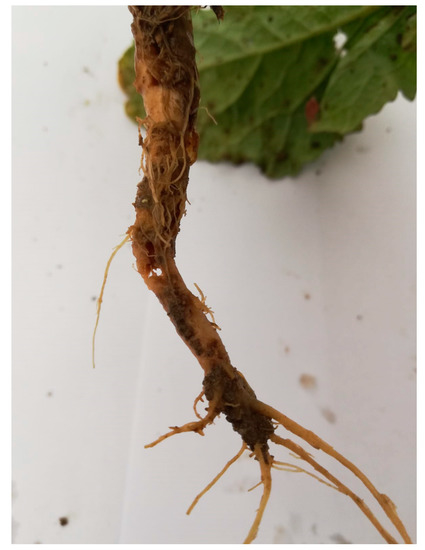
Figure 2.
Damage caused by D. radicum on the root of the Brassicaceae hybrid.
2.4. Analysis of Plant Materials
Whole plants were collected from the field. For every genotype, ten randomly chosen individuals were assessed. The plant material was collected at two dates corresponding to the vegetation phases: the BBCH 11–14 rosette phase (vegetative stage) and the flowering phase BBCH 63–65 (flowering stage). Plant material, consisting of fresh leaves and stems, was dried at 60 °C, ground and ashed in a furnace at 450 °C for 6 h. The ash was dissolved in 5 mL of 6 mol·dm−3 HCl [21] and diluted to a constant volume with distilled water. The obtained extracts were analyzed to assess macronutrient (K, Ca, Mg and Na) and micronutrient (Cu, Zn, Mn, Fe and Ni) contents using atomic absorption spectroscopy (ASA) in a Varian Spectra AA 220 FS apparatus. For total nitrogen (Ntot) and phosphorus content (Ptot), plant samples were analyzed separately and two different methods were performed. Total phosphorus content was measured colorimetrically by the ammonium methanadinate method and total nitrogen was analyzed by the Kjeldahl method [21]. Total sulfur (Stot) and sulfur sulfate (S-SO4) were determined by turbidimetric methods by Butters and Chenery [22] and Bardsley and Lancaster [23], respectively. All the assays identifying the amounts of mineral elements (nutrients) were performed in three replications of the same biological sample. The macronutrient and micronutrient contents as well as total nitrogen, total sulfur, and sulfur sulfate were observed only in 2019 in two growth stages: vegetative stage and flowering stage.
2.5. Statistical Analysis
The normality of the distributions of the studied elements (Ntot, Ptot, Stot, S-SO4, K, Ca, Na, Mg, Cu, Zn, Mn, Ni, and Fe) were tested using Shapiro–Wilk’s normality test [24]. Multivariate analysis of variance (MANOVA) was performed. Next, two-way analysis of variance (ANOVA) was carried out to determine the effects of hybrids and growth stages as well as hybrid × growth stage interaction on the variability of Ntot, Ptot, Stot, S-SO4, K, Ca, Na, Mg, Cu, Zn, Mn, Ni, and Fe. The mean values and standard deviations of mineral elements were calculated. The Fisher’s least significant differences (LSDs) were calculated for individual minerals and on this basis, homogeneous groups were determined. The relationships between analyzed nutrients were assessed on the basis of Pearson’s correlation for growth stages independently. Relationships of observed mineral elements were presented in heatmaps. Results were also analyzed using multivariate methods. The canonical variate analysis was applied in order to present multi-trait assessment of similarity of tested hybrids in a lower number of dimensions with the least possible loss of information [25]. This makes it possible to illustrate variation in species in growth stages of all observed mineral elements in the graphic form. The Mahalanobis distance [26] was suggested as a measure of “poly-trait” hybrids similarity [27], whose significance was verified by means of critical value Dα, called “the least significant distance” [28]. Mahalanobis distances were calculated for hybrids, independently for growth stages. The associations between observed mineral elements, resistance to Brevicoryne brassicae, and resistance to Delia radicum were estimated using regression analysis in both growth stages independently in each year of study. The mineral element observations were treated as independent variables and considered in individual models. In all analyses, we used the critical significance levels equal to 0.05, 0.01, and 0.001, resulting from a Bonferroni correction. All the analyses were conducted using the GenStat 18th edition statistical software package.
3. Results
3.1. Macro- and Micronutrient Analysis
The results of the MANOVA performed indicated that all the hybrids (F11;48 = 64.99; p < 0.0001), growth stages (F1;48 = 3112.04; p < 0.0001), and hybrid × growth stage interaction (F11;48 = 45.84; p < 0.0001) were significantly different with regard to all of the 13 quantitative mineral elements. Analysis of variance indicated that the main effects of hybrids as well as hybrid × growth stage interaction were significant for all the nutrients of study (Table 2). The main effects of growth stages were significant for all the nutrients except K (Table 2). The mean values and standard deviations for the observed mineral elements indicated a high variability among the tested hybrids for which significant differences were found in growth stages of all the analyzed nutrients (Table 3).
Table 2.
Mean squares form two-way analysis of variance for analyzed nutrients.
Table 3.
Mean values and standard deviations (s.d.) for observed nutrients (N = 90).
The correlation analysis within nutritional elements indicated statistically significant correlation coefficients for Zn and Fe, Mn and Fe, S-SO4 and Cu, Ntot and Mn, K and Na, Ca and Mg, Ca and Cu, Ca and Fe, and Na and Mg in both growth stages (Table 4, Figure 3 and Figure 4). Additionally, in the vegetation stage, we observed significant correlation between Ptot and Stot, Ptot and Zn, Stot and S-SO4, Stot and Zn, Stot and Fe, K and Mn, Ca and Zn, Ca and Ni, Na and Ni, Mg and Ni, Cu and Zn, Cu and Fe as well as Zn and Mn (Table 2, Figure 3). In the flowering stage, the pairs Ptot-K, Ptot-Mn, S-SO4-K, S-SO4-Ca, S-SO4-Mg, S-SO4-Mn, Ntot-Ca, Ntot-Fe, Stot-K, K-Ca, K-Mg, K-Zn, Ca-Na, Ca-Mn, Na-Fe, Mg-Cu, Mg-Mn, Mg-Fe, Cu-Mn and Cu-Ni were significantly correlated (Table 4, Figure 4).
Table 4.
The correlation coefficients matrix for nutrients analyzed in the vegetative stage (above diagonal) and flowering stage (below diagonal) (N = 90).
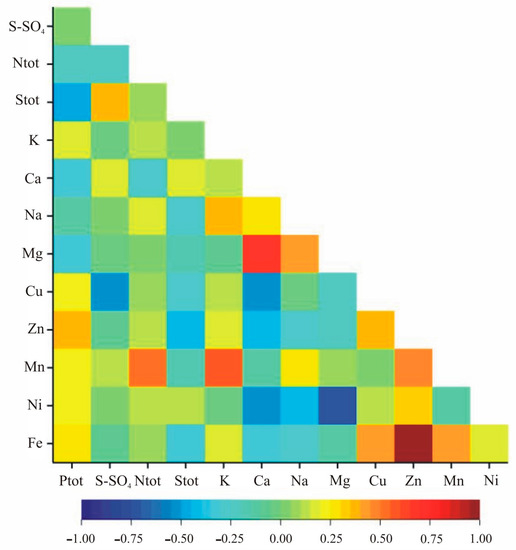
Figure 3.
Heatmap for linear Pearson’ correlation coefficients between observed nutrients in the vegetative stage (rcr = 0.36).
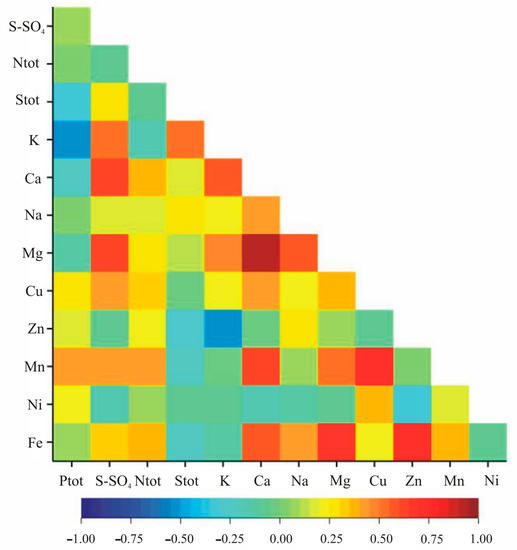
Figure 4.
Heatmap for linear Pearson’ correlation coefficients between observed nutrients in the flowering stage (rcr = 0.36).
Individual nutrients are of different importance and have a different share in the joint multivariate variation. A study on the multivariate variation for hybrids also includes the identification of the most important mineral elements in the multivariate variation of hybrids. Analysis of canonical variables is a statistical tool making it possible to solve the problem of multivariate relationships [29,30,31,32]. Figure 5 and Figure 6 show the variability of the 13 nutrients of 12 studied rapeseed hybrids in the growth stages of the first two canonical variables in the first and second growth stage, respectively. In the graph, the coordinates of the point for particular hybrids are the values for the first and second canonical variables, respectively. The first two canonical variables accounted for 95.93% and 78.11% of the total multivariate variability between the individual hybrids in the vegetative stage and flowering stage, respectively (Table 5, Figure 5 and Figure 6). The most significant, negative, linear relationship between the first canonical variables was found for Zn and Fe in the vegetative stage (Table 5); the second canonical variable in the vegetative stage was significantly positively correlated with Ni and negatively correlated with Ca, Mg, and Mn (Table 5). In the flowering stage, the most significant, positive, linear relationship between the first canonical variables was found for Ntot, Ca, Mg, Mn, and Fe (Table 5). The second canonical variable in the flowering stage was significantly positively correlated with S-SO4, K, Ca, and Mg (Table 5). The greatest variation of all 13 nutrients jointly (measured Mahalanobis distances) was found for hybrids H3 and H9 (in vegetative stage) and H4 and H6 (in flowering stage), the Mahalanobis distance between them amounted to 232.13 and 86.35, respectively (Table 6). The greatest similarity was found for hybrids H8 and H11 (13.69) in the vegetative stage as well as between H1 and H5 (8.45) in the flowering stage (Table 6). The correlation coefficient between Mahalanobis distances in both terms was equal to −0.1606 and was not significant (p = 0.1977).
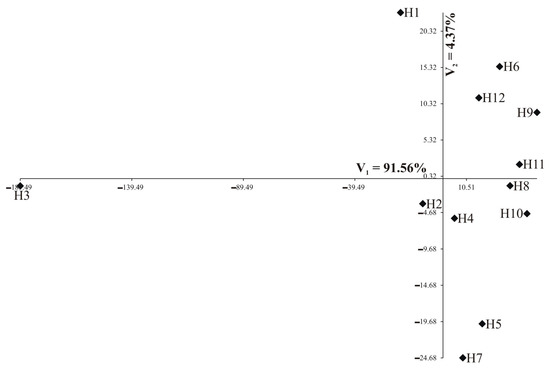
Figure 5.
Distribution of 12 hybrids in the space of the first two canonical variables in the vegetative stage (N = 90).
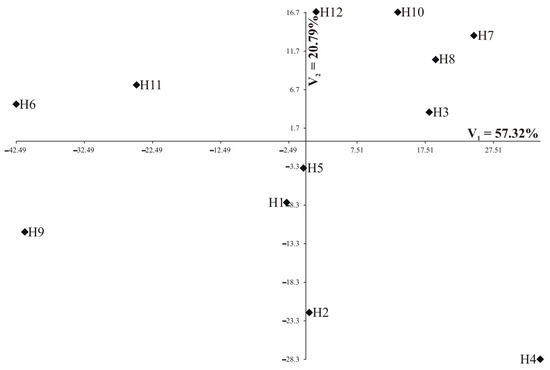
Figure 6.
Distribution of 12 hybrids in the space of the first two canonical variables in the vegetative stage (N = 90).
Table 5.
Correlation coefficients between the first two canonical variables and nutrients in both terms (N = 90).
Table 6.
The Mahalanobis distances between the studied hybrids in vegetative stage (above diagonal) and flowering stage (below diagonal) (N = 90).
3.2. Resistance to Pests
The resistance to B. brassicae and D. radicum of the hybrids was widely described by Niemann et al. [33]. In our previous research, we assessed the resistance to B. brassicae and D. radicum within 53 rapeseed cultivars and 31 interspecific hybrids including twelve genotypes investigated in this study. Generally, the resistance to insects of studied hybrid plants varied between genotypes and years. For B. brassicae, mean resistance values for hybrids in 2017, 2018, and 2019 were 8.766, 6.250, and 7.610, respectively. The highest level of resistance (9.000) was observed in 2017 for three genotypes: B. napus cv. Jet Neuf × B. carinata-PI 649094, B. napus cv. Jet Neuf × B. carinata-PI 649096, and B. napus cv. Jet Neuf × S. alba cv. Bamberka, while the lowest level of resistance (3000) was reported in 2018 for B. napus cv. Górczański × B. rapa ssp. pekinensis 08.007574. For D. radicum, mean resistance values for hybrids in 2017, 2018, and 2019 were 6.542, 6.611, and 6.864, respectively. The highest level of resistance (8.400) was noticed in 2017 for B. napus cv. Lisek × B. fruticulosa-PI649099 and in 2019 for B. napus cv. Lisek × B. tournefortii. Meanwhile, the lowest level of resistance (2.300) was observed in 2017 for one hybrid—B. napus cv. Lisek × B. fruticulosa-PI649097.
3.3. Associations between Pest Resistance and Nutrient Content
The associations between analyzed nutrients, resistance to B. brassicae, and resistance to D. radicum are presented in the Table 7 and Table 8, respectively. We observed a statistically significant negative (−0.2101) association between Ca in the vegetative stage and resistance to B. brassicae in 2019 (p = 0.033). Percentage of variation of resistance to B. brassicae was accounted by a Ca variation equal to 31.8% (Table 7). Additionally, a positive (0.817) association between Cu in the vegetative stage and resistance to B. brassicae was observed in 2019 (p = 0.036). Percentage of variation of resistance to B. brassicae accounted by Cu variation was equal to 30.6% (Table 7). The resistance to D. radicum in 2019 was statistically significantly negatively (−0.6) associated with Ca in the vegetative stage and p = 0.014. Percentage of variation of resistance to D. radicum accounted by Ca variation was equal to 41.5% (Table 8).
Table 7.
The associations between the analyzed nutrients and resistance to Brevicoryne brassicae (N = 90).
Table 8.
The associations between analyzed nutrients and resistance to Delia radicum (N = 90).
4. Discussion
The pathogens and insects are responsible for the reduced crop yield, so presently, a variety of fungicides and pesticides are applied in agriculture. Taking into account the current requirements of sustainable agriculture with less consumption of agrochemicals, more attention is paid to the natural defense mechanisms of plants against pests and pathogens. It can be assumed that plants with the proper concentration of nutrients in plant tissues will resist pests more, and the research carried out confirmed such a statement indirectly.
B. napus plants are rich in sulfur as it is necessary for plant development. Sulfur is used to synthesize glucosinolate and phytoalexins, which play an important role in plant defense systems [34]. Marazzi and Stadler [35] found a correlation between sulfur plant nutrition and D. radicum development by testing B. napus plants with three different levels of sulfur supply: no sulfur added, normal dose of sulfur, and double dose of sulfur. The conducted experiment showed that larval survival to pupation, adult emergence, and adult fresh weight was significantly greater when B. napus plants received normal or double the normal dose of sulfur. In contrast, our research showed no connection between sulfur content in plants and resistance to D. radicum. As stated before, B. brassicae is a highly specialized pest. The insect adapts so well that it takes advantage of the plants’ own defense system by using glucosinolates produced by the host as protection against predatory species [36]. As glucosinolates do not harm the insect, it would be expected that an increased amount of sulfur and nitrogen in the plant, which are compounds of this toxic chemical, will not impact the number of B. brassicae individuals that damage the plants. This assumption corresponds well with our results.
Based on our study, no relation was discovered between nitrogen content and resistance to D. radicum and B. brassicae. Furthermore, in 2011, Mochiah et al. [37] studied how insect population in Brassica oleracea is affected by the use of different soil fertilizers (i.e., NPK and poultry manure). Conducted field trials showed that both organic and synthetic nutrients could increase the population of some pests on cabbage, but the same effect was not observed for B. brassicae. However, experiments performed by Mutiga et al. [38] showed clearly that increasing the quantity of nitrogen applied in the soil led to an increase in B. brassicae infestation on collard (Brassica oleracea var. acephala). This phenomena might be explained by enhanced amino acid synthesis caused by increased N level, as it changes the nutritional quality of floem sap; though it is crucial to emphasize that is it the balance and composition of different amino acids that plays the major role [14,38]. Furthermore, a study from Chesnais et al. [39] proved that an increase in N level may indeed positively impact B. brassicae size and fecundity, though using excessive nitrogen treatments may limit aphid fertility.
The group of macronutrients also includes calcium, although it is not as required by Brassica plants as sulfur or nitrogen. However, the role it plays in plant cells is significant. Calcium is an essential second messenger in many pathways, especially in plant response to pathogen attacks [40,41]. Lecourieux et al. [40] made an exhaustive review of various calcium compounds and their functions in plant organisms and pointed to the importance of calmodulin and calmodulin-binding proteins in plant defense against fungal pathogenic. Based on this, one can risk a theory that the compounds with the participation of calcium including the aforementioned calmodulin can also determine the resistance of plants to pests. The obtained findings from our own research confirm this in some way, as we discovered a significant association between the resistance to D. radicum and Ca, and between the resistance to B. brassicae and Ca in the last year of our study.
In this study, a positive relationship was shown between the amount of copper in plant cells and resistance to B. brassicae (in the third year of the study) This result should be considered interesting and intriguing, more so because copper is attributed with a strong fungicidal and bactericidal effect [12]. Considering the fact that when Cu is present in a low concentration, it acts as a cofactor for metallo-proteins and enzymes, whereas at higher concentrations, it performs as an antimicrobial agent against pathogens. In this aspect, it would have to be considered whether the Cu level in the plants was sufficiently adequate to induce a pest resistance effect.
Pest management of oilseed rape in Europe relies mostly on chemical treatments. Unfortunately, pesticides are often used as a preventive measure in many cases without precise recognition of insects in the field [42]. Such a demeanor leads to the over-use of broad spectrum chemicals and results in pesticide resistance and pest resurgence [38]. Moreover, uncareful application, especially during the flowering period, may have harmful effects on beneficial insects such as bees [43]. Therefore, it is particularly relevant to develop a consistent, environmentally friendly approach to limit the pests’ population. Considering all the presented results, it cannot be confirmed that adjusted plant nutrition is a sufficient replacement for using pesticides, though it should be considered as part of a non-chemical strategy against dangerous pests, along with biological control and breeding resistant cultivars.
5. Conclusions
Despite the fact that the presented outcomes showed correlation between elemental accumulation expressed by the concentration of nutrients and plant resistance to pests only for Ca and Cu, research in this direction should be continued, as they fit into the philosophy of sustainable agriculture. The role of adjusted plant nutrition in plant resistance should be further analyzed.
Author Contributions
Conceptualization, J.N., J.S., and J.B.; Methodology, J.S. and J.N.; Software, J.B.; Validation, J.S., J.N., and J.B.; Formal analysis, J.N., M.J., and M.M.; Investigation, J.S., J.N., M.J., and M.M.; Data curation, J.S., J.N., and J.B.; Writing—original draft preparation, J.S.; Writing—review and editing, J.N., J.B., and M.J.; Visualization, J.B.; Supervision, J.S., J.N., and J.B.; Project administration, J.N.; Funding acquisition, J.N. All authors have read and agreed to the published version of the manuscript.
Funding
This research was funded by the Polish Ministry of Agriculture and Rural Development, project number 54.
Institutional Review Board Statement
Not applicable.
Informed Consent Statement
Not applicable.
Conflicts of Interest
The authors declare no conflict of interest.
References
- The Food and Agriculture Organization (FAO): FAOSTAT. Production/Yield Quantities of Rapeseed in World. 2020. Available online: http://www.fao.org/faostat/en/?#data/QC/visualize (accessed on 23 October 2020).
- United States Department of Agriculture. Oilseeds: World Markets and Trade. 2020. Available online: https://apps.fas.usda.gov/psdonline/circulars/oilseeds.pdf (accessed on 23 October 2020).
- Corlouer, E.; Gauffreteau, A.; Bouchet, A.S.; Bissuel-Bélaygue, C.; Nesi, N.; Laperche, A. Envirotypes Based on Seed Yield Limiting Factors Allow to Tackle G×E Interactions. Agronomy 2019, 9, 798. [Google Scholar] [CrossRef]
- Capinera, J.L. Handbook of Vegetable Pests; Academic Press Elsevier: London, UK, 2020. [Google Scholar]
- Mason, P.G.; Huber, J.T. Biological Control Programmes in Canada, 1981–2000; CABI: Wallingford, UK, 2002. [Google Scholar]
- Hines, R.L.; Hutchison, W.D. Cabbage Aphids. VegEdge, Vegetable IPM Resource for the Midwest; University of Minnesota: Minneapolis, MN, USA, 2013; Available online: https://www.vegedge.umn.edu/pest-profiles/pests/cabbage-aphids (accessed on 23 October 2020).
- Garbe, V.; Gladders, P.; Lane, A. Report of the Concerted Action. In Proceedings of the Research for the Adaption of Oilseed Crops to the New Requirements of the Common Agricultural Policy: Crop Competitivity, Seed Quality, Environment, Integrated Control in Oilseed Crops IOBC/wprs Bulletin, Einsiedeln, Switzerland, 2–4 November 2000; Volume 23, pp. 173–178. [Google Scholar]
- Arora, R.; Sandhu, S. (Eds.) Breeding Insect Resistant Crops for Sustainable Agriculture; Springer: Singapore, 2017. [Google Scholar]
- Jakubus, M.; Bakinowska, E. Varied macronutrient uptake by plants as an effect of different fertilisation schemes evaluated by PCA. Acta Agric. Scand. Sect. B Soil Plant Sci. 2020, 70, 56–68. [Google Scholar] [CrossRef]
- Jakubus, M.; Graczyk, M. Microelement variability in plants as an effect of sewage sludge compost application assessed by different statistical methods. Agronomy 2020, 10, 642. [Google Scholar] [CrossRef]
- Fürstenberg-Hägg, J.; Zagrobelny, M.; Bak, S. Plant Defense against Insect Herbivores. Int. J. Mol. Sci. 2013, 14, 10242–10297. [Google Scholar] [CrossRef] [PubMed]
- Rai, M.; Ingle, A.P.; Pandit, R.; Paralikar, P.; Shende, S.; Gupta, I.; Biswas, J.K.; Silverio da Silva, S. Copper and copper nanoparticles: Role in management of insect-pests and pathogenic microbes. Nanotechnol. Rev. 2018, 7, 303–315. [Google Scholar] [CrossRef]
- Jakubus, M. Sulphur in Environment; Poznań University of Agriculture: Wojska Polskiego, Poznań, 2006; Volume 48. (In Polish) [Google Scholar]
- Cole, R.A. The relative importance of glucosinolates and amino acids to the development of two aphid pests Brevicoryne brassicae and Myzus persicae on wild and cultivated brassica species. Entomol. Exp. Appl. 1997, 85, 121–133. [Google Scholar] [CrossRef]
- Rusch, A.; Valantin-Morison, M.; Sarthou, J.P.; Roger-Estrade, J. Integrating Crop and Landscape Management into New Crop Protection Strategies to Enhance Biological Control of Oilseed Rape Insect Pests. In Biocontrol-Based Integrated Management of Oilseed Rape Pest; Williams, I.H., Ed.; Springer Science+Business Media B.V.: Berlin/Heidelberg, Germany, 2010; pp. 415–448. [Google Scholar]
- Jakubus, M.; Graczyk, M. Quantitative changes in sulphur fractions during co-composting of pine bark with green plant material. Pol. J. Environ. Stud. 2019, 28, 1–12. [Google Scholar] [CrossRef]
- Kopriva, S.; Calderwood, A.; Weckopp, S.C.; Koprivova, A. Plant sulphur and big data. Plant Sci. 2015, 241, 1. [Google Scholar] [CrossRef]
- Niemann, J.; Wojciechowski, A.; Janowicz, J. Broadening the variability of quality traits in rapeseed through interspecific hybridization with an application of immature embryo culture. Biotechnol. J. Biotechnol. Comput. Biol. Bionanotechnol. 2012, 93, 109–115. [Google Scholar] [CrossRef]
- Anon. Guidelines on Pest Risk Analysis. No. 3. Pest Risk Assessment, Scheme; Bulletin OEPP/EPPO Bulletin: Paris, France, 1997; Volume 27, pp. 281–305. [Google Scholar]
- UPOV: International Union for the Protection of New Varieties of Plants. Guidance on Certain Physiological Characteristics; Document TGP/12; UPOV: Geneva, Switzerland, 2012. [Google Scholar]
- Ostrowska, A.; Gawlinski, S.; Szczubialka, Z. Metody Analizy i Oceny Wlasciwosci Gleb i Roslin: Katalog; Dział Wydawnictw IOŚ: Warszawa, Poland, 1991; p. 334. [Google Scholar]
- Butters, B.; Chenery, E.M. A rapid method for the determination of total sulphur in soils and plants. Analyst 1959, 84, 239–245. [Google Scholar] [CrossRef]
- Bardsley, C.E.; Lancaster, J.D. Determination of reserve sulfur and soluble sulfates in soils 1. Soil Sci. Soc. Am. J. 1960, 24, 265–268. [Google Scholar] [CrossRef]
- Shapiro, S.S.; Wilk, M.B. An analysis of variance test for normality (complete samples). Biometrika 1965, 52, 591–611. [Google Scholar] [CrossRef]
- Rencher, A.C. Interpretation of canonical discriminant functions, canonical variates, and principal components. Am. Stat. 1992, 46, 217–225. [Google Scholar]
- Mahalanobis, P.C. On the generalized distance in statistics. Proc. Natl. Acad. Sci. India A 1936, 12, 49–55. [Google Scholar]
- Seidler-Łożykowska, K.; Bocianowski, J. Evaluation of variability of morphological nutrients of selected caraway (Carum carvi L.) genotypes. Ind. Crops Prod. 2012, 35, 140–145. [Google Scholar] [CrossRef]
- Camussi, A.; Ottaviano, E.; Caliński, T.; Kaczmarek, Z. Genetic distances based on quantitative nutrients. Genetics 1985, 111, 945–962. [Google Scholar] [CrossRef]
- Seidler-Łożykowska, K.; Bocianowski, J.; Król, D. The evaluation of the variability of morphological and chemical nutrients of the selected lemon balm (Melissa officinalis L.) genotypes. Ind. Crop. Prod. 2013, 49, 515–520. [Google Scholar] [CrossRef]
- Lahuta, L.B.; Ciak, M.; Rybiński, W.; Bocianowski, J.; Börner, A. Diversity of the composition and content of soluble carbohydrates in seeds of the genus Vicia (Leguminosae). Genet. Resour. Crop Evol. 2018, 65, 541–554. [Google Scholar] [CrossRef]
- Wrońska-Pilarek, D.; Szkudlarz, P.; Bocianowski, J. Systematic importance of morphological features of pollen grains of species from Erica (Ericaceae) genus. PLoS ONE 2018, 13, e0204557. [Google Scholar]
- Bocianowski, J.; Majchrzak, L. Analysis of effects of cover crop and tillage method combinations on the phenotypic nutrients of spring wheat (Triticum aestivum L.) using multivariate methods. Appl. Ecol. Environ. Res. 2019, 17, 15267–15276. [Google Scholar] [CrossRef]
- Niemann, J.; Szwarc, J.; Bocianowski, J.; Weigt, D.; Mrówczyński, M. In-field screening for host plant resistance to Delia radicum and Brevicoryne brassicae within selected rapeseed cultivars and new interspecific hybrids. Open Life Sci. 2020, 15, 711–720. [Google Scholar] [CrossRef]
- Ahuja, I.; Rohloff, J.; Bones, A.M. Defence mechanisms of Brassicaceae: Implications for plant-insect interactions and potential for integrated pest management. A review. Agron. Sustain. Dev. 2010, 30, 311–348. [Google Scholar] [CrossRef]
- Marazzi, C.; Städler, E. Influence of sulphur plant nutrition on oviposition and larval performance of the cabbage root fly. Agric. For. Entomol. 2005, 7, 277–282. [Google Scholar] [CrossRef]
- Kuśnierczyk, A.; Winge, P.E.R.; Jørstad, T.S.; Troczyńska, J.; Rossiter, J.T.; Bones, A.M. Towards global understanding of plant defence against aphids–timing and dynamics of early Arabidopsis defence responses to cabbage aphid (Brevicoryne brassicae) attack. Plant Cell Environ. 2008, 31, 1097–1115. [Google Scholar] [CrossRef]
- Mochiah, M.B.; Baidoo, P.K.; Owusu-Akyaw, M. Influence of different nutrient applications on insect populations and damage to cabbage. J. Appl. Biosci. 2011, 38, 2564–2572. [Google Scholar]
- Mutiga, S.K.; Gohole, L.S.; Auma, E.O. Effects of integrating companion cropping and nitrogen application on the performance and infestation of collards by Brevicoryne brassicae. Entomol. Exp. Appl. 2010, 134, 234–244. [Google Scholar] [CrossRef]
- Chesnais, Q.; Couty, A.; Catterou, M.; Ameline, A. Cascading effects of N input on tritrophic (plant–aphid–parasitoid) interactions. Ecol. Evol. 2016, 6, 7882–7891. [Google Scholar] [CrossRef]
- Lecourieux, D.; Ranjeva, R.; Pugin, A. Calcium in plant defence—signaling pathways. N. Phytol. 2006, 171, 249–269. [Google Scholar] [CrossRef]
- Ma, Y.; Gerald, A.; Berkowitz, S. Biotic Stress Signalling: Ca2+ Mediatel Pathogen Defence Programmes. In Plant Stress Physiology, 2nd ed.; Shabala, S., Ed.; CAB International: Wallingford, UK, 2017. [Google Scholar]
- Williams, I.H. Advances in Insect Pest Management of Oilseed Rape in Europe. In Insect Pest Management: Field and Protected Crops, 1st ed.; Horowitz, A.R., Ishaaya, I., Eds.; Springer: Berlin, Germany, 2004; pp. 181–208. [Google Scholar]
- Mänd, M.; Williams, I.H.; Viik, E.; Karise, R. Oilseed Rape, Bees and Integrated Pest Management. In Biocontrol-Based Integrated Management of Oilseed Rape Pest; Williams, I.H., Ed.; Springer Science+Business Media B.V.: Berlin/Heidelberg, Germany, 2010; pp. 357–380. [Google Scholar]


Publisher’s Note: MDPI stays neutral with regard to jurisdictional claims in published maps and institutional affiliations. |
© 2021 by the authors. Licensee MDPI, Basel, Switzerland. This article is an open access article distributed under the terms and conditions of the Creative Commons Attribution (CC BY) license (http://creativecommons.org/licenses/by/4.0/).