Article

Effects of Nitrogen Application Rate on Protein Components and Yield of Low-Gluten Rice

1
College of Agronomy, Sichuan Agricultural University, Wenjiang, Chengdu 611130, China
2
College Science of Life, Sichuan Agricultural University, Yaan 625014, China
*
Author to whom correspondence should be addressed.
Agriculture 2021, 11(4), 302; https://doi.org/10.3390/agriculture11040302
Submission received: 8 March 2021 / Revised: 23 March 2021 / Accepted: 27 March 2021 / Published: 1 April 2021
(This article belongs to the Section Crop Production)

Abstract

:
Low-gluten rice cultivar D105 was grown in the field under five nitrogen (N) treatments (N0: 0, N90: 90, N135: 135, N180: 180, and N225: 225 kg·hm−2) to investigate the effect of N application rate on the yield and the resulting dynamic changes in protein content, grain processing quality, and relative content of each component protein. The results indicated that the number of effective panicles, seed setting rate, the number of solid grains, dry matter, leaf nitrate reductase and glutamine synthetase activities, and yield increased with N application rate ranging from 0 to 180 kg·hm−2. However, the seed setting rate and the number of solid grains decreased under N225 treatment, leading to a decline in yield. At maturity, 35 days after flowering, no significant differences between albumin and gliadin in the rice grain were found among the N treatments, while globulin and gluten differed among treatments, indicating that the effect of N application rate on the former was slightly the opposite to that observed on the latter. Further, the N application rates did not change the proportions of component proteins relative to the total protein content in the grain. Processing and taste qualities of D105 low-gluten rice were optimal in the N135 and N180 treatments, and the overall rice quality decreased under the N225 treatment. Therefore, the optimal N application rate for yield and processing quality of D105 low-gluten rice is N180: 180 kg·hm−2.

1. Introduction

Based on their differential solubility, protein components in the rice grain can be divided into water-soluble albumin, salt-soluble globulin, alcohol-soluble gliadin, and alkali-soluble gluten, each accounting for 5%, 10%, 5%, and 80% of the total protein-mass fraction in rice, respectively. Albumin and globulin are stored mainly in peel, aleurone, and embryo tissues, while prolamin and gluten are mainly stored in the endosperm [1]. Gluten is stored in protein body PB-II and is easily digested and absorbed by the human gastrointestinal system, while the alcohol-soluble protein accumulates in protein body PB-I and cannot be digested nor absorbed by our gastrointestinal system. Thus, the human body mainly absorbs gluten [2]. Low-gluten rice has an absorbable protein content of only 3.1~4.0% [3]. Further, patients with diabetes and kidney disease are recommended not to eat rice with an absorbable protein content greater than 4% due to potential renal dysfunction. Instead, these patients are advised to consume low-gluten rice to prevent increased blood sugar and lipids due to excessive calorie intake, thus effectively preventing or assisting in treating diabetes and kidney disease [4]. The total rice protein content and its specific components are mainly controlled genetically, but the impact of environmental factors can be as great or greater. For example, some studies have shown that environmental factors account for 89.14% of the impact on protein content, while varietal differences account for only 8.06% [5]. Similarly, some studies have suggested that there are significant differences among genotypes in grain protein composition, while the environment also has a significant impact on grain protein content and composition [6,7]. Many studies have shown that increased nitrogen (N) fertilizer application or shifting N before and after will cause a significant increase in the storage protein content of rice [8,9]. Studies have also shown that increased N fertilizer application significantly increases the total protein, albumin, gliadin, and gluten contents of rice grains [10]. In recent years, the practice of high-quality rice cultivation has shown that the amount of N fertilizer application will increase the protein content of rice and decrease rice taste [11,12]. Due to rapid economic development and changes in human lifestyles, the demand for functional low-gluten rice continues to grow despite its low yield and high price. Some studies have shown that low-gluten rice varieties differ in their yield response to N application rate. Increasing the N rate will increase rice grain protein and component protein content; however, improper N application will reduce yield and quality [13,14]. Therefore, an appropriate amount of N application is the key to ensure high-yield and high-quality low-gluten rice. The gluten content of low-gluten rice variety D105 is 36.9–37.3% of the total grain protein. It was selected here to further study the effects of N application rate on yield and protein composition of low-gluten rice varieties to provide a sound theoretical basis for its high-yield and high-quality cultivation.

2. Materials and Methods

2.1. Experimental Site Information

Field experiments were conducted at the College of Agronomy farm at Sichuan Agricultural University, Wenjiang, Sichuan Province, China (30.70° N, 103.83° E) from October 2018 to early September 2019. Prior to the establishment of the field experiment (2018), soil samples from the topsoil layer (0.20 m) were analyzed and found to contain 1.80 g·kg−1 total N (Kjeldahl method, UDK-169, ITA), 66.19 mg·kg−1 available phosphorus (Mo-Sb colorimetry after digestion with H2SO4 and HClO4), 2.95% organic matter (K2Cr2O7-volumetric method), and 77.08 mg·kg−1 available K (flame spectrometry after NH4OAc extraction); pH was 6.9 (1:2.5 soil:water ratio). Average air temperature and precipitation data from the previous rice-growing season (Figure 1) were collected from the weather station close to the experimental site.

2.2. Experiment Design

The conventional N application treatment in the paddy field in this area is 180 kg/hm2. On this basis, setting arithmetic reduced and incremental N applications to study the difference of the various protein components in low-gluten rice have crucial research significance. Therefore, the experiment was laid in a randomized blocks design with five treatments: N0, N90, N135, N180, and N225, for 0, 90, 135, 180, and 225 kg·hm−2, respectively, and N fertilizer was used as basal manure and top dressing at a 3:7 ratio. A total of 15 treatments were performed with three repetitions. D105 was the low gluten variety used as the test material. It is a conventional japonica glutinous rice originally produced in Japan and has a full growth period of 150 days in Sichuan. The variety shows a compact plant type, stable yield, good quality, and strong adaptability in this region. Basal phosphorus (90 P2O5 kg·hm−2) and potassium (180 K2O kg·hm−2) were applied in all treatments 1 d before transplanting. Planting density was 26.6 × 10⁴ hillshm−2, and the unit plot size was 20 m2. Water management was based on rice dry-wet alternate irrigation. When the number of tillers reached 20 per plant, the plots were drained dry until the jointing stage. Water was drained again one week before harvest. Rice was harvested on 13 September 2019. Weeds, insects, and diseases were countered using standard chemical control to avoid yield loss.

2.3. Measurements and Methods

2.3.1. Yield and Yield Components

Rice was harvested at maturity, and the yield in each experimental plot was recorded after measuring moisture content and removing impurities. Grain yield was adjusted to a moisture content of 13.5%. The number of effective tillers per hill was determined before harvest using 30 plants per plot. A total of 10 selected plants were separated into single tillers according to the marked date and were used to measure 1000-grain weight, seed setting rate, and grain number per panicle. Actual grain yield was harvested from other plants in each plot, excluding plants from edge rows.

2.3.2. Photosynthetic Characteristics and Enzyme Activity Measurements

Rice flag-leaf Soil and plant analyzer development (SPAD) was measured from the main stems using a SPAD instrument (Zhejiang Top Yunnong Technology Co., Ltd. Zhejiang, China). Measurements were conducted from 09:00 to 11:00 during anthesis and 15 and 30 days after anthesis. Three main-stem flag leaves were selected from each treatment; veins were removed, and glutamine synthetase (GS) activity was measured following Lea et al. [15]. In turn, nitrate reductase (NR) activity was measured according to the method described by Li et al. [16]. Commonly used colorimetry, i.e., the coupling reaction of NO2− generated by reducing NO3 and NO3 with the diazonium reagent FORNH or FADH (Chengdu Diversity Co., Ltd., Chengdu, China) produced a red diazonium compound which has the largest light absorption at the corresponding wavelength. According to the change of light absorption value per unit time, the activity intensity of nitrate reductase (NR) was calculated.

2.3.3. Total Protein and Protein Components in the Rice Grain

Ten spikes were sampled at 7, 14, 21, 28, and 35 d after flowering from each plot and brought to the laboratory. Kernels were peeled manually and placed in a paper bag for oven-drying at 105 °C for 30 min and then to a constant mass at 80 °C. After drying, kernels were ground and sieved as test samples. Kernel protein content was determined by the Kjeldahl method, using a Kjeltec 2300 automatic instrument (Shanghai Aiyan Biological Technology Co., Ltd., Shanghai, China). In evaluating protein content, the continuous extraction method of Sarwar Gilani et al. was used [17,18]; distilled water, 0.06 mol·L−1 NaCl solution, 80% ethanol solution, and 0.04 mol·L−1 NaOH solution were successively used to separate and extract the different protein components. Finally, the Coomassie brilliant blue method was used to determine the content of each protein component under study [19].

2.3.4. Rice Quality Indicators

After harvest, treatment samples were collected and stored for three months in a dry environment. Brown, polished, and whole rice rates were determined according to the methods for rice quality determination as per current guidelines in NY/T83-2017 [20]. The aspect ratio was determined with reference to the National Standard of the People’s Republic of China GB/T17891-1999 [21]. Amylose content was measured using an AA3 continuous flow analyzer set (Tianjin Zhongtong Technology Development Co., Ltd., Tianjin, China). The rapid visco analyzer (RVA) spectrum of rice starch viscosity was rapidly measured using the RVA-4 RVA instrument (Newport Scientific Instrument Company, Newport, Australia), and the TCW supporting software (thermo calc 2003) was used for analysis.

2.4. Data Analysis

Data were analyzed using analysis of variance (ANOVA), and means were compared based on the least significant difference (LSD) test at the 0.05 probability level using SPSS 23 (Statistical Product and Service Solutions Inc., Chicago, IL, USA). Origin Pro 2017 (OriginLab, Northampton, MA, USA) was used to draw the figures. The difference of the main indicators of low gluten rice is shown in Table 1.

3. Results

3.1. Effect of Nitrogen on Yield and Yield Components

Rice yield and all yield components, except for productive panicle number (PN), increased first and then decreased with increasing N application rate (Table 2). PN increased with increasing N and peaked under N225 treatment. The differences between the N135 and N90 or N180 treatments were significant. The number of rice grains first increased and then decreased with an increasing N rate. The spikelet number per panicle (SPN) in the N0 treatment was the lowest over the two-years and was greatest under N180; furthermore, the differences among treatments were significant. The 1000-grain weight under N0 was significantly lower than that under any other N treatment. The 1000-grain weights for N90 and N135 were significantly lower than that for N180 or N225. The seed setting rate and the number of seeds showed a similar trend with increasing N rate, i.e., lowest under N0 and greatest under N180. Overall, grain yield was lowest under N0 and highest under N180, with significant differences among the treatments. Therefore, in terms of the yield indicators used herein, N180 proved to be the best treatment.

3.2. Effect of Nitrogen Rate on Dry Matter (DM) Accumulation

The amount of dry matter accumulated in the rice plant directly determines the level of grain yield. At the heading stage, accumulated dry matter increased first and then decreased with increasing N rate (Figure 2). The two-year trend for rice dry matter showed consistency between the years at the heading stage. The two-year test results showed that rice dry matter was the highest under the N180 treatment with a two-year average of 55.92%, 28.89%, 14.02%, and 1.87% greater than the average under the N0, N90, N135, and N225 treatments, respectively. In 2018, the amount of dry matter increased with increasing N application. In contrast, it increased first and then decreased at maturity with an increasing N application rate in 2019. In this case, the average dry matter under the N180 treatment was 78.39%, 29.07%, 15.92%, and 2.26% greater than the corresponding average in N0, N90, N135, and N225, respectively. In 2019, dry matter quality at maturity was maximum under the N180 treatment showing values of 367.69%, 66.12%, 46.15%, and 19.21% greater than those of N0, N90, N135, and N225, respectively. These findings show that the N180: 180 kg·hm2 treatment was more beneficial to dry matter accumulation than the other treatments.

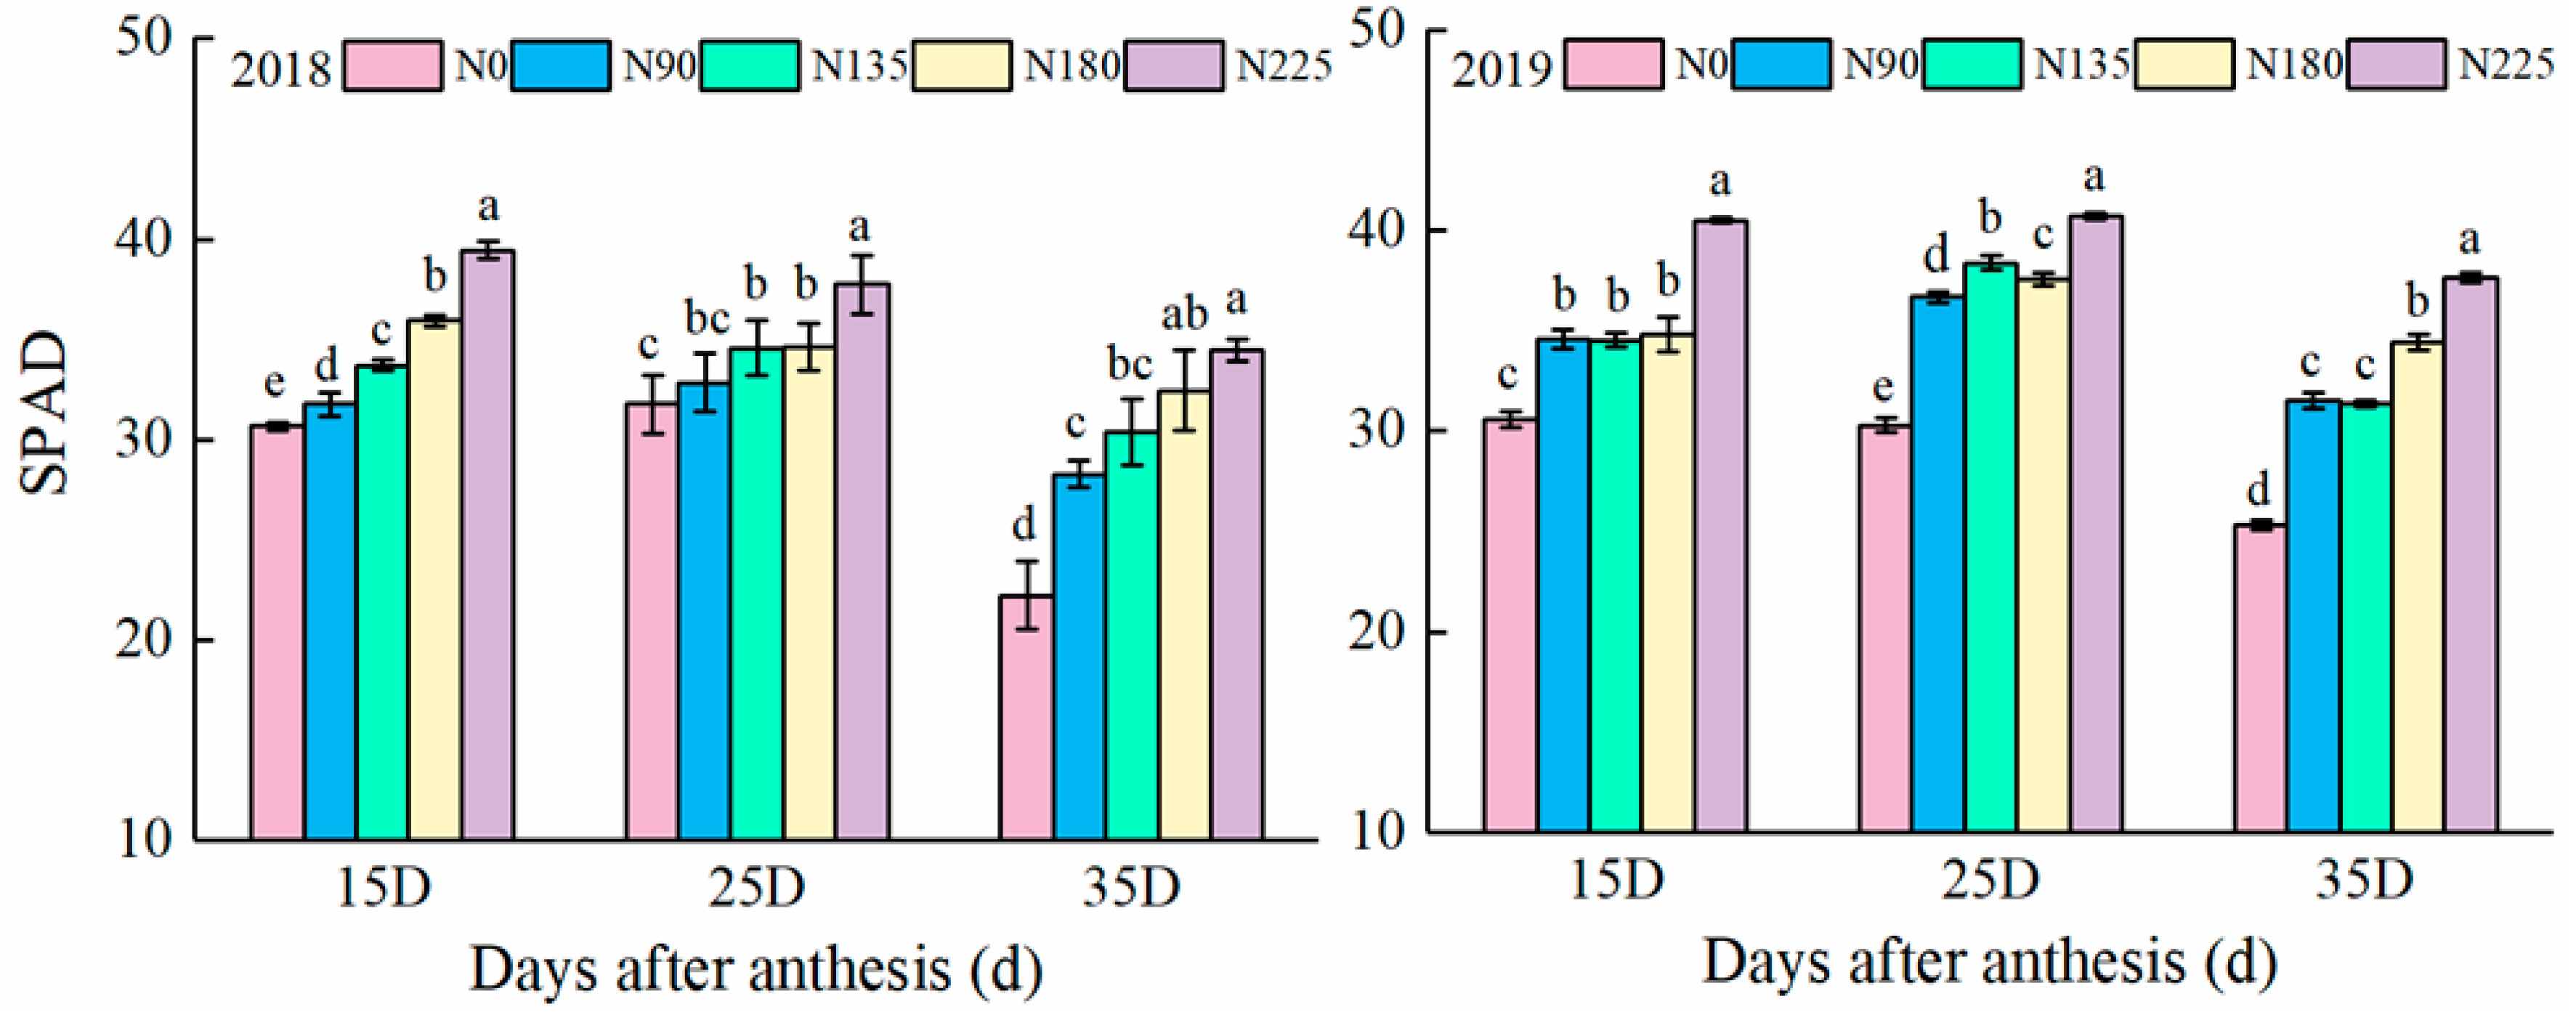
3.3. Effect of Nitrogen Application Rate on Leaf SPAD

The change in the value for rice leaf SPAD was closely related to the N application rate. Our results showed that the SPAD values in rice leaves first increased and then decreased with rice leaf growth (Figure 3). Leaf SPAD values were highest under the N225 treatment at maturity. Rice leaf SPAD-values in the N225 treatment were 51.91%, 20.39%, 16.71%, and 7.78% greater than those for N0, N90, N135, and N180, at 35 days after anthesis, respectively. These findings show that, within a certain range, leaf SPAD values increased with increasing amounts of N application.

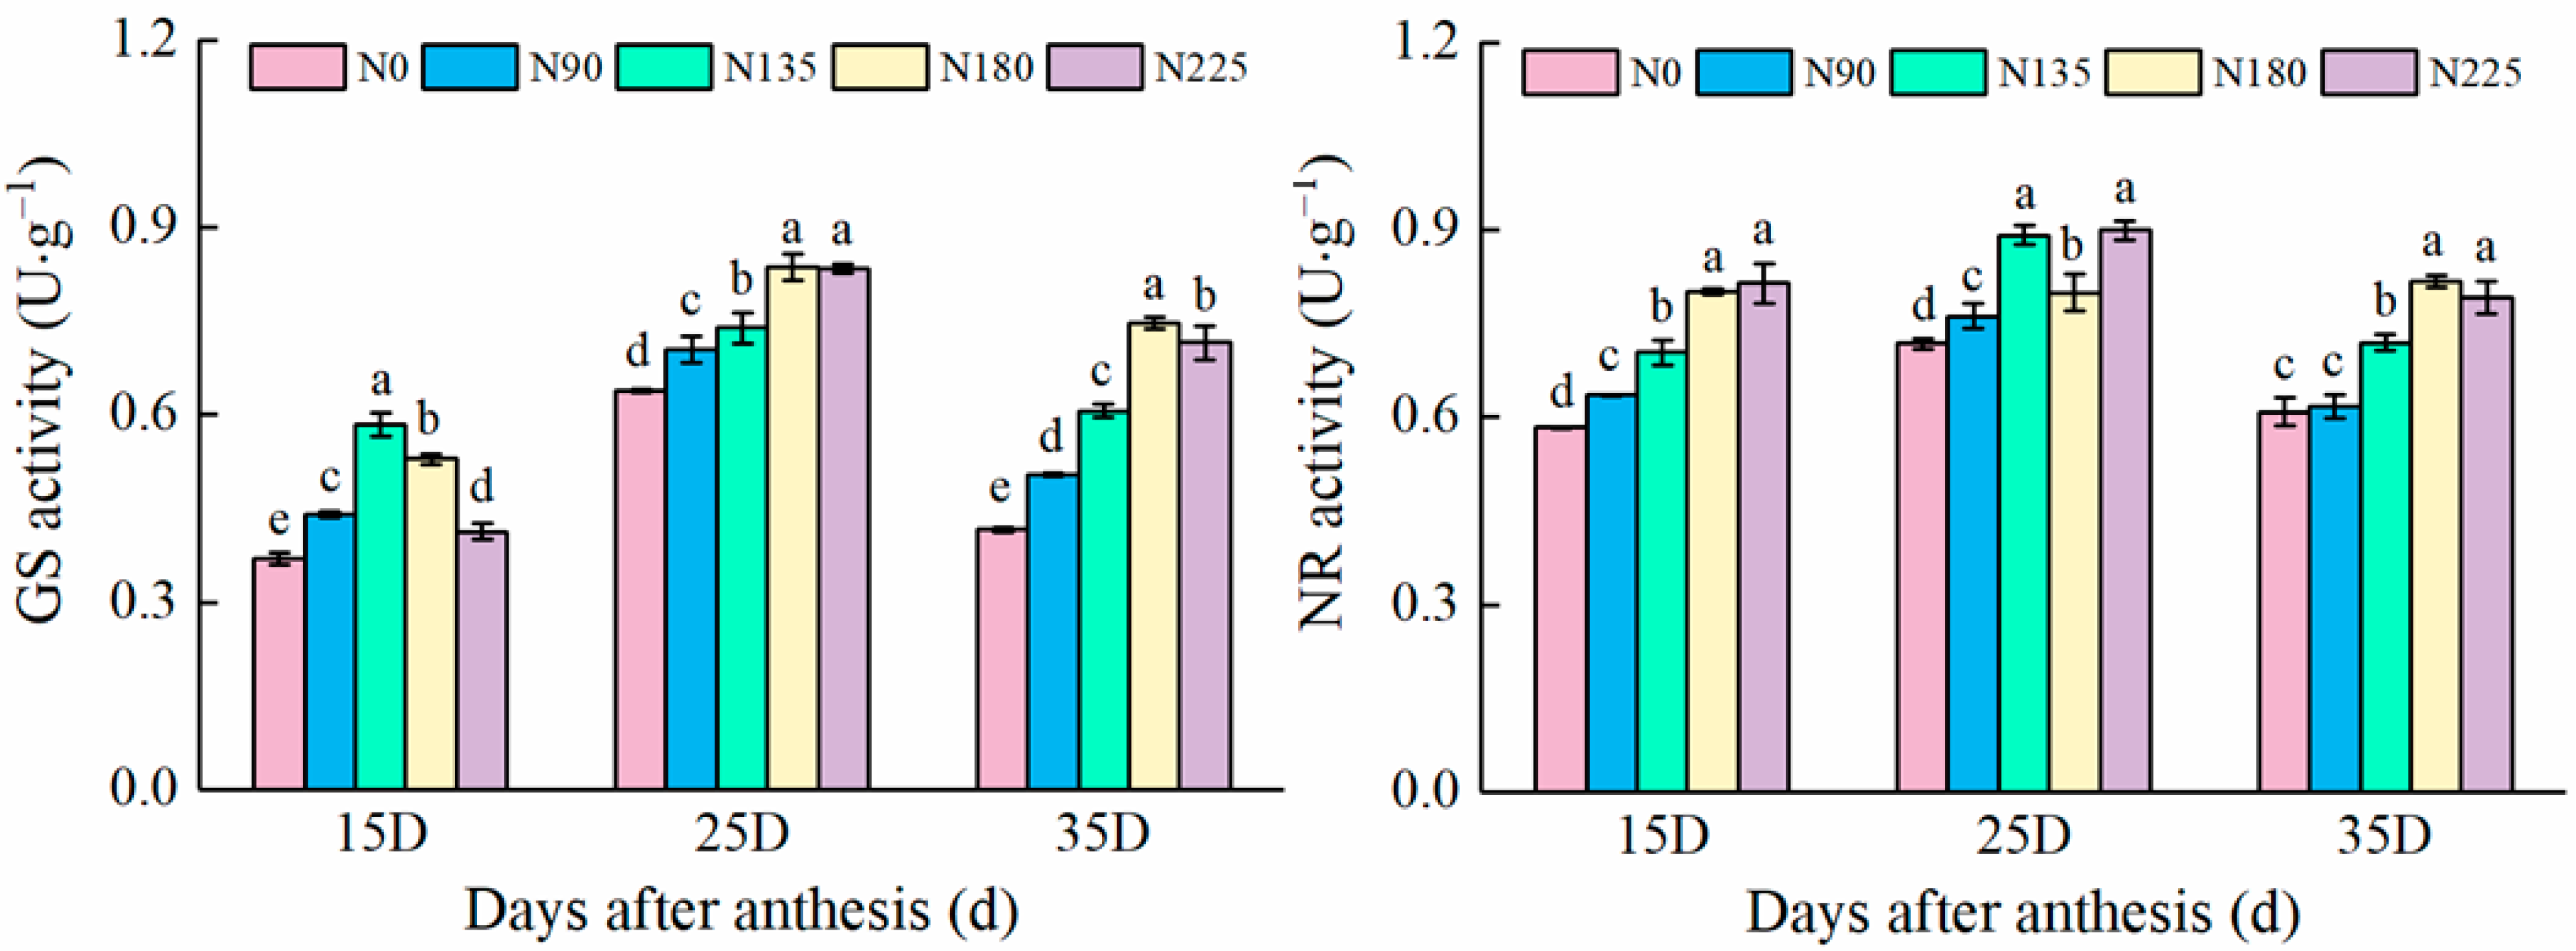
3.4. Effects of Nitrogen Application on Enzyme Activity

Figure 4 shows the effects of N application rates on GS and NR activities in the flag leaf. Both NR and GS activities first increased and then decreased with flag leaf growth. The trend in enzyme activity changes at 35 days after anthesis was consistent between the two experimental years. GS activity under the N180 treatment was 79.25%, 47.95%, 23.05%, and 4.29% greater than that for N0, N90, N135, and N225, at 35 days after anthesis, respectively. Similarly, NR activity under N180 was 34.33%, 32.46%, 13.67%, and 3.28% greater than that for N0, N90, N135, and N225 at 35 days after anthesis, respectively. These findings showed that the N180: 180 kg·hm−2 treatment was more beneficial for increasing N metabolism-related enzyme activities in the flag leaf than any other treatment.

3.5. Effect of Nitrogen Rate on Rice Physical and Chemical Properties

The characteristic starch RVA profile is an important indicator reflecting rice taste. The effects of the N fertilization treatments on the eigenvalues for the RVA spectrum were significant (Table 3). The setback value (SBV) was lowest under N0, while the breakdown value (BDV) was the highest over the two experimental years. BDV was the lowest, and SBV was the highest under N135 treatment, indicating that rice taste was the best under this treatment, whereas it was poor under N0 treatment. With an increasing N application rate, BDV increased, SBV decreased, and rice taste decreased.

3.6. Effect of Nitrogen Rate on Rice Processing Quality

As seen in Table 4, the effects of N fertilizer treatments on the processing quality of low-gluten rice were inconsistent. The amount of N applied had no significant effect on the rice polishing rate or aspect ratio. In turn, brown rice rate increased with increasing N rate, and the corresponding rate under N225 was significantly higher than that in the N0 treatment, although not significantly different from any other treatment. Rice heading rate increased with increasing N rate, and under N180 and N225, it was significantly higher than that for N0 and N90, but there was no significant difference between N135 and the other treatments. Chalkiness generally decreased with increasing N rate. Chalkiness under N0 was the highest, whereas under N225, it was significantly lower than that of the other treatments, and there was no significant difference in chalkiness between N90 and N135 or N180 treatments.

3.7. Effect of Nitrogen Rate on Protein Content

Albumin, globulin, gliadin, and glutenin contents in the rice grain generally increase with rice growth. Furthermore, they all tended to increase with increasing N rate overtime after the full heading stage (Figure 5). The two-year test results reported herein showed the same trend. All of the abovementioned contents were highest under the N225 treatment at 30 days after full heading. The average albumin content under N225 treatment in both years was 127.01%, 64.71%, 35.59%, and 12.94% higher than under N0, N90, N135, and N180, respectively; the difference in each case was significant (Figure 5A,B). In turn, the average globulin content under N180 treatment in both years was 221.38%, 96.51%, 51.83%, and 11.16% higher than under N0, N90, N135, and N180, respectively; again, the difference in each case was significant (Figure 5C,D). In turn, the average gliadin content under N180 treatment in both years was 199.50%, 163.93%, 110.94%, and 67.16% higher than under N0, N90, N135, and N180, respectively, with the difference being significant (Figure 5E,F). Finally, the average glutenin content under N180 treatment in both years was 181.91%, 69.96%, 48.65%, and 4.68% higher than under N0, N90, N135, and N225, respectively (Figure 5G,H). These findings show that the N rate significantly affected the protein components in rice grains.

3.8. Effect of Nitrogen Rate on the Proportion of Each Component Protein to Total Protein at Maturity

Increasing N rate increased total protein content of the grain at maturity, and average total protein ranged from 61.75 to 80.66 mg·g1 over the two experimental years (Table 5). The ratio of protein components to total protein in mature grains did not change much under different N application rates. Thus, average albumin accounted for 16.40–18.03% of the total protein over the two years; in turn, globulin accounted for 16.36–17.85%, gliadin for 13.84–15.69%, and gluten for 42.08–45.32%. The statistical analysis showed that the amount of N application mainly affected gliadin and gluten contents, whereas the effect on globulin was not significant. Gluten was lower than in ordinary rice, in which it normally accounts for approximately 80% of the total protein content in the grain. This result suggested that the proportion of each component protein to total protein content and low gluten characteristics are mainly genetically controlled, while the effects of N application rate were not significantly effective.

4. Discussion

4.1. The Effect of Nitrogen Fertilizer on the Physical and Chemical Properties and the Processing Quality of Low-Gluten Rice

Amylose content in rice is related to the stickiness and softness of the grain and affects its texture and palatability upon cooking. Further, it is closely related to the physical and chemical properties of the endosperm and is greatly affected by cooking. Regarding the effect of N application rate on rice amylose content, reports are controversial. Thus, some studies have suggested that amylose content gradually decreases with increasing N application rate [22,23]. In contrast, other studies indicate that amylose content increases with increasing N application rate. Furthermore, other research showed that amylose content did not differ with increasing N application rate [24]. In this study, amylose content decreased slightly with increasing N application rate, but there was no significant difference among the treatments, indicating that N application rate had no significant effect on the amylose content of D105, thus confirming that D105 is a low-amylose variety whose starch content is mainly controlled genetically. It is generally believed that rice grains with low amylose content have weak water absorption, small swelling properties, are sticky and soft, and have good palatability [25,26]. Some researchers believe that, as N application rate increases, maximum viscosity and disintegration value decrease, alkali elimination value and gelatinization temperature increase, taste quality deteriorates, consistency of rice glue shortens, and rice grains harden [27]. Studies have also indicated that when the reduction value in the characteristic value of starch RVA spectrum is >0, the smaller the disintegration value and the larger the reduction value, the better the palatability [28]. In this study, the subtraction value of the characteristic value of the starch RVA profile first increased and then decreased as the N application rate increased, while, concomitantly, the other characteristic values first decreased and then increased. Comprehensive analysis showed that rice yield under N135 treatment rendered the best taste. Contrary to a previous study [29], here, the disintegration value increased, and the reduction value and rice taste decreased with further increase in N application rate, the reason being that the reduction value of D105 in this study was >0, whereas, in the previous study, rice consumption impairment value was <0. In summary, within a certain range, the cooking quality of low-gluten rice D105 improved with increasing N application rate, while excessive N application reduced rice cooking quality. Additionally, the RVA profile characteristics of rice are also related to protein content and the ratio of component proteins. Wu Hongkai et al. [30] found that the content of gluten relative to gliadin has a certain degree of influence on rice eating quality. It is believed that in lgc-1 rice (gluten protein), the gluten content is greater than the gliadin content, whereby the rice is softer, sticky, and tastes better [31]. Many studies agree that increasing amounts of N fertilizer can increase brown, polished, and head rice rates [32]; this study is no exception. Within a certain range of applied N fertilizer, higher N content contributed to vigorous roots. Successively, greater plant vigor and increased leaf NR and GS activities promoted material transport, increased grain weight and grain plumpness, and simultaneously increased plant N content, thereby increasing N compounds circulating in the panicle. Grain hardness also increased, and the processing quality improved. If excess N is applied, N is retained in the rice plant and cannot be supplied in time, resulting in reduced NR and GS activities. Excessive amounts of N application impair the distribution of photoassimilate in the panicles and hinder grain filling, leading to an increase in under- or unfilled grains, and ultimately, reduced processing quality [33]. Many researchers differ in their opinion on the effect of N application rate on rice chalkiness. Most people think that chalkiness in rice will increase with N application [34]. Further, others think increasing the amount of N fertilizer will reduce rice chalkiness rate and chalky area [35]. The plant material used herein was different. Thus, our results showed that, within a certain N range, the chalkiness of low-gluten D105 rice decreased with increasing N application rate. Further, increased N application improves rice photosynthesis, whereby the accumulation and transport of photoassimilate are enhanced, and the chalky area is reduced and, consequently, chalkiness is reduced. In summary, a reasonable N rate has a great positive influence on the physicochemical properties and processing quality of low-gluten D105 rice.

4.2. Effect of Nitrogen Fertilizer on Rice Grain Protein and Its Components

Rice protein content is a complex quality index affected by genotype and environment, and, specifically, N application has a significant impact on it [36]. There are many studies on the effect of N rate on protein and its components It is generally believed that increasing N fertilizer can increase rice grain protein content and its components However, the amount and time of fertilizer application have different effects on protein content and only a minimal effect on the percentage of protein content [37]. Geng Chunmiao [38] found that the response of protein content in low-gluten rice to N supply increased with increasing N content and panicle fertilizer ratio. Increasing the N rate and shifting of panicle manure resulted in increased gliadin in polished rice. Gluten increased significantly, but the difference between N4 (360 kg·hm−2) and N3 (270 kg·hm−2) among high fertilizer treatments did not reach a very significant level. By comparing the ratio of each component protein to the total protein in rice grains at maturity, this study found that under different N treatments, the ratio of the four component proteins to the total protein content slightly changed, indicating that the amount of N did not significantly affect the protein component ratio. This observation was consistent with results reported by Zhang et al. [39]. In this study, we found that, in terms of protein components, rice grain albumin and gliadin at maturity (35 d after flowering) showed no significant difference under any N fertilization treatment, whereas globulin and gluten did. This finding suggests that different N application rates may have little effect on albumin and gliadin, whereas they may have striking effects on globulin and gluten. These findings differ slightly from the results of previous studies [40,41], likely owing to genetic differences between the rice varieties under study in each case.

5. Conclusions

Nitrogen rate did not change the proportions of component proteins relative to total protein content in the grain. Processing and taste quality of D105 low-gluten rice were optimal in the N135 and N180 treatments, and the overall quality of rice decreased under the N225 treatment. Therefore, the optimal nitrogen rate for D105 low-gluten rice production is 180 kg·hm−2.

Author Contributions

Investigation, Methodology, Writing—original draft, Y.L. and X.S.; Data curation, J.W.; Investigation, Methodology, Q.D. and C.W.; Supervision, Validation, C.D.; Conceptualization, Funding acquisition, Supervision, Validation, T.L.; All authors have read and agreed to the published version of the manuscript.

Funding

This study was supported by Sichuan Science and Technology Program (2020YFH0146).

Institutional Review Board Statement

Not applicable.

Informed Consent Statement

Informed consent was obtained from all subjects involved in the study.

Data Availability Statement

The data presented in this study are available on request from the authors.

Acknowledgments

We would like to thank our teacher for carefully reading and correcting our manuscript and providing technical assistance and financial support for the study, as well as our scientific research team for their contribution to this paper.

Conflicts of Interest

The authors declare that they have no known competing financial interests or personal relationships that could appear to influence the work reported in this paper.

References

  1. Mizuma, T.; Sachiko, I.; Kiyokawa, Y.; Wakai, Y.; Yamamoto, Y.; Tsutsui, N.; Matsushita, K.; Maeda, H.; Iida, S.; Nemoto, H. Characteristics of Low-Glutelin Rice for Sake Brewing—Studies on Rice for Sake Brewing. J. Biosci. Bioeng. 2002, 80, 512–520. [Google Scholar] [CrossRef]
  2. Furukawa, S.; Itou, M.; Masumura, T.; Tanaka, K.; Kiyokawa, Y.; Wakai, Y. Ultrastructure of low-glutelin rice endosperm. Plant Biotechnol. 2007, 24, 227–229. [Google Scholar] [CrossRef]
  3. Zhou, C.; Huang, Y.; Jia, B.; Wang, Y.; Wang, Y.; Xu, Q.; Li, R.; Wang, S.; Dou, F. Effects of Cultivar, Nitrogen Rate, and Planting Density on Rice-Grain Quality. Agronomy 2018, 8, 246. [Google Scholar] [CrossRef] [Green Version]
  4. Mochizuki, T.; Hara, S. Usefulness of the low protein rice on the diet therapy in patients with chronic renal failure. Nihon Jinzo Gakkai Shi 2000, 42, 24–29. [Google Scholar]
  5. Martinez, M.F.; Arelovich, H.M.; Wehrhahne, L.N. Grain yield, nutrient content and lipid profile of oat genotypes grown in a semiarid environment. Field Crop. Res. 2010, 116, 92–100. [Google Scholar] [CrossRef]
  6. Chen, P.; Shen, Z.; Ming, L.; Li, Y.; Dan, W.; Lou, G.; Peng, B.; Wu, B.; Li, Y.; Zhao, D.; et al. Genetic Basis of Variation in Rice Seed Storage Protein (Albumin, Globulin, Prolamin, and Glutelin) Content Revealed by Genome-Wide Association Analysis. Front. Plant Sci. 2018, 9, 612. [Google Scholar] [CrossRef] [Green Version]
  7. Yang, M.; Lu, K.; Zhao, F.-J.; Xie, W.; Ramakrishna, P.; Wang, G.; Du, Q.; Liang, L.; Sun, C.; Zhao, H.; et al. Genome-Wide Association Studies Reveal the Genetic Basis of Ionomic Variation in Rice. Plant Cell 2018, 30, 2720–2740. [Google Scholar] [CrossRef] [PubMed] [Green Version]
  8. Jin, Z.X.; Qiu, T.Q.; Sun, Y.L.; Zhao, J.M.; Jin, X.Y. Effect of nitrogen fertilizer on chalkiness ratio and cooking and eating quality properties of rice grain. Plant Nutr. Fert. Sci. 2001, 7, 31–35, (In Chinese with English abstract). [Google Scholar]
  9. Jin, T.; Xiyang, Q.Y.; Chengxin, J.; Lijun, L.; Hao, Z. Grain quality and its response to nitrogen fertilizer in mid-season indica rice varieties planted in different decades from 1950s to 2010s. Acta Agron. Sin. 2016, 42, 1352–1362, (In Chinese with English abstract). [Google Scholar]
  10. Han, Z.Y.; Guan, X.Y.; Zhao, Q.; Wu, C.Y.; Huang, F.D.; Pan, G.; Cheng, F.M. Individual and combined effects of air temperature at filling stage and nitrogen application on storage protein accumulation and its different components in rice grains. Acta Agron. Sin. 2020, 46, 1087–1098. [Google Scholar] [CrossRef]
  11. Zhang, H.; Wu, G.; Huo, Z.; Xu, K.; Gao, H.; Wei, H.; Wan, L.; Huang, Y. Precise postponing nitrogen application and its mechanism in rice. Acta Agron. Sin. 2011, 37, 1837–1851, (In Chinese with English abstract). [Google Scholar] [CrossRef]
  12. Hu, Y.J.; Zhu, D.W.; Xing, Z.P.; Gong, J.Z.; Zhang, H.Z.; Dai, Q.G.; Huo, Z.Y.; Ke, X.; Wei, H.U.; Guo, B.W. Modifying nitrogen fertilization ratio in increase the yield and nitrogen uptake of super japonica rice. Plant Nutr. Fert. Sci. 2015, 21, 12–22, (In Chinese with English). [Google Scholar]
  13. Zhu, D.-W.; Zhang, H.-C.; Guo, B.-W.; Xu, K.; Dai, Q.-G.; Wei, H.-Y.; Gao, H.; Hu, Y.-J.; Cui, P.-Y.; Huo, Z.-Y. Effects of nitrogen level on yield and quality of japonica soft super rice. J. Integr. Agric. 2017, 16, 1018–1027. [Google Scholar] [CrossRef]
  14. Godfrey, D.; Hawkesford, M.J.; Powers, S.J.; Millar, S.; Shewry, P.R. Effects of Crop Nutrition on Wheat Grain Composition and End Use Quality. J. Agric. Food Chem. 2010, 58, 3012–3021. [Google Scholar] [CrossRef]
  15. Lea, P.J.; Blackwell, R.D.; Chen, F.L. Enzymes of primary metabolism. In Methods in Plant Biochemistry; Harborne, J.B., Ed.; Academic Press: New York, NY, USA, 1990; Volume 3, pp. 260–273. ISBN 0124610137. [Google Scholar]
  16. Hesheng, L. Experimental Principles and Techniques of Plant Physiology and Biochemistry; Higher Education Press: Beijing, China, 2000; pp. 125–127. [Google Scholar]
  17. Gilani, G.S.; Xiao, C.W.; Cockell, K.A. Impact of Antinutritional Factors in Food Proteins on the Digestibility of Protein and the Bioavailability of Amino Acids and on Protein Quality. Br. J. Nutr. 2012, 108, S315–S332. [Google Scholar] [CrossRef] [PubMed]
  18. Zhang, C.T. A Guide to Modern Plant Physiology Experiments; Science Press: Beijing, China, 1999; ISBN 7-03-008099-8. [Google Scholar]
  19. Yan, Y.; Zhang, L.X.; Wan, C.Z.; Shuju, W. Correlation between RVA spectral characteristic value and physical and chemical index of rice starch and taste value. Plant Physiol. J. 2016, 52, 1884–1890. [Google Scholar] [CrossRef]
  20. Wei, H.Y.; Chen, Z.F.; Xing, Z.P.; Zhou, L.L.; Liu, Q.Y.; Zhang, Z.Z.; Jiang, Y.; Hu, Y.J. Effects of slow or controlled release fertilizer types and fertilization modes on yield and quality of rice. J. Integr. Agric. 2018, 17, 2222–2234. [Google Scholar] [CrossRef]
  21. Zhu, D.; Zhang, H.; Guo, B.; Xu, K.; Dai, Q.; Wei, C.; Zhou, G.; Huo, Z. Effects of nitrogen level on structure and physicochemical properties of rice starch. Food Hydrocoll. 2017, 63, 525–532. [Google Scholar] [CrossRef]
  22. Tang, S.; Zhang, H.; Liu, W.; Dou, Z.; Zhou, Q.; Chen, W.; Wang, S.; Ding, Y. Nitrogen fertilizer at heading stage effectively compensates for the deterioration of rice quality by affecting the starch-related properties under elevated temperatures. Food Chem. 2019, 277, 455–462. [Google Scholar] [CrossRef] [PubMed]
  23. Baghdadi, A.; Halim, R.A.; Ghasemzadeh, A.; Ramlan, M.F.; Sakimin, S.Z. Impact of organic and inorganic fertilizers on the yield and quality of silage corn intercropped with soybean. PeerJ 2018, 6, e5280. [Google Scholar] [CrossRef] [Green Version]
  24. Khan, A.; Tan, D.K.Y.; Afridi, M.Z.; Luo, H.; Tung, S.A.; Ajab, M.; Fahad, S. Nitrogen fertility and abiotic stresses management in cotton crop: A review. Environ. Sci. Pollut. Res. 2017, 24, 14551–14566. [Google Scholar] [CrossRef] [PubMed]
  25. Clerici, M.T.P.S.; Sampaio, U.M.; Schmiele, M. Identification and Analysis of Starch. Starches Food Appl. 2019, 23–69. [Google Scholar] [CrossRef]
  26. Zhang, X.M.; Shi, C.H.; Fu, T.G. Correlation analysis between starch characteristics and taste quality in japonica rice. Chin. J. Rice Sci. 2002, 16, 157–161, (In Chinese with English abstract). [Google Scholar]
  27. Ji, H.J.; Zhao, B.H.; Chen, G. Response of grain yield and quality of Yangjing 805 to wheat straw returning and nitrogen management. J. Yangzhou Univ. Agric. Life Sci. 2016, 37, 60–64, (In Chinese with English abstract). [Google Scholar]
  28. Wang, Y.W.; Li, H.X.; Tian, G.; Sun, M.R.; Shi, Q.X.; Guo, E.H. Relationship between cooked millet palatability and both visual quality and RVA profile character of starch. Shanxi Agric. Sci. 2008, 36, 34–39, (In Chinese with English abstract). [Google Scholar]
  29. Lan, Y.; Huang, P.; Jiang, G.U. Effect of nitrogen application and planting density on grain yield and quality of japonica rice cultivar D46 in the planting area of Chengdu plain. J. Zhejiang Univ. 2016, 42, 63–73, (In Chinese with English abstract). [Google Scholar]
  30. Wu, H.K.; Liu, S.J.; Jiang, L. Relationship between protein composition and total protein content and starch RVA profile properties in rice. Chin. J. Rice Sci. 2009, 23, 421–426, (In Chinese with English abstract). [Google Scholar]
  31. Blumenthal, J.M.; Baltensperger, D.D.; Cassman, K.G.; Mason, S.C.; Pavlista, A.D. Importance and Effect of Nitrogen on Crop Quality and Health. In Nitrogen in the Environment; Elsevier BV: Amsterdam, The Netherlands, 2008; Volume 3, pp. 51–70. [Google Scholar]
  32. Li, G.H.; Chen, Y.L.; Ding, Y.F.; Geng, C.M.; Quan, L.I.; Liu, Z.H.; Wang, S.H.; She, T.A. Charactering protein fraction concentrations as influenced by nitrogen application in low-glutelin rice cultivars. J. Integr. Agric. 2016, 15, 537–544, (In Chinese with English abstract). [Google Scholar] [CrossRef] [Green Version]
  33. Wei, H.-Y.; Wang, Y.-J.; Meng, T.-Y.; Ge, M.-J.; Zhang, H.-C.; Dai, Q.-G.; Huo, Z.-Y.; Xu, K. Response of yield, quality and nitrogen use efficiency to nitrogen fertilizer from mechanical transplanting super japonica rice. J. Appl. Ecol. 2014, 25, 488–496. [Google Scholar]
  34. Otto, R.; Mulvaney, R.L.; Khan, S.A.; Trivelin, P.C.O. Quantifying soil nitrogen mineralization to improve fertilizer nitrogen management of sugarcane. Biol. Fertil. Soils 2013, 49, 893–904. [Google Scholar] [CrossRef]
  35. Yang, J.; Luo, Q.X.; Qian, C.R. Effects of nitrogen on the content of protein components and cooking and eating quality of rice. J. Northeast Agric. Univ. 2006, 37, 145–150, (In Chinese with English abstract). [Google Scholar]
  36. Chi, Z.Z.; Zhao, G.C.; Zheng, J.G. Effect of nitrogen application amount on protein components in grain of different varieties wheat. Southwest China J. Agric. Sci. 2010, 23, 427–431, (In Chinese with English abstract). [Google Scholar]
  37. Wang, S. Effect of Nitrogen Application and Transplanting Density on Protein Content and Rice Quality in Cold Japonica Rice. Harbin: Northeast Agricultural University. 2015. Available online: http://en.cnki.com.cn/Article_en/cjfdtotalhljn201907010 (accessed on 5 December 2020).
  38. Geng, C.M. Effect of Nitrogen and Seeding Date on the yield and Quality of Low Glutelin Rice. Nanjing: Nanjing Agriculture University. 2011. (In Chinese with English abstract). Available online: https://b41aa555638a4e353337c5fc6691e9b1&site=xueshu_se (accessed on 5 December 2020).
  39. Zhang, X.; Shi, L.L.; Liu, X.Y. Effect of Different Fertilizer Treatments on Rice Yield, Grain Quality and Protein Fraction Content. Chin. Agric. Sci. Bull. 2010, 26, 104–108. [Google Scholar]
  40. Xu, D.Y.; Fang, Z.W.; Gao, Y. Effects of N fertilizer on protein content, composition and amino acid content of rice grains. In China Youth Agricultural Science Academic Annual Report; China Agriculture Press Pub: Beijing, China, 2004; (In Chinese with English abstract). [Google Scholar]
  41. Zhao, N.C.; Zhang, X.M.; Ye, H.S. Effects of different cultivation methods and nitrogen application on grain phytic acid contents and nutritional quality for japonica rice. Acta Agric. Zhejiangensis 2009, 21, 259–263, (In Chinese with English abstract). [Google Scholar]
Figure 1. Meteorological data of the experimental area, including temperature and rainfall in 2017–2019.
Agriculture 11 00302 g001
Figure 2. Effects of N application on dry matter accumulation. HS represents heading stage; MS represents mature stage, lower case letters indicate that the physical and chemical properties of the low-gluten rice are significantly different with the different treatments (p < 0.05, LSD method).
Agriculture 11 00302 g002
Figure 3. The effect of different nitrogen application rates on the SPAD of rice in different growth progresses. Lower case letters indicate that the physical and chemical properties of the low-gluten rice are significantly different with the different treatments (p < 0.05, LSD method).
Agriculture 11 00302 g003
Figure 4. Effects of N application on enzyme activity in rice. Lower case letters indicate that the physical and chemical properties of the low-gluten rice are significantly different with the different treatments (p < 0.05, LSD method).
Agriculture 11 00302 g004
Figure 5. Effects of different nitrogen application amount on the change of albumin content (A,B), the globulin content (C,D), the gliadin content (E,F) and the Glutenin content (G,H) in rice.
Agriculture 11 00302 g005
Table 1. Analysis of variance on low gluten rice yield and protein content.
ANOVAAlbuminGlobulinGliadinGluteninSPADGSNRDMGY
Year177.49 **25.55 **0.82 ns237.82 **43.50 **2.87 ns1.98 ns525.54 **49.86 **
Year × N1.49 ns0.46 ns2.09 ns8.68 *23.33 **2.17 ns0.97 ns14.41 *23.57 *
GS, NR, DM, and GY represent the glutamine synthetase, nitrate reductase, dry matter, and grain yield, respectively. Analysis of variance (ANOVA) p values and symbols were defined as: * p < 0.05; ** p < 0.01; NS: p > 0.05.
Table 2. Effects of different nitrogen application amount on yield and its components of rice.
YearTreatmentPNSPNSSR1000-GWGY
(×104·hm2)(panicle−1)(%)(g)(kg·hm2)
2018N0218.39 d57.04 e88.61 c26.14 c288.64 e
N90278.22 c67.48 d90.65 bc26.84 c456.93 d
N135298.66 c70.60 c91.14 b27.06 b520.12 c
N180315.55 b82.39 a92.25 a27.82 b667.31 a
N225326.28 a76.03 b91.10 b28.67 a648.11 b
2019N0256.12 d66.51 d92.64 c27.52 b434.29 d
N90281.01 bc78.68 c92.69 c27.97 a b573.21 c
N135282.81 b81.34 b92.61 c27.38 c583.29 b
N180304.15 a85.15 a94.57 b28.04 a686.75 a
N225308.82 a85.02 a94.56 b27.43 c681.01 ab
PN, SPN, SSR, 1000-GW, GY represent the productive panicle number, spikelet number panicle−1, 1000-grain weight, grain yield, respectively. Lower case letters indicate that the physical and chemical properties of the low-gluten rice are significantly different with the different treatments (p < 0.05, least significant difference (LSD) method).
Table 3. The effect of different nitrogen application rates on the physical and chemical properties of rice.
YearTreatmentPKVHPVBDVFVSBV
(cp)(cp)(cp)(cp)(cp)
2018N02357.45 a1330.37 a1026.62 a2665.79 a308.03 d
N902239.51 b1299.67 b939.33 b2661.35 a422.28 c
N1351726.91 e1091.75 c634.08 d2346.37 d620.39 a
N1802115.16 c1182.25 c933.66 b2452.04 c337.37 d
N2252014.33 d1219.67 b794.74 c2511.33 b497.33 b
2019N02916.29 a1754.58 a1175.27 a2934.67 a319.91 d
N902670.16 b1617.83 b1163.06 a2711.04 b433.56 c
N1352346.25 d1482.63 c993.33 b c2532.91 d631.81 a
N1802526.21 c1604.63 b1056.58 b2633.37 b c348.96 d
N2252475.12 cd1613.16 b729.71 d2706.22 b508.63 b
PKV: peak viscosity; HPV: hot paste viscosity; BDV: break down value; FV: final viscosity; SBV: set back value. Note: lower case letters indicate that the physical and chemical properties of the low-gluten rice are significantly different with the different treatments (p < 0.05, LSD method).
Table 4. Effects of different nitrogen application amount on processing quality of rice.
YearTreatmentBRRMRRHRRCRLWR
(%)(%)(%)(%)
2018N080.87 b71.47 b62.52 d25.37 a1.71 a
N9081.8 ab71.62 b63.84 c24.07 b1.75 a
N13582.93 ab73.12 ab65.46 ab24.23 b1.82 a
N18083.13 ab73.61 ab66.41 ab23.53 bc1.76 a
N22584.01 a74.67 a67.62 a21.23 c1.74 a
2019N077.33 b65.96 c65.21 c18.96 a1.79 a
N9079.21 ab68.41 b66.53 b12.83 c1.77 a
N13580.16 ab69.71 ab68.15 ab16.46 b1.72 a
N18080.85 ab70.17 ab69.19 a11.56 d1.75 a
N22581.31 a71.71 a70.31 a8.13 e1.71 a
BRR: brown rice rate; MRR: milled rice rate; HRR: head rice rate; CR: chalkiness rate; LWR: length-width ratio. Lower case letters indicate that the processing quality of the low-gluten rice are significantly different with the different treatments (p < 0.05, LSD method).
Table 5. Effect of different nitrogen application amount on the ratio of each component protein to total protein during maturity of low-gluten rice grain.
YearTreatmentTotal ProteinAlbuminGlobulinGliadinGluteninOther Protein
mg·g−1(%)(%)(%)(%)(%)
2018N061.883 e14.559 a18.029 a13.369 b45.424 b8.619 b
N9064.180 d14.797 a17.524 b13.875 b47.226 a6.578 c
N13575.480 c13.795 a15.987 c13.143 b42.896 e14.180 a
N18076.367 b14.585 a17.298 b15.331 a44.715 c8.072 b
N22580.327 a14.035 a17.292 b15.889 a43.820 d8.964 b
2019N061.620 e19.018 b17.047 b14.327 c43.851 a5.757 b
N9064.067 d18.994 b17.031 b15.342 b43.420 a5.213 b
N13567.730 c19.005 b16.737 b16.261 a41.279 b6.717 a
N18074.620 b18.838 b16.344 b15.319 b43.381 a6.117 a
N22581.007 a22.029 a18.421 a15.508 b43.070 a0.972 c
Total protein: Total protein content, the albumin, globulin, gliadin, glutenin reprent the albumin relative to total protein content, globulin relative to total protein content, gliadin relative to total protein content, glutenin relative to total protein content, respectively. Lower case letters indicate that the component protein of the low-gluten rice are significantly different with the different treatments (p < 0.05, LSD method).
Publisher’s Note: MDPI stays neutral with regard to jurisdictional claims in published maps and institutional affiliations.

