Article

Genome-Wide Association Study Reveals the Genetic Basis of Cold Tolerance in Rice at the Seedling Stage

1
Department of Crop Science, Konkuk University, Seoul 05029, Korea
2
Department of Southern Area Crop Science, National Institute of Crop Science, Rural Development Administration, Miryang 50434, Korea
*
Author to whom correspondence should be addressed.
Agriculture 2021, 11(4), 318; https://doi.org/10.3390/agriculture11040318
Submission received: 22 February 2021 / Revised: 26 March 2021 / Accepted: 2 April 2021 / Published: 4 April 2021
(This article belongs to the Special Issue Rice Breeding and Genetics)

Abstract

:
We conducted a genome-wide association study (GWAS) of cold tolerance in a collection of 127 rice accessions, including 57 Korean landraces at the seedling stage. Cold tolerance of rice seedlings was evaluated in a growth chamber under controlled conditions and scored on a 0–9 scale, based on their low-temperature response and subsequent recovery. GWAS, together with principal component analysis (PCA) and kinship matrix analysis, revealed four quantitative trait loci (QTLs) on chromosomes 1, 4, and 5 that explained 16.5% to 18.5% of the variance in cold tolerance. The genomic region underlying the QTL on chromosome four overlapped with a previously reported QTL associated with cold tolerance in rice seedlings. Similarly, one of the QTLs identified on chromosome five overlapped with a previously reported QTL associated with seedling vigor. Subsequent bioinformatic and haplotype analyses revealed three candidate genes affecting cold tolerance within the linkage disequilibrium (LD) block of these QTLs: Os01g0357800, encoding a pentatricopeptide repeat (PPR) domain-containing protein; Os05g0171300, encoding a plastidial ADP-glucose transporter; and Os05g0400200, encoding a retrotransposon protein, Ty1-copia subclass. The detected QTLs and further evaluation of these candidate genes in the future will provide strategies for developing cold-tolerant rice in breeding programs.

1. Introduction

Seed germination and seedling establishment are important factors required for the successful rooting of plants in an irrigated field [1]. A temperature of 25–35 °C is considered optimal for the growth of rice (Oryza sativa L) seedlings; however, the temperature of irrigation water is frequently below 15 °C in tropical and subtropical areas at high altitudes [2]. Because of the unavailability of labor and high production cost, direct seeding has become increasingly important and popular in many rice-growing countries in Asia and is being adopted as an alternative to conventional transplanting [3]. Cold stress restricts rice plant growth and development at all stages of the life cycle. At the early growth stage, cold stress leads to poor germination rate, weak seedlings with wilting, yellowing or withering leaves, delayed seedling emergence, retarded plant development, and yield loss [4,5]. Japonica rice (O. sativa L. ssp. japonica) varieties are well-adapted to temperate and sub-temperate regions and to high-altitude areas in subtropical regions and exhibit greater cold tolerance than indica rice (O. sativa L. ssp. indica) varieties, which are cultivated in tropical and subtropical regions [6]. Cold temperature affects the growth and development of rice plants during their entire life cycle, starting from seed germination to the grain filling stage, eventually leading to yield loss. Cold tolerance research in rice has generally been focused on the seedling stage and reproductive developmental stages, which are highly sensitive to unfavorable temperature conditions.
Like other important agronomic traits, cold tolerance in rice is genetically controlled by multiple quantitative trait loci (QTLs). In several studies, QTLs have been detected using indica/japonica bi-parental mapping populations. More than 250 cold-tolerance-associated QTLs have been identified in rice, spanning all 12 chromosomes, at various growth and developmental stages [7,8,9,10,11].
Despite many QTLs reported for cold tolerance in rice, only a few underlying genes have been identified at different growth stages [12,13,14]. The gene identified at the low-temperature germinability QTL, qLTG3-1, encodes a hybrid glycine-rich protein, and a single-nucleotide polymorphism (SNP) in this gene was responsible for cold tolerance [15]. Since cold tolerance in rice is a highly complex trait, identifying genes underlying the reported QTLs is a slow process.
Undoubtedly, the identification of additional cold-tolerance QTLs and genes will enhance our understanding of the mechanisms of cold tolerance and provide useful strategies for developing elite varieties. In recent years, genome-wide association study (GWAS) has been widely used to discover the genetic basis of complex traits. To date, most of the published data on genetic loci controlling cold tolerance in rice have been obtained using bi-parental mapping populations derived from O. sativa ssp. indica × O. sativa ssp. japonica crosses, where japonica cultivars usually serve as the donor of cold tolerance [16]. Because genetic variability in a bi-parental mapping population is limited to the two parental lines, GWAS has been increasingly utilized as an alternative tool to study cold tolerance in rice. With the accumulation of genomic data from a large number of rice accessions, GWAS has led to the detection of QTLs associated with cold stress response in rice. For example, 33 and 22 cold tolerance QTLs were identified at the germination and booting stages, respectively, in a collection of 174 Chinese rice accessions [5]. Similarly, 17 QTLs associated with low-temperature germinability were reported in a collection of 63 Japanese rice varieties [17]. Sales et al. (2017) [18] identified 24 SNPs associated with germination and growth rate at low temperatures. Shakiba et al. (2017) [19] reported 42 QTLs associated with cold tolerance at the seedling stage.
The damaged phenotype by cold stress in the vegetative stage shows symptoms like yellowing of leaves, reduced leaf expansion, and wilting to damage to the photosynthetic machinery, resulting in an overall reduction in photosynthetic processes and deficit in energy resources [20]. At the molecular level, cold stress leads to the modification of metabolism, such as structure, catalytic properties and function of enzymes [21]. Cold stress reduces the fluidic nature of cellular membranes and increases their rigidity. Thus many metabolites having functioned as osmolytes have been reported as an important role in inducing cold stress tolerance [21]. Cold stress affects membrane rigidification in plant cells, which is known to be triggers downstream cold-stress responses in plants [22]. The cold stress signal is transduced through several components of signal transduction pathways whose components are calcium, reactive oxygen species, protein kinase, protein phosphatase and lipid signaling cascades [23,24]. Recent gene expression analyses reported that specifically expressed genes under the cold stress condition are involved in detoxification of reactive oxygen species, damage control and repairing, restructuring plasma membrane, and acceleration in osmolytes synthesis [20].
The cold stress damage occurs throughout the whole rice cultivating season, from germination to the grain filling stage. The symptoms of cold sensitivity and damage vary according to the developmental stages. Thus, so far, many genetic studies for cold tolerance were conducted with various treatment methods and the rice population [25]. Because cold tolerance is a complex trait, various cold treatment methods have been used to understand its molecular genetic bases, such as cold water treatment, air temperature-controlled growth chamber, and naturally cold regions [26]. Because of the complexity of cold-tolerant traits depend on various environment and the genetic, developmental stages, the genetic studies for the cold-tolerant trait are an ongoing project. Here, we conducted GWAS to identify QTLs related to cold tolerance in a core collection of 127 Korean rice accessions at the seedling stage to provide genetic information to the breeding program for developing cold-tolerant rice in the seedling stage. Among 127 accessions, 57 are Korean landrace, including 27 weedy rice, which has been adapted to the environment of the Korean peninsula and have the potential to introduce a cold-tolerant gene into Korean commercial varieties efficiently in breeding programs.

2. Materials and Methods

2.1. Plant Material and Genotyping

A core set of 127 Korean rice accessions (KRICE-CORE) (Table S1), including 19 tropical japonica, 59 temperate japonica, 39 indica, seven aus, and three admixed accessions, was used in this study [27,28,29,30]. Whole-genome sequences of all 127 accessions were obtained using the Illumina HiSeq 2500 sequencing systems platform (Illumina Inc., San Diego, CA, USA). The average genome coverage was 8×, and filtered reads were aligned to the rice reference genome sequence (IRGSP 1.0). The following filtering parameters were used for the genomic sequences, as implemented in the Plink software v1.90 [31]: minor allele frequency (MAF) > 5%, missing data < 1%, and heterozygosity ratio < 5%. Finally, approximately 2 million SNPs were selected from a total of 6.5 million raw-data SNPs. The selected SNPs were distributed widely on the chromosomes ranging from 154,346 SNPs on chromosome 12 to 274,855 SNPs on chromosome 1.

2.2. Cold Treatment and Cold Tolerance Evaluation

Approximately 20 seeds of each of the 127 rice accessions were sown in a grid (50 mm × 50 mm) with seedbed media (Punong Ltd., Gyeongju, Korea) and placed in a greenhouse under darkness for 3 days to induce seed germination. After germination, the young seedlings were grown in the greenhouse under natural light conditions for 2 weeks. Then, the 2-week-old seedlings were transferred to a growth chamber (Hanbaek Sci. Bucheon, Korea) and subjected to cold treatment at 12 °C and 70% relative humidity [32] for 7 days and then at 10 °C and 70% RH for 5 days. Subsequently, the cold-treated rice seedlings were returned to the greenhouse and allowed to recover for 2 days. The cold-tolerance level of rice seedlings was evaluated based on their phenotype and scored on a scale ranging from 0 (highest cold tolerance) to 9 (zero cold tolerance; dead plant) (Figure 1) [33]. Three independent biological replications were performed, and the final cold-tolerance score was calculated as the average of the three replications.

2.3. Population Structure and Linkage Disequilibrium (LD) Decay Analysis

The population structure of 127 accessions was analyzed using ADMIXTURE 1.3.0 software [34], based on ~2 million high-quality SNPs. The number of distinct sub-groups was estimated using cross-validation (cv) error. ADMIXTURE was run with K starting from 2 to 6, and the optimal number of ancestries (K) was obtained by cross-validation (cv) error from ADMIXTURE based on tenfold cross-validation. The results were visualized using Pophelper structure Web App v1.0.10 (http://pophelper.com, accessed on 29 January 2021) [35]. The principal component analysis (PCA) matrix was generated using the Plink software [31], and an optimized number (5) of principal components (PCs) was used as a Q-matrix for GWAS correction. PCA plot visualization was performed in R version 4.0. Neighbor-joining (NJ) trees were generated using MEGA X [36], and the result was visualized using Tree of Life (iTOL) v4 (https://itol.embl.de, accessed on 4 February 2021) [37]. LD was calculated using the PopLDdecay software [38]. Pair-wise, LD was calculated for all SNPs and averaged across the whole genome. The LD decay was estimated as the chromosomal distance at which the average pair-wise correlation coefficient (r2) decreased to half its maximum value.

2.4. GWAS

First, SNPs with MAF < 5% were removed from the data. To perform GWAS analysis, the efficient mixed-model association (EMMA) [39], implemented in the R package EMMA was used. The kinship matrix was estimated using the emma.kinship function. To use MLM with Q-matrix and K-matrix, the kinship (K-matrix) was computed, and PC1–PC3 of genomic data was used as the Q-matrix. GWAS results and plot visualization was performed using the GAPIT package (version 3.0) in R. The association threshold was calculated using the following Equation (1) [40]:
association threshold = −log10 (1/number of independent SNPs),
Finally, the threshold was set as −log10(P) = 5.954 for the identification of the association QTLs. The SNP markers located at QTL peaks were designated as lead SNPs. LD decay analysis identified a 250 kb region on either side of the lead SNP as the candidate genomic region for gene identification.

2.5. Candidate Gene Prediction and Haplotype Analysis

Based on the results of LD decay analysis, a 500 kb reference sequence of the detected QTL regions was identified as the candidate region. Functional annotations of genes within the candidate regions were extracted from the Gramene database (http://www.gramene.org, accessed on 8 February 2020). Haplotype analysis was conducted using all SNP markers, except those with missing and heterozygous data. Haplotypes in at least five rice accessions were used for comparative phenotypic analysis. One-way analysis of variance [41] followed by the least significant difference (LSD) test was used to compare phenotypic differences among haplotypes.

3. Results

3.1. Cold Tolerance in Rice at the Seedling Stage

A total of 127 rice accessions belonging to five different groups (tropical japonica, temperate japonica, indica, aus, and admixed) were used to evaluate cold tolerance at the seedling stage. The boxplot of cold-tolerance score that divided the groups by ecotype showed significance between the japonica group and the other groups (Figure 2a). The graph was skewed to the left of the 0–9 scale, with a score of 3 showing the highest frequency (Figure 2b). The average cold-tolerance score of 127 accessions was 1.69, where 64 accessions showed a score of <2.00. RWG-017 (OKCHEONG; temperate japonica) and RWG-102 (Sando; tropical japonica) were the two most cold-tolerant accessions (score = 0.00) while RWG-040 (Magnolia; tropical japonica) was the least cold-tolerant (score = 8.67). Comparison of variation in cold tolerance among the five different groups revealed that the temperate japonica group showed greater cold tolerance than the indica and aus groups, with an average cold-tolerance score of 1.66 (Figure 2b). Temperate japonica rice showed slightly higher cold tolerance than tropical japonica rice; however, both groups showed high cold tolerance.

3.2. Population Structure and LD Decay

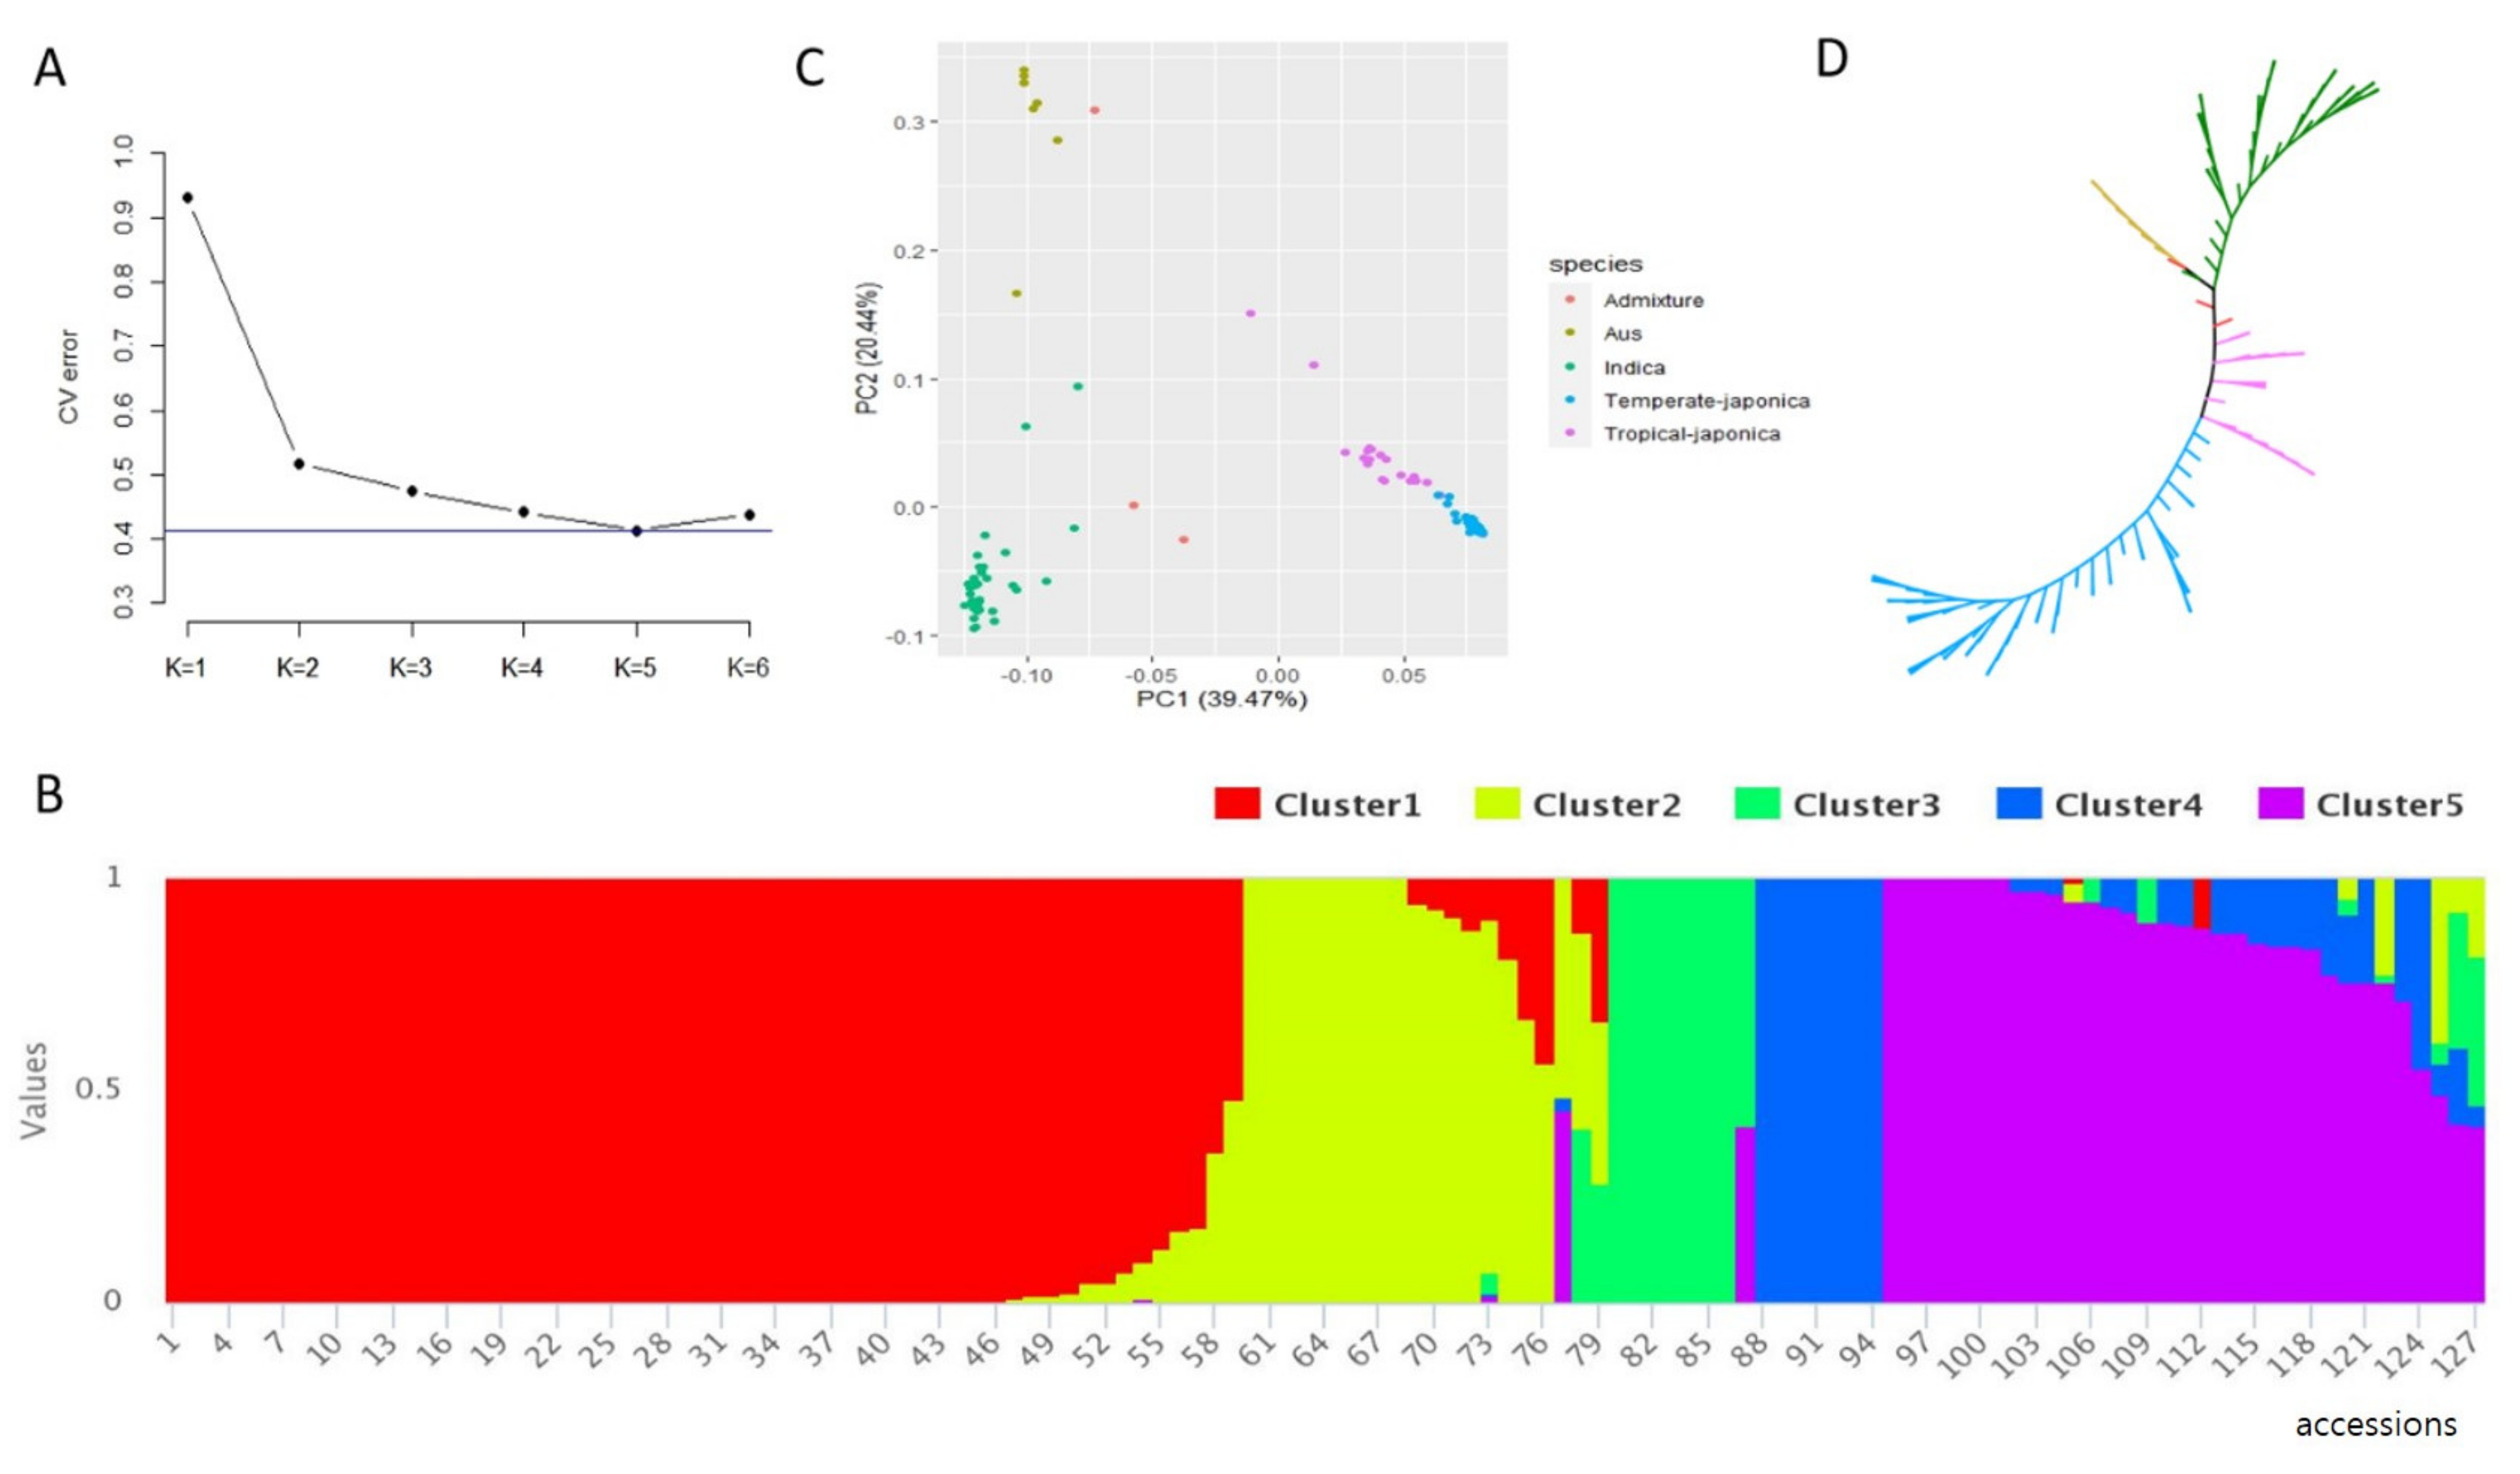
The ADMIXTURE software was used to calculate the genetic composition of all 127 accessions. Cross-validation (CV) analysis indicated that K = 5 was the optimal population grouping, which showed the lowest CV error compared with other K values (Figure 3a). Thus, these 127 accessions were divided into five groups, which were mostly distinguished by their subspecies (Figure 3b, Supplementary Table S1). Temperature japonica was divided into cluster 1 and cluster 4. Tropical japonica was dominant in cluster 2, Aus was dominant in cluster 3, indica was dominant in cluster 5. The results of PCA showed that PC1 and PC2 explained 39.47% and 20.44% of the total variation in population structure, respectively. Accessions belonging to temperate japonica, tropical japonica, indica, and aus subspecies formed significantly distinct clusters, whereas the admixed accessions exhibited ambiguous separation (Figure 3c). Additionally, the NJ tree constructed based on Nei’s genetic distance revealed five clusters (Figure 3d), consistent with the results of PCA in distinguishing among ecotypes. Most accessions were clearly separated by subspecies, while the admixed accessions were dispersed among the different clusters. Based on the PCA and neighbor-joining tree PCs (Figure 3c,d), the two subpopulations, indica and japonica, were clearly differentiated. Temperate japonica and tropical japonica were distinguished but closely related together. Aus was distinguished from indica and japonica but closed related with indica. The decay of LD along physical distance was computed for the full panel of rice accessions. The value of r2 declined with the increase in physical distance. The threshold value for candidate regions was determined as half of the maximal r2 value (0.26), which produced a candidate genomic region of 250 kb (Supplementary Figure S1).

3.3. GWAS of Cold Stress Tolerance in Rice Seedlings

Manhattan plots of SNP markers significantly associated with cold tolerance at the seedling stage are presented in Figure 4. SNPs with −log10(P) score of 6 were considered to be significantly associated with cold tolerance (refer to Materials and Methods). Four significant association QTLs were detected (Table 1): qCTS1 (chromosome 1; −log10(P) score = 6.64; explaining 17.5% of the total phenotypic variation), qCTS4 (chromosome 4; −log10(P) score = 6.35; 16.5% of the total phenotypic variation), qCTS5-1 (chromosome 5; −log10(P) score = 6.40; 16.7% of the total phenotypic variation), and qCTS5-2 (chromosome 5; −log10(P) score = 6.97; 18.5% of the total phenotypic variation). Genomic segments corresponding to these four QTLs were defined according to the LD block size surrounding the lead SNP; for each lead SNP, a 500 kb region surrounding the marker (250 kb flanking the lead SNP on either side) was determined. Next, we compared the genomic region of the four QTLs with previously reported QTLs (Table 1). The results showed that the qCTS4 QTL on chromosome 4 overlapped with QTL CQAA8 associated with cold tolerance at the seedling stage [42]. Interestingly, qCTS5-1 overlapped with QTL AQFR028 reported for seedling vigor [43]. Similarly, the AQAL060 QTL reported for root thickness [44] and CQE39 QTL reported for rubisco content [45] overlapped with qCTS1 on chromosome 1 and qCTS5-2 on chromosome 5, respectively.

3.4. Haplotype Analysis to Identify Candidate Genes Underlying Cold Tolerance

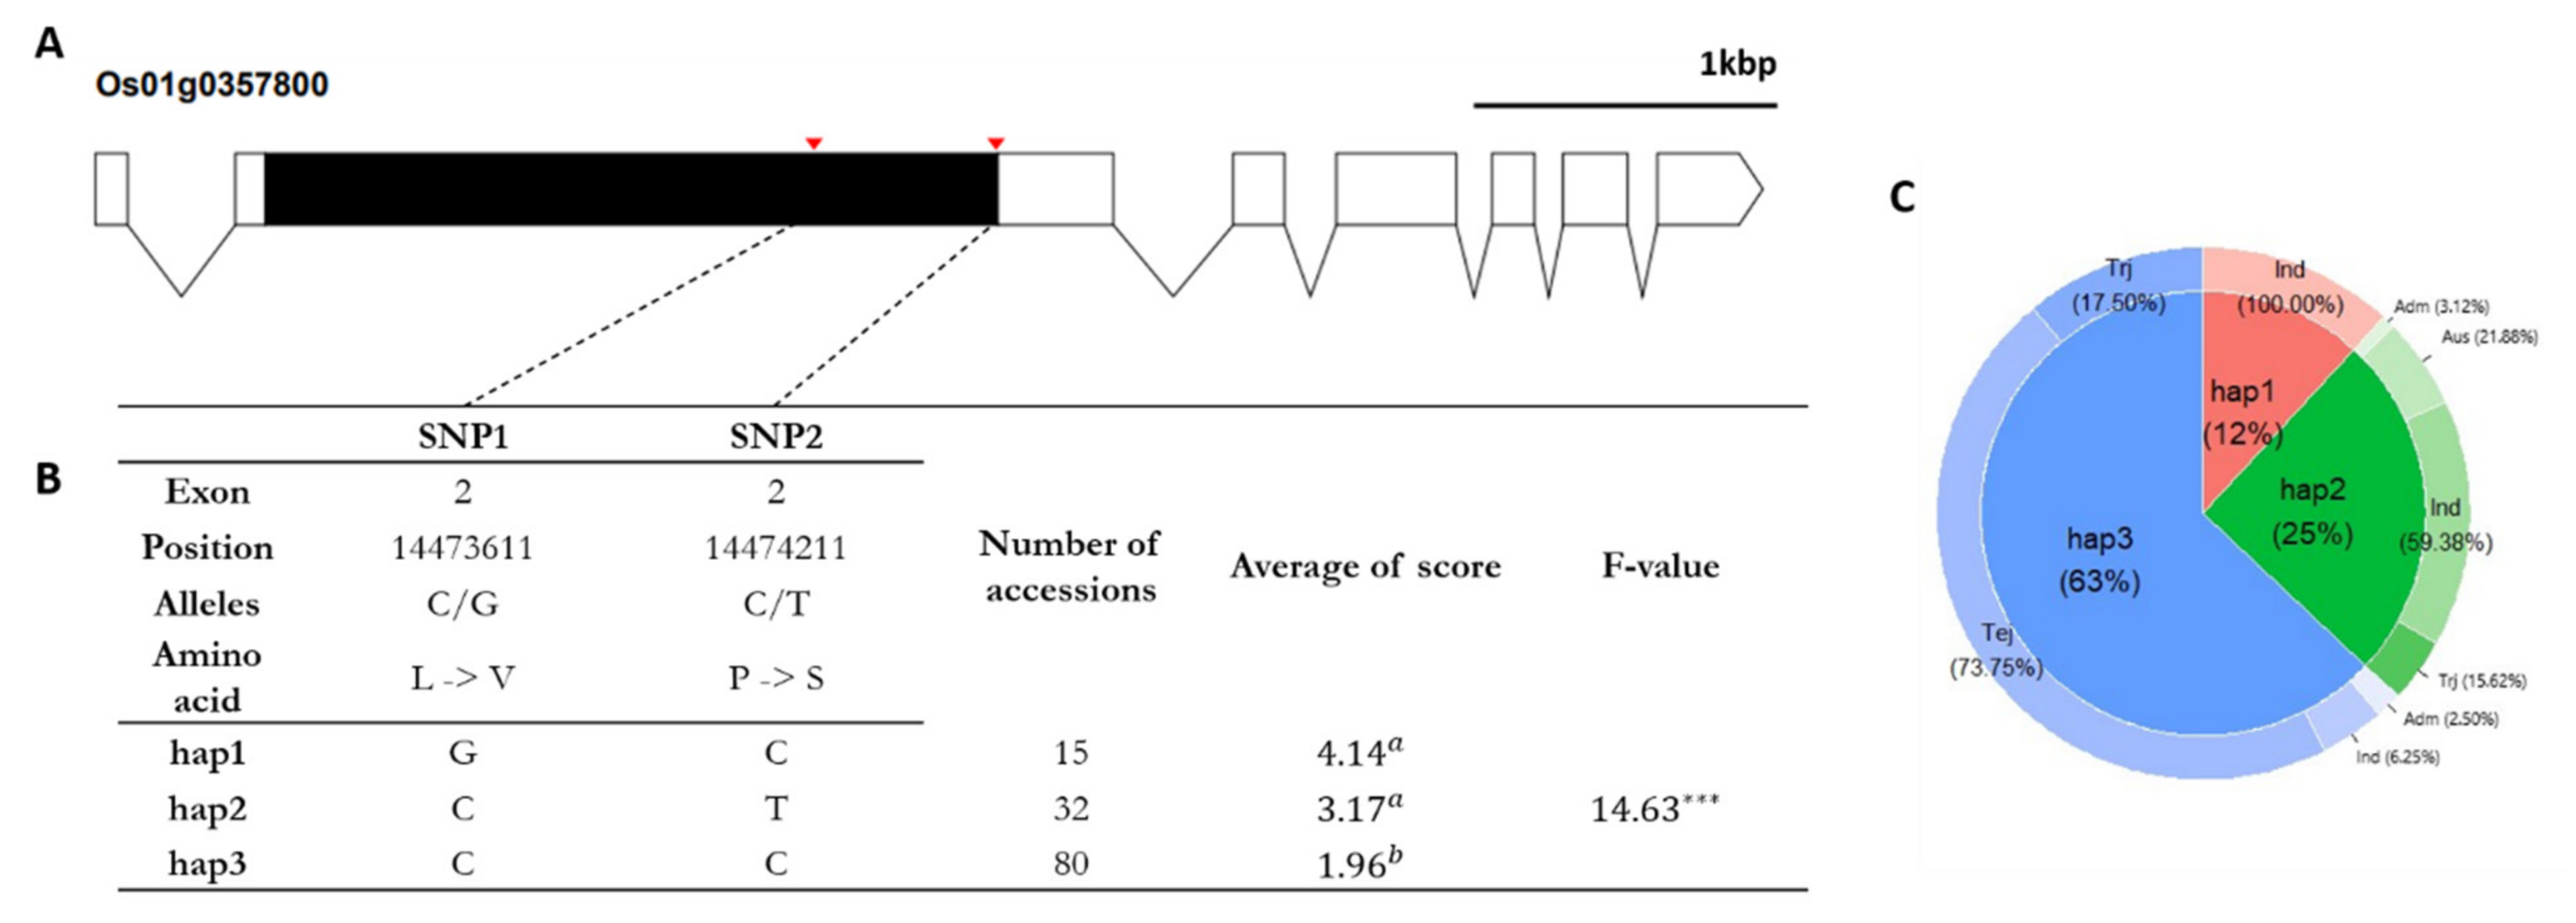
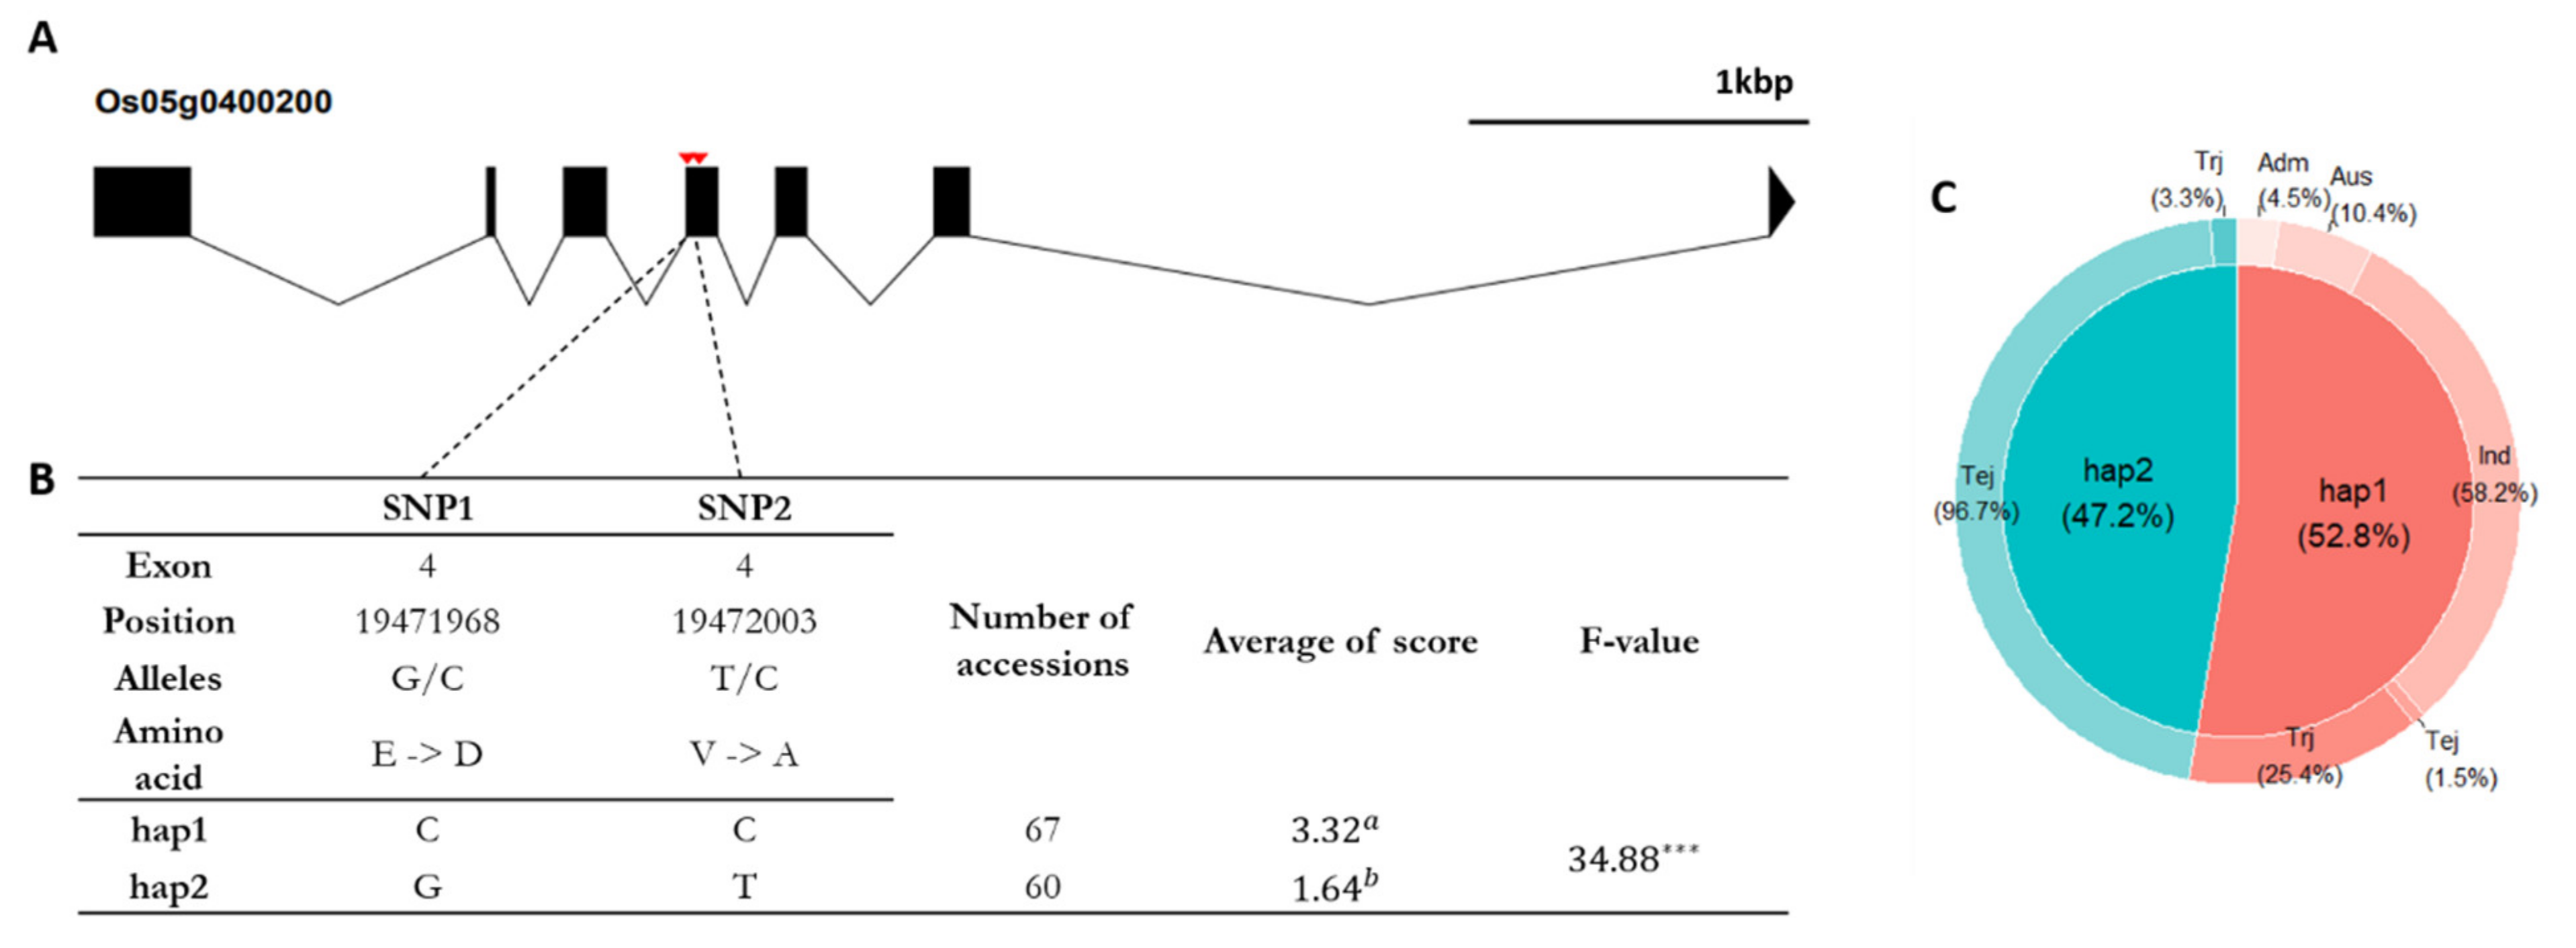
To identify candidate genes responsible for cold tolerance, all genes within the 500 kb region encompassing the lead SNP were extracted and annotated. At the qCTS1 QTL, 57 genes were identified in the rice annotation project database (RAP-DB) (IRGSP 1.0). After removing nonprotein-coding and hypothetical genes from this gene set, 38 genes were retained. Using this approach, we identified 12, 40, and 50 candidate genes at qCTS4, qCTS5-1, and qCTS5-2 QTLs, respectively. These candidate genes (140 total) were then subjected to haplotype analysis. The phenotypic comparison was conducted among haplotypes containing at least five rice accessions. Finally, a total of five candidate genes showing statistically significant differences among the haplotypes were detected (Supplementary Figure S2). Based on the phenotypic differences among haplotypes and functional annotation of genes, we selected three candidate genes for further analysis. Haplotype analyses of these three candidate genes are presented in Figure 5, Figure 6 and Figure 7 and Supplementary Figure S3. Heterozygous SNPs and SNPs with missing data were not included in the analysis. SNPs in exons were used for haplotype and haplotype variation analysis. Os01g0357800 (PPR domain-containing protein) contained two non-synonymous SNPs (C→G, Chr1_14473611, L→V substitution; C→T, Chr1_14474211, P→S substitution) that formed three haplotypes (Hap1, Hap2, and Hap3) (Figure 7b). The cold-tolerance score of Hap3 differed significantly from that of Hap1 and Hap2. The Hap1 of Os01g0357800 was the superior genotype in indica rice (Figure 5c). Os05g0171300 (similar to plastidial ADP-glucose transporter) contained two non-synonymous SNPs (G→A, Chr5_4267411, A→T substitution; G→C, Chr5_4267425, Q→H substitution) in exons, which formed two haplotypes (Hap1 and Hap2) (Figure 6). The mean cold-tolerance score of hap1 (4.62, 7 accessions) was higher than that of hap2 (2.40, 120 accessions). Os05g0400200 (similar to retrotransposon protein Ty1-copia subclass) contained three SNPs in exons (Figure 5a). Among these SNPs, two were non-synonymous SNPs and were located in the coding region (G→C, Chr5_19471968, E→D substitution; T→C, Chr5_19472003, V→A substitution) located in the dienelactone hydrolase family domain. These two SNPs formed two haplotypes (Hap1 and Hap2) (Figure 5b), which showed significantly different cold-tolerance scores; the mean cold-tolerance score of Hap1 (3.32, 67 accessions) was higher than that of Hap2 (1.64, 60 accessions).

4. Discussion

In general, cold tolerance in rice is evaluated under natural conditions, where rice cultivated in the field is evaluated for yield loss. However, this method is subject to variability in environmental conditions, such as the degree of cold temperature and fluctuations in temperature over time [48]. In this study, the cold tolerance of rice seedlings was evaluated in a growth chamber where the temperature was constantly controlled, unlike the field evaluation. After cold treatment at 12 °C and 70% RH for 7 days and then at 10 °C and 70% RH for 5 days, rice seedlings were allowed to recover in the greenhouse for 2 days. Therefore, the cold-tolerance score represents not only the cold sensitivity of the rice accession but also its ability to recover from the cold-induced damage. The overall distribution of the cold-tolerance score was skewed to the left (low score) on the 0–9 scale, which was possibly due to the additional recovering cultivation after cold treatment. In addition to the 127 rice accessions in the panel, we included the cold-sensitive variety IR38 as a check genotype. The cold-tolerance score of “IR38” was 8.7, indicating that the cold treatment was effective.
Comparative analysis of the physical/genetic positions of the QTLs identified in the current study and previously reported QTLs [49] revealed that the qCTS4 QTL overlapped with the CQAA8 QTL, which is associated with cold tolerance in rice seedlings and was identified in a recombinant inbred line [50] population derived from a cross between M202 (temperate japonica) and IR50 (indica) [42]. Although parameters, such as temperature, duration, and humidity, were not identical between the current study and the cold treatment and evaluation methods were similar between the two studies. The qCTS5-1 QTL overlapped with the AQFR028 QTL associated with rice seedling vigor, which was identified in a RIL population derived from a cross between Lemont (japonica) and “Teqing” (indica) [43]. Seedling vigor was evaluated based on the germination rate, root length, shoot length, and dry weight. Thus, the seedling vigor-related traits evaluated in this QTL study are regarded as cold-tolerance traits, based on the fact of evaluating the performance under low temperature. The qCTS1 QTL overlapped with the root thickness-associated AQAL060 QTL [44], which was identified in a RIL population derived from the lowland indica rice, IR58821 and IR52561. Although there is no direct evidence supporting the relationship between root development and cold tolerance in rice seedlings, further experiments evaluating the possible role of root development in cold tolerance are worthwhile. Additionally, the CQE39 QTL associated with rubisco to chlorophyll ratio overlapped with the qCTS5-2 QTL identified in this study [45].
According to the results of our GWAS, 140 candidate genes were identified in the LD blocks of the detected QTLs. Based on the results of functional annotation and haplotype analysis, we focused on three candidate genes (Os01g0357800, Os05g0400200, and Os05g0171300) in this study. According to the haplotype analysis for the three candidate genes, RWG-107- one of the tolerant accessions showing a tolerant score as 0- contains a cold-tolerant haplotype for three candidate genes. RWG-107 is a Korean landrace and temperate japonica rice. Thus RWG-107 is suggested as a donor plant for cold-tolerant breeding programs in Korea. To analyze the transcript levels of the three candidate genes under various conditions, we used the transcriptome encyclopedia of rice (TENOR) database (http://tenor.dna.affrc.go.jp/, accessed on 3 April 2021) [51]. Os01g0357800 is predicted to encode an r-domain-containing protein. PPR proteins are involved in a wide range of organelle RNA processing activities [52]. Increasing molecular evidence shows that PPRs play important roles in various biotic and abiotic stresses, such as photo-oxidative stress responses, in Arabidopsis [53], gene expression regulation in response to wounding stress and pathogen infection [54,55], and the negative regulation of drought stress and abscisic acid (ABA) signaling genes [56]. According to the TENOR web search, the expression levels of Os01g0357800 were increased under cold and flooding stress (Supplementary Figure S4). Considering the previously reported function of PPRs and the expression of Os01g0357800 under cold stress, further investigation is needed to confirm its role in cold tolerance. Os05g0400200 is described as similar to retrotransposon protein Ty1-copia subclass. Transposable elements (TEs) are known for DNA sources, causing insertion-mediated gene dysfunction. Retrotransposons, as a class of TEs, can generate stable mutations when inserted within or near a gene [57]. Previous reports show the activation of a retrotransposon under the influence of environmental factors, such as cold, pathogen infection, microbial elicitors, tissue culture, protoplast production, and wounding [58,59], suggesting the possible role of retrotransposons in the environmental adaptation of an organism [59]. According to the TENOR web search, Os05g0400200 is expressed under various environmental treatments; however, its expression level under stress conditions is not significantly different from that under control conditions (Supplementary Figure S4). Os05g0171300 is described as similar to plastidial ADP-glucose transporter. ADP-glucose transporter is involved in starch biosynthesis and compound granule formation in the rice endosperm [60]. Starch is regarded as an important key molecule in mediating plant responses to abiotic stresses, such as water deficit, high salinity or extreme temperatures [61]. Under the unfavorite environmental conditions, plants generally remobilize starch to provide energy to compensate for reduced photosynthesis. The released sugars and other derived metabolites support plant growth under stress and function as osmoprotectants and compatible solutes to mitigate the negative effect of the stress [62]. Sugars are known to act as signaling molecules, which crosstalk with the ABA-dependent signaling pathway to activate downstream components in the stress response cascade [63]. In addition to the association of starch metabolism with abiotic stress, according to TENOR web search results that the expression of Os05g0171300 is increased under high cadmium stress (Supplementary Figure S4), suggests the possible role in cold tolerance.

5. Conclusions

In this study, we evaluated the cold-tolerance levels of a collection of 127 diverse rice accessions. Four cold-tolerance-associated QTLs were identified by GWAS. Haplotype analysis and phenotypic comparison revealed three candidate genes affecting cold tolerance at the seedling stage. RWG-107, a Korean landrace and temperate japonica rice, is suggested as a donor plant for a cold-tolerant breeding program in Korea. Further evaluation of these candidate genes in the future will provide strategies for developing cold-tolerant, elite rice varieties.

Supplementary Materials

The following are available online at https://www.mdpi.com/article/10.3390/agriculture11040318/s1, Table S1: The list of rice accessions and cold tolerance scoring, Figure S1: LD decay analysis; Figure S2: Haplotype analysis of Os05g0397700, Os05g0401000. (A) Gene structure and SNP positions of Os05g0397700; (B) Gene structure and SNP positions of Os05g0401000; Figure S3: The location of detected QTLs and the candidate genes; Figure S4: Expression profiles in rice seedling under the various environmental conditions.

Author Contributions

Conceptualization, T.-H.H.; data curation, Y.K., Y.L. and J.C.; formal analysis, Y.K., Y.L. and J.C.; funding acquisition, Y.L.; investigation, T.-H.H., Y.K. and J.C.; methodology, Y.K. and Y.L.; project administration, J.L.; resources, Y.L.; software, Y.K.; supervision, T.-H.H. and J.L.; validation, T.-H.H., Y.L. and J.L.; visualization, T.-H.H. and Y.K.; writing—original draft, T.-H.H.; writing—review and editing, T.-H.H. and J.L. All authors have read and agreed to the published version of the manuscript.

Funding

This work was supported by the National Research Foundation of Korea (NRF) grant funded by the Korean government (MSIT) (No. NRF-2016R1D1A1B01011426).

Institutional Review Board Statement

Not applicable.

Informed Consent Statement

Not applicable.

Conflicts of Interest

The authors declare no conflict of interest.

References

  1. Almansouri, M.; Kinet, J.M.; Lutts, S. Effect of salt and osmotic stresses on germination in durum wheat (triticum durum desf.). Plant Soil 2001, 231, 243–254. [Google Scholar] [CrossRef]
  2. Nakagahra, M.; Okuno, K.; Vaughan, D. Rice genetic resources: History, conservation, investigative characterization and use in japan. Plant Mol. Biol. 1997, 35, 69–77. [Google Scholar] [CrossRef]
  3. Jiang, L.; Liu, S.J.; Hou, M.Y.; Tang, J.Y.; Chen, L.M.; Zhai, H.Q.; Wan, J.M. Analysis of qtls for seed low temperature germinability and anoxia germinability in rice (Oryza sativa L.). Field Crop. Res. 2006, 98, 68–75. [Google Scholar] [CrossRef]
  4. Suh, J.P.; Jeung, J.U.; Lee, J.I.; Choi, Y.H.; Yea, J.D.; Virk, P.S.; Mackill, D.J.; Jena, K.K. Identification and analysis of qtls controlling cold tolerance at the reproductive stage and validation of effective qtls in cold-tolerant genotypes of rice (Oryza sativa L.). Theor. Appl. Genet. 2010, 120, 985–995. [Google Scholar] [CrossRef]
  5. Pan, Y.; Zhang, H.; Zhang, D.; Li, J.; Xiong, H.; Yu, J.; Li, J.; Rashid, M.A.R.; Li, G.; Ma, X.; et al. Genetic analysis of cold tolerance at the germination and booting stages in rice by association mapping. PLoS ONE 2015, 10, e0120590. [Google Scholar] [CrossRef] [Green Version]
  6. Zhao, X.Q.; Wang, W.S.; Zhang, F.; Zhang, T.; Zhao, W.; Fu, B.Y.; Li, Z.K. Temporal profiling of primary metabolites under chilling stress and its association with seedling chilling tolerance of rice (Oryza sativa L.). Rice 2013, 6, 1–13. [Google Scholar] [CrossRef] [PubMed] [Green Version]
  7. Mao, D.H.; Yu, L.; Chen, D.Z.; Li, L.Y.; Zhu, Y.X.; Xiao, Y.Q.; Zhang, D.C.; Chen, C.Y. Multiple cold resistance loci confer the high cold tolerance adaptation of dongxiang wild rice (Oryza rufipogon) to its high-latitude habitat. Theor. Appl. Genet. 2015, 128, 1359–1371. [Google Scholar] [CrossRef]
  8. Ranawake, A.L.; Manangkil, O.E.; Yoshida, S.; Ishii, T.; Mori, N.; Nakamura, C. Mapping qtls for cold tolerance at germination and the early seedling stage in rice (Oryza sativa L.). Biotechnol. Biotec. Eq. 2014, 28, 989–998. [Google Scholar] [CrossRef] [PubMed]
  9. Yang, Z.M.; Huang, D.Q.; Tang, W.Q.; Zheng, Y.; Liang, K.J.; Cutler, A.J.; Wu, W.R. Mapping of quantitative trait loci underlying cold tolerance in rice seedlings via high-throughput sequencing of pooled extremes. PLoS ONE 2013, 8, e68433. [Google Scholar] [CrossRef] [PubMed] [Green Version]
  10. Zhu, Y.J.; Chen, K.; Mi, X.F.; Chen, T.X.; Ali, J.; Ye, G.Y.; Xu, J.L.; Li, Z.K. Identification and fine mapping of a stably expressed qtl for cold tolerance at the booting stage using an interconnected breeding population in rice. PLoS ONE 2015, 10, e0145704. [Google Scholar] [CrossRef] [PubMed]
  11. Xiao, N.; Huang, W.N.; Zhang, X.X.; Gao, Y.; Li, A.H.; Dai, Y.; Yu, L.; Liu, G.Q.; Pan, C.H.; Li, Y.H.; et al. Fine mapping of qrc10-2, a quantitative trait locus for cold tolerance of rice roots at seedling and mature stages. PLoS ONE 2014, 9, e96046. [Google Scholar] [CrossRef] [PubMed] [Green Version]
  12. Cruz, R.P.d.; Milach, S.C.K. Cold tolerance at the germination stage of rice: Methods of evaluation and characterization of genotypes. Sci. Agric. 2004, 61, 1–8. [Google Scholar] [CrossRef] [Green Version]
  13. Zhang, Q.; Chen, Q.H.; Wang, S.L.; Hong, Y.H.; Wang, Z.L. Rice and cold stress: Methods for its evaluation and summary of cold tolerance-related quantitative trait loci. Rice 2014, 7, 24. [Google Scholar] [CrossRef] [PubMed] [Green Version]
  14. Zhang, F.; Ma, X.F.; Gao, Y.M.; Hao, X.B.; Li, Z.K. Genome-wide response to selection and genetic basis of cold tolerance in rice (Oryza sativa l.). BMC Genet. 2014, 15, 55. [Google Scholar] [CrossRef] [PubMed] [Green Version]
  15. Fujino, K.; Sekiguchi, H.; Matsuda, Y.; Sugimoto, K.; Ono, K.; Yano, M. Molecular identification of a major quantitative trait locus, qltg3-1, controlling low-temperature germinability in rice. Proc. Natl. Acad. Sci. USA 2008, 105, 12623–12628. [Google Scholar] [CrossRef] [Green Version]
  16. Ma, Y.; Dai, X.; Xu, Y.; Luo, W.; Zheng, X.; Zeng, D.; Pan, Y.; Lin, X.; Liu, H.; Zhang, D.; et al. Cold1 confers chilling tolerance in rice. Cell 2015, 160, 1209–1221. [Google Scholar] [CrossRef] [Green Version]
  17. Fujino, K.; Obara, M.; Shimizu, T.; Koyanagi, K.O.; Ikegaya, T. Genome-wide association mapping focusing on a rice population derived from rice breeding programs in a region. Breeding Sci. 2015, 65, 403–410. [Google Scholar] [CrossRef] [Green Version]
  18. Sales, E.; Viruel, J.; Domingo, C.; Marques, L. Genome wide association analysis of cold tolerance at germination in temperate japonica rice (Oryza sativa L.) varieties. PLoS ONE 2017, 12, e0183416. [Google Scholar] [CrossRef] [PubMed] [Green Version]
  19. Shakiba, E.; Edwards, J.D.; Jodari, F.; Duke, S.E.; Baldo, A.M.; Korniliev, P.; McCouch, S.R.; Eizenga, G.C. Genetic architecture of cold tolerance in rice (Oryza sativa) determined through high resolution genome-wide analysis. PLoS ONE 2017, 12, e0172133. [Google Scholar] [CrossRef] [PubMed]
  20. de Freitas, G.M.; Thomas, J.; Liyanage, R.; Lay, J.O.; Basu, S.; Ramegowda, V.; do Amaral, M.N.; Benitez, L.C.; Bolacel Braga, E.J.; Pereira, A. Cold tolerance response mechanisms revealed through comparative analysis of gene and protein expression in multiple rice genotypes. PLoS ONE 2019, 14, e0218019. [Google Scholar]
  21. Yadav, S.K. Cold stress tolerance mechanisms in plants. A review. Agron Sustain. Dev. 2010, 30, 515–527. [Google Scholar] [CrossRef] [Green Version]
  22. Welti, R.; Li, W.; Li, M.; Sang, Y.; Biesiada, H.; Zhou, H.E.; Rajashekar, C.B.; Williams, T.D.; Wang, X. Profiling membrane lipids in plant stress responses. Role of phospholipase d alpha in freezing-induced lipid changes in arabidopsis. J. Biol. Chem. 2002, 277, 31994–32002. [Google Scholar] [CrossRef] [PubMed] [Green Version]
  23. Shinozaki, K.; Yamaguchi-Shinozaki, K.; Seki, M. Regulatory network of gene expression in the drought and cold stress responses. Curr. Opin. Plant. Biol. 2003, 6, 410–417. [Google Scholar] [CrossRef]
  24. Maruyama, K.; Sakuma, Y.; Kasuga, M.; Ito, Y.; Seki, M.; Goda, H.; Shimada, Y.; Yoshida, S.; Shinozaki, K.; Yamaguchi-Shinozaki, K. Identification of cold-inducible downstream genes of the arabidopsis dreb1a/cbf3 transcriptional factor using two microarray systems. Plant. J. 2004, 38, 982–993. [Google Scholar] [CrossRef] [PubMed]
  25. Zhang, Z.; Li, J.; Pan, Y.; Li, J.; Zhou, L.; Shi, H.; Zeng, Y.; Guo, H.; Yang, S.; Zheng, W.; et al. Natural variation in ctb4a enhances rice adaptation to cold habitats. Nat. Commun. 2017, 8, 14788. [Google Scholar] [CrossRef] [Green Version]
  26. Dai, L.Y.C.; Yu, T.; Xu, F. Studies on cold tolerance of rice, Oryza sativa L. I. Description on types of cold injury and classifications of evaluation methods on cold tolerance in rice. Southwest China J. Agrc. Sci. 2002, 15, 5. [Google Scholar]
  27. Zhao, W.G.; Cho, G.T.; Ma, K.H.; Chung, J.W.; Gwag, J.G.; Park, Y.J. Development of an allele-mining set in rice using a heuristic algorithm and ssr genotype data with least redundancy for the post-genomic era. Mol. Breed. 2010, 26, 639–651. [Google Scholar] [CrossRef]
  28. Kim, K.W.; Chung, H.K.; Cho, G.T.; Ma, K.H.; Chandrabalan, D.; Gwag, J.G.; Kim, T.S.; Cho, E.G.; Park, Y.J. Powercore: A program applying the advanced m strategy with a heuristic search for establishing core sets. Bioinformatics 2007, 23, 2155–2162. [Google Scholar] [CrossRef] [PubMed] [Green Version]
  29. Kim, T.S.; He, Q.; Kim, K.W.; Yoon, M.Y.; Ra, W.H.; Li, F.P.; Tong, W.; Yu, J.; Oo, W.H.; Choi, B.; et al. Genome-wide resequencing of krice_core reveals their potential for future breeding, as well as functional and evolutionary studies in the post-genomic era. BMC Genom. 2016, 17, 408. [Google Scholar] [CrossRef] [Green Version]
  30. Kim, J.; Zhang, Y.W.; Pan, W. Powerful and adaptive testing for multi-trait and multi-snp associations with gwas and sequencing data. Genet. Epidemiol. 2016, 40, 646. [Google Scholar] [CrossRef] [Green Version]
  31. Purcell, S.; Neale, B.; Todd-Brown, K.; Thomas, L.; Ferreira, M.A.; Bender, D.; Maller, J.; Sklar, P.; de Bakker, P.I.; Daly, M.J.; et al. Plink: A tool set for whole-genome association and population-based linkage analyses. Am. J. Hum. Genet. 2007, 81, 559–575. [Google Scholar] [CrossRef] [PubMed] [Green Version]
  32. Rhodes, L.; Harper, J.; Uno, H.; Gaito, G.; Audette-Arruda, J.; Kurata, S.; Berman, C.; Primka, R.; Pikounis, B. The effects of finasteride (proscar) on hair growth, hair cycle stage, and serum testosterone and dihydrotestosterone in adult male and female stumptail macaques (macaca arctoides). J. Clin. Endocrinol. Metab. 1994, 79, 991–996. [Google Scholar] [PubMed]
  33. IRRI. Standard Evaluation System(ses), 5th ed.; IRRI: Laguna, Philippines, 2013; p. 35. [Google Scholar]
  34. Alexander, D.H.; Lange, K. Enhancements to the admixture algorithm for individual ancestry estimation. BMC Bioinform. 2011, 12, 246. [Google Scholar] [CrossRef] [PubMed] [Green Version]
  35. Francis, R.M. Pophelper: An r package and web app to analyse and visualize population structure. Mol. Ecol. Resour. 2017, 17, 27–32. [Google Scholar] [CrossRef] [PubMed] [Green Version]
  36. Kumar, S.; Stecher, G.; Li, M.; Knyaz, C.; Tamura, K. Mega x: Molecular evolutionary genetics analysis across computing platforms. Mol. Biol. Evol. 2018, 35, 1547–1549. [Google Scholar] [CrossRef] [PubMed]
  37. Letunic, I.; Bork, P. Interactive tree of life (itol) v4: Recent updates and new developments. Nucleic Acids Res. 2019, 47, W256–W259. [Google Scholar] [CrossRef] [Green Version]
  38. Zhang, C.; Dong, S.-S.; Xu, J.-Y.; He, W.-M.; Yang, T.-L. Poplddecay: A fast and effective tool for linkage disequilibrium decay analysis based on variant call format files. Bioinformatics 2019, 35, 1786–1788. [Google Scholar] [CrossRef]
  39. Kang, H.M.; Zaitlen, N.A.; Wade, C.M.; Kirby, A.; Heckerman, D.; Daly, M.J.; Eskin, E. Efficient control of population structure in model organism association mapping. Genetics 2008, 178, 1709–1723. [Google Scholar] [CrossRef] [Green Version]
  40. Yang, W.; Guo, Z.; Huang, C.; Duan, L.; Chen, G.; Jiang, N.; Fang, W.; Feng, H.; Xie, W.; Lian, X. Combining high-throughput phenotyping and genome-wide association studies to reveal natural genetic variation in rice. Nat. Commun. 2014, 5, 5087. [Google Scholar] [CrossRef]
  41. Karmanova, I.G.; Aristakesian, E.A.; Shilling, N.V. Neurophysiologic analysis of hypothalamic mechanisms of primary sleep and hypobiosis. Dokl. Akad. Nauk SSSR 1987, 294, 245–248. [Google Scholar]
  42. Andaya, V.C.; Tai, T.H. Fine mapping of the qcts4 locus associated with seedling cold tolerance in rice (Oryza sativa L.). Mol. Breed. 2007, 20, 349–358. [Google Scholar] [CrossRef]
  43. Zhang, Z.H.; Qu, X.S.; Wan, S.; Chen, L.H.; Zhu, Y.G. Comparison of qtl controlling seedling vigour under different temperature conditions using recombinant inbred lines in rice (Oryza sativa). Ann. Bot. 2005, 95, 423–429. [Google Scholar] [CrossRef] [PubMed] [Green Version]
  44. Kamoshita, A.; Wade, J.; Ali, L.; Pathan, S.; Zhang, J.; Sarkarung, S.; Nguyen, T. Mapping qtls for root morphology of a rice population adapted to rainfed lowland conditions. Theor. Appl. Genet. 2002, 104, 880–893. [Google Scholar] [CrossRef] [PubMed]
  45. Ishimaru, K.; Kobayashi, N.; Ono, K.; Yano, M.; Ohsugi, R. Are contents of rubisco, soluble protein and nitrogen in flag leaves of rice controlled by the same genetics? J. Exp. Bot. 2001, 52, 1827–1833. [Google Scholar] [CrossRef] [PubMed] [Green Version]
  46. Ming, F.; Zheng, X.; Mi, G.; Zhu, L.; Zhang, F. Detection and verification of quantitative trait loci affecting tolerance to low phosphorus in rice. J. Plant Nutr. 2001, 24, 1399–1408. [Google Scholar]
  47. Huang, Z.; Yu, T.; Su, L.; Yu, S.B.; Zhang, Z.H.; Zhu, Y.G. Identification of chromosome regions associated with seedling vigor in rice. Acta Genet. Sin. 2004, 31, 596–603. [Google Scholar]
  48. Mackill, D.J.; Lei, X. Genetic variation for traits related to temperate adaptation of rice cultivars. Crop. Sci. 1997, 37, 1340–1346. [Google Scholar] [CrossRef]
  49. Ni, J.; Pujar, A.; Youens-Clark, K.; Yap, I.; Jaiswal, P.; Tecle, I.; Tung, C.-W.; Ren, L.; Spooner, W.; Wei, X. Gramene qtl database: Development, content and applications. Database 2009, 2009, bap005. [Google Scholar] [CrossRef]
  50. Morin, E.; Kohler, A.; Baker, A.R.; Foulongne-Oriol, M.; Lombard, V.; Nagy, L.G.; Ohm, R.A.; Patyshakuliyeva, A.; Brun, A.; Aerts, A.L.; et al. Genome sequence of the button mushroom agaricus bisporus reveals mechanisms governing adaptation to a humic-rich ecological niche. Proc. Natl. Acad. Sci. USA 2012, 109, 17501–17506. [Google Scholar] [CrossRef] [Green Version]
  51. Kawahara, Y.; Oono, Y.; Wakimoto, H.; Ogata, J.; Kanamori, H.; Sasaki, H.; Mori, S.; Matsumoto, T.; Itoh, T. Tenor: Database for comprehensive mrna-seq experiments in rice. Plant. Cell Physiol. 2016, 57, e7. [Google Scholar] [CrossRef] [Green Version]
  52. Xing, H.; Fu, X.; Yang, C.; Tang, X.; Guo, L.; Li, C.; Xu, C.; Luo, K. Genome-wide investigation of pentatricopeptide repeat gene family in poplar and their expression analysis in response to biotic and abiotic stresses. Sci. Rep. 2018, 8, 2817. [Google Scholar]
  53. Koussevitzky, S.; Nott, A.; Mockler, T.C.; Hong, F.; Sachetto-Martins, G.; Surpin, M.; Lim, J.; Mittler, R.; Chory, J. Signals from chloroplasts converge to regulate nuclear gene expression. Science 2007, 316, 715–719. [Google Scholar]
  54. Kobayashi, K.; Suzuki, M.; Tang, J.; Nagata, N.; Ohyama, K.; Seki, H.; Kiuchi, R.; Kaneko, Y.; Nakazawa, M.; Matsui, M. Lovastatin insensitive 1, a novel pentatricopeptide repeat protein, is a potential regulatory factor of isoprenoid biosynthesis in arabidopsis. Plant. Cell Physiol. 2007, 48, 322–331. [Google Scholar] [CrossRef] [PubMed] [Green Version]
  55. Tang, J.; Kobayashi, K.; Suzuki, M.; Matsumoto, S.; Muranaka, T. The mitochondrial ppr protein lovastatin insensitive 1 plays regulatory roles in cytosolic and plastidial isoprenoid biosynthesis through rna editing. Plant. J. 2010, 61, 456–466. [Google Scholar] [CrossRef] [PubMed]
  56. Yuan, H.; Liu, D. Functional disruption of the pentatricopeptide protein slg1 affects mitochondrial rna editing, plant development, and responses to abiotic stresses in arabidopsis. Plant. J. 2012, 70, 432–444. [Google Scholar] [CrossRef] [PubMed]
  57. Kumar, A.; Bennetzen, J.L. Plant retrotransposons. Annu. Rev. Genet. 1999, 33, 479–532. [Google Scholar] [CrossRef] [PubMed] [Green Version]
  58. Takeda, S.; Sugimoto, K.; Otsuki, H.; Hirochika, H. A 13-bp cis-regulatory element in the ltr promoter of the tobacco retrotransposon tto1 is involved in responsiveness to tissue culture, wounding, methyl jasmonate and fungal elicitors. Plant. J. 1999, 18, 383–393. [Google Scholar] [CrossRef]
  59. Kanazawa, A.; Liu, B.; Kong, F.; Arase, S.; Abe, J. Adaptive evolution involving gene duplication and insertion of a novel ty1/copia-like retrotransposon in soybean. J. Mol. Evol. 2009, 69, 164–175. [Google Scholar] [CrossRef]
  60. Li, S.; Wei, X.; Ren, Y.; Qiu, J.; Jiao, G.; Guo, X.; Tang, S.; Wan, J.; Hu, P. Osbt1 encodes an adp-glucose transporter involved in starch synthesis and compound granule formation in rice endosperm. Sci. Rep. 2017, 7, 40124. [Google Scholar] [CrossRef] [Green Version]
  61. Thalmann, M.; Santelia, D. Starch as a determinant of plant fitness under abiotic stress. New Phytol. 2017, 214, 943–951. [Google Scholar] [CrossRef] [Green Version]
  62. Krasensky, J.; Jonak, C. Drought, salt, and temperature stress-induced metabolic rearrangements and regulatory networks. J. Exp. Bot. 2012, 63, 1593–1608. [Google Scholar] [CrossRef] [Green Version]
  63. Rook, F.; Hadingham, S.A.; Li, Y.; Bevan, M.W. Sugar and aba response pathways and the control of gene expression. Plant. Cell Environ. 2006, 29, 426–434. [Google Scholar] [CrossRef]
Figure 1. Representation of cold-tolerant score stress at the seedling stage. 0: resistance ~9: highly sensitive. 0–1: no damage to leaves, normal leaf color (strongly tolerant), 2–3: the tip of leaves slightly dried, folded and light green (tolerant), 4–5 some seedlings moderately folded and wilted, pale green to yellowish leaves (moderately tolerant), 6–7 seedlings severely rolled and dried, reddish-brown leaves (sensitive), 8–9: most seedlings dead and dying (highly sensitive).
Agriculture 11 00318 g001
Figure 2. The distribution of cold-tolerant score for the 127 rice accessions. (A) Boxplot of cold-tolerant score grouped by their ecotype. Blue—temperate japonica; yellow—tropical japonica; gray—indica; orange—aus; green—admixture; *—right shoulder; letters a and b represent different levels of statistical Duncan’s test at ą = 0.05: (B) histogram of the cold-tolerant score. The dotted line is the moving average. Different colors indicate the cold-tolerant score: blue—0 orange—1, gray—2, yellow—3, sky blue—4, green—5, dark blue—6, brown—7, dark gray—8, gold—9.
Agriculture 11 00318 g002
Figure 3. Population structure analysis for 127 rice accessions. (A) Cross-validation (CV) error score of each K value. The blue line represents the lowest level. (B) Structure analysis results with K = 5. (C) Plot for principal component analysis (PCA). Red, yellow, green, blue and pink indicate admixture, aus, indica, temperate japonica and tropical japonica rice, respectively. (D) Neighbor-joining tree (NJ tree) of the rice accessions. The color represents the same as that used in PCA analysis.
Agriculture 11 00318 g003
Figure 4. Manhattan plots for the cold-tolerant scores of 127 rice accessions. It indicated the log 10   P value on the y-axis and the single-nucleotide polymorphism (SNP) position of each chromosome on the x-axis. The horizontal blue line indicated thresholds ( log 10   P = 6.00).
Agriculture 11 00318 g004
Figure 5. Haplotype analysis result of Os01g0357800. (A) Gene structure and SNPs positions on Os01g0357800. The black box and line indicated exons and introns, respectively. Red marks indicated SNPs. (B) Significant haplotypes by ANOVA test at *** p < 0.001. Letters a and b represent different levels of Duncan’s test. (C) The percentage of each species in each haplotype: abbreviations Adm, Ind, Trj and Tej mean admixture, indica, tropical japonica and temperate japonica, respectively.
Agriculture 11 00318 g005
Figure 6. Haplotype analysis result of Os05g0171300. (A) Gene structure and SNPs positions on Os05g0171300. Black–box and line indicated exons and introns, respectively. Red marks indicated SNPs. (B) Significant haplotypes by ANOVA test at ** p < 0.01. Letters a and b represent different levels of Duncan’s test. (C) The percentage of each species in each haplotype: abbreviations Adm, Ind, Trj and Tej mean admixture, indica, tropical japonica and temperate japonica, respectively.
Agriculture 11 00318 g006
Figure 7. Haplotype analysis result of Os05g0400200. (A) Gene structure and SNPs positions on Os05g0400200. Black–box and line indicated exons and introns, respectively. Red marks indicated SNPs. (B) Significant haplotypes by ANOVA test at *** p < 0.001. Letters a and b represent different levels of Duncan’s test. (C) The percentage of each species in each haplotype: abbreviations Adm, Ind, Trj and Tej mean admixture, indica, tropical japonica and temperate japonica, respectively.
Agriculture 11 00318 g007
Table 1. The locations of quantitative trait loci (QTL) detected in genome-wide association study (GWAS) and previously reported QTL and cadi.
QTLLead SNPChr−log10(P)Reported QTLReference of Previously Reported QTLs
QTL Accession IDRelated Trait
qCTS114,648,88216.64AQAL060Root thickness[44]
qCTS43,829,00146.34CQAA8Cold tolerance[42,46]
qCTS5-14,437,94456.40CQE39Rubisco content[45]
qCTS5-219,300,15256.97AQFR028Seedling vigor[47]
Publisher’s Note: MDPI stays neutral with regard to jurisdictional claims in published maps and institutional affiliations.