Abstract
This study aims to evaluate an effect of pig diet supplementation with ethyl esters derived from linseed oil with a high content of alpha-linolenic acid (ALA) on the fatty acids profile of meat. The study was conducted on Polish Landrace fatteners supplemented for a period of 7 weeks (control and experimental groups of 8 animals each, 16 in total). After this period, loin (Longissimus dorsi) and ham (Biceps femoris) samples were collected for laboratory analysis, including basic composition (fat, protein, ash, dry matter) and fatty acids (FAs) profile. The supplementation caused a significant increase in the level of ALA acid, decrease in the content of saturated fatty acids (SFAs), increase in unsaturated FAs level, and resulting decrease in the ratio of n-6/n-3. The indices of atherogenicity and thrombogenicity were beneficially altered in the experimental groups. It can thus be supposed that meat enriched this way may be considered as an interesting choice for consumers who are aware of the importance of diet consumed.
1. Introduction
There is a large number of literature reports demonstrating beneficial effect of long-chain polyunsaturated fatty acids (LC-PUFAs), especially n-3 ones, in the prevention and treatment of many diseases, including some types of cancer, inflammatory states, cardiovascular and central nervous system diseases. Moreover, it was also proved that the level of n-6 PUFAs increased drastically in the human diet, which caused the n-6/n-3 ratio to reach values of 20–30:1, while the ratio of 1–2:1 is considered as the one established in human genetic code [1,2,3].
Despite the progress in medicine and the growing pool of drugs and treatments for these diseases, prevention, including diet, is still a very important issue. An increasing awareness of the consumers with respect to the quality of diet and possible content of biologically active compounds in food leads to various modification attempts, including changes in fatty acids (FAs) profile or enrichment with biologically active compounds, of products derived from animals, such as meat. Profile modifications of dietary FAs in products originated from monogastric animals have been widely studied, and most common supplements include fish or plant oils. However, there are some concerns that pigs’ diet supplementation with oils rich in unsaturated FAs can adversely affect carcass fat features with respect to its further processing because of the reduction in its melting point value [4,5,6]. Due to the fact that PUFAs are more susceptible to oxidation processes, the smell and taste of fresh meat and meat products can be negatively influenced by PUFAs supplementation [7]. In turn, a higher content of saturated fatty acids (SFAs) can improve fat quality for processing due to its higher melting point and enhanced oxidative stability [4].
Numerous studies have demonstrated that the FAs profile of the diet fed to monogastric animals is reflected in body fat composition, since some proportion of dietary FAs is directly deposited in the tissues [8,9,10]; however, a large number of these studies concerned adipose as apposed to muscular fat [11,12]. In turn, other authors noted that the level of FAs deposited in pigs’ muscles as well as the profile of FAs synthesized de novo can be altered by elongation and desaturation processes [13,14].
It was demonstrated that the addition of fish oil to pigs’ diet affects the content of eicosapentaenoic acid (EPA) and docosahexaenoic acid (DHA) in pork, thus reducing the n-6/n-3 ratio [15,16]. An interesting alternative to fish oil is linseed oil, since it is a rich source of n-3 FAs, especially alpha-linolenic acid C18:3n3 (ALA) [16,17,18]. It was demonstrated in some studies that dietary supplementation of whole linseed to pigs caused an increase in the n-3 FAs without any deterioration in growth performance or meat quality [19]. Alpha-linolenic acid (ALA) occupies a special place in the family of omega-3 acids—it is a precursor of other FAs of the omega-3 family, i.e., eicosapentaenoic acid (EPA) and docosahexaenoic acid (DHA). Numerous studies have demonstrated the beneficial effect of ALA in the prevention and treatment of many diseases, e.g., central nervous system disorders, cardiovascular diseases, and some types of cancer [3,20,21]. However, considering linseed oil as a source of ALA, it should be remembered that the complexity of its composition remains a controversial issue. Linseed contains nutrients, but also non-nutrient (e.g., precursors of lignans) and anti-nutrient (e.g., cyanogenic glucosides) compounds [20]. Nutrient and non-nutrient components can have both positive and/or negative effects depending on the dose, frequency or time of consumption [19,22,23]. Linseed oil is chemically unstable, susceptible to light and atmospheric oxygen, which limits the possibilities of its use [24]. In turn, the studies [22,25,26] indicate that linseed oil ethyl esters are characterized by a significantly increased bioavailability, and are easier absorbed and incorporated into the various lipid fractions of blood and tissues. Our previous study on a rat model comparing an effect of dietary supplementation with linseed oil, linseed oil ethyl esters and fish oil on the FAs profile of intramuscular and perimuscular fat indicated that the esters can be a good alternative to oils [27].
Thus, the aim of the study was to examine the effect of a fattener in pigs’ diet supplementation with a preparation containing ethyl esters of linseed oil on the composition and FAs profile of their meat fat. To our knowledge, no studies using such a preparation in pigs’ feed have been conducted so far.
2. Materials and Methods
2.1. Supplement Used in the Study
The supplement used in the experiment was obtained by spraying ethyl esters of linseed oil rich in alpha-linolenic acid synthesized according to the technology elaborated at the University of Wroclaw (Wroclaw, Poland) [28] on a mineral carrier (Humokarbowit by PHW Tronina, Raków, Poland). This allowed for the preparation of a solid consistency willingly consumed by the animals to be obtained. The technology of production and characteristics of linseed oil ethyl ester applied in this study are presented in the article by Sokola-Wysoczanska et al. [22]. Briefly, the technology is based on oil transesterification (a mixture of triglycerides of omega-3, -6, -9 FAs) with ethanol in the presence of a catalyst. The process consists of several stages. The first one is transesterification in an anaerobic atmosphere, then removal of unreacted bioethanol from the post-reaction mixture and separation of the glycerin phase from the raw ester phase in gravity separators. In the next stage, the raw esters are purified by centrifugation, and then cleaned by means of a residual gas alcohol depot with nitrogen and by sedimentation of the residual glycerin phase. Finally, the glycerin phase is separated.
2.2. Animals
The study was conducted on castrated fatteners of Polish Landrace breed pigs at the age of about 5 months on a family farm located in the southern part of Poland. The animals were maintained in conditions that met the requirements of the Ordinance of the Minister of Agriculture and Rural Development of 28 June 2010 on minimum conditions for maintaining farm animal species [29]. The animals were fed according to the standards of pig nutrition [30]. The composition of the diet was as follows: ground barley (390 g/kg fodder), wheat middling (320 g/kg fodder), ground maize (110 g/kg fodder), extracted soybean meal (90 g/kg fodder), and vitamin–mineral premix (9 g/kg fodder). The animals were divided into two groups (8 animals in each): control and experimental. The animals from the experimental group received diet supplementation with the preparation corresponding to a linseed oil ethyl ester amount of 100 g/per head/per day for a period of 7 weeks. The preparation was fed individually to the animals, and they had an ad libitum access to water. The animals were weighed at the beginning and at the end of the experiment, daily body gains and feed conversion ratio (kg fodder/kg gain) were calculated. After the end of the fattening period, the animals were slaughtered according to valid technology in a slaughterhouse. After 24 h of carcass cooling at a temperature of about 4 °C, the samples of meat (loin—Longissimus dorsi muscle, and ham—Biceps femoris muscle) were collected for the laboratory analyses. The following samples were obtained: loin samples from the control group (L-C), ham samples from the control group (H-C), loin samples from the group receiving the supplement (L-EE), and ham samples from the same group (H-EE).
2.3. Samples Analysis
Basic composition of collected meat samples, i.e., the content of fat, protein, ash and dry matter, was determined in the laboratory of the Department of Animal Nutrition and Feed Management, Wroclaw University of Environmental and Life Sciences (Poland) according to the routinely used procedures. The FAs profile was examined in the Laboratory of Milk Assessment and Analysis, Institute of Animal Breeding, Wroclaw University of Environmental and Life Sciences (Poland). The samples were homogenized and fat was extracted from them according to the Folch method [31]. The FAs profile was determined using a gas chromatograph Agilent 7890A with flame-ionization detector, with capillary column HP—88 (L × I.D.100 m × 0.25 mm, df 0.25 μm), which was used for FAs separation. The furnace initial isotherm was 100 °C and maintained for 5 min, then increased to 140 °C at 4 °C/min, then to 240 °C at 2 °C/min. The final isotherm was maintained for 5 min. Split of 1 μL, stream separator 80:1, dosing device temperature 250 °C, detector temperature 270 °C, carrier gas—helium. Transesterification of FAs was carried out directly without prior hydrolysis of the triacylglycerols using 2M methanolic potassium hydroxide in accordance with the standard [32]. The identification of a particular FAs content was performed by comparison of sample peak retention times with FAME standards (47885-U from Sigma-Aldrich Chemie GmbH, Schelldorf, Germany; 13058-52-1, 2734-47-6, 2566-90-7 from Larodan Fine Chemicals AB, Malmö, Sweden). Heptadecanoic acid (51610; Sigma-Aldrich Chemie GmbH, Schelldorf, Germany) was used as an internal standard.
Data on the FAs are presented as a percentage of individual acids in the total acid pool. The total share of saturated acids (SFAs), unsaturated fatty acids (UFAs), monounsaturated fatty acids (MUFAs) and polyunsaturated fatty acids (PUFAs), as well as their ratios were calculated. In addition, the content of total n-3, n-6 and n-9 fatty acids was determined.
The indices of lipid quality, i.e., atherogenic index (AI) and thrombogenic index (TI), were calculated based on the FAs profile of examined samples according to the following formulas (formula (1) [33], formula (2) [34]):
2.4. Statistical Analysis
The results are presented as mean values and standard deviations. The results were analyzed using the two-way analysis of variance (ANOVA) considering two factors, i.e., meat cut, loin or ham, and treatment with linseed oil. The differences between the groups were estimated using Tukey’s test at a significance level of p < 0.05 and p < 0.01. The calculations were made using the Statistica 13.0 software package (StatSoft, Krakow, Poland).
3. Results
The body weight of the animals at the beginning of the experiment was 72.8 ± 2.4 kg in the control group, and 73.2 ± 2.1 kg in the experimental group, while before the slaughter it was 108.5 ± 4.1 kg and 110.7 ± 2.2 kg, respectively. No statistically significant differences were noted. The daily body weight gains during the supplementation period amounted to 731.1 ± 56.6 g and 765.4 ± 68.2 g for the control and experimental group, respectively, while feed conversion rate was 3.05 ± 0.27 and 2.89 ± 0.22 kg of fodder/kg gain. Additionally, in this case, no statistically significant differences were confirmed.
The basic chemical composition of the examined meat samples is presented in Table 1. Significant differences were noted between fat content in the control groups (L-C vs. H-C; p < 0.01), which was about 18% lower in ham compared to loin. The supplementation caused a significant (p < 0.01) (about 10%) decrease in loin fat content in the group receiving ethyl esters of linseed oil L-EE compared to the group L-C.

Table 1.
Basic chemical composition of the examined meat samples (%).
The FAs profile of the analyzed meat cuts with and without supplementation is presented in Table 2 and Figure 1. Comparing the control groups (L-C and H-C), a significant difference in the group of SFAs was noted in the case of C17:0 FA, the content of which was lower in ham compared to loin (p < 0.05).
Table 2.
Fatty acids profile of the examined meat samples (%).
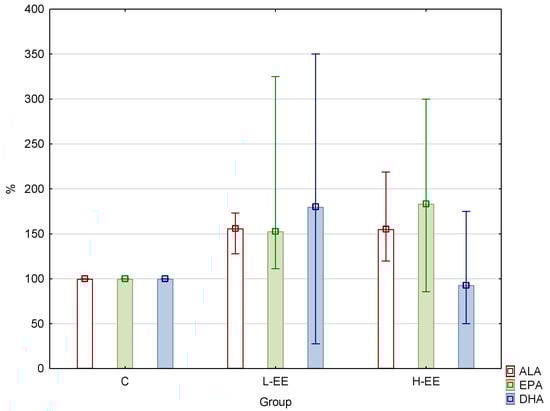
Figure 1.
The relative level of n-3 fatty acids of meat samples after supplementation (assumed as 100%).C—control samples; L-EE—loin, linseed oil ethyl ester supplementation; H-EE—ham, linseed oil ethyl ester supplementation.
Analysis of the results and differences between the control and supplemented groups (i.e., L-C vs. L-EE and H-C vs. H-EE) demonstrated a significant decrease in C10:0 acid between ham groups (p < 0.05). Considering the profile of SFAs in loin and ham samples after the supplementation (L-EE vs. H-EE), the content of C17:0 acid was significantly lower in the ham group (about 19%) compared to loin (p < 0.05).
The differences in the group of UFAs in the controls (L-C vs. H-C groups) proved to be statistically significant in the case of C20:4n6 acid, the content of which was about 38% lower (p < 0.01) in the H-C group compared to the L-C. More differences were observed considering the supplementation effect on UFAs profile in particular meat cuts. In the case of loin (L-C vs. L-EE groups), statistical differences were noted for the following acids: C16:1 (increase by about 23%, p < 0.01), C17:1 (increase by about 56%, p < 0.01), C18:1n8c (increase by about 20%, p < 0.05), C18:3n3 (increase by about 64%, p < 0.01), C20:4n6 (decrease by about 56%, p < 0.01), C20:5n3 and C22:6n3 (nearly 2-fold increase; p < 0.01 and p < 0.05, respectively) in the L-C group compared to the L-EE.
Considering the differences between the H-C and H-EE groups (FAs profile in ham), the following were demonstrated: about 52% increase in the case of C17:1 (p < 0.01), 5% increase in C18:1n9c (p < 0.05), nearly 20% increase in C18:1n8c (p < 0.05), 56% increase in the case of C18:3n3 (p < 0.01) and almost 2-fold increase in C20:5n3 (p < 0.05) in the H-EE group compared to the H-C. In turn, the content of C20:4n6 in ham decreased as a result of the supplementation by about 28% (p < 0.05). Considering the content of UFAs in the groups receiving an addition of linseed oil ethyl esters, i.e., groups L-EE and H-EE, no significant differences were noted.
The summary of indices concerning FAs profiles, i.e., total SFA, UFA, MUFA and their ratios, sum of acids from n-3, n-6 and n-9 families, as well as atherogenic and thrombogenic indices in the examined meat samples are presented in Table 3 and Figure 2.
Table 3.
Summary of fatty acids profile indices.
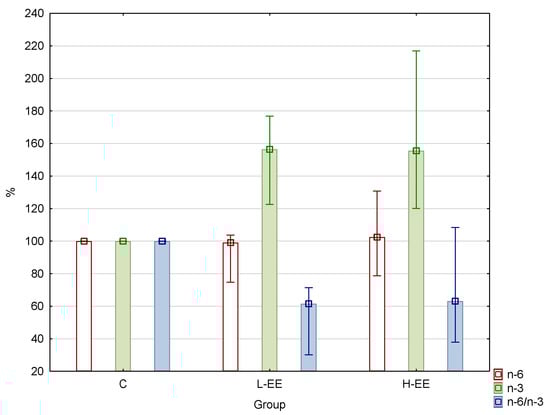
Figure 2.
The relative level of n-3 and n-6 fatty acids of meat samples after supplementation (control assumed as 100%). C—control samples; L-EE—loin, linseed oil ethyl ester supplementation; H-EE—ham, linseed oil ethyl ester supplementation.
No significant differences were found in the case of total SFAs content; however, an increase in the content of UFAs was found in loin and ham samples from the supplemented group. This increase was about 5% for the group L-EE compared to the L-C, and about 7% in the case of H-EE group compared to the H-C (p < 0.01). The supplementation also affected the total MUFAs content in the examined ham samples, and an increase at a level of about 7% (p < 0.01) was found between the H-C vs. H-EE. A statistically significant increase, by about 20% (p < 0.05), was noted in the case of PUFAs content in ham samples. However, it is worth noting that this index was statistically significantly higher in loin samples, both with and without the supplementation compared to ham samples (L-C vs. H-C and L-EE vs. H-EE), and a similar tendency was noted for PUFA/MUFA and PUFA/UFA ratios.
Analyzing the total content of n-3, n-6 and n-9 FAs, it can be noted that the n-6 acids level was higher in loin compared to ham (by about 15, p < 0.05). In turn, the content of the n-9 FAs was about 5% higher (p < 0.05) in the H-EE group compared to the L-EE. Supplementation with ethyl esters of linseed oil caused a significant increase (p < 0.01) in the level of n-3 FAs sum, both in the loin and ham samples, and this increase was at a level of about 60% and 53%, respectively, compared to the control samples (p < 0.01) (Figure 2). In the case of the n-9 FAs, a statistically significant difference was only noted for ham samples, where their level increased by about 5% in the H-EE compared to the H-C group (p < 0.05). These findings were reflected in the n-6/n-3 ratio, which decreased by about 41% and 35% in loin and ham samples without and with the supplementation, respectively.
Finally, the value of thrombogenic index (TI) after the supplementation was reduced both in loin and ham samples, and the decrease was on a level of about 27% and 23% (p < 0.01), respectively, for the samples after the supplementation compared to the controls.
4. Discussion
The study conducted by Guzek et al. [35] on Polish Landrace pigs demonstrated fat content in L. dorsi muscle (loin) at a level of 2–4%, which is a lower value compared to our study. In turn, protein content was at a level of about 22–23% and ash content amounted to 1.2–1.3%; these values are in line with our findings. Results similar to ours were also obtained in the study conducted by Maiorano et al. [36] on the same pig breed, and the authors obtained dry matter content in L. dorsi muscle of about 25%, ash about 1.1%. The content of protein obtained in this study was slightly higher than that presented in our study, as it amounted to about 23%, while fat content was more than twice lower, i.e., about 1.4–1.6%. Similar results were also obtained by Tomovic et al. [37] who studied Landrace pigs in Serbia.
Few studies have addressed the composition of B. femoris muscle (ham), and none of them was conducted on the Polish Landrace breed. However, the study by Kim et al. [38] compared twenty-one different pork muscles, and demonstrated that generally protein content was lower, fat content was higher and ash level was similar in B. femoris compared to L. dorsi muscle. In our study, the reverse relationship was noted for fat content, as it was higher in loin compared to ham.
According to some authors [33], the AI and TI indices are better indicators of atherogenicity and thrombogenicity than the ratio of PUFA/SFA—their lower values are more beneficial for health status as they indicate a lower risk of atherosclerosis and thrombosis, respectively. This is generally related to the fact that not all SFAs exhibit hypercholesterolemic activity, and, in addition to PUFAs, some MUFAs demonstrated protective activity in this range.
Thus, the AI and TI take into account the share of acids with proven specific activity in the total pool of FAs. Among the SFAs, the ones with 12, 14 or 16 carbon atoms cause an increase in cholesterol level and thus are referred to as atherogenic ones. Therefore, the AI is a measure of the level and mutual relations of FAs that can be one of the factors causing atherosclerosis. On the other hand, the TI takes into account the SFAs with 14, 16 and 18 carbon atoms, which are suggested to exhibit thrombogenic activity, thus that index is a measure of the level and relations of FAs that can be a reason of thrombosis [33,34].
The results concerning the FAs profile obtained in this study are generally consistent with the literature reports. Wood et al. [39] report in their review paper the values of particular FAs content in pig muscle tissue at a similar level to that obtained in this study. The exception was the content of C18:2n6 and C20:4n6 FAs, which according to these authors was more than 2-fold higher compared to the study presented. Additionally, the n-6/n-3 ratio was about 40% and 133% higher compared to our control and experimental groups, respectively.
The studies were also conducted on pig diet supplementation with linseed or linseed oil. For example, Hoz et al. [1] enriched pigs’ diet with 3% linseed oil addition, and examined the FAs profile in tenderloin muscle. The authors obtained about 8% lower total SFAs content, which was mainly related to a lower level of C16:0 acid. However, MUFAs content was nearly 40% higher in our study, while PUFAs level appeared to be nearly 3-fold lower. This all was reflected in the about 2-fold lower n-6/n-3 ratio [1]. Similar results were obtained in the study conducted by Nuernberg et al. [19] who supplemented the diet of pigs with 5% linseed oil, and examined the FAs profile of intramuscular fat. An increase in the n-3 FAs noted in this study was accompanied by a decrease in C20:4n6 acid content, and a marked reduction in the n-6 to n-3 FAs ratio, what was also demonstrated in our study. Hanczakowski et al. [13] found the total level of SFAs in pigs loin muscle after linseed oil supplementation at a level of about 35%, thus lower compared to this study. The same tendency was noted for MUFAs content; however, the level of PUFAs was much higher. Despite this fact, these authors noted a very low n-3 FAs content, which was reflected in an extremely high n-6/n-3 ratio, which reached 84:1, while the recommended level should be 1–2:1 [1,2,3]. Other results were obtained by Lu et al. [40] after 3% linseed oil supplementation, and the values were more similar to those found in our study.
It was suggested in some studies that long-term administration of C18:3n3 can significantly affect this acid accumulation in body phospholipids and the efficiency of its conversion to long-chain FAs, i.e., C20:5n3 and C22:5n3 (e.g., Dugan et al. [41]); although other studies demonstrated that the efficiency of this conversion was low (e.g., Malau-Aduli et al. [42]). On the other hand, numerous studies demonstrated the moderate effect of C18:3n3 fatty acid derived from linseed oil supplementation on the changes in this acid content in pig meat. However, these studies demonstrated clear differences in the content of C18:3n3 acid elongation and saturation products, i.e., EPA and DHA, both in muscles and adipose tissue [1]. Different results were obtained in the study presented, since low levels of EPA and DHA acids were detected, while the content of C18:3n3 acid increased significantly after the end of the experiment. This may confirm the thesis put in the introduction part, that ALA is a kind of deposit from which the organism can derive EPA and DHA in case of a need.
In the opinion of many dieticians and consumers, meat fat is considered to be unhealthy. However, fat and its FAs profile, both of muscles and adipose tissue, are important factors affecting meat quality and its nutritional and functional value [39]. In our study, the ratio of n-6 to n-3 FAs in loin and ham muscles was subject to a significant decrease, which mainly resulted from an increase in C18:3n3 acid content and a decrease in C20:4n6 acid level. The samples obtained as a result of diet supplementation with fatteners may thus be considered as more beneficial from a nutritional point of view compared to the control, due to a significantly lower n-6/n-3 value recommended by the nutritionists. It is also worth mentioning that meat cuts examined in this study are one of the most commonly consumed. It should be remembered that the correct n-6 to n-3 ratio in farm animals’ meat and meat products can improve a dietary supply of n-3 fatty acids in humans, which is beneficial from a nutritional point of view [43,44].
It is also worth noting, that according to Averette et al. [45], the type of dietary fat affects bacon to a higher degree than the loin or ham muscles. The authors suggest that loin FAs profile is relatively stable and to a lower degree reflects dietary FAs profile.
A certain limitation of the study must be considered. The sample size was relatively small, therefore comparison of different types of n-3 FAs supplementation, different dose, or some additional assessment for the functional quality of the meat including the negative effect (e.g., susceptibility of oxidation process or smell/taste, structure) need to be considered in the future research.
5. Conclusions
The study demonstrated the benefits of farm animal feed supplementation with a preparation containing linseed oil ethyl esters rich in alpha-linolenic acid. The ratio of unsaturated to saturated fatty acids, as well as indices of atherogenicity and thrombogenicity, were beneficially altered in the experimental groups. Meat derived from such animals can thus be considered of interest to consumers who are conscious about the quality of their diet.
Author Contributions
Conceptualization, K.C. and E.S.-W.; methodology, K.C.; software, K.C. and P.C.; validation, K.C. and E.S.-W.; formal analysis, K.C.; investigation, K.C.; writing—original draft preparation, K.C.; writing—review and editing, K.C. and A.W.; visualization, K.C., A.W. and P.C. supervision, K.C. All authors have read and agreed to the published version of the manuscript.
Funding
This research received no external funding.
Institutional Review Board Statement
Not applicable.
Data Availability Statement
The data presented in this study are available on request from the corresponding author. The data are not publicly available due to privacy.
Conflicts of Interest
The authors declare no conflict of interest.
References
- Hoz, L.; Lopez-Bote, C.J.; Cambero, M.I.; D’Arrigoa, M.; Pina, C.; Santosa, C.; Ordonez, J.A. Effect of dietary linseed oil and a-tocopherol on pork tenderloin (Psoas major) muscle. Meat Sci. 2003, 65, 1039–1044. [Google Scholar] [CrossRef]
- Patkowska-Sokoła, B.; Czyż, K.; Sokoła-Wysoczańska, E.; Wysoczański, T.; Bodkowski, R.; Vogt, A. Use of omega-3 polyunsaturated fatty acid ethyl esters as raw material for fodder industry. Przem. Chem. 2014, 9, 799–802. [Google Scholar]
- Wysoczański, T.; Sokoła-Wysoczańska, E.; Pękala, J.; Lochyński, S.; Czyż, K.; Bodkowski, R.; Herbinger, G.; Patkowska-Sokoła, B.; Librowski, T. Omega-3 fatty acids and their role in Central Nervous System—A review. Curr. Med. Chem. 2016, 23, 816–831. [Google Scholar] [CrossRef]
- Bertol, T.M.; de Campos, R.M.L.; Ludke, J.V.; Terra, N.N.; de Figueiredo, E.A.P.; Coldebella, A.; dos Santos Filho, J.I.; Kawski, V.L.; Lehr, N.M. Effects of genotype and dietary oil supplementation on performance, carcass traits, pork quality and fatty acid composition of backfat and intramuscular fat. Meat Sci. 2013, 93, 507–516. [Google Scholar] [CrossRef]
- Janiszewski, P.; Grześkowiak, E.; Lisiak, D.; Borys, B.; Borzuta, K.; Pospiech, E.; Poławska, E. The influence of thermal processing on the fatty acid profile of pork and lamb meat fed diet with increased levels of unsaturated fatty acids. Meat Sci. 2016, 111, 161–167. [Google Scholar] [CrossRef]
- Peiretti, P.G.; Gai, F.; Brugiapaglia, A.; Mussa, P.P.; Meineri, G. Fresh meat quality of pigs fed diets with different fatty acid profiles and supplemented with red wine solids. Food Sci. Technol. 2015, 35, 633–642. [Google Scholar] [CrossRef]
- Musella, M.; Cannata, S.; Rossi, R.; Mourot, J.; Baldini, P.; Corino, C. Omega-3 polyunsaturated fatty acid from extruded linseed influences the fatty acid composition and sensory characteristics of dry-cured ham from heavy pigs. J. Anim. Sci. 2009, 87, 3578–3588. [Google Scholar] [CrossRef] [PubMed]
- Apple, J.K.; Maxwell, C.V.; Galloway, D.L.; Hutchison, S.; Hamilton, C.R. Interactive effects of dietary fat source and slaughter weight in growing-finishing swine: I. Growth performance and longissimus muscle fatty acid composition. J. Anim. Sci. 2009, 87, 1407–1422. [Google Scholar] [CrossRef] [PubMed]
- Benz, J.M.; Tokach, M.D.; Dritz, S.S.; Nelssen, J.L.; DeRouchey, J.M.; Sulabo, R.C.; Goodband, R.D. Effects of choice white grease and soybean oil on growth performance, carcass characteristics, and carcass fat quality of growing-finishing pigs. J. Anim. Sci. 2011, 89, 404–413. [Google Scholar] [CrossRef] [PubMed]
- Juárez, M.; Dugan, M.E.R.; Aldai, N.; Aalhus, J.L.; Patience, J.F.; Zijlstra, R.T.; Beaulieu, A.D. Feeding co-extruded flaxseed to pigs: Effects of duration and feeding level on growth performance and backfat fatty acid composition of grower-finisher pigs. Meat Sci. 2010, 84, 578–584. [Google Scholar] [CrossRef]
- Kim, J.S.; Ingale, S.L.; Lee, S.H.; Choi, Y.H.; Kim, E.H.; Lee, D.C.; Kim, Y.H.; Chae, B.J. Impact of dietary fat sources and feeding level on adipose tissue fatty acids composition and lipid metabolism related gene expression in finisher pigs. Anim. Feed Sci. Technol. 2014, 196, 60–67. [Google Scholar] [CrossRef]
- Liu, P.; Kerr, B.J.; Chen, C.; Weber, T.E.; Johnston, L.J.; Shurson, G.C. Influence of thermally oxidized vegetable oils and animal fats on energy and nutrient digestibility in young pigs. J. Anim. Sci. 2014, 92, 2980–2986. [Google Scholar] [CrossRef]
- Hanczakowski, P.; Szymczyk, B.; Hanczakowska, E. Fatty acid profile and cholesterol content of meat from pigs fed different fats. Ann. Anim. Sci. 2009, 9, 157–163. [Google Scholar]
- Raj, S.; Skiba, G.; Sobol, M.; Pastuszewska, B. Effects of dietary fat on the saturated and monounsaturated fatty acid metabolism in growing pigs. Arch. Anim. Nutr. 2017, 71, 257–271. [Google Scholar] [CrossRef] [PubMed]
- Ma, X.; Jiang, Z.; Lai, C. Significance of increasing n-3 PUFA content in pork on human health. Crit. Rev. Food Sci. Nutr. 2015, 56, 858–870. [Google Scholar] [CrossRef]
- Upadhaya, S.D.; Li, T.S.; Kim, I.H. Effects of protected omega-3 fatty acid derived from linseed oil and vitamin E on growth performance, apparent digestibility, blood characteristics and meat quality of finishing pigs. Anim. Prod. Sci. 2016, 57, 1085–1090. [Google Scholar] [CrossRef]
- Heller, K.; Andruszewska, A.; Wielgusz, K. The cultivation of linseed by ecological methods. J. Res. Appl. Agric. Eng. 2010, 55, 112–116. [Google Scholar]
- Shabbir, M.A.; Khan, M.R.; Shehzad, A.; Din, A.; Khan, M.I.; Hussain, B. Flaxseed segregations as a n imperative tool for its neutraceutical implication. Pak. J. Food Sci. 2014, 24, 64–74. [Google Scholar]
- Nuernberg, K.; Fischer, K.; Nuernberg, G.; Kuechenmeister, U.; Klosowska, D.; Eliminowska-Wenda, G.; Fiedler, I.; Ender, K. Effects of dietary olive and linseed oil on lipid composition, meat quality, sensory characteristics and muscle structure in pigs. Meat Sci. 2005, 70, 63–74. [Google Scholar] [CrossRef]
- Campos, J.R.; Severino, P.; Ferreira, C.S.; Zielinska, A.; Santini, A.; Souto, S.B.; Souto, E.B. Linseed essential oil–source of lipids as active ingredients for pharmaceuticals and nutraceuticals. Curr. Med. Chem. 2019, 26, 1–22. [Google Scholar] [CrossRef]
- Tang, Y.; Jiang, Y.; Meng, J.; Tao, J. A brief review of physiological roles, plant resources, synthesis, purification and oxidative stability of Alpha-linolenic Acid. Emir. J. Food Agric. 2018, 30, 341–356. [Google Scholar] [CrossRef]
- Sokoła-Wysoczańska, E.; Wysoczański, T.; Czyż, K.; Vogt, A.; Patkowska-Sokoła, B.; Sokoła, K.; Bodkowski, R.; Wyrostek, A.; Roman, K. Characteristics of polyunsaturated fatty acids ethyl esters with high alpha-linolenic acid content as a component of biologically active health-promoting supplements. Przem. Chem. 2014, 93, 1923–1927. [Google Scholar]
- Wiesenfeld, P.W.; Babu, U.S.; Collins, T.F.X.; Sprando, R.; O’Donnel, M.W.; Flynn, T.J.; Black, T.; Olejnik, N. Flaxseed increased α-linolenic and eicosapentaenoic acid and decreased arachidonic acid in serum and tissues of rat dams and offspring. Food Chem. Toxicol. 2003, 41, 841–855. [Google Scholar] [CrossRef]
- Kajla, P.; Sharma, A.; Sood, D.R. Flaxseed-a potential functional food source. J. Food Sci. Technol. 2015, 52, 1857–1871. [Google Scholar] [CrossRef]
- AbuMweis, S.; Jew, S.; Tayyem, R.; Agraib, L. Eicosapentaenoic acid and docosahexaenoic acid containing supplements modulate risk factors for cardiovascular disease: A meta-analysis of randomised placebo-control human clinical trials. J. Hum. Nutr. Diet. 2018, 31, 67–84. [Google Scholar] [CrossRef]
- Chang, C.H.; Tseng, P.T.; Chen, N.Y.; Lin, P.C.; Lin, P.Y.; Chang, J.P.C.; Kuo, F.Y.; Lin, J.; Wu, M.C.; Su, K.P. Safety and tolerability of prescription omega-3 fatty acids: A systematic review and meta-analysis of randomized controlled trials. Prostagland. Leukotri. Essent. Fatty Acids 2018, 129, 1–12. [Google Scholar] [CrossRef] [PubMed]
- Czyż, K.; Sokoła-Wysoczańska, E.; Bodkowski, R.; Cholewińska, P.; Wyrostek, A. Dietary Omega-3 Source Effect on the Fatty Acid Profile of Intramuscular and Perimuscular Fat—Preliminary Study on a Rat Model. Nutrients 2020, 12, 3382. [Google Scholar] [CrossRef]
- Method of Manufacturing the Ethyl or Methyl Esters of Higher Fatty Acids and the Installation to Execute this Method. Polish Patent PL211325, 31 May 2012.
- Ordinance of the Minister of Agriculture and Rural Development of 28 June 2010 on minimum conditions for maintaining farm animal species other than those for which the standards of protection are laid down in the European Union regulations. J. Laws 2020, 116, 778.
- Grela, E.; Skomiał, J. Nutritional Recommendations and Nutritional Value of Feedingstuffs for Pigs. Standards of Pigs Nutrition; Jan Kielanowski Institute of Physiology and Animal Nutrition, Polish Academy of Sciences: Jabłonna, Poland, 2014. [Google Scholar]
- Moreau, R.A.; Nyström, L.; Whitaker, B.D.; Winkler-Moser, J.K.; Baer, D.J.; Gebauer, S.K.; Hicks, K.B. Phytosterols and their derivatives: Structural diversity, distribution, metabolism, analysis, and health-promoting uses. Prog. Lipid Res. 2018, 70, 35–61. [Google Scholar] [CrossRef]
- PN-EN ISO 12966-2:2017-05. Animal and Vegetable Fats and Oils-Gas Chromatography of Fatty Acid Methyl esters-Part 1: Guidelines on Modern Gas Chromatography of Fatty Acid Methyl Esters; Polish Committee for Standardization: Warsaw, Poland, 2014. [Google Scholar]
- Yurchenko, S.; Sats, A.; Tatar, V.; Kaart, T.; Mootse, H.; Jõudu, I. Fatty acid profile of milk from Saanen and Swedish Landrace goats. Food Chem. 2018, 254, 326–332. [Google Scholar] [CrossRef] [PubMed]
- Campo, M.M.; Sierra, I. Fatty acid composition of selected varieties of Spanish dry-cured ham. Surveys from 1995 and 2007. Span. J. Agric. Res. 2011, 9, 66–73. [Google Scholar] [CrossRef]
- Guzek, D.; Głąbska, D.; Głąbski, K.; Wierzbicka, A. Influence of Duroc breed inclusion into Polish Landrace maternal line on pork meat quality traits. An. Acad. Bras. Ciênc. 2016, 88, 1079–1088. [Google Scholar] [CrossRef][Green Version]
- Maiorano, G.; Kapelański, W.; Bocian, M.; Pizzuto, R.; Kapelańska, J. Influence of rearing system, diet and gender on performance, carcass traits and meat quality of Polish Landrace pigs. Animals 2012, 7, 341–347. [Google Scholar] [CrossRef] [PubMed]
- Tomovic, V.M.; Zlender, B.A.; Jokanović, M.R.; Tomovic, M.S.; Sojic, B.V.; Skaljac, S.B.; Tasic, T.A.; Ikonic, P.M.; Soso, M.M.; Hromis, N.M. Technological quality and composition of the M. semimembranosus and M. longissimus dorsi from Large White and Landrace Pigs. Agric. Food Sci. 2014, 23, 9–18. [Google Scholar] [CrossRef]
- Kim, J.H.; Seong, P.N.; Cho, S.H.; Park, B.Y.; Hah, K.H.; Yu, L.H.; Lim, D.G.; Hwang, I.H.; Kim, D.H.; Lee, J.M.; et al. Characterization of Nutritional Value for Twenty-one Pork Muscles. Asian Australas. J. Anim. Sci. 2008, 21, 138–143. [Google Scholar] [CrossRef]
- Wood, J.D.; Enser, M.; Fisher, A.V.; Nute, G.R.; Sheard, P.R.; Richardson, R.I.; Hughes, S.I.; Whittington, F.M. Fat deposition, fatty acid composition and meat quality: A review. Meat Sci. 2008, 78, 343–358. [Google Scholar] [CrossRef]
- Lu, P.; Zhang, L.Y.; Yin, J.D.; Everts, A.K.R.; Li, D.F. Effects of soybean oil and linseed oil on fatty acid compositions of muscle lipids and cooked pork flavor. Meat Sci. 2008, 80, 910–918. [Google Scholar] [CrossRef] [PubMed]
- Dugan, M.E.R.; Vahmani, P.; Turner, T.D.; Mapiye, C.; Juárez, M.; Prieto, N.; Beaulieu, A.D.; Zijlstra, R.T.; Patience, J.F.; Aalhus, J.L. Pork as a source of Omega-3 (n-3) fatty acids. J. Clin. Med. 2015, 4, 1999–2011. [Google Scholar] [CrossRef] [PubMed]
- Malau-Aduli, E.O.; Holman, B.W.B.; Kashani, A.; Nichols, P.D. Sire breed and sex effects on the fatty acid composition and content of heart, kidney, liver, adipose and muscle tissues of purebred and first-cross prime lambs. Anim. Prod. Sci. 2015, 56, 2122–2132. [Google Scholar] [CrossRef]
- Cheng, C.; Zhang, X.; Xia, M.; Liu, Z.; Wei, H.; Deng, Z.; Wang, C.; Jiang, S.; Peng, J. Effect of oregano essential oil and benzoic acid supplementation to a low-protein diet on meat quality, fatty acid composition, and lipid stability of longissimus thoracis muscle in pigs. Lipids Health Dis. 2017, 16, 164. [Google Scholar] [CrossRef]
- Nantapo, C.W.T.; Muchenje, V.; Nkukwana, T.T.; Hugo, A.; Descalzo, A.; Grigioni, G.; Hoffman, L.C. Socio-economic dynamics and innovative technologies affecting health-related lipid content in diets: Implications on global food and nutrition security. Food Res. Internat. 2015, 76, 896–905. [Google Scholar] [CrossRef]
- Averette Gatlin, L.; See, M.T.; Hansen, J.A.; Sutton, D.; Odle, J. The effects of dietary fat sources, levels, and feeding intervals on pork fatty acid composition. J. Anim. Sci. 2002, 80, 1606–1615. [Google Scholar] [CrossRef] [PubMed]


Publisher’s Note: MDPI stays neutral with regard to jurisdictional claims in published maps and institutional affiliations. |
© 2021 by the authors. Licensee MDPI, Basel, Switzerland. This article is an open access article distributed under the terms and conditions of the Creative Commons Attribution (CC BY) license (https://creativecommons.org/licenses/by/4.0/).