Article

Increase in the Value of Agricultural Parcels—Modelling and Simulation of the Effects of Land Consolidation Project

1
Department of Economics and Food Economy, University of Agriculture in Krakow, al. Mickiewicza 21, 31-120 Krakow, Poland
2
Department of Agricultural Land Surveying, Cadastre and Photogrammetry, University of Agriculture in Krakow, ul Balicka 253 a, 30-198 Krakow, Poland
*
Author to whom correspondence should be addressed.
Agriculture 2021, 11(5), 388; https://doi.org/10.3390/agriculture11050388
Submission received: 7 March 2021 / Revised: 20 April 2021 / Accepted: 23 April 2021 / Published: 25 April 2021

Abstract

:
In the theory and practice of valuation, it is commonly accepted that the key feature determining the value of agricultural land is its location, both general and in a specific part (zone) of a village. The model approach used in the present study can provide the answer to the question of how to maximize the value of agricultural land as part of a conducted arrangement, agricultural works. The study used data on the market sale of agricultural parcels in 10 Polish municipalities. Each parcel was described using a set of features (parameters) that were key to its value and entered into a database. Using the database, two statistical models were built: a multiple regression analysis model (MRA) and an artificial neural network model (ANN). The studies conducted have shown that changes in such features as surface area, shape, and access to a public road were accompanied by significant changes in the market values of parcels. Another important observation was that potential decreases in the value of agricultural parcels as a result of changes in their surface areas were offset (where it was reasonable) by the elimination of their excessive elongation and providing them with an access to a public road. Based on the findings, it has been concluded that change in land value should be considered one of the effects of executed land consolidation projects (LCP), during which the parameters of agricultural parcels are subject to the biggest changes.

1. Introduction

Areas used for agricultural purposes play a key socio-economic and cultural role in the development of virtually any country. Agricultural areas are also essential environmentally and ecologically [1]. According to Eurostat data in the European Union, utilized agricultural areas cover 173 million ha. In terms of the size of agricultural areas, Poland comes fifth, behind France, Spain, Great Britain, and Germany [2].
Of particular importance for many of the above-mentioned functions of rural areas is the layout of property borders, often equated with division into parcels. From the perspective of the operation of farms, the layout of parcels and their number, surface area, and shape largely determine the profitability of agricultural activity [3,4], although the number of factors impacting the profitability is naturally much bigger. Excessive land fragmentation increases the costs of farms’ operation by decreasing yields and increasing labor and transportation costs [5,6,7,8,9]. In the long run, these factors have a negative impact on the incomes and living conditions of the population, increasing negative migration trends from rural areas to cities [10] and leading over time to an increasing phenomenon of permanent abandonment of land cultivation [11,12,13]. Both these phenomena are not only negative but also hard to reverse. Land acquires a real value when it is sold or used for securing a credit. Estimation of the value of land related to its productivity or market value is also necessary to determine the amount of numerous taxes. It is also needed when securing mortgage credits, exchanging farmland, or determining compensations for the acquisition of farmland to carry out public investment projects. What affects the value and market prices of parcels located in rural areas?
Parcels used for agricultural purposes are sold on the market relatively less often than parcels located in investment areas, in particular those designated for building. Theory suggests [14,15,16,17,18] that when determining the value of any property or its parts, the specificity of the subject of valuation should be taken into account in each case. In the case of agricultural parcels, one should certainly focus on those characteristics of land that are significant for agricultural production (impacting yield and income levels) and those factors that have a significant impact on the value of land as viewed by the owners. It should be stressed that much of the trade in agricultural land takes place between neighbors. It takes place between land owners who live in one locality and similarly perceive the local conditions affecting the assessment of the land’s agricultural suitability in a given village.
The most important characteristics determining the value of agricultural parcels include (Figure 1) location in a specific part (zone) of a village, proximity of other agricultural areas and buildings, soil usability (soil classification), variety and spatial layout of agricultural areas, surface area and shape of a parcel, topography, accessibility, as well as availability of structures and equipment used for agricultural production (land improvements or irrigation system). Among other significant factors are obstacles to cultivation (e.g., flintiness, permanent elements of technical infrastructure, etc.) and agricultural condition [4,6,16,17,18,19].
Some of the above-listed factors (surface area, shape, and location) are also key in determining the values of land fragmentation parameters (LF). Thus, we can posit the statement that LF parameters impact the value of land or how it is assessed by current or potential land owners. If we accept the relationship between parcel fragmentation parameters and land value as obvious, we can pose the question: How much will the changes in these parameters affect changes in the value of land? This way of addressing the problem is in line with the findings of numerous existing studies into the impact of land fragmentation on production profitability in the different branches of agriculture or general conditions of agriculture [20,21,22,23].

2. Materials and Methods

In order to run a simulation of the impact of changes in selected parameters of parcels on the value of agricultural land, data on the market sale of agricultural properties in 10 municipalities located in six Polish regions (Figure 2) were used: Little Poland (Szczurowa and Jordanów municipalities), Lublin (Łopiennik Górny municipality), Silesia (Lelów, Pilica and Mykanów municipalities), Lower Silesia (Mściwojów and Gaworzyce municipalities), Mazovian (Strzegowo municipality), and Opole (Opole municipality).
Based on the information obtained from relevant county offices maintaining registers of property prices and values, unbuilt agricultural parcels sold on the market over the period 2018–2019 (292 transactions in total) were selected. Next, a database was created with each transaction described using information about the surface area and structure of the agricultural areas, the price, date, and parties involved in the transaction, as well as the location (voivodeship, tax district, municipality, cadastral region, and parcel number). Upon verification of the initial list of transactions using maps and aerial photographs, built-up parcels and parcels located within residential areas or in areas designated for building were rejected. Only those parcels that were used for agricultural purposes as confirmed by aerial photographs were left for further analysis (270 transactions). Each transaction was described with an additional set of characteristics derived from cadastral maps and orthophotomaps. Thus, the initial data sets were enriched with geometry information: length, width, and perimeter of each sold parcel. Moreover, the parcels were assessed in terms of their shape, detailed location, vicinity, access to a public road, obstacles to usage, level of agricultural condition, and distance from the nearest built-up area. These are the aspects that based on both literature review and the authors’ experience [6,19] could be considered as having a potentially significant impact on prices and values.
Two models were used to assess the impact of market characteristics on the value of parcels: the multiple regression analysis model (MRA) and the artificial neural network model (ANN). The MRA model captures the relationships between parcel characteristics and their market value. Unfortunately, due to its specificity, the model does not capture non-linear relationships, which also appear between the analyzed feature and the variables that characterize it. In order to capture such relationships, ANNs were used to complement the results of regression. ANNs are a tool that can be used wherever non-linear and non-monotonic relationships occur [24,25].
The list of predictors was established based on the theoretical premises of agricultural land valuation and initial results of market analyses conducted by filtering observations by variants of the characteristics, generating plots, and analysis of variance. Initially, these were the 10 features of the property: tax region, general location, detailed location, soil quality, share of arable land, obstacles to usage, vicinity, surface area, parcel elongation, and access to a public road (Table 1). The authors followed the principle of modeling simplicity [26], the generalized form of which is known under the name of Ockham’s razor: in explaining phenomena one should seek simplicity, choosing those explanations that are based on the least number of assumptions and concepts. With reference to statistical models, this principle can be understood as follows: if several different models explain a phenomenon in question to a similar extent, one should choose the model that is conceptually simpler. In this context, in the case of regression, preference was given to a linear model, with the necessary minimum number of predictors ensured by a stepwise procedure. The multiple regression analysis model (MRA) is conceptually simpler and easier to interpret than non-linear regression models. Numerous references to the practical application of such a model in real estate market analyses can be found in Polish and international literature [27,28,29,30,31,32,33,34,35,36,37,38,39,40,41,42,43]. In recent decades, such models were used to determine real estate value, and they provided satisfactory results. There are known MRA models that made it possible, thanks to the stepwise procedure, to find out which factors impact agricultural properties and to what extent [35,44].
In the case of the neural network, preference was given to its simplest architectures, with the necessary minimum number of predictors ensured by analysis of network sensitivity. At the same time, the authors, in accordance with the aim of the study, bore in mind the need to take into account those market characteristics that undergo significant changes as a result of the implementation of a land consolidation project.
Based on initial analyses, it was found that constructing a useful regression model for the full set of observations (270 transactions) was impossible. As far as surface area was concerned, it showed a non-monotonic impact on the market value of parcels: the smallest and the largest parcels were the most expensive. Consequently, this feature was not taken into consideration in the linear regression model. In addition, in the stepwise procedure, the following factors were eliminated from the MRA model: tax region and soil quality. Despite numerous attempts and deletion of outlier observations, these factors remained insignificant for MRA.
Apart from the verification of the individual predictors, it was also necessary to conduct an analysis of residuals and to reject a certain percentage of observations for which the models were unable to predict the values correctly. The analysis of residuals was conducted as part of the construction of the MRA model. The set of observations selected as part of this analysis was used to determine the forms of both the models.
The results of the analyses conducted as part of the construction of the MRA model were used in the ANN model. The latter provided more details to and supplemented the mathematical relationships presented by the regression equation. Surface area was expressed by means of five classes based on the assumption that change in surface area by one unit does not cause such marked changes in prices as change in surface area by a class (e.g., transition from the category of mid-sized parcels to the category of large parcels). Apart from surface area, the model also takes into account soil quality and location in a tax region.
The MRA and ANN models were developed using Statistica 13 with Data Mining module. With regards to the MRA model, the option of multiple forward selection stepwise regression was used, whereas with regards to the ANN model there is the option of ANNs.

2.1. Linear Regression

The linear mathematical model of multiple regression specifies the linear relationship between the dependent variable (Y) and the independent variables X1, X2, and Xi as outlined in the formula below:
Y = β0 + β1X1 + β2X2 + … + βiXi + ξ
where:
  • Y—dependent variable
  • β0—intercept
  • β1, β2, βk—independent variables’ coefficients
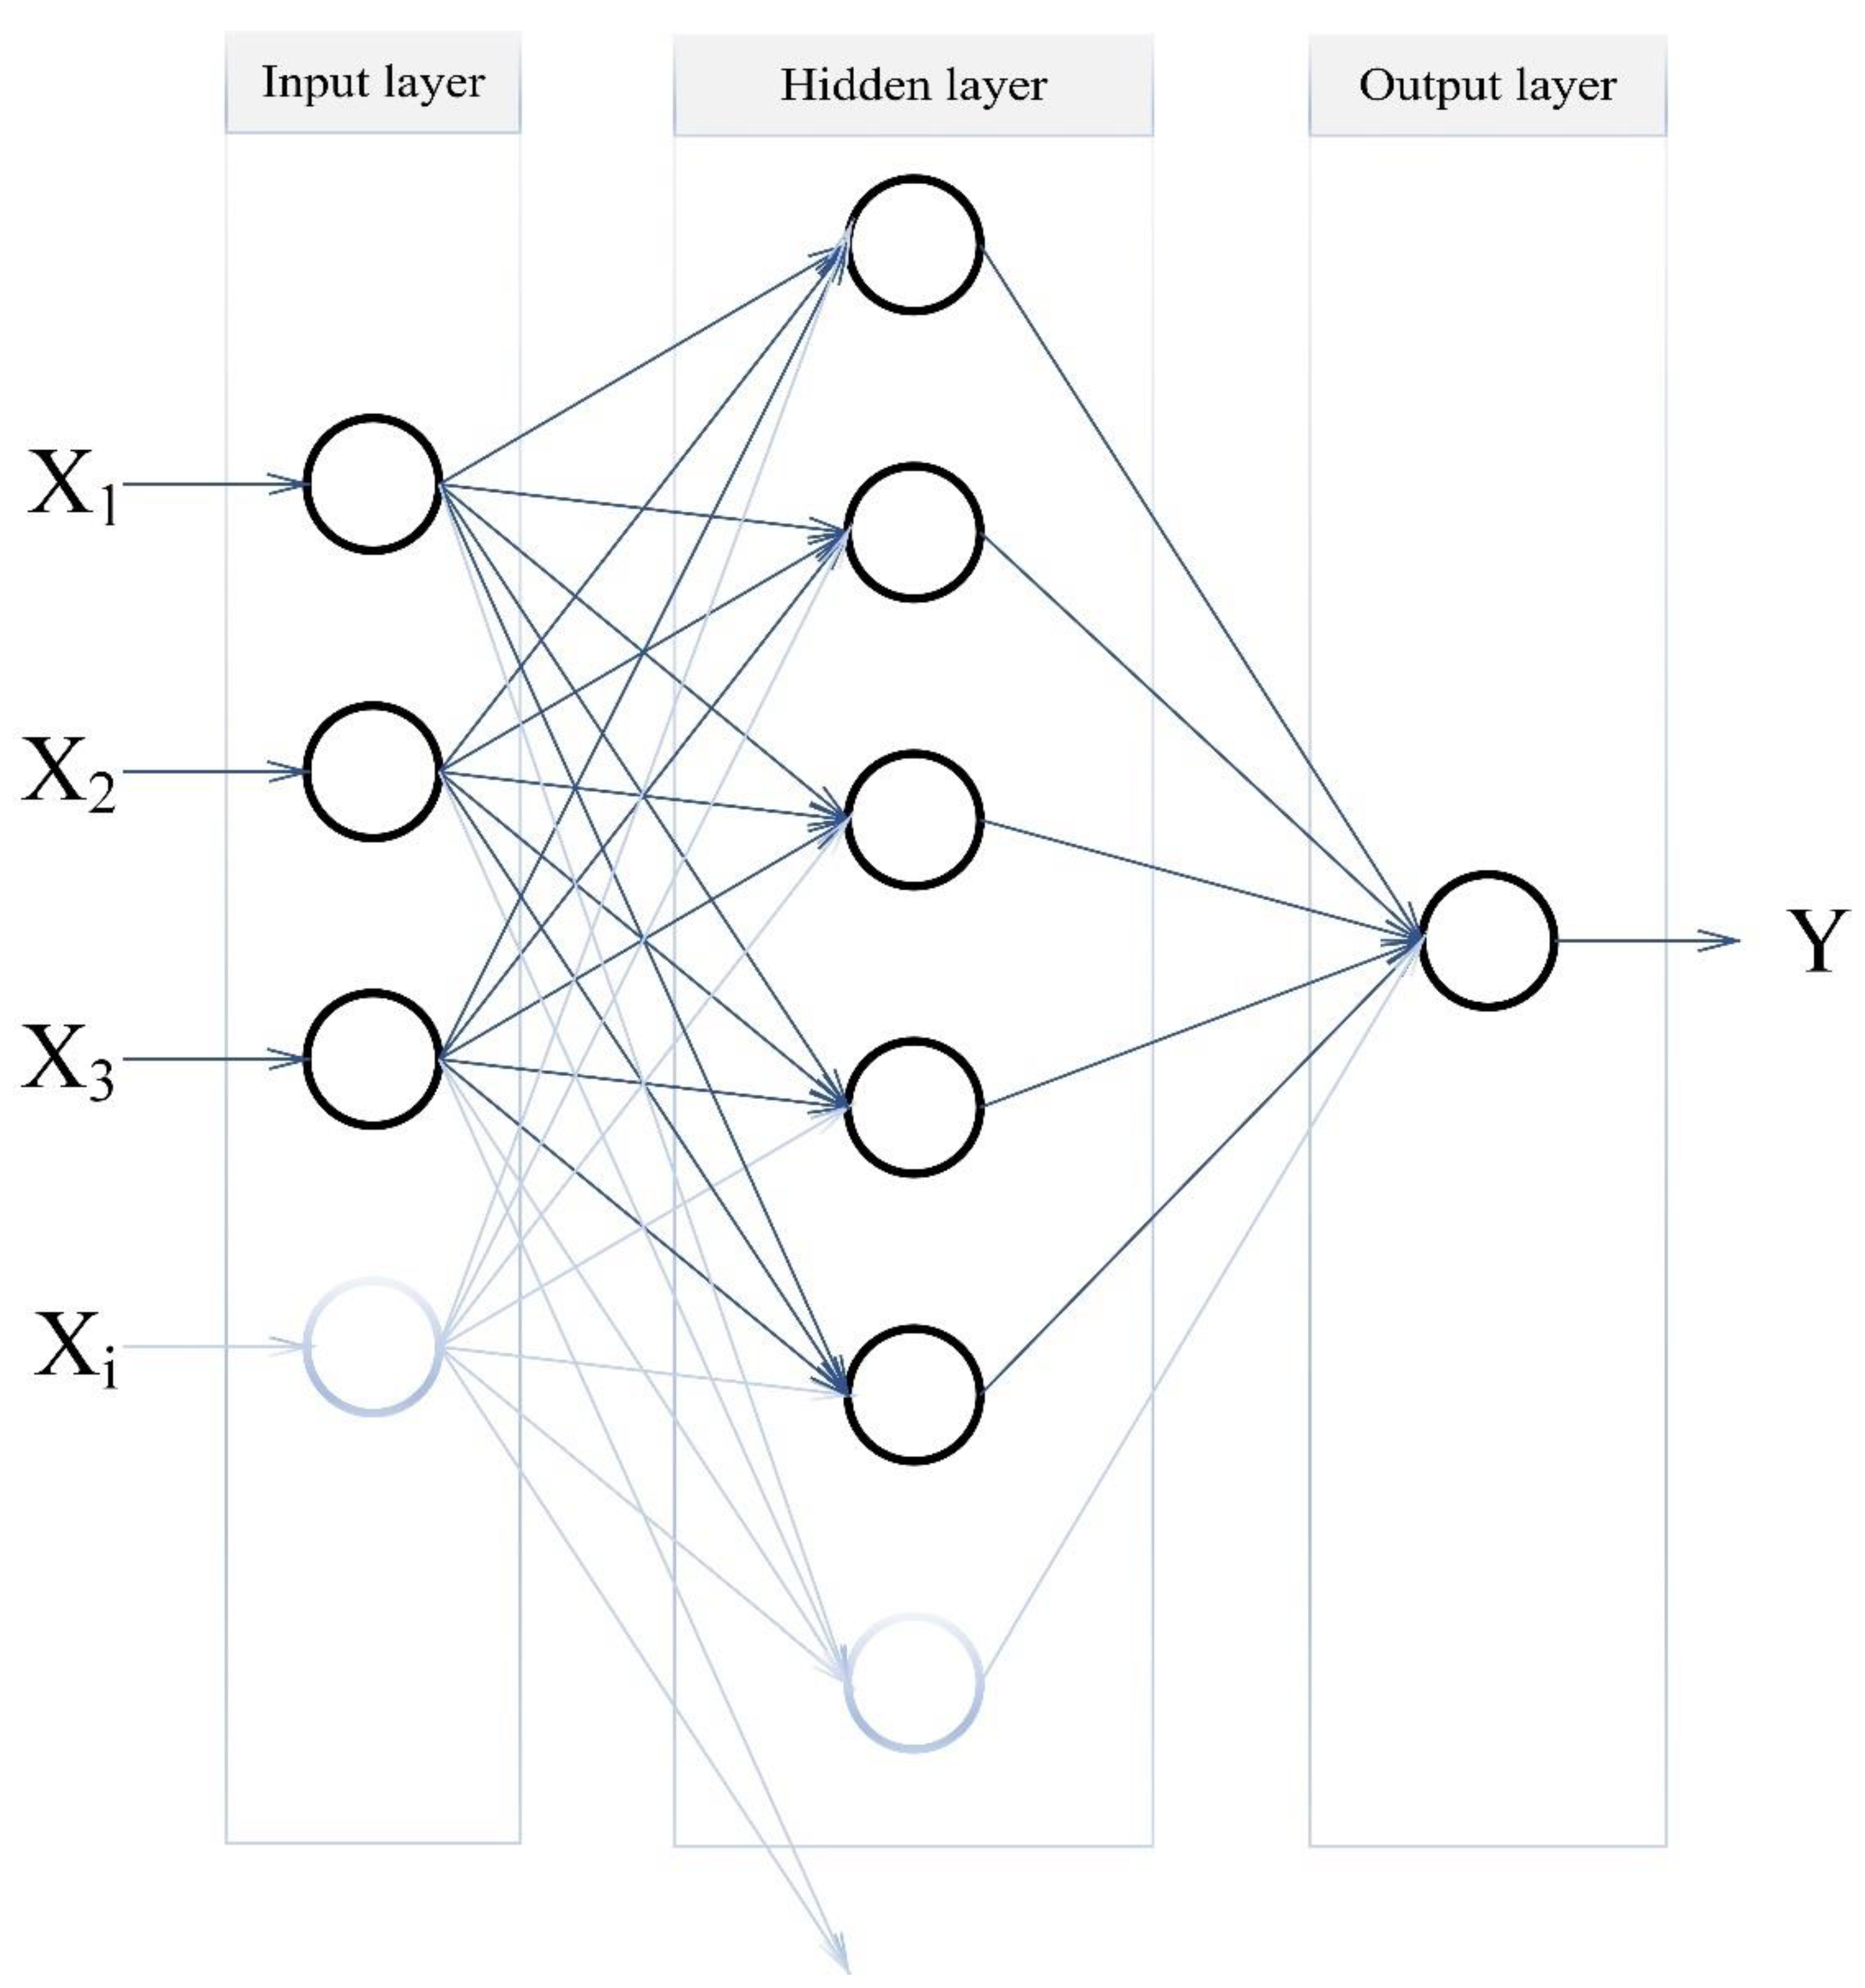
  • X1, X2, Xi—independent variables
  • ξ—random component
The parameters of the regression model were estimated by using the least-squares method.
In accordance with the methodological assumptions, the method of forward selection stepwise regression was used, which enables inclusion into the model of only those predictors that explain the dependent variable in a statistically significant way. The analysis of residuals was conducted using the model of multiple linear regression. Deletion of outlier observations brought positive results in subsequent regression models: coefficient of determination R2 changed as follows:
  • 270 observations—0.40
  • 215 observations—0.64
  • 203 observations—0.68
The regression model built for 203 observations passed a substantive verification. It showed conformity of regression coefficient signs with the theory and practice of valuation (Table 2). Statistical verification: global F-test and Student’s t-tests for each used explanatory variable (Table 2) also yielded a positive result. The model also respected the lower limit of the acceptable number of observations for regression. This number should not be less than 3 × (number of predictors + 1) [45]. The model predicted price volatility with 68% accuracy.

2.2. Artificial Neural Networks

Neural networks (ANN) represent an analytical technique modeled on the cognitive system and neurological functions of the brain. First references to neural networks date back to the 1950s, when an attempt was made to present a computing model of the internal processes of the human brain [46]. However, due to limited computing power and insufficient data, the potential of neural networks has not been fully exploited until recent decades [47]. Currently, neural networks are among the most popular tools of artificial intelligence [48].
The neural network used in the present study acquired the ability to predict the values of agricultural parcels based on the predictors fed at its input, after a training process was performed based on gathered market data (203 observations selected as part of the analysis of residuals). The size and structure of the network was determined by the complexity of the phenomenon under study. Although network layers can theoretically consist of any number of neurons, the principle of modeling simplicity had to be followed here as well. A more complex network analyzes more input variables, but it also requires more observations [49]. This is because, generally, each used predictor corresponds to one input neuron.
The connections between a network’s neurons are assigned randomly selected weights when the training process is started. As successive examples are presented to the network, these weights are iteratively adjusted so that the differences between the network’s predictions and the actual values could be the smallest [26,50].
For the purpose of constructing the network, the data were divided into three sub-sets in the following proportions:
-
training set: 70%
-
test set: 15%
-
validation set: 15%
The division of data into subsets reflects how a neural network works. A training set is used to modify randomly selected weights of the connections between neurons. A test set is designed to monitor the training process on a continuous basis (assessment of the network’s approximation capability). A validation set is used to assess the network after the training process is completed (generalization capability).
Of several dozens of networks tested concurrently over 200 epochs, the best results were achieved by multilayer perceptron (MLP). This network model is among the most commonly used [25]. It consists of interconnected units, called perceptrons or nodes, which are arranged in layers (Figure 3). The first layer is input data (or independent variables), the last layer is the output layer, and the layers in between are called hidden layers [51].
The model had one hidden layer numbering 11 neurons. The network was trained using the Broyden–Fletcher–Goldfarb–Shanno optimization algorithm (BFGS) as the criterion for seeking the minimum of the error function and the sum of squares (SoS) as its preferred function. The Sum of Squares (SoS) function typically has the formula:
ESoS = i = 1 n ( Y i t i ) 2
where:
  • Yi—predicted values,
  • ti—actual values,
  • n—number of observation
For hidden neurons, the activation function was the hyperbolic tangent, whereas for the output neuron, it was the linear function. These were the recommended settings for multilayer perceptrons solving regression problems using the sum of squares as an error function.

3. Results

The next stages of the computation process determined the values predicted by the mathematical form of the multiple regression analysis model (MRA) in different configurations of parcel elongations and access to a road. Then, predictions of the artificial neural network model (ANN) were computed by entering at its inputs data in different configurations of parcel elongations, classes of parcel surface areas, and road access. The results of the studies were presented separately for the model of multiple linear regression and the neural network model.

3.1. Multiple Linear Regression Model

The regression model constructed in accordance with the above-described methodology showed a satisfactory explanatory capacity of prices. The coefficient of determination R2 indicated that residual variation (resulting from the impact of unmodeled factors) was 32% of the total variation of the observed features. The model passed a global test, as evidenced by the value of the Fisher–Snedecor statistic (F = 61). The coefficients for explanatory variables were estimated with low standard errors and passed Student t-tests. Moreover, the MRA model, based on seven selected predictors, passed a substantive verifi-cation: regression coefficient signs indicated relationships consistent with the theory (Table 2).
Based on the data from Table 2, the mathematical form of the multiple linear regression model explaining how the values of agricultural parcels were established can be written as follows (Formula (1)):
Y = 20 , 811 + 9251 * X 1 + 6160 * X 2 56 * X 3 + 3413 * X 4 + 3590 * X 5 + 4948 * X 6 + 2497 * X 7
With a parcel elongation (feature X3), there was a negative regression coefficient. This confirmed an important fact from the perspective of consolidation assessment, namely: a decrease in excessive elongation of agricultural parcels led to an increase in their market value. The other features, when assuming higher values, contributed to an increase in the modeled market prices. Based on standardized regression coefficients (Table 2, Column 2), it was found out that location factors and the share of arable land were most significant in the process of value explanation. With respect to Table 1, the multiple regression model did not take into account location in a tax region, a parcel’s surface area (an important feature from the perspective of the conducted analyses), and soil quality. In the case of linear regression, these features were statistically insignificant even after analysis of residuals was conducted and outlier observations were removed.

3.2. Artificial Neural Network Model (ANN)

Another approach to estimating changes in the values of parcels resulting from the implementation of consolidation projects was the artificial neural network model. In the case of this method, the role of the individual predictors can be assessed based on a sensitivity analysis [52]. This is a network’s functionality that enables evaluation of the contribution of the individual predictors to explain how the prices of parcels were established (Table 3). Of particular importance were a parcel’s access to a public road and location factors (general location—in a given municipality, in the village, and in a given tax region).
Other important factors included soil quality, obstacles to usage, and a parcel’s vicinity. A less important role as compared to the other predictors was played, according to the network, by surface area, share of arable land, and a parcel elongation. For the neural network model, the correlation levels between the actual and predicted values were as follows: 0.89—for the training set, 0.82—for the test set, and 0.80—for the validation set. The principle is that the result for the validation set should not deviate significantly from the result for the test set. Then, it can be acknowledged that the network generalizes the data structure well and will work well with completely new data.

3.3. Simulation of the Change in the Values of Agricultural Parcels with a Change in Their Elongation, Surface Area, and Access to a Public Road

Once the final forms of both the models were determined and verified, a simulation was run of the changes in the value of 1 ha of agricultural land as a result of adjusting the parcel’s surface area, elongation, and providing it with a public road access. These are the features that change as a result of consolidation [53]. In the case of the multiple linear regression model, potential effects of consolidation projects were assessed for different configurations of parcels’ elongation and road access. In the case of the artificial neural network (ANN), data in various configurations of parcels’ elongation, size classes, and road access were fed at the input. The results of these simulations were (Table 4) presented separately for the multiple linear regression model and the artificial neural network model. The computations were carried out assuming that other important factors with a potential impact on market prices were constant (100% share of agricultural land, peripheral location, no buildings in the vicinity, no obstacles to usage, and moderate quality of soil). A sample result of such estimation was presented for the municipality Gaworzyce (Lower Silesia voivodeship, Poland). With respect to other market characteristics, it was assumed that a hypothetical parcel is characterized by a 100% share of arable land, peripheral location, no buildings in the vicinity, no obstacles to usage, and moderate soil quality.
The simulations run using both the models presented a positive impact of the change in agricultural parcels’ parameters on the changes in parcels’ values. Both the regression model and neural network model showed that the value of 1 ha of agricultural land increased significantly when a parcel was provided with a road access and its excessive elongation was reduced. In the analyzed sample of the municipality Gaworzyce, the value of 1 ha of agricultural land, once the parcel’s elongation was corrected and the parcel was provided with an access to a public road, increased, according to the regression model, by about PLN 10.5 thousand (i.e.: a–b). The neural network predicted the same effect at the level of PLN 24.5 thousand (for large parcels, i.e., c–d) to PLN 28 thousand (for very small parcels, i.e., e–f). In addition to that, the neural network model revealed a non-monotonic impact of the changes in a parcel’s size on the value of consolidated agricultural land. The biggest value was assigned by the neural network to very small parcels. Small parcels (in various variants of elongation and access to a road) were cheaper than very small parcels by PLN 3.3 thousand/ha (i.e., f–g) to PLN 4.3 thousand/ha (i.e., e–h). The neural network model indicated that the values of very big parcels were comparable to those of the smallest parcels. An interesting conclusion resulting from this simulation for the practical implementation of consolidation projects in the municipality Gaworzyce was as follows: to maximize the increase of the value of consolidated land, possibly the largest parcels should be designed. As Table 4 shows, even if consolidation projects implemented in the municipality Gaworzyce resulted in the elimination of very small parcels (up to 0.5 ha), which were replaced by small parcels (from 0.5 to 1 ha), middle-sized parcels (from 1 to 2 ha), or large parcels (from 2 to 3 ha), their lower value would be offset by the elimination of their excessive elongation and providing them with an access to public roads.

4. Discussion

Both the approaches used for assessing the impact of the changes in parcels’ features on their value can be used to assess this phenomenon separately for each of the analyzed municipalities. The regression model did not take into account a parcel’s size. Yet, it showed clearly that as the elongation of parcels increases, their values decrease. A road access was also significant here.
A fuller assessment of the effects of the changes in parcels’ parameters was provided by the neural network model. Because this approach can show non-linear and non-monotonic relationships, it was possible to analyze the impact of the factor of a parcel’s size. It is worth stressing that the ANN model assessed this aspect individually for each local market—i.e., the area of a given municipality.
In the case of the municipality Gaworzyce, the smallest parcels (up to 0.5 ha) showed higher unit prices, with similar trends observed across all the analyzed municipalities. However, based on the model, the largest parcels (>3 ha) had almost the same value on the local markets as the smallest ones. This relationship between the value of a parcel and its size can be explained by the fact that small-sized parcels are concentrated in areas where the construction of single-family houses is often likely in the future, even though the current regulations do not provide for such a possibility. The high price (per unit area) of large parcels is connected to their much better agricultural suitability, both with respect to current economic activity and in the context of greater potential interest in the purchase of such parcels by those wishing to expand their farms through purchase or lease of land.
Similar conclusions were drawn in the past by other scholars, who pointed out that a property’s size impacts the attractiveness of parcels and the possibility of using them for specific purposes [54]. In agriculture, a parcel’s size determines the amount of labor. Large parcels with regular shapes make it easier to carry out agrotechnical operations. Surface area is one of the most important features taken into account when estimating the value of agricultural land [55]. According to [56], the prices of larger parcels are often lower, whereas the prices of smaller parcels per unit area are higher.
The ANN model showed that in the municipality Gaworzyce (as well as in the other municipalities where market analysis was conducted), parcels with a model elongation and a road access across all the size classes had a relatively higher value (similar relationship was presented by the MRA model). The impact of the shape of parcels on the effects of agricultural works, as well as on the prices of agricultural land, is highlighted in numerous academic works [57,58]. A parcel’s elongation, which is determined by the ratio of the parcel’s width to its length, impacts the duration of the work in the fields and the loss in yields [59]. Similarly, the effectiveness of the work in the fields is impacted by the shape of the agricultural property. According to [60], the shape of a parcel should be based on a statistical similarity to a rectangle. Parcels with regular shapes make it easier to carry out agrotechnical operations. According to [16], the shape and slope of a parcel may significantly determine the prices of agricultural land.
The sensitivity analysis showed that the neural network assigned considerable importance to the issue of access to a public road. This observation was confirmed in the simulations that were run (Table 4). In each size class of parcels and with each variant of elongation, the differences in parcels’ values in that respect were significant.
The results confirm the principle already indicated in the literature [61] that in the case of little diversity in a given cadastral region in terms of climatic, water, and soil conditions, the impact of location on the prices of agricultural properties increases. In such areas, the prices are most determined by distance-related location factors, i.e., distance from settlement development, distance from the municipality center, and distance from a hard paved road, as well as morphometric characteristics, the size and shape of a parcel [62].

5. Conclusions

Based on the simulations, it can be concluded that a change in value is significantly determined by the range of changes in parcel features such as size, shape, and access to a road. The impact of changes in surface area on the value of 1 ha of agricultural land is non-monotonic: the most expensive were the smallest and the largest parcels. Potential decreases in the value of agricultural parcels as a result of changes in their surface areas are successfully offset by elimination of the excessive elongation of parcels and providing an access to a public road.
Although the results were presented for only one municipality, it is worth highlighting the significant importance of general location—this feature had a large impact on the value of agricultural land, according to MRA and ANN models. The created models enable assessment of the impact of the implementation of a consolidation project on the value of agricultural land in w given region. Identifying universal rules seems difficult due to wide regional variations of the factors impacting the prices of agricultural properties and their changeability over a longer period of time. However, an attempt at such a universal approach can and should be a subject of future research using a range of parameters that adjust the model of changes in the value of land to local conditions.
Having said that, change in the value of land should be considered one of the effects of implemented land consolidation projects, during which the parameters of agricultural land are subject to the greatest changes.

Author Contributions

Conceptualization: M.D., T.W. and J.J.; methodology: M.D.; software: M.D. and J.J.; validation: J.T. and A.D.; formal analysis: M.D. and T.W.; investigation: J.P.; resources: J.T.; data curation: A.D.; writing—original draft preparation: M.D. and A.D.; writing—review and editing: J.J.; visualization: A.D.; supervision: J.J.; project administration: J.P.; funding acquisition: J.P. All authors have read and agreed to the published version of the manuscript.

Funding

The research and APC was funded by the Polish Ministry of Science and Higher Education for the University of Agriculture in Krakow for 2020.

Institutional Review Board Statement

Not applicable.

Informed Consent Statement

Not applicable.

Data Availability Statement

The data presented in this study are available on request from the corresponding author.

Conflicts of Interest

The authors declare no conflict of interest.

References

  1. Prus, P. Sustainable Farming Production and Its Impact on the Natural Environment—Case Study Based on a Selected Group of Farmers. In 8th International Scientific Conference on Rural Development—Bioeconomy Challenges; Raupeliene, A., Ed.; Aleksandras Stulginskis University: Akademija, Lithuania, 2017; pp. 1280–1285. [Google Scholar]
  2. Farms and Farmland in the European Union—Statistics. Available online: https://ec.europa.eu/eurostat/statistics-explained/index.php?title=Farms_and_farmland_in_the_European_Union_-_statistics (accessed on 3 April 2021).
  3. Ertunç, E. Analysis of the effect of land consolidation projects in terms of land fragmentation and parcel shapes: The case of Konya, Turkey. Arab J. Geosci. 2020, 13, 350. [Google Scholar] [CrossRef]
  4. Woch, F. Organizacja Przestrzenna Gospodarstw Rolniczych Oraz Jej Wpływ na Efektywność Gospodarowania. Studia I Rap. Iung Pib 2007, 7, 117–137. [Google Scholar]
  5. Heinrichs, J.; Kuhn, T.; Pahmeyer, C.; Britz, W. Economic effects of plot sizes and farm-plot distances in organic and conventional farming systems: A farm-level analysis for Germany. Agric. Syst. 2021, 187, 102992. [Google Scholar] [CrossRef]
  6. Wojewodzic, T.; Janus, J.; Dacko, M.; Pijanowski, J.; Taszakowski, J. Measuring the effectiveness of land consolidation: An economic approach based on selected case studies from Poland. Land Use Policy 2020, 100, 1–10. [Google Scholar] [CrossRef]
  7. Rahman, S.; Rahman, M. Impact of land fragmentation and resource ownership on productivity and efficiency: The case of rice producers in Bangladesh. Land Use Policy 2009, 26, 95–103. [Google Scholar] [CrossRef] [Green Version]
  8. Hiironen, J.; Riekkinen, K. Agricultural impacts and profitability of land consolidations. Land Use Policy 2016, 55, 309–317. [Google Scholar] [CrossRef]
  9. Bizimana, C.; Nieuwoudt, W.L.; Ferrer, S.R. Farm Size, Land Fragmentation and Economic Efficiency in Southern Rwanda. Agrekon 2004, 43, 244–262. [Google Scholar] [CrossRef]
  10. Nguyen, L.D.; Raabe, K.; Grote, U. Rural-Urban Migration, Household Vulnerability, and Welfare in Vietnam. World Dev. 2015, 71, 79–93. [Google Scholar] [CrossRef]
  11. Van der Zanden, E.H.; Verburg, P.H.; Schulp, C.J.E.; Verkerk, P.J. Trade-offs of European agricultural abandonment. Land Use Policy 2017, 62, 290–301. [Google Scholar] [CrossRef]
  12. Lasanta, T.; Arnáez, J.; Pascual, N.; Ruiz-Flaño, P.; Errea, M.P.; Lana-Renault, N. Space–time process and drivers of land abandonment in Europe. Catena 2017, 149, 810–823. [Google Scholar] [CrossRef]
  13. Renwick, A.; Jansson, T.; Verburg, P.H.; Revoredo-Giha, C.; Britz, W.; Gocht, A.; McCracken, D. Policy Reform and Agricultural Land Abandonment in the EU. Land Use Policy 2013, 30, 446–457. [Google Scholar] [CrossRef]
  14. Choumert, J.; Phélinas, P. Determinants of agricultural land values in Argentina. Ecol. Econ. 2015, 110, 134–140. [Google Scholar] [CrossRef] [Green Version]
  15. Huang, H.; Miller, G.Y.; Sherrick, B.J.; Gómez, M.I. Factors influencing Illinois farmland values. Am. Agric. Econ. Assoc. 2006, 88, 458–470. [Google Scholar] [CrossRef]
  16. Salamon, J. Analysis of factors affecting prices of agricultural and building plots on an example of Bochnia commune. Infrastruktura i Ekologia Terenów Wiejskich 2010, 2, 185–191. [Google Scholar]
  17. Salata, T.; Prus, B.; Janus, J. Planning as trigger for land use changes. Eng. Rural Dev. 2015, 14, 729–734. [Google Scholar]
  18. Siejka, M. Attempt of applying ahp method to evaluate the influence of changes of real estate features on the estate value. Infrastrukt. I Ekol. Teren. Wiej. 2010, 12, 93101. [Google Scholar]
  19. Efektywność Ekonomiczna Scaleń Gruntów w Polsce. Available online: https://scalenia.urk.edu.pl/zasoby/207/Efektywnosc_ekonomiczna_scalen_gruntow_w_Polsce.pdf (accessed on 3 April 2021).
  20. Wojewodzic, T. Procesy Dywestycji i Dezagraryzacji w Rolnictwie o Rozdrobnionej Strukturze Agrarnej; Zeszyty Naukowe Uniwersytetu Rolniczego im. Hugona Kołłątaja w Krakowie Series 535; Wydawnictwo Uniwersytetu Rolniczego: Kraków, Poland, 2017. [Google Scholar]
  21. Satoła, Ł.; Wojewodzic, T.; Sroka, W. Barriers to exit encountered by small farms in light of the theory of new institutional economics. Agric. Econ. Zemed. Ekon. 2018, 64, 277–290. [Google Scholar]
  22. Latruffe, L.; Piet, L. Does land fragmentation affect farm performance? A case study from Brittany, France. Agric. Syst. 2014, 129, 68–80. [Google Scholar] [CrossRef]
  23. Manjunatha, A.V.; Anik, A.R.; Speelman, S.; Nuppenau, E.A. Impact of land fragmentation, farm size, land ownership and crop diversity on profit and efficiency of irrigated farms in India. Land Use Policy 2013, 31, 397–405. [Google Scholar] [CrossRef]
  24. Lanillos, P.; Oliva, D.; Philippsen, A.; Yamashita, Y.; Nagai, Y.; Cheng, G. A review on neural network models of schizophrenia and autism spectrum disorder. Neural Netw. 2020, 122, 338–363. [Google Scholar] [CrossRef] [PubMed]
  25. Pizarroso, J.; Portela, J.; Muñoz, A. NeuralSens: Sensitivity Analysis of Neural Networks. arXiv 2020, arXiv:2002.11423. Available online: https://arxiv.org/abs/2002.11423 (accessed on 3 April 2021).
  26. Szaleniec, M. Sieci neuronowe i regresja wieloraka—Czyli jak okiełznać złożoność w badaniach naukowych. In Zastosowania Statystyki i Data Mining w Badaniach Naukowych; Wątroba, J., Ed.; Statsoft: Kraków, Poland, 2008; pp. 69–86. [Google Scholar]
  27. Bruce, R.W.; Sundell, D.J. Multiple regression analysis: History and applications in the appraisal profession. Real Estate Appraiser 1977, 43, 37–44. [Google Scholar]
  28. Eckert, J.K. Property Appraisal and Assessment Administration; International Association of Assessing Officers: Chicago, IL, USA, 1990. [Google Scholar]
  29. Isakson, H.R. An Empirical Analysis of the Determinants of the Value of Vacant Land. J. Real Estate Res. 1997, 13, 103–114. [Google Scholar] [CrossRef]
  30. Cellmer, R. Zasady i Metody Analizy Elementów Składowych Rynku Nieruchomości; Wydawnictwo ART: Olsztyn, Poland, 1999. [Google Scholar]
  31. Dacko, M. Zastosowanie regresji wielokrotnej w szacowaniu nieruchomości w arkuszu kalkulacyjnym Microsoft Excel 2000. In Wycena: Wartość—Obrót—Zarządzanie Nieruchomościami; Wyd. Educaterra: Olsztyn, Poland, 2000. [Google Scholar]
  32. Czaja, J. Metody Szacowania Wartości Rynkowej i Katastralnej; Komp-System: Kraków, Poland, 2001. [Google Scholar]
  33. Hozer, J. Regresja Wieloraka a Wycena Nieruchomości. Rzeczoznawca Majątkowy 2001, 2, 13–14. [Google Scholar]
  34. Dacko, M.; Lendzion, M. Modelowanie cen nieruchomości za pomocą regresji wielorakiej i sztucznych sieci neuronowych. In Wycena; Wyd. Educaterra: Olsztyn, Poland, 2003; Volume 3. [Google Scholar]
  35. Śnieg, R. Czynniki i Cechy Kształtujące Sprzedaż i Dzierżawę Nieruchomości Rolnych Skarbu Państwa. Ph.D. Thesis, UWM, Olsztyn, Poland, 2003. [Google Scholar]
  36. Benjamin, J.D.; Randall, S.; Guttery, R.S.; Sirmans, C.F. Mass Appraisal: An Introduction to Multiple Regression Analysis for Real Estate Valuation. J. Real Estate Pract. Educ. 2004, 7, 65–77. [Google Scholar] [CrossRef]
  37. Sirmans, G.S.; Macpherson, D.A.; Zietz, E.N. The Composition of Hedonic Pricing Models. J. Real Estate Lit. 2005, 13, 3–46. [Google Scholar]
  38. Adamczewski, Z. Elementy Modelowania Matematycznego w Wycenie Nieruchomości. Podejście Porównawcze, 2nd ed.; Oficyna Wydawnicza Politechniki Warszawskiej: Warszawa, Poland, 2011; pp. 51–52. [Google Scholar]
  39. Surowiec, G. Aspekty Geodezyjno-Przestrzenne w Badaniach Rynku Nieruchomości. Ph.D. Thesis, Politechnika Warszawska, Warszawa, Poland, 2006. [Google Scholar]
  40. Bitner, A. Konstrukcja modelu regresji wielorakiej przy wycenie nieruchomości. Acta Sci. Pol. Adm. Locorum 2007, 6, 59–66. [Google Scholar]
  41. Barańska, A. Statystyczne Metody Analizy i Weryfikacji Proponowanych Algorytmów Wyceny Nieruchomości; Rozprawy i Monografie Wydawnictwa AGH: Kraków, Poland, 2010. [Google Scholar]
  42. Sawiłow, E. Problematyka określania wartości nieruchomości metodą analizy statystycznej rynku. Studia I Mater. Tow. Nauk. Nieruchom. 2010, 8, 21–32. [Google Scholar]
  43. Prus, B. Assessment of information from real estate markets with help of multiple regression analysis models. Infrastruct. Ecol. Rural Areas 2010, 3, 103–113. [Google Scholar]
  44. Walkowiak, R.; Zydroń, A. Zastosowanie regresji krokowej do określenia atrybutów wpływających na wartość nieruchomości rolnych na przykładzie gminy Mosina. Acta Sci. Pol. Adm. Locorum 2012, 11, 239–253. [Google Scholar]
  45. Kot, S.M.; Jakubowski, J.; Sokołowski, A. Statystyka, 2nd ed.; Difin: Warszawa, Poland, 2011; pp. 108–113. [Google Scholar]
  46. Rosenblatt, F. The perceptron: A probabilistic model for information storage and organization in the brain. Psychol. Rev. 1958, 65, 386. [Google Scholar] [CrossRef] [Green Version]
  47. Schmidhuber, J. Deep learning in neural networks: An overview. Neural Netw. 2015, 61, 85–117. [Google Scholar] [CrossRef] [Green Version]
  48. Turkoglu, B.; Kaya, E. Training multi-layer perceptron with artificial algae algorithm. Eng. Sci. Technol. Int. J. 2020, 23, 1342–1350. [Google Scholar] [CrossRef]
  49. McCluskey, W.J. Zastosowanie sztucznej inteligencji w wycenie masowej dla potrzeb taksacji nieruchomości. Wycena 1996, 5, 3. [Google Scholar]
  50. Migut, G. Sieci Neuronowe. Statsoft Polska. Kraków, Poland. 2019. Available online: https://www.statsoft.pl/uslugi/kursy-i-szkolenia/programy-szkolen/sieci-neuronowe/ (accessed on 3 April 2021).
  51. Özesmi, S.L.; Özesmi, U. An artificial neural network approach to spatial habitat modelling with interspecific interaction. Ecol. Model. 1999, 116, 15–31. [Google Scholar] [CrossRef]
  52. Yang, J.; Yang, J.; Zeng, X.; Zhong, S. Computation of multilayer perceptron sensitivity to input perturbation. Neurocomputing 2013, 99, 390–398. [Google Scholar] [CrossRef]
  53. Janus, J.; Markuszewska, I. Land consolidation—A great need to improve effectiveness. A case study from Poland. Land Use Policy 2017, 65, 143–153. [Google Scholar] [CrossRef]
  54. Prystupa, M. Valuation of Real Estate Using a Comparative Approach. Overview of the Standard with Examples of Tasks; Polska Federacja Stowarzyszeń Rzeczoznawców Majątkowych: Warszawa, Poland, 2001. [Google Scholar]
  55. Gardner, K.; Barrows, R. The impact of soil conservation investments on land Prices. Am. J. Agric. Econ. 1984, 67, 943–947. [Google Scholar] [CrossRef] [Green Version]
  56. Bitner, A. On the usefullness of statistical methods in real estate valuation. Infrastrukt. I Ekol. Teren. Wiej. 2010, 12, 145–158. [Google Scholar]
  57. Harasimowicz, S.; Bacior, S.; Gniadek, J.; Ertunç, E.; Janus, J. The impact of the variability of parameters related to transport costs and parcel shape on land reallocation results. Comput. Electron. Agric. 2021, 185, 106137. [Google Scholar] [CrossRef]
  58. Wilkowski, W. Metodyka określania wartości gruntów rolnych wchodzących w skład gospodarstw rolnych objętych postępowaniem scaleniowym. Przegląd Geod. 2002, 7, 3–8. [Google Scholar]
  59. Noga, K. Methodology for programming merge works and technology for their implementation in mountain areas. Zeszyty Naukowe AR Kraków Rozprawy 1990, 143, 101. [Google Scholar]
  60. Ligęza, A. Parametrical description geometry and topography of parcels in GIS systems. Studia Inform. 2011, 32, 329–348. [Google Scholar]
  61. Sundquist, A. Property taxation in Sweden. Part IV. Przegląd Geodezyjny 2002, 4, 3–8. [Google Scholar]
  62. Maleta, M.; Całka, B. Metodyka wyboru czynników cenotwórczych w procesie opracowania map średnich cen gruntów rolnych dla obszarów wiejskich. Rocz. Geomatyki Ann. Geomat. 2019, 17, 147–170. [Google Scholar]
Figure 1. Factors and features affecting the market value of agricultural parcels taken into consideration in market analysis (including analyzed features that change as a result of consolidation projects: surface area and shape of a parcel and access to a public road).
Agriculture 11 00388 g001
Figure 2. Location of the analyzed municipalities against the map of Europe and Poland.
Agriculture 11 00388 g002
Figure 3. Generalized form of the artificial neural network model-multilayer perceptron.
Agriculture 11 00388 g003
Table 1. A list of predictors used for constructing the MRA and ANN models.
Predictor NameType and Values or Variants of the Predictor
Tax region *A discrete quantitative feature assuming four states in accordance with the list of municipalities and cities falling within the different tax regions: 1, 2, 3, and 4.
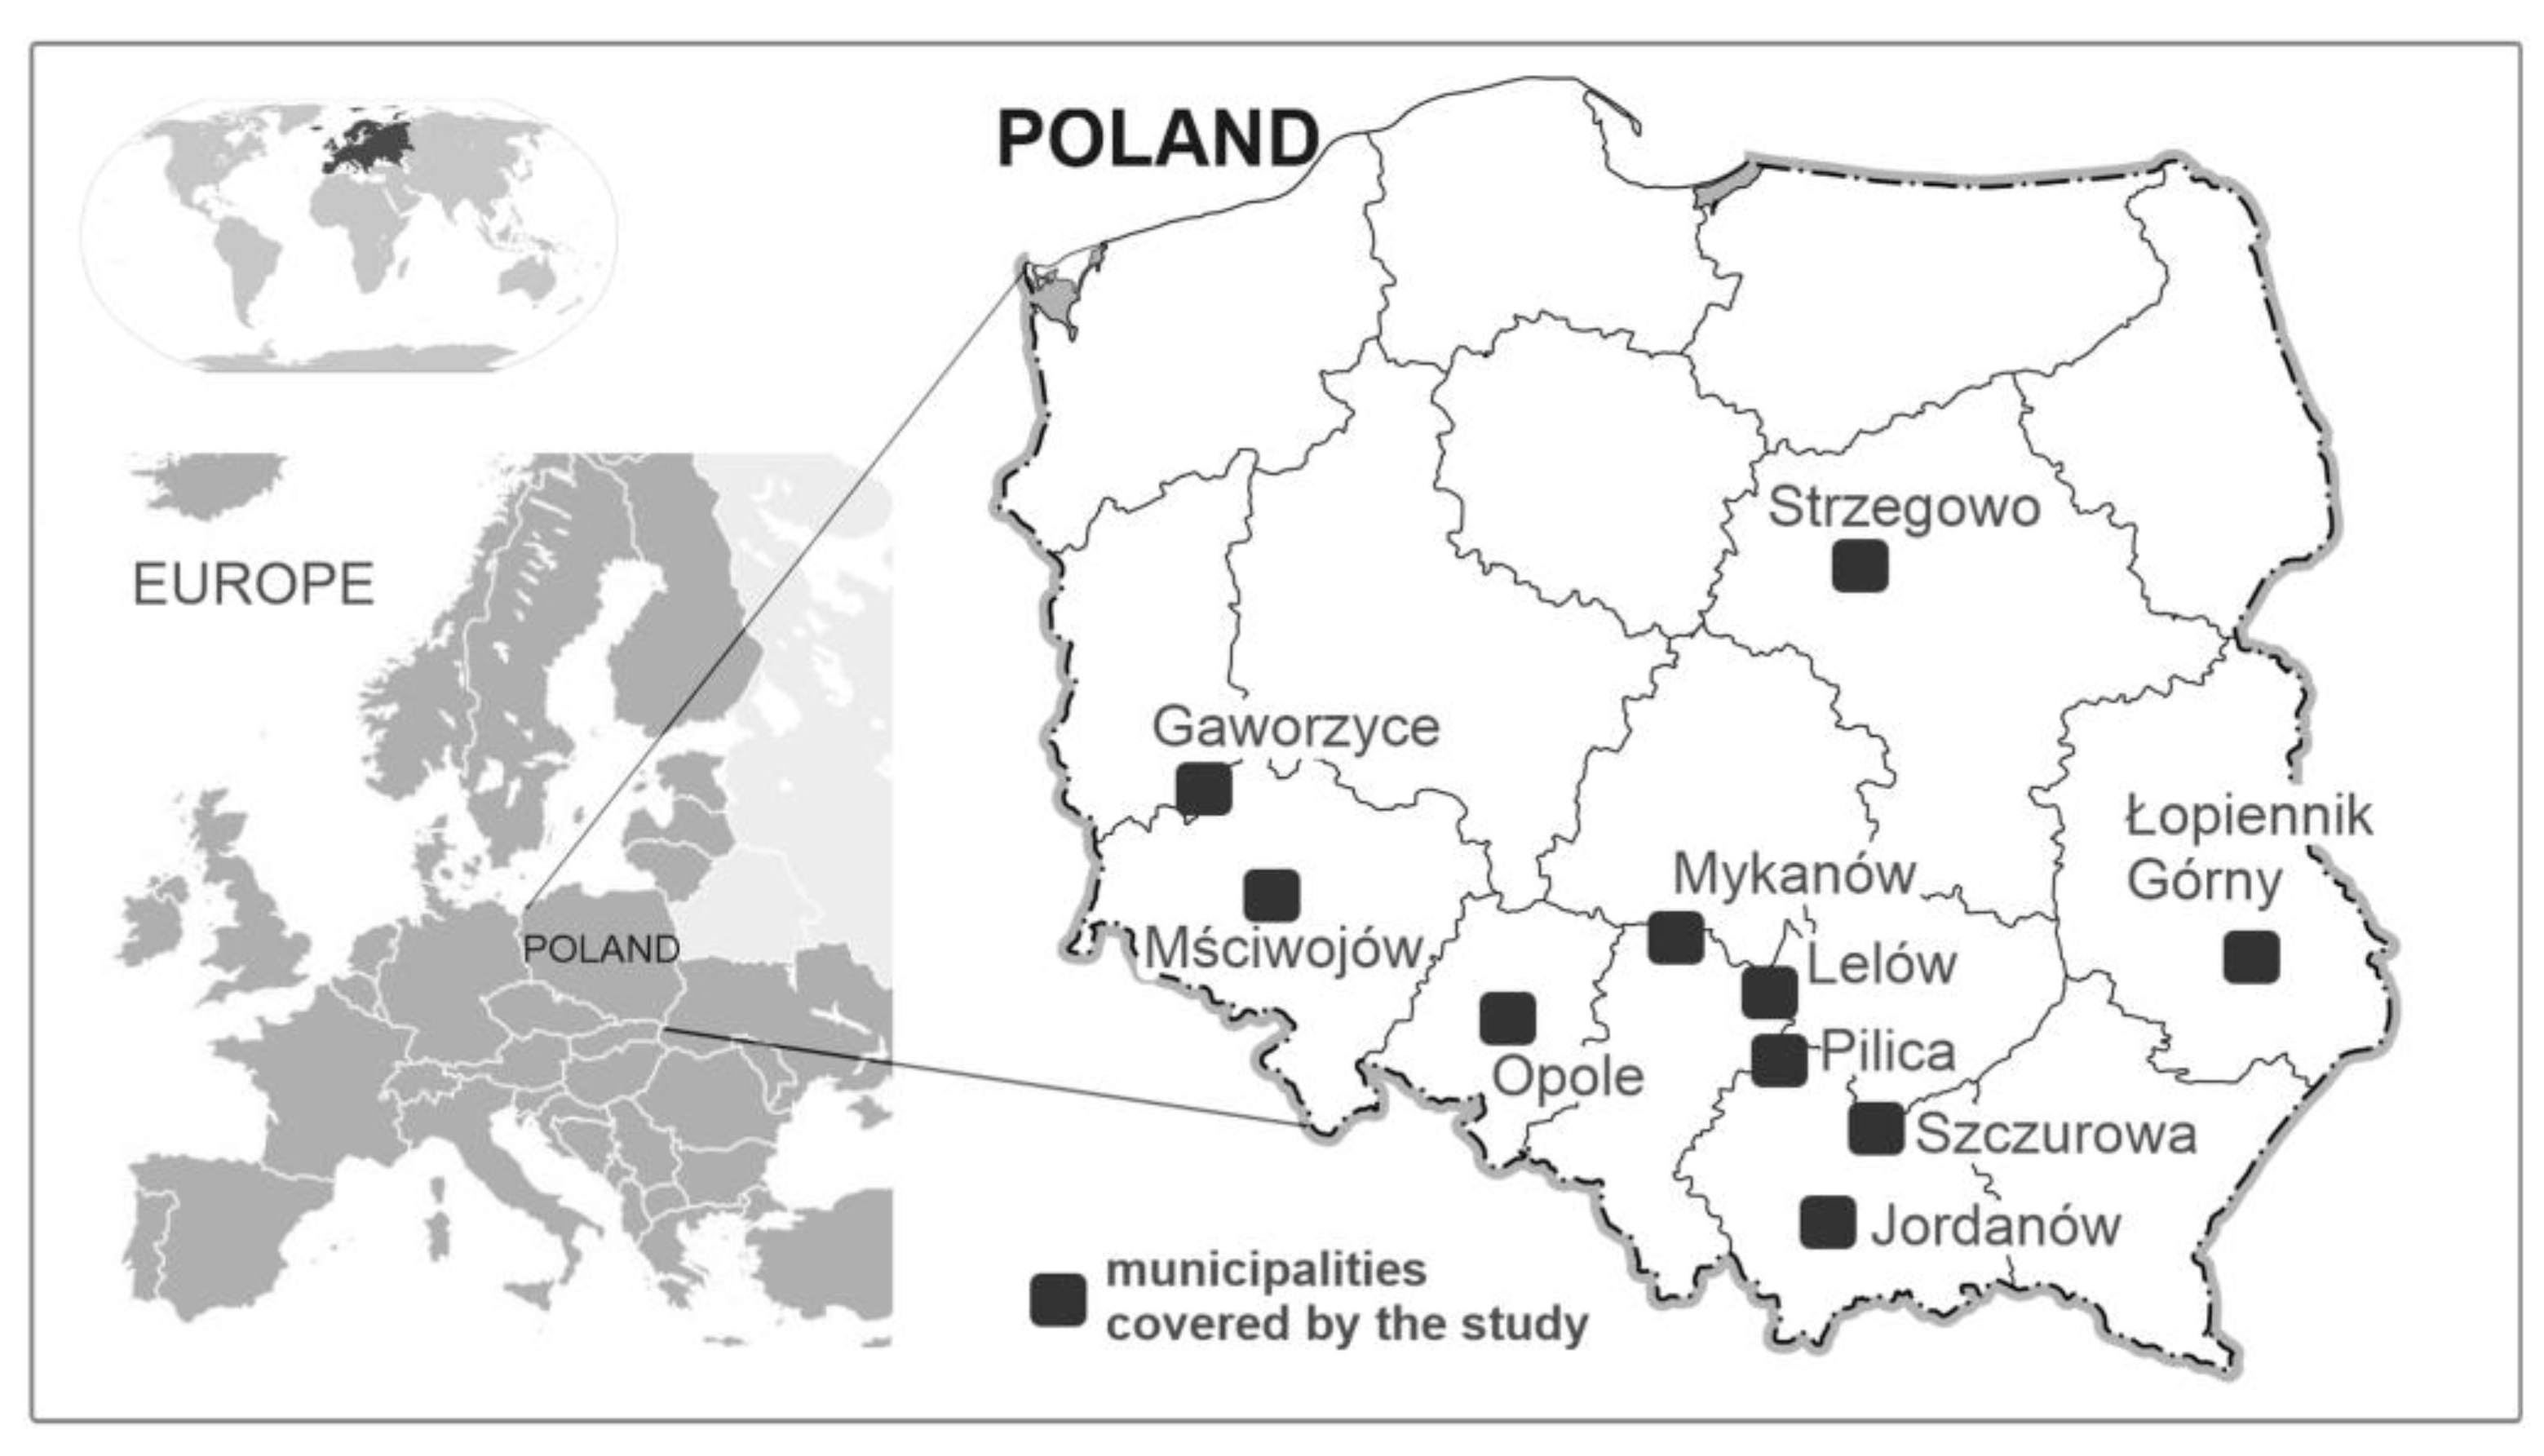
General locationA continuous quantitative feature established based on analysis of variance as an average level of unit prices (PLN/m2) for the municipalities from which data on agricultural parcel transactions were obtained:
2.4—Szczurowa
4.2—Jordanów
2.3—Lelów
1.6—Mykanów
2.3—Łopiennik Górny
4.8—Mściwojów
2.8—Pilica
2.4—Praszka
3.2—Gaworzyce
3.6—Dobrzeń Wielki
2.9—Opole
2.7—Strzegowo
Detailed locationA discrete quantitative feature assuming three states:
1—peripheral (away from settlement development clusters)
2—indirect (bordering settlement development clusters)
3—built-up zone (location within settlement development clusters)
Soil quality *A discrete quantitative feature assuming four states, determined based on the intervals of estimated soil classification rate (Wb **):
1—poor (Wb to 0.8)
2—average (Wb above 0.8 to 1.2)
3—good (Wb above 1.2 to 1.6)
4—very good (Wb above 1.6)
Share of arable landA continuous quantitative feature assuming values from the interval of 0.00 to 1.00 calculated as the quotient of the surface area of arable land and the total surface area of a parcel
Obstacles to usageA discrete quantitative feature assuming three states:
1—large (two or more of the following aspects appear at the same time: flintiness,
wetness of the area, visible soil variability, bushes and coppices, wasteland, proximity of forests, sharp angles of parcel borders)
2—moderate (one of the above)
3—lack
VicinityA discrete quantitative feature assuming two states:
0—not directly bordering a built-up area
1—directly bordering a built-up area
Surface area *A qualitative feature assuming five variants:
up to 0.5 ha (very small parcels)
from 0.5 to 1 ha (small parcels)
from 1 to 2 ha (mid-sized parcels)
from 2 to 3 ha (large parcels)
above 3 ha (very large parcels)
Parcel elongationA continuous quantitative feature assuming values in the range from 1.0 to 114.6, calculated as a quotient of the parcel’s sides (longer/shorter)
Access to a public roadA discrete quantitative feature assuming two states:
0—no access to a road
1—access to a road
* Features used in the ANN model; in the MRA model they were insignificant. ** Wb was calculated as the quotient of the area, which is the basis for calculating the agricultural tax (conversion hectare) and the physical area (physical hectare).
Table 2. Summary of the results of multiple linear regression.
Denotation and Description
of the Feature
Summary of the Regression of Dependent Variable Y (Value PLN/ha):
n = 203; R2 = 0.68; F(7.195) = 61
Standardized Regression Coefficient b*Standard Error b*Regression Coefficient bStandard Error bt(195)p
Intercept −20,8112840−7.330.0000
X1—General location0.6440.042925160615.260.0000
X2—Share of arable land0.2150.042616012115.090.0000
X3—Parcel elongation−0.1080.042−5622−2.580.0106
X4—Detailed location0.2090.04834137854.350.0000
X5—Vicinity0.1230.048359014092.550.0116
X6—Access to a road0.1170.041494817452.830.0051
X7—Obstacles to usage0.1870.04224975564.490.0000
Table 3. Network sensitivity analysis.
PredictorSensitivity
X1—Access to a road6.70
X2—General location2.57
X3—Detailed location2.52
X4—Tax region2.18
X5—Soil quality2.07
X6—Obstacles to usage2.05
X7—Vicinity2.03
X8—Surface area1.34
X9—Share of arable land1.20
X10—Parcel elongation1.05
Table 4. Predicted changes in land value as a result of changes in selected features of parcels.
Market Prices that Are Likely to Change as a Result of ConsolidationPredicted Value (PLN/ha)
ElongationAccessSurface AreaMRA Model ANN Model
11<0.530,748 a38,507 e
025,80016,086
50128,00435,093
023,05613,232
100125,20431,658
020,256 b10,418 f
110.5–1.030,74834,225 h
025,80012,084
50128,00431,101
023,0569567
100125,20427,996
020,2567125 g
111.0–2.030,74834,271
025,80012,794
50128,00431,267
023,05610,386
100125,20428,283
020,2568041
112.0–3.030,74833,531 c
025,80014,046
50128,00430,214
023,05611,501
100125,20426,911
020,2569006 d
11>3.030,74838,129
025,80016,308
50128,00434,859
023,05613,689
100125,20431,592
020,25611,135
Indication of the results discussed in the text: a, b, c, d, e, f, g, h.
Publisher’s Note: MDPI stays neutral with regard to jurisdictional claims in published maps and institutional affiliations.

