
Farming Systems Changes in the Urban Shadow: A Mixed Approach Based on Statistical Analysis and Expert Surveys


Abstract
:1. Introduction
2. Research Design and Methodology
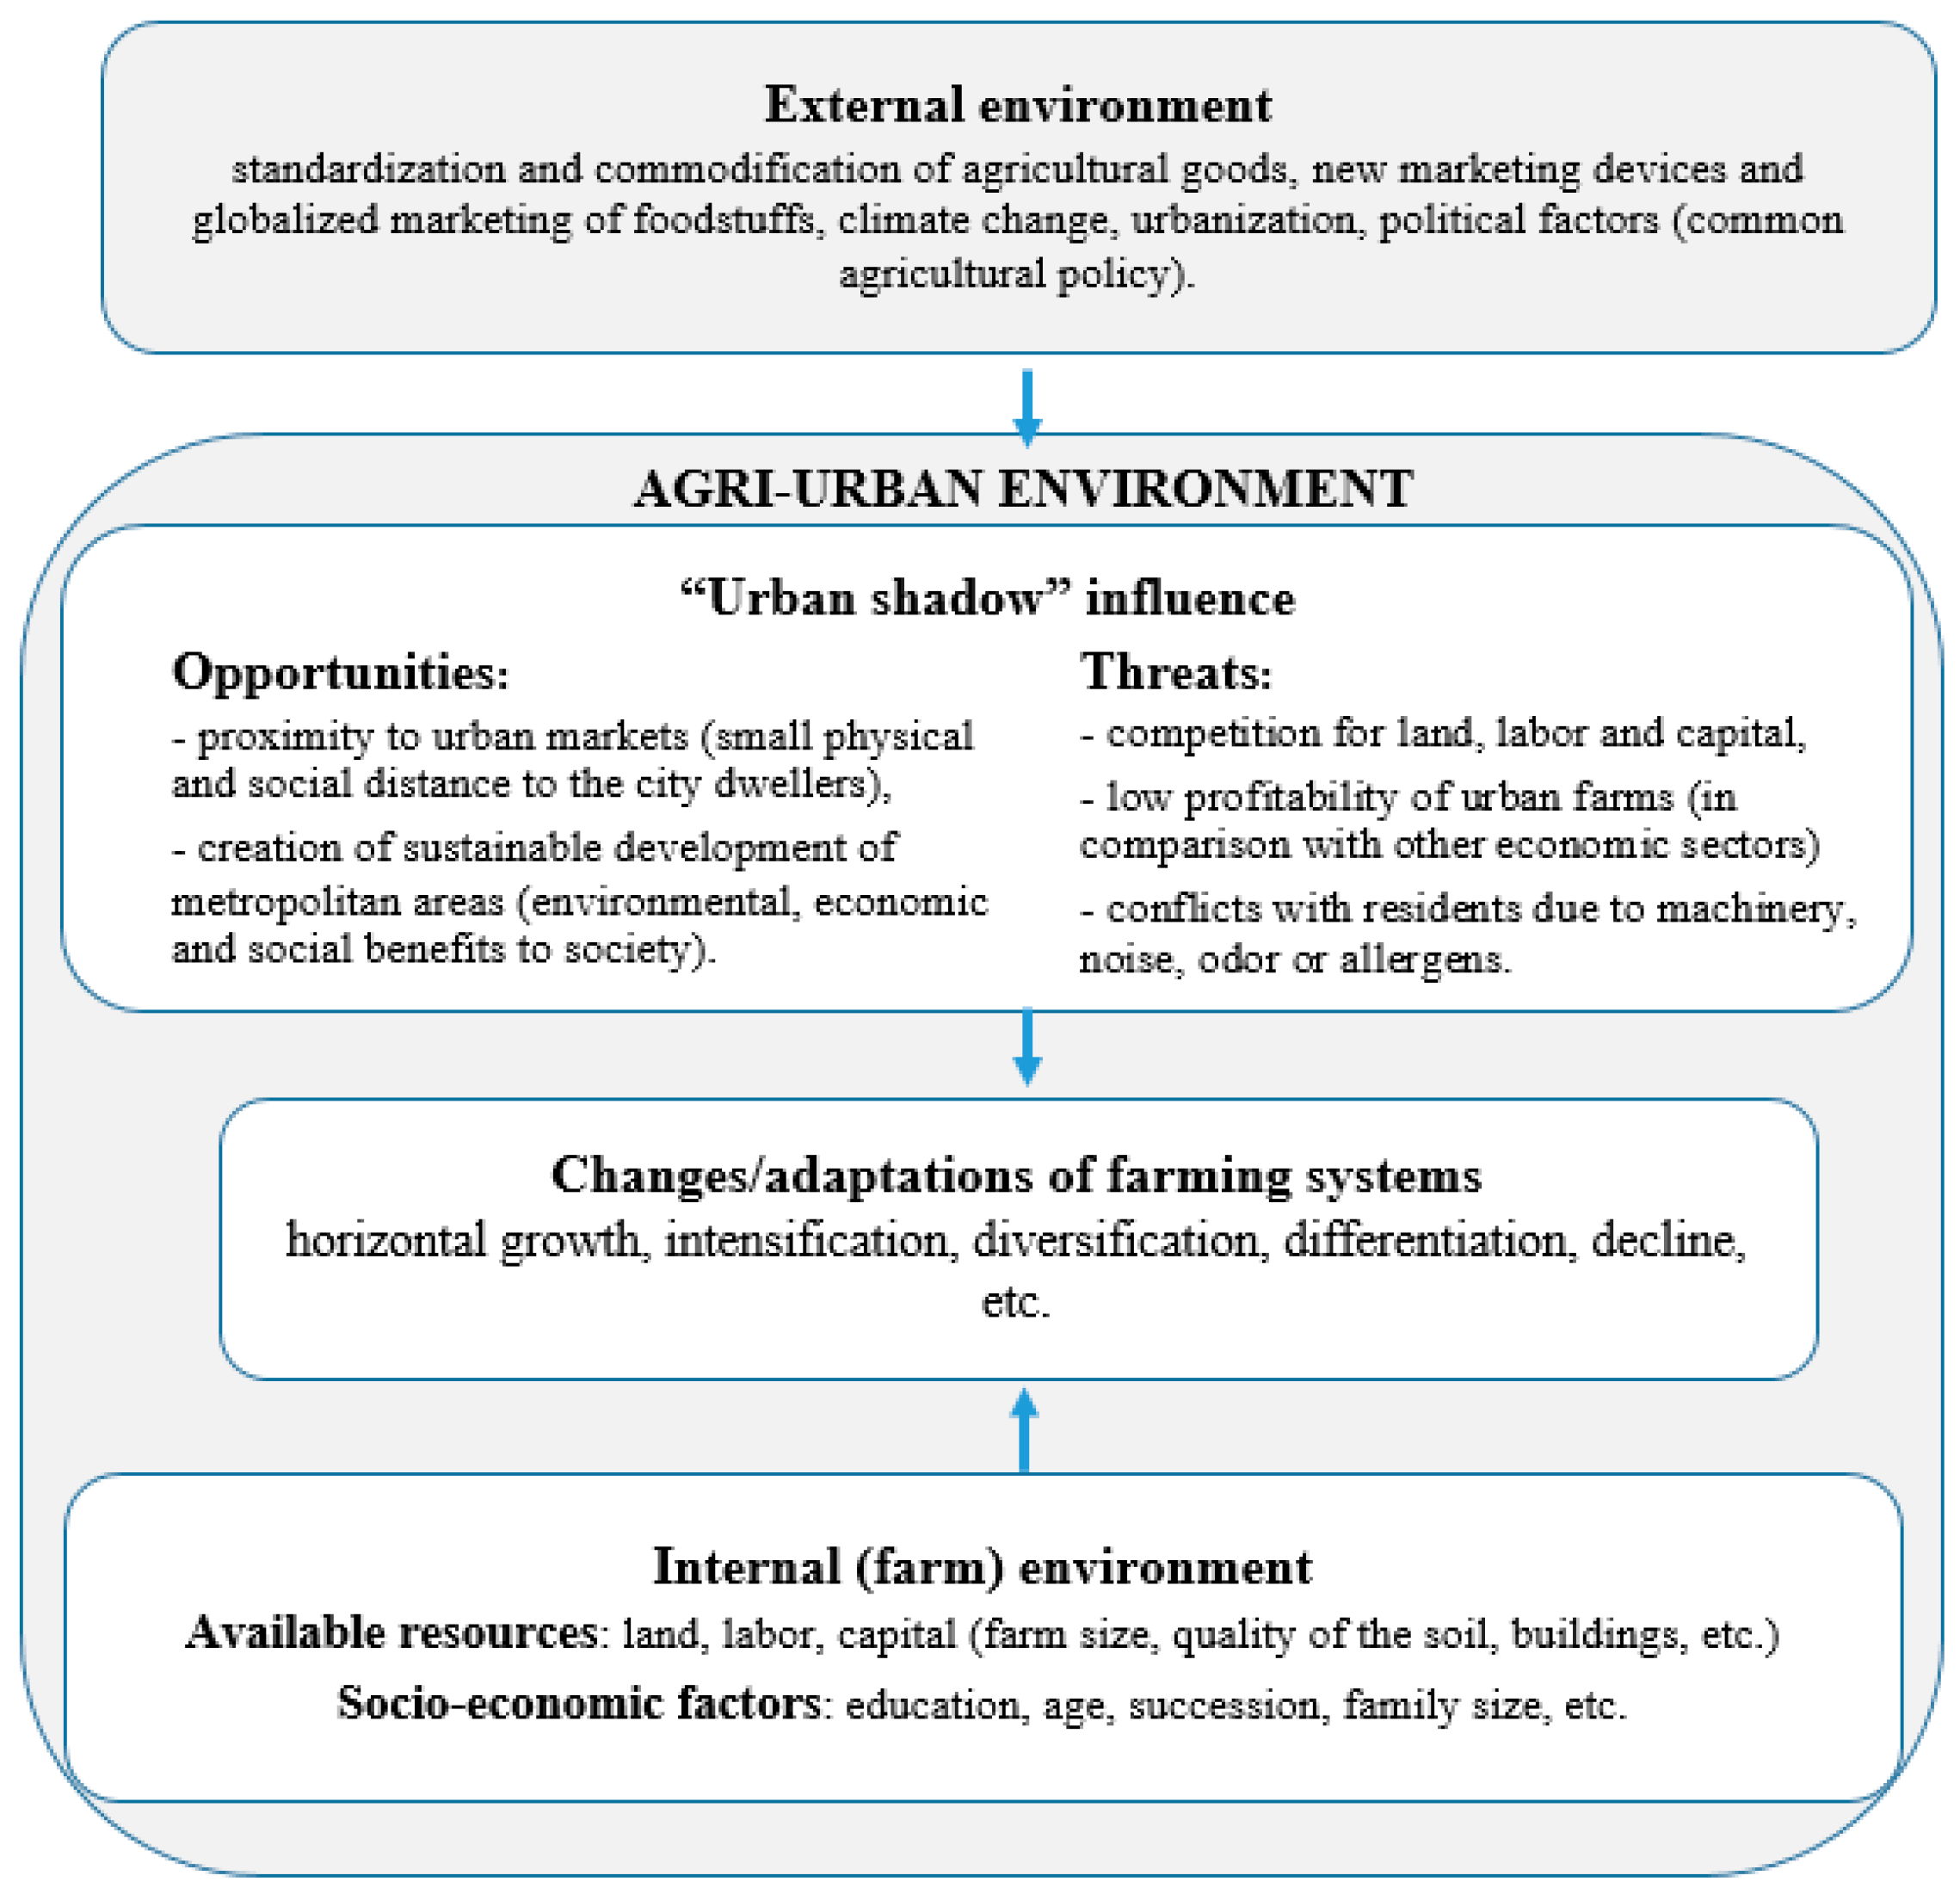
2.1. Theoretical Framework
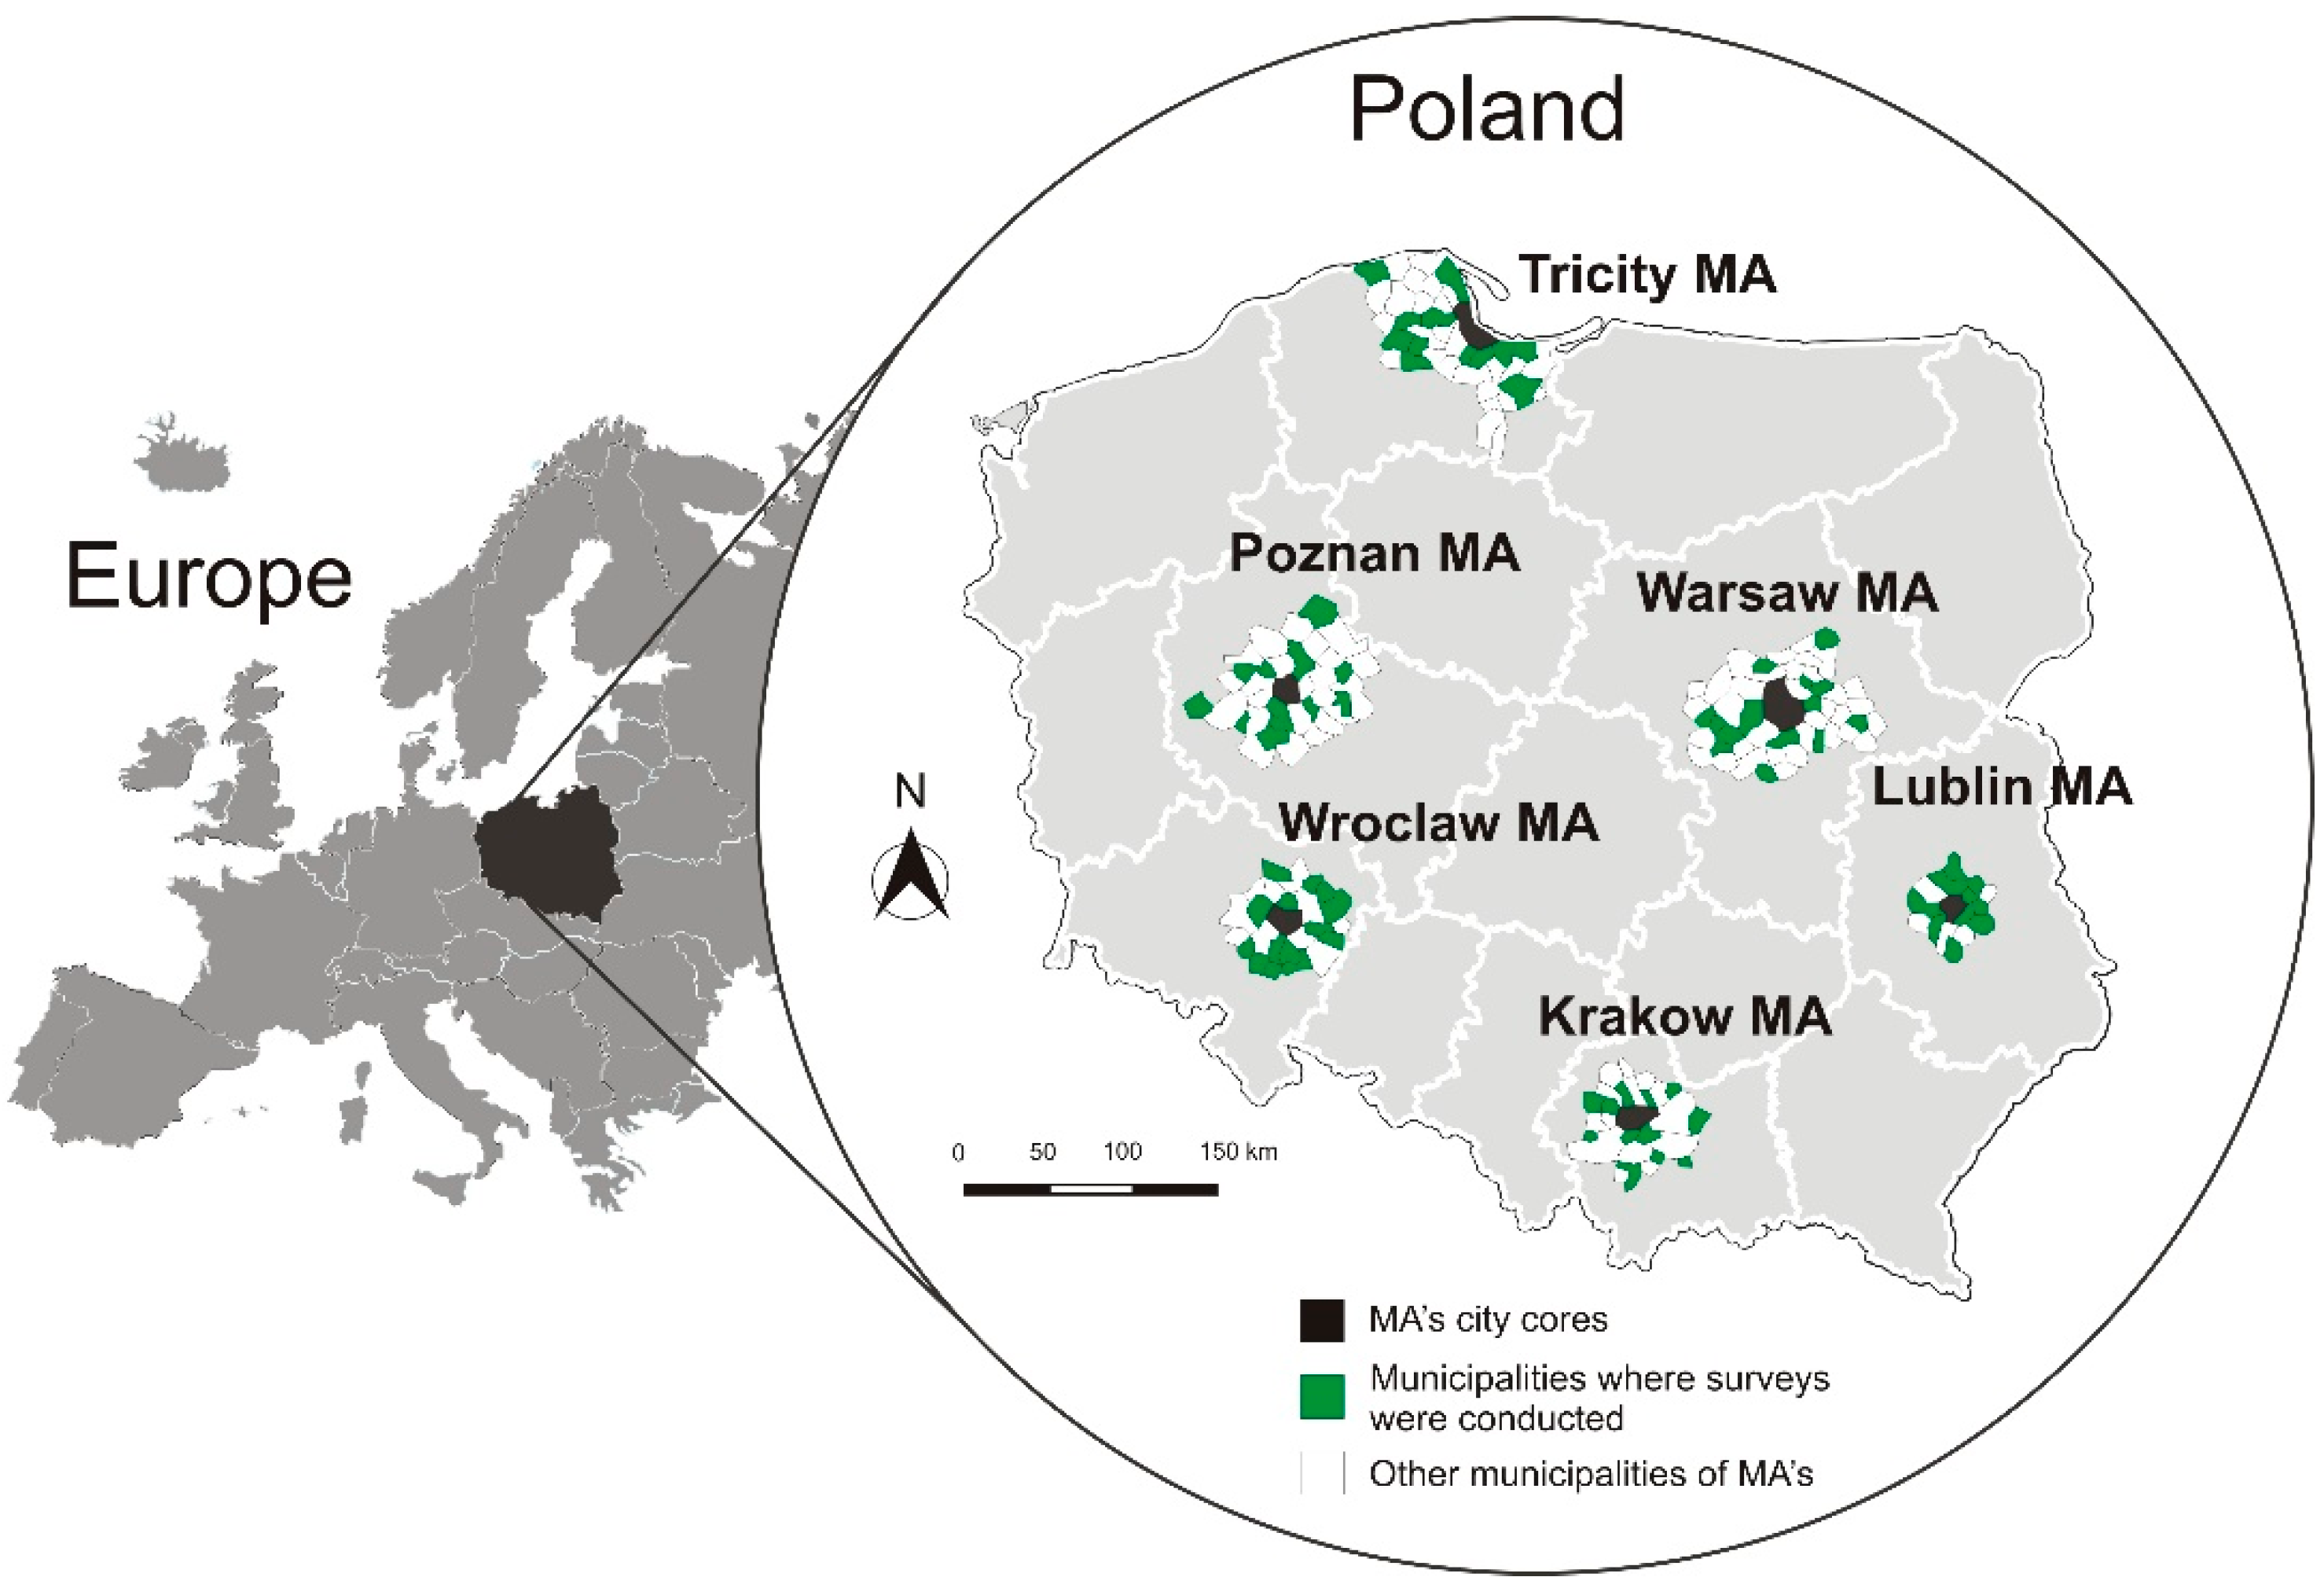
2.2. Study Area
2.3. Data Collection
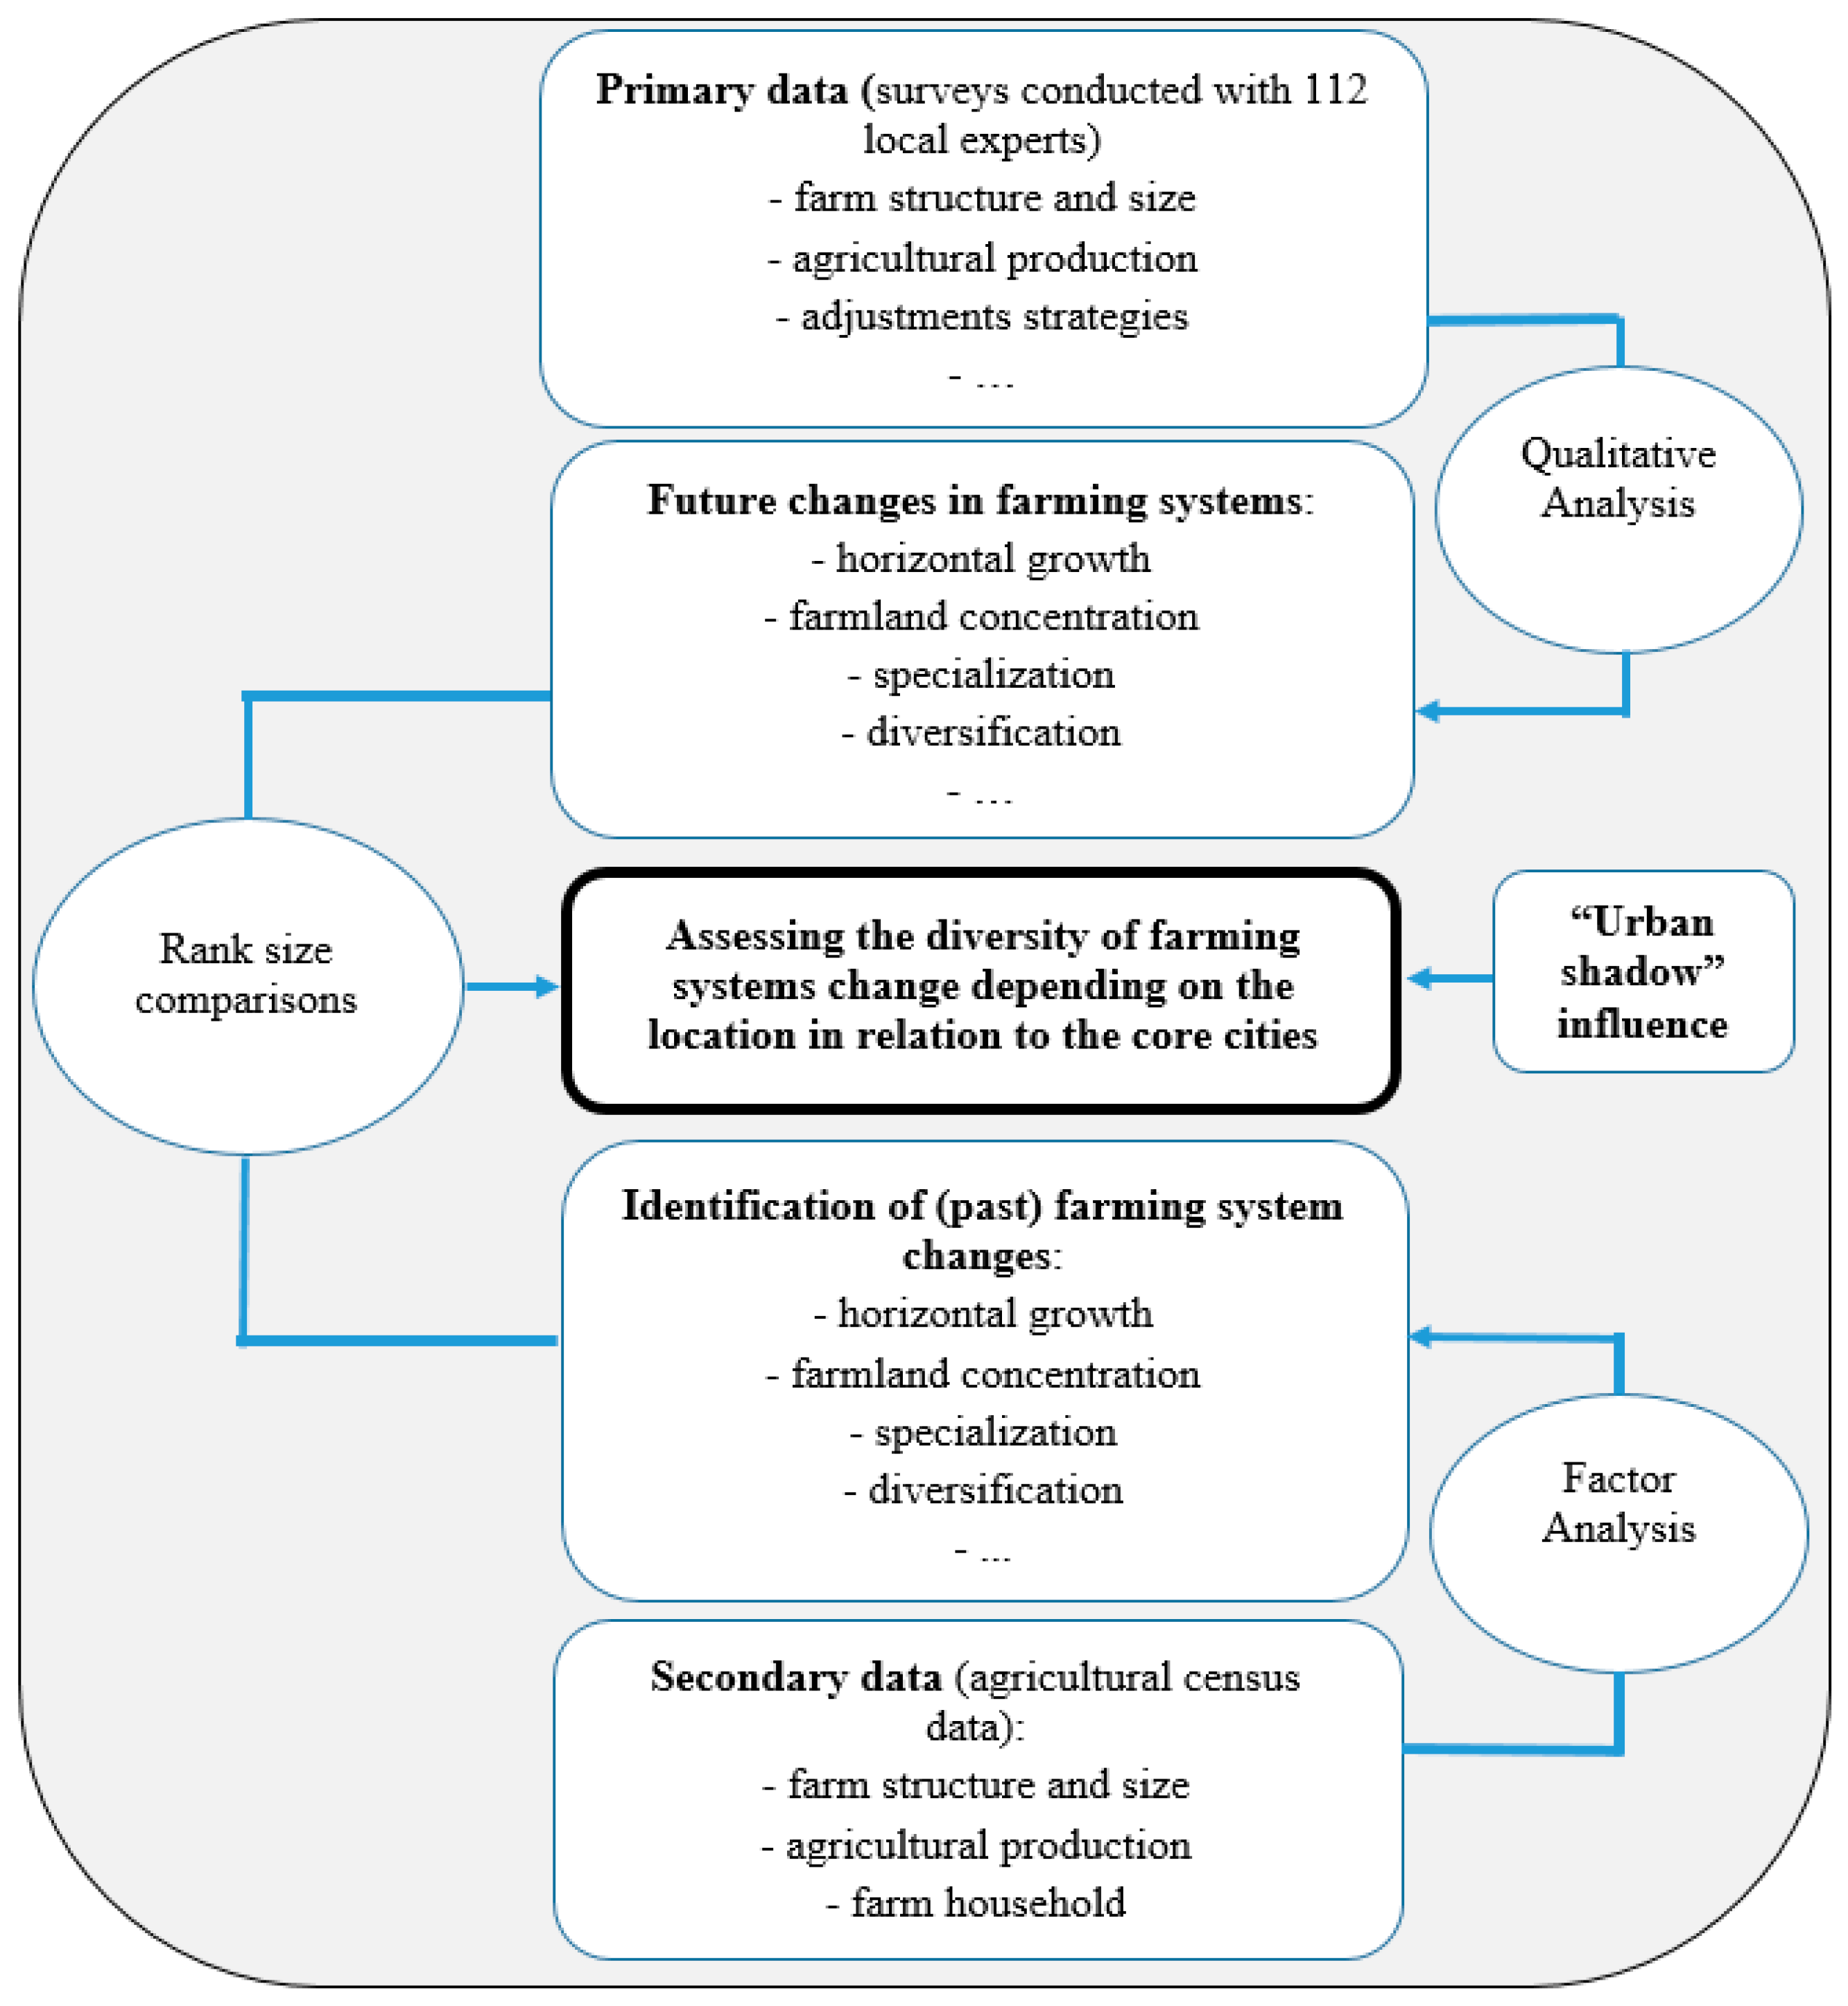
2.4. Data Analysis
3. Results
3.1. Identification of Farming System Changes
3.2. Farming System Changes: Analysis of the Impact of Location
3.2.1. Horizontal Growth and Professionalization
3.2.2. Reduction of Livestock Farming
3.2.3. Farmland Concentration
3.2.4. Specialization (Vegetables and Orchards)
3.2.5. Off-Farm Diversification of Income
3.2.6. Farmland Abandonment and Exit from Farming Activities
3.2.7. Deintensification
3.3. Future Changes of Farming Systems—Until 2027—Experts’ Opinions
3.3.1. Processes of Farm Horizontal Growth as Traditional Development Path
3.3.2. Future Changes in Farm Specialization (Vegetables and Orchards)
3.3.3. Future Changes in Animal Production
3.3.4. Off-Farm Diversification of Income and Multifunctionality until 2027
3.3.5. Recessive Processes, Including Farmland Abandonment and Deintensification
4. Discussion
5. Conclusions
6. Study Limitations and further Research
Author Contributions
Funding
Institutional Review Board Statement
Informed Consent Statement
Data Availability Statement
Acknowledgments
Conflicts of Interest
References
- Busck, A.G.; Kristensen, S.P.; Præstholm, S.; Reenberg, A.; Primdahl, J. Land system changes in the context of urbanisation: Examples from the peri-urban area of Greater Copenhagen. Geografisk Tidsskr-Dan. J. Geogr. 2006, 106, 21–34. [Google Scholar] [CrossRef]
- Duvernoy, I.; Zambon, I.; Sateriano, A.; Salvati, L. Pictures from the other side of the fringe: Urban growth and peri-urban agriculture in a post-industrial city (Toulouse, France). J. Rural Stud. 2018, 57, 25–35. [Google Scholar] [CrossRef]
- Abass, K.; Adanu, S.K.; Agyemang, S. Peri-urbanisation and loss of arable land in Kumasi Metropolis in three decades: Evidence from remote sensing image analysis. Land Use Policy 2018, 72, 470–479. [Google Scholar] [CrossRef]
- Darly, S.; Torre, A. Conflicts over farmland uses and the dynamics of “agri-urban” localities in the Greater Paris Region: An empirical analysis based on daily regional press and field interviews. Land Use Policy 2013, 33, 90–99. [Google Scholar] [CrossRef]
- Mazzocchi, C.; Sali, G.; Corsi, S. Land use conversion in metropolitan areas and the permanence of agriculture: Sensitivity Index of Agricultural Land (SIAL), a tool for territorial analysis. Land Use Policy 2013, 35, 155–162. [Google Scholar] [CrossRef]
- Sroka, W.; Dudek, M.; Wojewodzic, T.; Król, K. Generational Changes in Agriculture: The Influence of Farm Characteristics and Socio-Economic Factors. Agriculture 2019, 9, 264. [Google Scholar] [CrossRef] [Green Version]
- Bertoni, D.; Cavicchioli, D. Farm succession, occupational choice and farm adaptation at the rural-urban interface: The case of Italian horticultural farms. Land Use Policy 2016, 57, 739–748. [Google Scholar] [CrossRef]
- LeJava, J.P.; Goonan, M.J. Cultivating urban agriculture: Addressing land use barriers to gardening and farming in cities. Real Estate Law J. 2012, 41, 216–245. [Google Scholar]
- Huang, D.; Drescher, M. Urban crops and livestock: The experiences, challenges, and opportunities of planning for urban agriculture in two Canadian provinces. Land Use Policy 2015, 43, 1–14. [Google Scholar] [CrossRef]
- Zasada, I. Multifunctional peri-urban agriculture—A review of societal demands and the provision of goods and services by farming. Land Use Policy 2011, 28, 639–648. [Google Scholar] [CrossRef]
- Spataru, A.; Faggian, R.; Docking, A. Principles of multifunctional agriculture for supporting agriculture in metropolitan peri-urban areas: The case of Greater Melbourne, Australia. J. Rural Stud. 2020, 74, 34–44. [Google Scholar] [CrossRef]
- Inwood, S.M.; Sharp, J.S. Farm persistence and adaptation at the rural–urban interface: Succession and farm adjustment. J. Rural Stud. 2012, 28, 107–117. [Google Scholar] [CrossRef]
- Pölling, B.; Mergenthaler, M.; Lorleberg, W. Professional urban agriculture and its characteristic business models in Metropolis Ruhr, Germany. Land Use Policy 2016, 58, 366–379. [Google Scholar] [CrossRef]
- Clark, J.K.; Jackson-Smith, D.; Sharp, J.; Munroe, D. The geography of US periurban agricultural adaptation. In Proceedings of the Trans Atlantic Land Use Conference, Washington, DC, USA, 24–26 September 2007; Available online: http://cffpi.osu.edu/agadapt.htm (accessed on 4 January 2021).
- Lange, A.; Piorr, A.; Siebert, R.; Zasada, I. Spatial differentiation of farm diversification: How rural attractiveness and vicinity to cities determine farm households’ response to the CAP. Land Use Policy 2013, 31, 136–144. [Google Scholar] [CrossRef]
- Pölling, B.; Sroka, W.; Mergenthaler, M. Success of urban farming’s city-adjustments and business models—Findings from a survey among farmers in Ruhr Metropolis, Germany. Land Use Policy 2017, 69, 372–385. [Google Scholar] [CrossRef]
- Silva, J.F.; Santos, J.L.; Ribeiro, P.F.; Canadas, M.J.; Novais, A.; Lomba, A.; Moreira, F. Identifying and explaining the farming system composition of agricultural landscapes: The role of socioeconomic drivers under strong biophysical gradients. Landsc. Urban Plan. 2020, 202, 103879. [Google Scholar] [CrossRef]
- Grădinaru, S.R.; Triboi, R.; Iojă, C.I.; Artmann, M. Contribution of agricultural activities to urban sustainability: Insights from pastoral practices in Bucharest and its peri-urban area. Habitat Int. 2018, 82, 62–71. [Google Scholar] [CrossRef]
- Lovell, S.T. Multifunctional urban agriculture for sustainable land use planning in the United States. Sustainability 2010, 2, 2499–2522. Available online: https://doi.org/10.3390/su2082499 (accessed on 4 January 2021). [CrossRef] [Green Version]
- Ferreira, A.J.D.; Guilherme, R.; Ferreira, C.S.S.; Oliveira, M.F.L. Urban Agriculture, a tool towards more resilient urban communities? Curr. Opin. Environ. Sci. Health 2018, 5, 93–97. [Google Scholar] [CrossRef]
- Mok, H.F.; Williamson, V.G.; Grove, J.R.; Burry, K.; Barker, S.F.; Hamilton, A.J. Strawberry fields forever? Urban agriculture in developed countries: A review. Agron. Sustain. Dev. 2014, 34, 21–43. [Google Scholar] [CrossRef] [Green Version]
- Filippini, R. Food production potential of periurban agriculture: Contribution of periurban farms to local food systems. In Agricultural Sciences; AgroParisTech; Scuola superiore Sant’Anna di studi universitari e di perfezionamento: Pise, Italie, 2015. [Google Scholar]
- Darnhofer, I.; Bellon, S.; Dedieu, B.; Milestad, R. Adaptiveness to enhance the sustainability of farming systems. A review. Agron. Sustain. Dev. 2010, 30, 545–555. [Google Scholar] [CrossRef] [Green Version]
- Darnhofer, I.; Gibbon, D.; Dedieu, B. (Eds.) Farming Systems Research into the 21st Century: The New Dynamic; Springer Science+Business Media: Berlin, Germany, 2012; p. 490. [Google Scholar]
- Sanz, E.S.; Martinetti, D.; Napoléone, C. Operational modelling of peri-urban farmland for public action in Mediterranean context. Land Use Policy 2018, 75, 757–771. [Google Scholar] [CrossRef]
- Meyer, M.A.; Früh-Müller, A. Patterns and drivers of recent agricultural land-use change in Southern Germany. Land Use Policy 2020, 99, 104959. [Google Scholar] [CrossRef]
- Gradinaru, S.R.; Ioja, C.I.; Onose, D.A.; Gavrilidis, A.A.; Patru-Stupariu, I.; Kienast, F.; Hersperger, A.M. Land abandonment as a precursor of built-up development at the sprawling periphery of former socialist cities. Ecol. Indic. 2015, 57, 305–313. [Google Scholar] [CrossRef]
- Paül, V.; Tonts, M. Containing urban sprawl: Trends in land use and spatial planning in the metropolitan region of Barcelona. J. Environ. Plan. Manag. 2005, 48, 7–35. [Google Scholar] [CrossRef]
- Sroka, W.; Pölling, B.; Wojewodzic, T.; Strus, M.; Stolarczyk, P.; Podlinska, O. Determinants of farmland abandonment in selected metropolitan areas of Poland: A spatial analysis on the basis of regression trees and interviews with experts. Sustainability 2018, 11, 3071. [Google Scholar] [CrossRef] [Green Version]
- Drinkwater, L.; Friedman, D.; Buck, L.E. Systems Research for Agriculture: Innovative Solutions to Complex Challenges; Sustainable Agriculture Research and Education (SARE): College Park, MD, USA, 2016; p. 97. [Google Scholar]
- Mądry, W.; Roszkowska-Mądra, B.; Gozdowski, D.; Hryniewski, R. Some aspects of the concept, methodology and application of farming system typology. Electron. J. Pol. Agric. Univ. 2016, 19, 12. [Google Scholar]
- Gomez Sal, A.; Gonzalez, G.A. A comprehensive assessment of multifunctional agricultural land-use systems in Spain using a multi-dimensional evaluative model. Agric. Ecosyst. Environ. 2007, 120, 82–91. [Google Scholar] [CrossRef]
- Meyfroidt, P.; Chowdhury, R.R.; de Bremond, A.; Ellis, E.C.; Erb, K.H.; Filatova, T.; Kull, C.A. Middle-range theories of land system change. Glob. Environ. Change 2018, 53, 52–67. [Google Scholar] [CrossRef]
- Debolini, M.; Marraccini, E.; Dubeuf, J.P.; Geijzendorffer, I.R.; Guerra, C.; Simon, M.; Napoléone, C. Land and farming system dynamics and their drivers in the Mediterranean Basin. Land Use Policy 2018, 75, 702–710. [Google Scholar] [CrossRef]
- Martin, G.; Martin-Clouaire, R.; Duru, M. Farming system design to feed the changing world. A review. Agron. Sustain. Dev. 2013, 33, 131–149. [Google Scholar] [CrossRef] [Green Version]
- Sharma, K.D.; Pathania, M.S.; Lal, H. Farming system approach for sustainable development of agriculture in mountain regions—A case of Himachal Pradesh. Agric. Econ. Res. Rev. 2006, 19, 101–112. [Google Scholar]
- Satoła, L.; Wojewodzic, T.; Sroka, W. Barriers to exit encountered by small farms in light of the theory of new institutional economics. Agric. Econ. 2018, 64, 277–290. [Google Scholar]
- Ribeiro, P.F.; Santos, J.L.; Bugalho, M.N.; Santana, J.; Reino, L.; Beja, P.; Moreira, F. Modelling farming system dynamics in High Nature Value Farmland under policy change. Agric. Ecosyst. Environ. 2014, 183, 138–144. [Google Scholar] [CrossRef]
- Sroka, W.; Mikolajczyk, J.; Wojewodzic, T.; Kwoczynska, B. Agricultural land vs. urbanisation in chosen Polish metropolitan areas: A spatial analysis based on regression trees. Sustainability 2018, 10, 837. [Google Scholar] [CrossRef] [Green Version]
- Stylianou, A.; Sdrali, D.; Apostolopoulos, C.D. Capturing the diversity of Mediterranean farming systems prior to their sustainability assessment: The case of Cyprus. Land Use Policy 2020, 96, 104722. [Google Scholar] [CrossRef]
- Zasada, I.; Loibl, W.; Köstl, M.; Piorr, A. Agriculture under human influence: A spatial analysis of farming systems and land use in European rural-urban-regions. Eur. Countryside 2013, 5, 71–88. [Google Scholar] [CrossRef]
- Therond, O.; Duru, M.; Roger-Estrade, J.; Richard, G. A new analytical framework of farming system and agriculture model diversities. A review. Agron. Sustain. Dev. 2017, 37, 21. [Google Scholar] [CrossRef]
- Zurek, M.; Keenlyside, P.; Brandt, K. Intensifying Agricultural Production Sustainably: A Framework for Analysis and Decision Support. In Amsterdam, the Netherlands: International Food Policy Research Institute (IFPRI). 2015, Climate: Focus. Available online: http://ebrary.ifpri.org/cdm/ref/collection/p15738coll2/id/130125 (accessed on 5 January 2021).
- Witek, T. Waloryzacja Rolniczej Przestrzeni Produkcyjnej Polski Według Gmin; IUNG: Puławy, Poland, 1994; p. 248. [Google Scholar]
- Yong, A.G.; Pearce, S. A beginner’s guide to factor analysis: Focusing on exploratory factor analysis. Tutor. Quant. Methods Psychol. 2013, 9, 79–94. [Google Scholar] [CrossRef]
- Hanh, H.Q.; Azadi, H.; Dogot, T.; Ton, V.D.; Lebailly, P. Dynamics of agrarian systems and land use change in North Vietnam. Land Degrad. Dev. 2017, 28, 799–810. [Google Scholar] [CrossRef] [Green Version]
- Clark, J.K.; Munroe, D.K. The relational geography of periurban farmer adaptation. J. Rural Community Dev. 2013, 8, 15–28. [Google Scholar]
- Akimowicz, M.; Cummings, H.; Landman, K. Green lights in the Greenbelt? A qualitative analysis of farm investment decision-making in peri-urban Southern Ontario. Land Use Policy 2016, 55, 24–36. [Google Scholar] [CrossRef]
- Rogus, S.; Dimitri, C. Agriculture in urban and peri-urban areas in the United States: Highlights from the Census of Agriculture. Renew. Agr. Food Syst. 2015, 30, 64–78. [Google Scholar] [CrossRef]
- Musiał, W. Użyczenie jako alternatywa dla dzierżawy ziemi rolniczej. Wieś i Rolnictwo 2020, 187, 79–98. [Google Scholar]
- Wästfelt, A.; Zhang, Q. Reclaiming localisation for revitalising agriculture: A case study of peri-urban agricultural change in Gothenburg, Sweden. J. Rural Stud. 2016, 47, 172–185. [Google Scholar] [CrossRef]
- Skar, S.L.G.; Pineda-Martos, R.; Timpe, A.; Pölling, B.; Bohn, K.; Külvik, M.; Tzortzakis, N. Urban agriculture as a keystone contribution towards securing sustainable and healthy development for cities in the future. Blue-Green Syst. 2020, 2, 1–27. [Google Scholar] [CrossRef] [Green Version]
- Piorr, A.; Zasada, I.; Doernberg, A.; Zoll, F.; Ramme, W. Research for AGRI Committee–Urban and Peri-urban Agriculture in the EU, European Parliament; Policy Department for Structural and Cohesion Policies: Brussels, Belgium, 2018; p. 89. [Google Scholar]
- De Roest, K.; Ferrari, P.; Knickel, K. Specialisation and economies of scale or diversification and economies of scope? Assessing different agricultural development pathways. J. Rural Stud. 2018, 59, 222–231. [Google Scholar] [CrossRef]
- Alonso, W. Location and Land Use; Harvard University Press: Cambridge, MA, USA, 1964; p. 204. [Google Scholar]
- Sroka, W.; Pölling, B.; Mergenthaler, M. City adjustments as the main factor of success of urban and peri-urban farms–empirical evidence from the Ruhr metropolis. NJAS-Wageningen J. Life Sci. 2019, 89, 100299. [Google Scholar] [CrossRef]
- Ricardo, D. On the Principles of Political Economy and Taxation, 3rd ed.; John Murray: London, UK, 1821; p. 333. [Google Scholar]
- Chakir, R.; Lungarska, A. Agricultural rent in land-use models: Comparison of frequently used proxies. Spat. Econ. Anal. 2017, 12, 279–303. [Google Scholar] [CrossRef] [Green Version]
- Daedlow, K.; Lemke, N.; Helming, K. Arable land tenancy and soil quality in Germany: Contesting theory with empirics. Sustainability 2018, 10, 2880. [Google Scholar] [CrossRef] [Green Version]
- Van Veenhuizen, R.; Danso, G. Profitability and sustainability of urban and periurban agriculture (Vol. 19). Food Agric. Org. 2007. Available online: https://ruaf.org/assets/2019/11/Profitability-and-Sustainability.pdf (accessed on 5 January 2021).
- Asfaw, A.; Simane, B.; Hassen, A.; Bantider, A. Determinants of non-farm livelihood diversification: Evidence from rainfed-dependent smallholder farmers in northcentral Ethiopia (Woleka sub-basin). Dev. Stud. Res. 2017, 4, 22–36. [Google Scholar] [CrossRef] [Green Version]
- Henke, R.; Vanni, F. Drivers of on-farm diversification in the Italian peri-urban agriculture. Italian Rev. Agric. Econ. 2017, 72, 79–100. [Google Scholar]
- Pölling, B.; Mergenthaler, M. The location matters: Determinants for “deepening” and “broadening” diversification strategies in Ruhr Metropolis’ urban farming. Sustainability 2017, 9, 1168. [Google Scholar] [CrossRef] [Green Version]
- Rivaroli, S.; Ghelfi, R.; Bertazzoli, A.; Piorr, A. Diversification pathways and farming systems: Insights from the Emilia-Romagna region, Italy. Outlook Agric. 2017, 46, 239–247. [Google Scholar] [CrossRef]
- Pölling, B.; Prados, M.J.; Torquati, B.M.; Giacchè, G.; Recasens, X.; Paffarini, C.; Lorleberg, W. Business models in urban farming: A comparative analysis of case studies from Spain, Italy and Germany. Moravian Geogr. Rep. 2017, 25, 166–180. [Google Scholar] [CrossRef] [Green Version]
- Knapik, W. Stimulators and inhibitors of the development of social care and support for the elderly in Poland. J. Rural Stud. 2020, 76, 12–24. [Google Scholar] [CrossRef]
- Vittersø, G.; Torjusen, H.; Laitala, K.; Tocco, B.; Biasini, B.; Csillag, P.; Malak-Rawlikowska, A. Short Food Supply Chains and Their Contributions to Sustainability: Participants’ Views and Perceptions from 12 European Cases. Sustainability 2019, 11, 4800. [Google Scholar] [CrossRef] [Green Version]
- Kneafsey, M. Innovative Short Food Supply Chain Management; EIP-AGRI Focus Group Final Report; European Commission: Brussels, Belgium, 2015. [Google Scholar]
- Barska, A.; Wojciechowska-Solis, J. E-consumers and local food products: A perspective for developing online shopping for local goods in Poland. Sustainability 2020, 12, 4958. [Google Scholar] [CrossRef]
- Salvioni, C.; Henke, R.; Vanni, F. The Impact of Non-Agricultural Diversification on Financial Performance: Evidence from Family Farms in Italy. Sustainability 2020, 12, 486. [Google Scholar] [CrossRef] [Green Version]
- Lien, G.; Kumbhakar, S.C.; Hardaker, J.B. Determinants of off-farm work and its effects on farm performance: The case of Norwegian grain farmers. Agric. Econ. 2010, 41, 577–586. [Google Scholar] [CrossRef]
- Yoshida, S.; Yagi, H.; Kiminami, A.; Garrod, G. Farm diversification and sustainability of multifunctional peri-urban agriculture: Entrepreneurial attributes of advanced diversification in Japan. Sustainability 2019, 11, 2887. [Google Scholar] [CrossRef] [Green Version]
- Pepliński, B. Location of Cows and Pigs in Suburban Areas of Polish Metropolitan Centers. Sustainability 2020, 12, 2619. [Google Scholar] [CrossRef] [Green Version]
- Lawrence, H.W. Changes nn Agricultural Production In Metropolitan Areas. Prof. Geographer. 1988, 40, 159–175. [Google Scholar] [CrossRef]
- Banski, J. Phases to the transformation of agriculture in Central Europe–Selected processes and their results. Agric. Econ. 2018, 64, 546–553. [Google Scholar] [CrossRef]
- Zasada, I.; Berges, R.; Hilgendorf, J.; Piorr, A. Horsekeeping and the peri-urban development in the Berlin Metropolitan Region. J.Land Use Sci. 2013, 8, 199–214. [Google Scholar] [CrossRef]
- Filippini, R.; Lardon, S.; Bonari, E.; Marraccini, E. Unraveling the contribution of periurban farming systems to urban food security in developed countries. Agron. Sustain. Dev. 2018, 38, 21. [Google Scholar] [CrossRef] [Green Version]
- McClintock, N.; Pallana, E.; Wooten, H. Urban livestock ownership, management, and regulation in the United States: An exploratory survey and research agenda. Land Use Policy 2014, 38, 426–440. [Google Scholar] [CrossRef] [Green Version]
- Grădinaru, S.R.; Iojă, C.I.; Pătru-Stupariu, I.; Niţă, M.R.; Gavrilidis, A.A.; Cârstea, E.M. Land abandonment changes between 2005 and 2008 in Bucharest city. Proced. Technol. 2013, 8, 536–539. [Google Scholar] [CrossRef] [Green Version]
- Terres, J.M.; Scacchiafichi, L.N.; Wania, A.; Ambar, M.; Anguiano, E.; Buckwell, A.; Strijker, D. Farmland abandonment in Europe: Identification of drivers and indicators, and development of a composite indicator of risk. Land Use Policy 2015, 49, 20–34. [Google Scholar] [CrossRef]
- Russo, P.; Tomaselli, G.; Pappalardo, G. Marginal periurban agricultural areas: A support method for landscape planning. Land Use Policy 2014, 41, 97–109. [Google Scholar] [CrossRef]
- Kopiński, J.; Matyka, M. Assessment of Regional Diversity Correlations of Environmental and Organizational-Production Factors in Polish Agriculture. Probl. Agrc. Econ. 2016, 1, 56–78. [Google Scholar]
- Marks-Bielska, R. Conditions underlying the regional diversity of the area structure of farms in Poland. Acta Scientiarum Polonorum. Oeconomia 2016, 15, 105–116. [Google Scholar]
- Berre, D.; Baudron, F.; Kassie, M.; Craufurd, P.; Lopez-Ridaura, S. Different ways to cut a cake: Comparing expert-based and statistical typologies to target sustainable intensification technologies, a case-study in Southern Ethiopia. Exp. Agric. 2016, 55, 191–207. [Google Scholar] [CrossRef] [Green Version]


| In Detail: | Metropolitan Area (MA) | Poland | |||||
|---|---|---|---|---|---|---|---|
| Warsaw | Krakow | Tricity | Wroclaw | Poznan | Lublin | ||
| Average salary (national average = 100%) - Core city | 133.1 | 111.0 | 114.7 | 110.4 | 110.8 | 97.4 | 100.0 |
| Population, 2019 (in 1000 inhab.) - Core city - peri-urban area | 1778.0 1476.4 | 771.7 763.2 | 749.0 836.1 | 640.6 414.9 | 536.4 901.3 | 339.7 270.3 | 38,411.1 |
| Population density, 2019 (in inhab./km2) - Core city - peri-urban area | 3440.6 221.5 | 2362.5 204.4 | 1810.0 132.0 | 2189.9 118.5 | 2050.0 151.9 | 2303.4 137.0 | 123.0 |
| % UAA of total area, 2010 - Core city - peri-urban area | 33.3 45.0 | 28.4 47.1 | 28.3 48.5 | 44.1 58.6 | 43.0 65.3 | 46.0 66.1 | 49.4 |
| Indicators | 1996 | 2002 | 2010 | Rate of Change | |||
|---|---|---|---|---|---|---|---|
| Mean | SD | Mean | SD | Mean | SD | ||
| Farms with total farm area <1 ha (%) | 36.9 | 0.17 | - | - | 36.5 | 0.18 | −0.4 pp |
| Share of total farm area of farms <1 ha (%) | - | - | 3.9 | 0.07 | 2.5 | 0.06 | −1.4 pp |
| Farms with total farm area >10 ha (%) | 8.9 | 0.13 | - | - | 10.9 | 0.16 | +2.0 pp |
| Share of total farm area of farms >10 ha (%) | - | - | 53.2 | 0 | 64.9 | 0.28 | +11.7 pp |
| UAA on farms on average (ha) | 6.6 | 5.67 | - | - | 10.7 | 11.8 | +62.1% * |
| Share of farms conducting agricultural activity (%) | 97.6 | 0.10 | - | - | 95.9 | 0.10 | −1.7 pp |
| Share of subsistence farms (%) | 10.5 | 0.11 | - | - | 24.3 | 0.17 | +13.8 pp |
| Share of abandoned agricultural area (%) | 8.3 | 0.10 | - | - | 14.5 | 0.17 | +6.2 pp |
| Share of UAA under permanent grassland (%) | 16.3 | 0.13 | - | - | 12.0 | 0.12 | −4.3 pp |
| Share of UAA under permanent crops. including orchards (plantations of fruit-bearing trees and shrubs and nurseries) | 2.5 | 0.04 | - | - | 2.8 | 0.08 | +0.3 pp |
| Share of ARA under cereals (%) | 68.7 | 0.11 | - | - | 69.4 | 0.13 | +0.7 pp |
| Share of ARA under vegetables (%) | 2.7 | 0.07 | - | - | 2.9 | 0.08 | +0.2 pp |
| Farms with vegetables (%) | - | - | 34.6% | 0.18 | 8.7 | 0.11 | −25.9 pp |
| Agricultural labor input per 100 ha (AWU/100 ha UAA) | 16.7 | 12.1 | - | - | 14.1 | 11.6 | −2.6 pp |
| Farm-holders with at least secondary agricultural education (%) | - | - | 6.9% | 0.06 | 11.0 | 0.09 | +4.1 pp |
| Farms with cattle (%) | 54.1 | 0.21 | - | - | 18.9 | 0.14 | −35.2 pp |
| Farms with pigs (%) | 43.0 | 0.22 | - | - | 16.7 | 0.16 | −26.3 pp |
| Farms with horse (%) | 17.5 | 0.11 | - | - | 5.7 | 0.07 | −11.8 pp |
| Farms without livestock (%) | 23.3 | 0.20 | - | - | 52.8 | 0.18 | +29.5 pp |
| Livestock density (LU/100 ha of UAA) ** | 49.0 | 33.4 | - | - | 41.4 | 23.1 | −15.5% * |
| Share of farms producing mainly for the market (%) | 43.1 | 0.24 | - | - | 64.1 | 0.19 | +21.0 pp |
| Farms with non-agricultural economic activity (%) | 4.7 | 0.03 | - | - | 16.4 | 0.09 | +11.7 pp |
| Farms with high income (>50%) from non-agricultural activities (%) | 3.7 | 0.03 | - | - | 9.0 | 0.06 | +5.3 pp |
| Tractors per 100 ha UAA | 8.6 | 3.58 | - | - | 9.7 | 5.85 | +12.8% * |
| Combine harvesters per 100 ha UAA | 0.58 | 0.36 | - | - | 0.96 | 0.59 | +65.5% * |
| Variable | Factor | ||||||
|---|---|---|---|---|---|---|---|
| F1 | F2 | F3 | F4 | F5 | F6 | F7 | |
| Farms with a total farm area >10 ha (%) | 0.825 | ||||||
| Farms with a total farm area <1 ha (%) | −0.709 | ||||||
| Average UAA of farms (ha) | 0.618 | ||||||
| Farm-holders with at least secondary agricultural education (%) | 0.731 | ||||||
| Share of ARA under cereals (%) | 0.721 | ||||||
| Tractors per 100 ha UAA | −0.614 | ||||||
| Combined harvesters per 100 ha UAA | −0.601 | ||||||
| Farms with a horse (%) | 0.705 | ||||||
| Farms with cattle (%) | −0.606 | ||||||
| Farms with pigs (%) | −0.615 | ||||||
| Farms without livestock (%) | 0.840 | ||||||
| Livestock density (LU/100 ha of UAA) | −0.670 | ||||||
| Share of a total farm area of farms <1 ha (%) | −0.820 | ||||||
| Share of a total farm area of farms >10 ha (%) | 0.873 | ||||||
| Share of ARA under vegetables (%) | 0.911 | ||||||
| Share of UAA under permanent crops, including orchards (%) | 0.887 | ||||||
| Farms with non-agricultural economic activity (%) | 0.895 | ||||||
| Farms with high income (>50%) from non-agricultural activities (%) | 0.908 | ||||||
| Share of farms conducting agricultural activity (%) | −0.890 | ||||||
| Share of abandoned agricultural area (%) | 0.812 | ||||||
| Share of subsistence farms (%) | 0.653 | ||||||
| Share of UAA under permanent grassland (%) | 0.878 | ||||||
| Eigenvalues | 5.35 | 2.62 | 2.35 | 1.68 | 1.34 | 1.58 | 1.14 |
| % of variance (68,20) | 22.3 | 10.9 | 9.8 | 7.0 | 6.9 | 6.6 | 4.7 |
| Factor | Kruskal–Wallis Test (p) | Location | ||||
|---|---|---|---|---|---|---|
| Core City | Zone 1 <25 km | Zone 2 25–35 km | Zone 3 35–45 km | Zone 4 >45 km | ||
| Number of municipalities | - | 6 | 60 | 64 | 57 | 55 |
| F1 Horizontal growth and professionalization | 1.78 (0.7745) | 121.2 | 124.9 | 122.6 | 126.9 | 110.8 |
| F2 Reduction of livestock farming | 23.06 (0.0001) * | 98.0 | 149.3 | 134.7 | 104.4 | 96.0 |
| F3 Farmland concertation | 60.11 (0.0000) * | 234.5 | 164.0 | 125.4 | 88.4 | 92.5 |
| F4 Specialization (vegetables and orchards) | 5.61 (0.2302) | 115.0 | 132.6 | 123.9 | 125.4 | 103.1 |
| F5 Off-farm diversification of income | 1.34 (0.8542) | 98.0 | 117.5 | 126.0 | 125.1 | 119.4 |
| F6 Farmland abandonment | 1.74 (0.7822) | 90.0 | 124.4 | 121.8 | 125.7 | 117.0 |
| F7 Deintensification | 7.11 (0.1297) | 136.2 | 137.7 | 105.1 | 121.3 | 121.3 |
| Indicators (Selected) | Mdn | Kruskal–Wallis Test (p) | Location | ||||
|---|---|---|---|---|---|---|---|
| Core City | Zone 1 <25 km | Zone 2 25–35 km | Zone 3 35–45 km | Zone 4 >45 km | |||
| Farms with a total farm area >10 ha in 1996 (%) | 10.2 | 20.4 (0.0004) * | 62.2 | 98.2 | 114.8 | 137.8 | 144.3 |
| Farms with a total farm area >10 ha in 2010 (%) | 12.6 | 13.0 (0.0109) * | 81.0 | 102.0 | 115.6 | 134.9 | 140.1 |
| Average UAA of farms in 1996 (ha) | 6.7 | 9.17 (0.0493) * | 142.3 | 105.7 | 111.4 | 130.6 | 138.6 |
| Average UAA of farms in 2010 (ha) | 8.4 | 5.4 (0.2450) | 155.2 | 111.9 | 112.5 | 126.8 | 133.2 |
| Farm-holders with at least secondary agricultural education in 1996 (%) | 7.1 | 0.26 (0.9921) | 133.3 | 121.3 | 120.7 | 123.2 | 119.6 |
| Farm-holders with at least secondary agricultural education in 2010 (%) | 12.0 | 0.49(0.9741) | 133.7 | 122.6 | 118.4 | 123.8 | 118.1 |
| Indicators (Selected) | Mdn | Kruskal–Wallis Test (p) | Location | ||||
|---|---|---|---|---|---|---|---|
| Core City | Zone 1 <25 km | Zone 2 25–35 km | Zone 3 35–45 km | Zone 4 >45 km | |||
| Farms without livestock in 1996 (%) | 18.3 | 29.08 (0.0000) * | 218.8 | 146.9 | 123.6 | 104.6 | 98.0 |
| Farms without livestock in 2010 (%) | 50.2 | 52.8 (0.0000) * | 224.5 | 160.8 | 125.9 | 99.6 | 84.8 |
| Livestock density in 1996 (LU/100 ha of UAA) | 49.2 | 27.25 (0.0000) * | 8.8 | 102.8 | 118.4 | 139.8 | 138.8 |
| Livestock density in 2010 (LU/100 ha of UAA) | 32.9 | 27.27 (0.0000) * | 56.0 | 93.5 | 114.8 | 139.1 | 148.6 |
| Indicators | Mdn | Kruskal–Wallis Test (p) | Location | ||||
|---|---|---|---|---|---|---|---|
| Core City | Zone 1 <25 km | Zone 2 25–35 km | Zone 3 35–45 km | Zone 4 >45 km | |||
| Share of total farm area of farms <1 ha in 2002 (%) | 2.4% | 41.32 (0.0000) * | 205.8 | 154.7 | 129.0 | 99.1 | 88.5 |
| Share of total farm area of farms <1 ha in 2010 (%) | 1.5% | 18.12 (0.0012) * | 135.5 | 144.1 | 133.8 | 106.7 | 96.3 |
| Share of total farm area of farms >10 ha in 2002 (%) | 45.7% | 6.92 (0.1401) | 89.8 | 109.3 | 113.9 | 130.5 | 135.4 |
| Share of total farm area of farms >10 ha in 2010 (%) | 55.3% | 2.74 (0.6006) | 146.8 | 116.7 | 113.5 | 125.1 | 129.4 |
| Indicators | Mdn | Q3 | Kruskal–Wallis Test (p) | Location | ||||
|---|---|---|---|---|---|---|---|---|
| Core City | Zone 1 <25 km | Zone 2 25–35 km | Zone 3 35–45 km | Zone 4 >45 km | ||||
| Share of ARA under vegetables in 1996 (%) | 1.2 | 2.4 | 45.68 (0.0000) * | 217.3 | 160.7 | 114.4 | 112.0 | 86.3 |
| Share of ARA under vegetables in 2010 (%) | 0.7 | 2.5 | 28.26 (0.0000) * | 188.3 | 153.3 | 118.8 | 111.7 | 92.9 |
| Share of UAA under permanent crops, including orchards in 1996 (%) | 1.2 | 2.7 | 37.74 (0.0000) * | 206.6 | 154.0 | 120.3 | 115.8 | 84.1 |
| Share of UAA under permanent crops, including orchards in 2010 (%) | 1.0 | 3.0 | 13.80 (0.0079) * | 153.8 | 146.2 | 120.4 | 111.0 | 103.2 |
| Indicators | Mdn | Kruskal–Wallis Test (p) | Location | ||||
|---|---|---|---|---|---|---|---|
| Core City | Zone 1 <25 km | Zone 2 25–35 km | Zone 3 35–45 km | Zone 4 >45 km | |||
| Farms with high income (>50%) from non-agricultural activities in 1996 (%) | 3.3% | 35.14 (0.0000) * | 203.7 | 159.6 | 102.9 | 108.6 | 105.9 |
| Farms with high income (>50%) from non-agricultural activities in 2010 (%) | 7.9% | 4.30 (0.3669) | 141.8 | 131.0 | 122.9 | 122.5 | 106.2 |
| Farms with non-agricultural economic activity in 1996 (%) | 4.3% | 26.25(0.0000) * | 195.8 | 153.4 | 104.2 | 113.9 | 106.6 |
| Farms with non-agricultural economic activity in 2010 (%) | 15.0% | 2.31 (0.6789) | 125.8 | 132.9 | 115.5 | 118.6 | 118.5 |
| Indicators | Mdn | Quartile | Kruskal–Wallis Test (p) | Location | ||||
|---|---|---|---|---|---|---|---|---|
| Core City | Zone 1 <25 km | Zone 2 25–35 km | Zone 3 35–45 km | Zone 4 >45 km | ||||
| Share of farms conducting agricultural activity in 1996 (%) | 98.9 | Q1 = 96.6 | 7.67 (0.1043) | 56.5 | 111.3 | 125.6 | 128.7 | 127.5 |
| Share of farms conducting agricultural activity in 2010 (%) | 95.8 | Q1 = 90.5 | 4.06 (0.3978) | 78.7 | 112.5 | 124.5 | 125.6 | 128.3 |
| Share of abandoned agricultural area in 1996 (%) | 6.9 | Q3 =12.6 | 6.90 (0.1412) | 194.2 | 123.3 | 117.8 | 117.3 | 120.2 |
| Share of abandoned agricultural area in 2010 (%) | 9.7 | Q3 = 21.6 | 4.56 (0.3352) | 170.5 | 129.7 | 118.8 | 115.9 | 116.0 |
| In Detail | Medium Rank Size | Number of Responses | ||||
|---|---|---|---|---|---|---|
| Strongly Agree | Agree | Undecided | Disagree | Strongly Disagree | ||
| Test H * (2, n = 112) = 14.46; p = 0.0007 | ||||||
| Core City | 26.2 ** | - | - | - | 5 | 7 |
| <25 km to MA Core | 55.7 | - | 13 | 1 | 18 | 7 |
| >25 km to MA Core | 62.9 ** | 3 | 23 | 4 | 22 | 9 |
| In total | - | 3 | 36 | 5 | 45 | 23 |
| In Detail: | Medium Rank Size | Number of Responses | ||||
|---|---|---|---|---|---|---|
| Strongly Agree | Agree | Undecided | Disagree | Strongly Disagree | ||
| Test H * (2, n = 112) = 9.41; p = 0.0090 | ||||||
| Core city | 36.6 ** | - | 1 | - | 5 | 6 |
| <25 km to MA Core | 66.4 | 4 | 14 | - | 15 | 6 |
| >25 km to MA Core | 54.1 | 1 | 16 | 3 | 24 | 17 |
| In total | - | 5 | 31 | 3 | 44 | 29 |
| In Detail | Medium Rank Size | Number of Responses | ||||
|---|---|---|---|---|---|---|
| Strongly Agree | Agree | Undecided | Disagree | Strongly Disagree | ||
| Test H * (2, n = 112) = 11.52; p = 0.0031 | ||||||
| Core city | 81.1 ** | 11 | 1 | - | - | - |
| <25 km to MA Core | 58.3 | 19 | 20 | - | - | - |
| >25 km to MA Core | 50.5 ** | 24 | 31 | 2 | 4 | - |
| In total | - | 54 | 52 | 2 | 4 | - |
| In Detail | Medium Rank Size * | Number of Responses | ||||
|---|---|---|---|---|---|---|
| Strongly Agree | Agree | Undecided | Disagree | Strongly Disagree | ||
| Test H (2, n = 112) = 15.41; p = 0.0004 | ||||||
| Core city | 82.2 ** | 3 | 7 | - | 2 | - |
| <25 km to MA Core | 62.8 | 2 | 19 | 4 | 12 | 2 |
| >25 km to MA Core | 47.3 ** | 2 | 14 | 10 | 28 | 7 |
| In total | - | 7 | 40 | 14 | 42 | 9 |
Publisher’s Note: MDPI stays neutral with regard to jurisdictional claims in published maps and institutional affiliations. |
© 2021 by the authors. Licensee MDPI, Basel, Switzerland. This article is an open access article distributed under the terms and conditions of the Creative Commons Attribution (CC BY) license (https://creativecommons.org/licenses/by/4.0/).
Share and Cite
Sroka, W.; Żmija, D. Farming Systems Changes in the Urban Shadow: A Mixed Approach Based on Statistical Analysis and Expert Surveys. Agriculture 2021, 11, 455. https://doi.org/10.3390/agriculture11050455
Sroka W, Żmija D. Farming Systems Changes in the Urban Shadow: A Mixed Approach Based on Statistical Analysis and Expert Surveys. Agriculture. 2021; 11(5):455. https://doi.org/10.3390/agriculture11050455
Chicago/Turabian StyleSroka, Wojciech, and Dariusz Żmija. 2021. "Farming Systems Changes in the Urban Shadow: A Mixed Approach Based on Statistical Analysis and Expert Surveys" Agriculture 11, no. 5: 455. https://doi.org/10.3390/agriculture11050455
APA StyleSroka, W., & Żmija, D. (2021). Farming Systems Changes in the Urban Shadow: A Mixed Approach Based on Statistical Analysis and Expert Surveys. Agriculture, 11(5), 455. https://doi.org/10.3390/agriculture11050455