Abstract
Decision Support Tools (DSTs) in agriculture have been widely developed but have not been well accepted by smallholder farmers. One reason for the limited use is that the tools do not account for the complexity of heterogeneous smallholder farming systems. Identifying farm typologies has facilitated technology transfer to target groups of farmers. Accounting for heterogeneity in farm systems can help in designing and deploying DSTs to address farmer needs. Typology analysis was applied to a 600-household survey dataset to identify different farm system types. Qualitative participatory research was used to assess the potential deployment of DSTs for fertilizer management. Six types of farm systems were identified with distinct characteristics in the study area of central Myanmar. Participatory research through focus group discussions with 34 participants from the six different farm types validated the farm typologies and found that farmers from one type considered that DSTs could be useful in gaining more information and knowledge. An important finding was that DSTs providing prescriptive advice were inconsistent with what many farmers want. Farmers indicated that discussion groups are a preferred learning-based approach rather than a prescriptive tool. Farmers preferred video clips and infographics integrated into existing familiar digital platforms. This study identifies heterogeneity within a large farm sample and develops a deeper understanding of fertilizer decisions as well as knowledge and intentions related to the use of DSTs or apps via follow-up focus group discussions. Incorporating a participatory research framework with typology identification can have a beneficial role in direct interactions with smallholders that may increase their acceptability of DSTs. This study has generated valuable information about farmer types and serves as a starting point for developing a framework for discussion support systems that may better relate to the needs of farmers.
1. Introduction
Myanmar is a country having abundant natural resources with substantial potential for development. The agricultural sector plays a vital role in the country’s economy, contributing 38% of the country’s GDP, accounting for 25–30% of total export earnings and employing more than 70% of the labor force [1]. However, the crop yields are reported to be generally low and agricultural productivity has underperformed compared to other countries in Asia [2]. Reports have highlighted that uncertainty in fertilizer decisions is a key factor contributing to the underperformance [3,4,5,6]. In Myanmar, most fertilizer decisions are based on visual field observations and advice from other village farmers [7]. The agriculture extension services are under-resourced [8] and practice a ‘traditional extension approach’ focusing on individual contact with ‘progressive farmers’ who are generally resourceful and easiest to reach, leaving a majority of farmers neglected [9,10]. Therefore, it is important to improve information access by smallholder farmers to enable more effective decision making.
The focus on digital technology has been increasing, especially in developing countries such as Myanmar, where 80% of the population now owns a mobile phone [11]. This provides an opportunity for smallholder farmers to use mobile phones in farm-level decision making. Thar et al. [12] found that farmers in Myanmar were optimistic and positive towards agricultural mobile apps although there are many constraints to adoption. Decision Support Tools (DSTs) are electronic-based information technologies that can reduce uncertainty in farmer decision making [13]. The use of mobile device-based DSTs in agriculture can help farmers access knowledge and information in a timely manner.
DSTs have been widely developed and are readily available in the field of agriculture [14]. They are tools designed to provide solutions for crop preparation and planning, and sowing and harvesting, as well as providing recommendations for different management practices (e.g., seed rates, irrigation, pest and disease remedies, fertilizer application) according to seasonal climate variability (e.g., rainfall and temperature) [15]. Despite these potential uses and benefits, there is limited evidence of the acceptance of these tools by farmers [16,17,18,19]. The challenges to successful uptake by farmers include limited user participation and involvement in the design and implementation of the tool [17,20], lack of trust in the information and recommendation provided [21,22], tools not being simple and easy to use, and requiring advanced digital skills [23,24]. Socioeconomic [25] and behavioral factors [26] are also important.
Applied research has been conducted to address these challenges and improve the DSTs, including use of participatory approaches and consideration of user-centered aspects for successful delivery of DSTs [27,28,29,30,31,32,33,34,35]. Participatory approaches have been successful in gaining interest from farmers and policy makers with promising results for adoption. Yield Prophet [36,37] is an example of a DST that integrated participation of farmers, advisers and researchers [38,39] and is one of few tools still continuing today [40,41,42]. However, the long-term sustainable adoption of DSTs continues to be doubtful [43].
There are many examples of technologies that have not been utilized by smallholder farmers [44] as they fail to recognize the complex heterogeneity among farming populations [45]. Smallholder farming systems are heterogeneous because of differences in socioeconomic and agro-ecological characteristics [46,47,48]. It is important to consider the heterogeneity of the farmers so that any DST can be designed to reflect farmer needs and target appropriate end users. This study addressed the research question of whether different farm types exhibit significantly different patterns in the intention to adopt mobile-based DSTs.
Farm typology analysis has been used to classify farmers with similar circumstances based on selected criteria and has been helpful in targeting technological interventions for rapid transfer and adoption [16]. Many studies have addressed the importance of farm household typology influencing farm technology adoption [49], nutrient management technologies [50,51,52], resource use efficiency [53], integrated pest management [46], and climate smart agricultural practices [54,55].
Farm typology studies are useful for understanding factors explaining the adoption and/or rejection of new technologies [56]. From a practical point of view, identifying the reasons for farmer adoption and/or rejection of new DSTs is important for the agricultural society, policy makers and related economic sectors. In particular, the typology of farmers, along with their opinions on DSTs, can provide useful policy insights on whether and how these tools can contribute to diffusion of innovations and rural development.
This study focuses on the types of smallholder farmers and their preference towards information access in Myanmar. We used typology analysis, applied to a survey dataset, to identify different farm system types and used qualitative participatory research to assess potential deployment of decision support tools for fertilizer management. Previous studies have utilized various participatory approaches but have not accounted for complexity of heterogeneous smallholder farming systems. The findings from this study may help developers of tools for decision support. The research aimed to:
- −
- develop farm household types for a population of smallholder farmers in central Myanmar, and
- −
- introduce the concept of a DST to farmers and explore whether farmers in different farm types exhibit different opinions towards digital tools.
2. Method
A structured questionnaire-based survey was conducted using the CommCare® mobile data collection platform to collect detailed information from 600 farm households. A multivariate analysis developed typologies of farm types based on socioeconomic information and the basis for fertilizer decisions. Subsequently, focus group discussions (FGDs) were conducted with members from each farm type. The objectives of the FGDs were to validate the farm typology, explore how farmers in each farm type make fertilizer decisions for cereal crops, introduce the concept of a mobile-based DST, and obtain opinions about using such tools in fertilizer decision making. We developed a deeper understanding of the heterogeneity of farmer preferences to identify potential early adopters of a mobile-based DST. Figure 1 illustrates the analytical framework of the study.
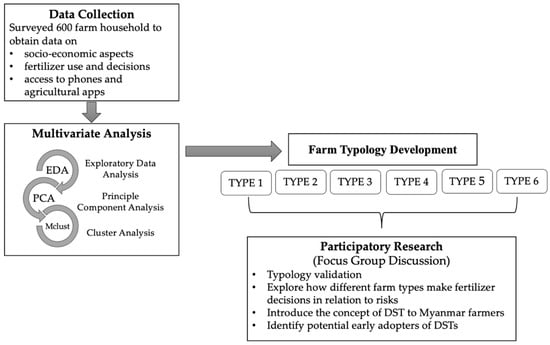
Figure 1.
Analytical framework of the study.
2.1. Study Area
The study areas were located in Central Myanmar, which is made up of the Central Dry Zone (CDZ) and the upper Bago District. Central Myanmar is considered a major agricultural region providing 35% of Myanmar’s grain cropping [4]. It is also recognized as a priority area for agricultural development to fulfill the food production needs of the country [57]. The study was undertaken in three townships within Central Myanmar: Tatkon, Zeyarthiri and Taungoo (Figure 2). Tatkon and Zeyarthiri townships are in the Nay Pyi Taw district within the CDZ, and Taungoo township is in the upper region of the Bago district. Ten villages with the highest population of farmers from each township were selected with the help of the local extension officers. Mobile phone ownership in the study area was reported to be high, with 71% of farmers owning a mobile phone with 62% owning a smartphone [12].
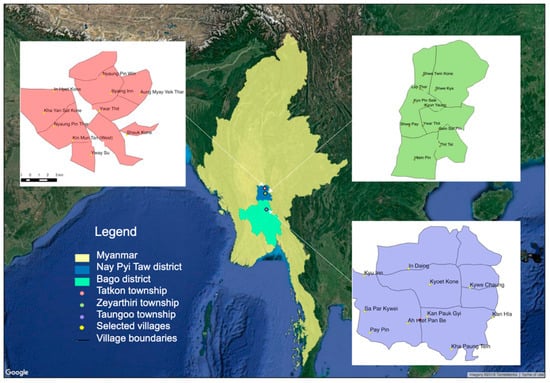
Figure 2.
Map of Myanmar showing the study areas.
2.2. Survey
A stratified systematic sampling technique [58,59] was used to randomly select the farmers. A 20:1 sample-to-item ratio [60] was used to generate a representative sample of the farmer populations in each township. The survey questionnaire contained 30 items/topics; hence, 600 respondents were randomly selected for the study [61]. To have respondents from each township equally, 6% of the farmers from the 10 selected villages from each township were specified, comprising 258 respondents in Tatkon, 196 respondents in Zeyarthiri and 146 respondents in Taungoo (Table 1). Based on the gender ratio within the population in the study area, a ratio of 8:2 for male and female farmers was selected.

Table 1.
Sample size determination.
A total of 600 farmers were personally interviewed with a structured questionnaire using the CommCare® mobile data collection app [62] from May to June 2018 [63]. In general, the survey questionnaire was structured to understand farmers’ fertilizer use and decisions. The dataset provided information on farm household demographics, farmland and crops, inputs for farmer fertilizer and water use, factors influencing decisions on fertilizer, outputs and other sources of income. Other information collected related to farmers’ access to mobile phones (smartphones) and the use of agricultural mobile apps for farm decision making. In total, the dataset included 410 variables.
2.3. Typology Construction
The typology approach has been used in studies to characterize farming systems [49,55,64]. Multivariate statistical methods, namely principal component analysis (PCA) and cluster analysis (CA), are widely used to construct farm typologies [65,66]. Hence, PCA was used for data reduction via linear transformation of a large set of correlated variables into an uncorrelated set of principal components. Information from the original set of variables was preserved in this transformation. Principal components (PCs) were selected based on examination of scree plots and cumulative variances [67]. The variables were identified through exploratory data analysis (EDA) and carefully selected since PCA is highly sensitive to outliers [68]. To ensure robustness, the variables were checked for outliers using box and whisker plots. Subsequently, one household was eliminated from the sample, resulting in a total of 599 respondents.
Variables for PCA were selected using Kaiser-Mayer-Olkin (KMO) and Bartlett’s sphericity tests to check data credibility [67]. Seventeen variables representing both socioeconomic characteristics and fertilizer practices were used for the PCA. Orthogonal rotation (varimax method) was used to group the study variables [69]. All PCs exceeding an eigenvalue of 1 were initially retained for multivariate statistical analysis. These non-related PCs were used as inputs for the CA, which was undertaken using model-based clustering with the ‘mclust’ algorithm [70]. This allows the number of variables to be decreased while retaining the information of value in the dataset. An optimal number of clusters was identified based on the Bayesian Information Criterion (BIC) [71,72]. Statistical analyses were performed with R (version 4.0.2) [73], using ‘psych’ [74] and the ‘mclust’ packages [75]. The identified farm types were then used for the FGDs.
2.4. Procedure for FGDs
A farmer participatory approach allows researchers and farmers to work together in a co-learning environment to explore different management options and learn about conditions to develop sustainable interventions [76,77]. Many studies have identified the importance of participatory approach in the development of technology such as DSTs [29,33,78,79,80]. Carberry et al. [38] suggested that the participation of farmers and advisors working alongside researchers was the key to success in the design, implementation and interpretation to decision support. The focus group method is a participatory research approach used to collect qualitative data [81]. Dimes et al. [78] reported an experience of using crop models with a focus group of smallholder farmers in Zimbabwe. As the purpose of the study was to introduce the concept of a DST and explore farmers’ opinions about digital tools to understand the best ways to support farmers up-skilling and re-skilling in the digital area, FGDs were adopted as an appropriate method to fully engage with farmers. FGDs are designed to obtain participant perceptions on a well-defined area of interest and are a valuable way to obtain a range of perceptions, feelings and opinions from interviewed groups of people [82].
In FGDs, opinions of individual participants are converted to a more or less shared group opinion [83]. In this study, six FGD workshops were conducted, one for each of the farmer types derived from the typology analysis. This was undertaken because farmer groups of similar types face similar constraints and may generate similar management strategies. But individual farmer characteristics, decisions, values, culture, background, and personal goals will remain different and the study can account for the observed individual differences [84]. This approach enables investigation of more diverse views and allows comparison of results between groups.
There were 34 participants in the six different farm types. These were a subset of randomly selected farmers from the original household survey. The size and composition of focus group members in terms of farm types and gender are indicated in Table 2.
Table 2.
Composition of focus group members.
Farmers were invited to the group discussions with the help of the local agricultural extension officers. The FGDs were conducted by personal interview, and farmers were given sticky notes on which to write their answers. Farmers who needed assistance with writing were helped. Most farmers were able to write. The discussions were based on three main topics:
- (1)
- Typology Validation;
- (2)
- Fertilizer Decisions/Risks; and
- (3)
- Decision Support Tools/Apps.
Focus group responses were translated from Burmese to English and were analyzed in NVivo Qualitative data analysis software (version 12.3.0) [85].
3. Results
3.1. Typology Identification
The KMO criterion confirmed that the PCA analysis was appropriate for the sample. The value of KMO for the analysis was 0.7, which is regarded as acceptable, and all KMO values for individual variables were equal or greater than 0.54, which is above the threshold limit of 0.50 [67]. Bartlett’s test of sphericity hypothesizes that the original correlation matrix is an identity matrix. We rejected the null hypothesis at the 5% level (p-value = 0 < 0.05) with a Chi-square value of 9391, indicating that the relationship among the variables was strong and appropriate for factor analysis. Furthermore, the determinant of the matrix has a value of 0.00006, which is greater than the critical value 0.00001, which also rejects multicollinearity among variables. The variables used for PCA are listed in Table 3.
Table 3.
List of variables used in PCA.
In PCA, based on the scree plot (Figure 3) seven components with above one eigen value were selected for cluster analysis. These components accounted for 70% of variability.
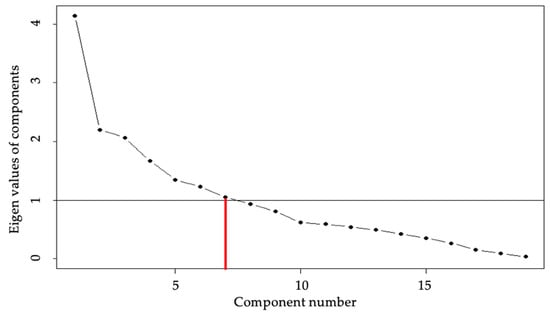
Figure 3.
Scree plot from PCA results for selecting components.
Figure 4 illustrates the contribution of variables to the PCs. Black lines indicate positive contribution and red lines indicate negative contribution. Higher degrees of land ownership, sown area, number of crops and crop income contribute to component 1. Age and experience variables contribute to component 2. Component 3 is highly crop diversified with high cereal intensity and high in marketing mode indices. Higher marketing mode indices indicate the ability of the farmer to take the produce to the vendor. Component 4 reflects the higher degree of N use and irrigated area. Education and mechanization variables contribute highly and positively to component 5. Household size and livestock units contribute more to component 6. Household size and off-farm income is higher for component 7. These components were used for cluster analysis.
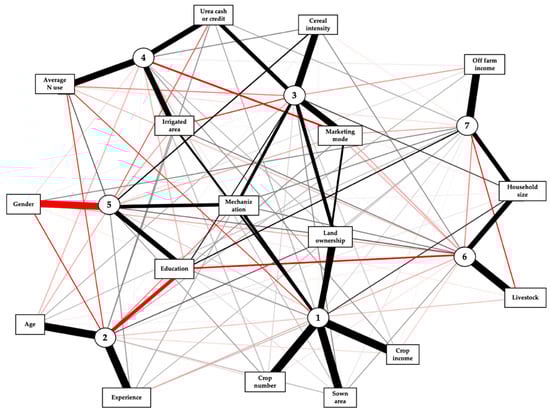
Figure 4.
Contribution of selected variables to the PCs.
Following the methods explained above, six types of farm systems were identified. This selection was based on BIC statistics generated from a model-based clustering VVV (ellipsoidal, varying volume, shape, and orientation) model [72]. The selected six clusters showed the highest BIC value. The farm types were named after key livelihood assets and activities (Table 4). Details of the characteristics of the farm types are in Table 5.
Table 4.
Name of farm types and their share in the sample.
Table 5.
Characterization of identified farm types.
Farm Type 1 (Small and subsistence) comprised 19% of the surveyed farm households. It was male-dominated, with less than 1% female farmers in the group. This farm type comprised farmers having small land holdings, middle-school education with low crop diversification and cultivating on average two crops per year. This cluster was characterized by moderate crop income, low off-farm income and no livestock ownership. These households, on average, secured most of their income from crops.
Farm Type 2 (Large and semi-intensive, on farm) comprised 21% of the surveyed households, with equal numbers of male and female farmers in the group. These farmers had relatively large land holdings, middle-school education, low resource endowments of livestock and machinery, and cultivated two crops per year. Farmers relied on farm income and did not earn any income from off-farm work.
Farm Type 3 (Small and intensive) comprised 32% of the surveyed farm households, with only 2% female farmers. Farmers in this type were very experienced with an average of 30 years farming history. This cluster was characterized by smaller areas of land holdings, primary-school education levels, low resource endowments (livestock/machinery), and cultivated three or more crops per year. The cluster members earned low crop income and low off-farm income.
Farm Type 4 (Diversified and off farm) comprised 17% of the surveyed farm households, with a quarter of members being female. The farm type consisted of farmers having moderate-sized land holdings, middle-school education, low livestock ownership, moderate ownership of machinery, and cultivated four or more crops per year. The farmers belonging to this cluster had high off-farm income to offset their low crop income.
Farm Type 5 (Small and subsistence female farm) comprised 8% of the surveyed farm households and were all female farmers. They possessed small land holdings, primary-school levels of education, low resource endowments (livestock/machinery), and cultivated three or more crops per year. Female farmers had less farming experience. They obtained moderate income from crops but secured a substantial proportion of off-farm income from sewing, working as street vendors or operating small shops.
Farm Type 6 (Commercial farm) represented highly resourced farmers and comprised only 3% of the surveyed farm households. The farmers belonging to this farm type were male with very large land holdings, middle-school education and high resource endowments. They have emerged as integrated farms with high crop diversification to generate higher income with minimal risks. These farmers are diversified, with animal husbandry (high livestock ownership) and high mechanization, with high off-farm income.
3.2. Typology Validation
To verify whether the model-generated typologies resemble reality, validation was undertaken by discussion with an expert group of extension officers, followed by FGDs with members from each of the farm types. Common indicators (e.g., landholding, livestock ownership, on/off-farm income) for each farm type were identified by discussing with the expert group of local extension officers based on Haileslassie et al. [86]. Using these identified indicators, a qualitative comparison (low, high) between the different typologies was obtained for farmers from the focus group of each farm type. And this was confirmed by local experts. A comparison of the six identified farm types in terms of key indicators is in Table 6. These results were found to resemble and match the model-generated farm types.
Table 6.
Comparison of the six identified farm types to validate the typology.
3.3. Fertilizer Decisions/Risks
Once the model-generated farm system types were validated, FGD participating farmers were asked if they apply any fertilizer to monsoon rice and the crop yield achieved. All participating farmers were using fertilizer. Farmer answers were placed on a graph, so farmers were able to see that they apply different rates, and even if some applied the same rates, they receive different yields (Figure 5). The relationship between yield and fertilizer (N rates) was explained to farmers. Later, the reasons for different yields were asked of the farmers: “why they think they obtained less/more yield”. Nominated factors included crop variety, soil condition, weather, pest and disease infestation, water availability, input affordability as well as risk taking by the farmers.
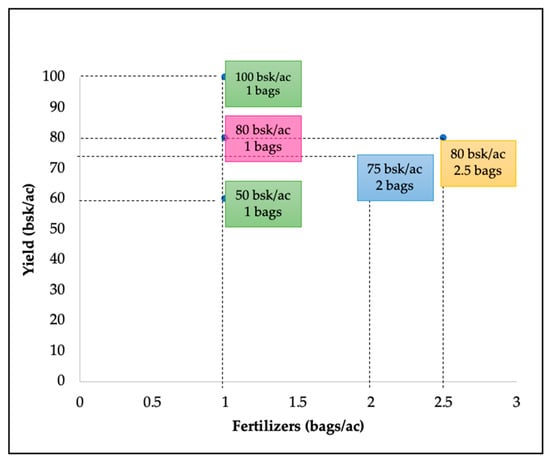
Figure 5.
Diagram used to help explain the relationship between yield and fertilizer (participation of farmers from Type 4). Bag = 50 kg bag of fertilizer, 1 bsk = 20.9 kg of rice.
Farmers mentioned the risky cropping environments due to variability in climate and market prices. Farmer fertilizer decisions depended substantially on economic considerations as they must borrow money to buy fertilizer and pay interest and principal in repaying the loan. Farmers were asked about “the important factors they consider in making these investment decisions”. Interest rates and market prices were the two main factors emphasized by farmers in all farm types. Incentives to invest and opportunities to reduce risk were also mentioned. Most farmers in all farm types were borrowing money for farm operations (Table 7).
Table 7.
Borrowing practices, attitudes to risk and sources of trusted information by different farm types.
The degree of risk-taking differed among farmers, with some willing to take more risk than others [87]. Farmers’ attitudes to risk are often related to the financial ability of the farmer to accept a small gain or loss [88]. The attitudes of farmers can be categorized as: risk-averse, those who avoid taking risks; risk-takers, those who are open to riskier business options; and risk-neutral, farmers who lie between the risk-averse and risk-taking [89]. Farmers were asked to rate their willingness to take risks in making decisions on a five-point scale (1 = risk-averse and 5 = risk-takers). Overall, as indicated by the average scores in Table 7, commercial farmers in farm Type 6 were high risk takers (as they have other sources of income) and smallholders generally do not take risks because they do not have other assets or alternative income sources. Female smallholders were also less likely to take risks as they focus more on the possible negative outcomes. One farmer in farm Type 6 believed that the higher the investment, the more the profit, so he takes risks. Discussions on trusty information sources are shown in Table 7.
With respect to fertilizer decisions, smallholders in Farm Type 1 trust information provided by experienced people with an agricultural background or experience, including extension officers and foreigners. Farmers in Farm Type 2 rely on fertilizer agents for information, while farmers in Farm Types 3 and 4 trust other farmers who are doing well. Female farmers in Farm Type 5 look up to experienced male farmers and often ask them for advice. Farm Type 6 farmers are more pragmatic, and one farmer stated that “I only believe when I can see the outcome”.
3.4. Decision Support Tools/Apps
3.4.1. Describing a DST to Farmers
After discussing fertilizer decisions and risks, the concept of a mobile-based fertilizer DST was introduced to the FGD groups. A DST was a new concept to smallholders. Although some farmers had not previously heard of a DST, many farmers were aware of agricultural mobile apps and had some understanding of their ability to provide information. The agricultural mobile apps currently available in Myanmar and the functions available were discussed and listed on a flip chart. It became clear that there is no program providing information regarding N fertilizer and yield or cost/benefit calculations that could be used by farmers.
An example prototype of the RiseHarvest mobile-based DST was shown to farmers for demonstration purposes (Figure 6). The application was still in the testing stage and the recommendations provided were not necessarily accurate. However, farmers were provided with a general understanding of how the tool operates, and they were shown the information they need to enter and how the recommendations would be delivered based on their data input. Farmers liked the picture icons and the voice features, especially farmers who could not read. Farmers were confused about why the information needed to be repeated for every season and saw no reason for this information over the long term. Some comments were:
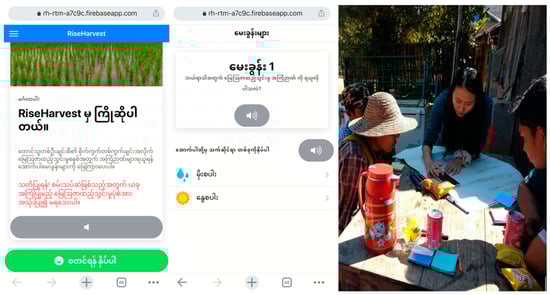
Figure 6.
Prototype of RiseHarvest app used to demonstrate the concept of a DST to farmers in central Myanmar.
“I’ll probably just use it maybe once because the information I’ll enter will be the same”.
“We often save seeds for the next season so we use the same inputs every time so there won’t be any difference”.
Then farmers were asked “what information would be most helpful for you from a DST?” The answers varied among and between the farm types (Table 8).
Table 8.
Information most helpful to farmers.
Farmers in Farm Type 1 were mainly interested in pest and disease information as they had bad experience with pests on rice in the previous years. Farmers were aware of the Plant Protection app [12] because they have seen extension officers using it. This app has information about pesticides based on crop type. But farmers prefer to have the extension officer using the app instead of using it themselves. Some comments were:
“Last year there was an aphid outbreak and farmers were not sure what to do. We asked our local extension officer, and she opened an app on her phone and told us what pesticide to use and it was resolved”.
“We prefer when extension officers to use app when we ask them because we consider it is like getting a third opinion when we are unsure about our decision or something else”.
Farm Type 2 farmers were keen to know more about the signs and symptoms of the plant indicating when fertilizer should be applied. They wanted more information so they can decide themselves and not be given direct information of the time or rate to apply. Some comments were:
“We use fertilizer based on the plant condition. When the plant is showing some signs such as yellowing of leaf color, we apply fertilizer”.
“We only know to apply fertilizer when the plant is yellow. We will like to learn other signs and symptoms of the plant which shows when to apply fertilizer. We will also like to know how much to apply based on what nutrients are deficient, so we don’t apply when it’s not necessary”.
Farmers in Farm Type 3 had concerns about climate change and preferred information about planting and fertilizer application times based on seasonal weather variability. These changes are having an impact on crop yields and influencing decisions about investing in crop inputs. The uncertainty in crop yields due to climate change is a friction on the use of more crop inputs. The need for drought resistant crop varieties was also raised by farmers. Some comments were:
“We experience crop failure and loss due to irregular weather patterns such as drought during cultivation time and unseasonal rainfall during harvesting time”.
“It will be beneficial to us if we can cultivate according to climate variation at each planting stage”.
“We are not sure when to start planting as the monsoon season is becoming shorter”.
“Because of weather uncertainty, we decide not to add many inputs as we cannot afford to take such risks since most of the inputs were bought on credit”.
Cost-benefit calculation to estimate profit was the most important information that farmers in Farm Type 4 wanted in a DST. Some comments were:
“We will like to know how much we will profit before investing in inputs such as fertilizers”.
“These days market prices of crops fluctuate a lot, so it is hard for us to decide if we are going to profit or lose”.
Farm Type 5, which were the all-female farmers, also stated the importance of seasonal weather information. Female farmers have raised the issue of not having access to water as they cannot go out to the field at night to pump the water. Therefore, they can only depend on rainwater. Some comments were:
“We don’t have access to water because we cannot go out at nighttime. Male farmers can go out to the field at night to pump water”.
Farmers in Farm Type 6 are more commercially oriented and have income sources from businesses (renting machinery, livestock breeding/selling) or from different crops grown, providing offsetting income. Therefore, they can take risks. They can also afford tube wells, so they depend less on rain or water from dams to irrigate their fields. Some comments were:
“I know I use more fertilizer than other farmers, but I don’t want to reduce the amount because I don’t know how much exactly I need to put based on the plant and soil condition, so I always put more. So, a fertilizer DST can be beneficial for me because, it might help me to reduce the use of fertilizer”.
“I have 6 wells where I can pump water to irrigate my fields so I don’t count on rain but strong winds during flowering time can damage crops. It would be good if we can know earlier to prevent”.
3.4.2. Farmer Opinions on Fertilizer DSTs
Farmers were asked questions relating to their preferences for information access, including their intention to use the DST and whether they thought it would be beneficial. They were asked to provide their opinions about DSTs. The results are shown in Table 9. Farmers in Farm Type 2 were optimistic and thought that the DSTs may be useful in allowing them to gain more information and knowledge. They appeared more likely to adopt the fertilizer DST than other farmers. Farmers in Type 1 showed slight interest in the tool. Some cultural barriers were noted by farmers in Farm Type 3, such as farmers not taking phones to the field because they wear longyi (traditional outfit worn by men in Myanmar), which lacks pockets. Lack of digital literacy and quality of the mobile phones were also mentioned as reasons against using the tools. Comments from farmers in Types 4 and 5 (Table 9) were inconsistent with the DSTs developed with crop yield targets and based on N budgeting approaches. Hence, a new paradigm for thinking about fertilizer decisions can be considered.
Table 9.
Farmers’ opinions on fertilizer DSTs.
In addition, when farmers were asked “how do you want the information delivered?”, they were not keen on a prescriptive DST, i.e., a tool developing a specific recommendation of how much fertilizer to use. Instead, farmers interested in the technology considered that discussion groups were a better learning environment and preferred a learning-based tool rather than a prescription-based tool. Some comments were:
“We don’t like to be told how to manage our field we will like to learn”.
“We prefer discussion support because we can discuss and ask specific questions or seek new ideas with other farmers”.
“Allowing us to discuss with other farmers can prevent us from misinterpreting because these apps and tools are still new to us”.
“I may not continue to use the apps by myself, but I am happy to maintain regular discussions with other farmers”.
Farmers emphasized their preference for video clips and infographics integrated in digital platforms, including social media and existing agricultural apps. Female farm-type members mentioned video clips being more practical and entertaining for them. Some comments were:
“Video clips are good for us because we can watch at our free time”.
“It is also entertaining, and we gain knowledge”.
4. Discussion
The typology analysis provided a deeper understanding of the heterogeneity of farmer preferences to identify potential early adopters of a mobile-based DST. The participatory focus group discussions provided the opinions and beliefs of farmers within different farm types. Different farm types have different degrees of risk taking when making decisions and different opinions towards mobile-based DSTs. The large and semi-intensive, on-farm farmers (Farm Type 2) were positive towards fertilizer DSTs and the potential to use mobile-based tools as early adopters. The high level of trust among farmers was also noted, and it is important to introduce such new technology for fertilizer management to these large and semi-intensive, on-farm farmers initially and build a trusted relationship where they can later pass on the knowledge and skills to other farmers.
Interestingly, farmers were keener about Discussion Support instead of Decision Support. Discussion Support is a collaborative approach between farmers, whereas Decision Support is more prescriptive in providing recommendations that can be misinterpreted. Discussion Support can be used by individual farmers, groups of farmers or a group of farmers with extension officers, enabling discussion of alternative management decisions, asking specific questions and seeking new ideas about adjusting farm decisions to meet smallholder management objectives.
Table 10
shows differences between Decision Support and Discussion Support as indicated in the FGDs.
Table 10.
Difference between decision support and discussion support.
Farmers felt that guided discussion platforms were a better learning environment and preferred a learning-based tool rather than a prescriptive tool. A major challenge associated with DSTs is limited ongoing funding for maintenance and updating [90]. Studies have reported that most of the developed tools are not used after funding finishes and there is no further support [21,90,91]. A study by Thar et al. [12] found that incorporating useful information and decision-support functions on social media platforms could have a more useful and sustainable impact and eliminate issues such as lack of awareness, lack of use and long-term servicing and sustainability. Hence, future extension activities should be centered on guided discussion platforms and remotely aided by extension officers. These guided discussion platforms could be mounted on popular and familiar social media with support materials. Video clips and infographics could be integrated into digital platforms where farmers can comment, share and learn from each other as well as consult with extension officers and researchers.
Videos can reach many people, and Afroz and Singh [92] found that farmer videos were more convincing to farmers than extension officers talking. Bently and Mele [93] stated that farmers enjoy learning from farmers farther away even if they are from different countries. Demonstration videos, with farmer participation, can be suitable for delivering new technology to farmers in their language with their participation.
5. Conclusions
This study set out to answer the research question of whether different farm types exhibit significantly different patterns in the intention to adopt mobile-based DSTs. Six different farm types were identified with different attitudes about mobile-based DSTs. Although the participating farmers had no prior knowledge of DSTs, they readily engaged in examining the DST example and provided considered opinions. Farmers in only one group (Farm Type 2) were optimistic about DSTs, and more focus could be given in the introduction and training of such digital tools to these types of farmers. These results can assist consideration of mobile-based DSTs for different farmer types. These results provide an improved understanding of farmer beliefs and attitudes towards DSTs and will assist the development of DSTs according to the needs of specific farmers. They can help implement policies for digital extension services to further support smallholders in Myanmar.
An important finding is that the concept of decision support in providing prescriptive advice was inconsistent with what many farmers want. Farmers in general identified that a discussion support format is more useful. They believe that discussion groups provide a better learning environment and prefer a learning-based tool rather than a prescription-based tool. Smallholders, especially female farmers, preferred video clips and infographics integrated into digital platforms, including social media and existing agricultural mobile applications. We conclude that incorporating a participatory research framework with typology identification is potentially valuable in assessing potential for new technologies and may have a beneficial role in direct interactions with smallholders, which may increase their acceptability towards DSTs.
This study, however, is subject to some possible limitations as it is challenging to fully capture the degree of diversity existing in the farming systems of the study area and it is recognized that the typology is limited in its ability to accurately represent every variation that exists. Furthermore, due to the dynamic nature of agriculture, the typologies can only provide a static snapshot of farm systems in time.
Given the likely increased future demand for digital services, these results can help to identify farm system types when considering the introduction of mobile-based decision tools. The contribution of the study is identification of distinct groups or types of farmers among a heterogeneous farmer population so that DSTs can be designed to reflect farmer needs and target appropriate end users. Previous studies have utilized various participatory approaches with farmers but have not accounted for the complexity of heterogeneous smallholder farming systems. The statically robust method and subsequent development of a more detailed understanding of fertilizer decisions and risks through FGDs is important information. The results include knowledge of, and intentions related to, DSTs and apps. This study generated valuable information about farmer types and serves as a starting point for developing a framework for discussion support systems that may better relate to the needs of farmers.
Author Contributions
Conceptualization, S.P.T., R.J.F., T.R.; methodology, S.P.T., R.J.F., T.R.; writing—original draft, S.P.T.; writing—review and editing, S.P.T., R.J.F., T.R., D.C.; funding acquisition, R.J.F., D.C.; resources, S.P.T., R.J.F., T.R.; supervision, R.J.F., T.R., D.C. All authors have read and agreed to the published version of the manuscript.
Funding
This research was funded by ACIAR, project number SMCN/2014/044 and the University of Melbourne Doctoral Research Scholarship.
Institutional Review Board Statement
The study was conducted according to the guidelines of the Declaration of Helsinki, and approved by the Institutional Review Board (or Ethics Committee) of the University of Melbourne (Ethics ID: 1851136 approved on 27 March 2018).
Informed Consent Statement
Informed consent was obtained from all subjects involved in the study.
Data Availability Statement
The data presented in this study are available on request from the corresponding author.
Acknowledgments
We gratefully acknowledge the support from the University of Melbourne Doctoral Research Scholarship and ACIAR project (SMCN/2014/044). We thank Sam Coggins and Joseph Shen for letting us use the RiseHarvest prototype for demonstration of DST to farmers. We are grateful to all the farmers for their active participation in the focus group discussions and the local extension officer for helping invite the farmers.
Conflicts of Interest
The authors declare no conflict of interest.
References
- FAO. Myanmar at a Glance. Available online: http://www.fao.org/myanmar/fao-in-myanmar/myanmar/en/#:~:text=Myanmar%20is%20an%20agricultural%20country,percent%20of%20the%20labour%20force. (accessed on 5 December 2020).
- Findlay, R.; Park, C.Y.; Verbiest, J.P.A. Myanmar: Unlocking the Potential—A Strategy for High, Sustained, and Inclusive Growth; Asian Development Bank Economics: Manila, Philippines, 2015. (In English) [Google Scholar]
- Stuart, A.M.; Pame, A.R.P.; Silva, J.V.; Dikitanan, R.C.; Rutsaert, P.; Malabayabas, A.J.B.; Lampayan, R.M.; Radanielson, A.M.; Singleton, G. Yield gaps in rice-based farming systems: Insights from local studies and prospects for future analysis. Field Crop. Res. 2016, 194, 43–56. [Google Scholar] [CrossRef]
- Herridge, D.F.; Win, M.M.; Nwe, K.M.M.; Kyu, K.L.; Win, S.S.; Shwe, T.; Min, Y.Y.; Denton, M.D.; Cornish, P.S. The cropping systems of the Central Dry Zone of Myanmar: Productivity constraints and possible solutions. Agric. Syst. 2019, 169, 31–40. [Google Scholar] [CrossRef]
- Gregory, I.; Shwe, T.M.; Oo, N. Myanmar Fertiliser Policy Evaluation; International Fertiliser Development Center (IFDC): Muscle Shoals, AL, USA, 2014; Available online: https://ifdcorg.files.wordpress.com/2015/09/myanmar-fertilizer-policy-evaluation-9-17-14-kg-edits-4.pdf (accessed on 22 November 2019).
- IFDC. Fertiliser Sector Improvement Project: Fertiliser Dealer Survey; International Fertilizer Development Center (IFDC): Muscle Shoals, AL, USA, 2015; Available online: https://ifdc.org/wp-content/uploads/2016/05/1-fertilizer-sector-improvement-project-retailer-survey-report.pdf (accessed on 21 November 2020).
- LIFT. Chemical and Organic Fertilizer Market in Relation to the Interests of Small Farmers in Myanmar. Food Security Working Group (FSWG). 2015. Available online: https://www.myanmarfswg.org/sites/myanmarfswg.org/files/fertilizer_report_eng.pdf (accessed on 22 November 2019).
- Haggblade, S.; Boughton, D. A Strategic Agricultural Sector and Food Security Diagnostic for Myanmar. MSU International Development; Working Paper No. 131; Michigan State University: East Lansing, MI, USA, 2013; Available online: https://www.canr.msu.edu/fsg/papers/idwp131_revised.pdf (accessed on 13 April 2020).
- Oo, K.; Ando, K. Improving Myanma Agricultural Extension Services: Empirical Study on Views and Perception of Field Extension Agents in Mandalay Division of Myanmar. 2012. Available online: https://repository.kulib.kyoto-u.ac.jp/dspace/bitstream/2433/155723/1/ssh_121.pdf (accessed on 13 April 2020).
- Win, N.K.; Win, K.K.; San, C.C.; Htwe, N.N. Analyzing the Roles of Agricultural Extension Agents in Hybrid Rice Technology Decision-Making Process of Farmers, Nay Pyi Taw, Myanmar. Econ. World 2018, 6, 303–313. [Google Scholar]
- Telenor. Realising Digital Myanmar: Leapfrogging to an Inclusive Digital Economy. 2018. Available online: https://www.telenor.com/wp-content/uploads/2018/02/Telenor-Realising-Digital-Myanmar-Report-06-February.pdf (accessed on 22 November 2019).
- Thar, S.P.; Ramilan, T.; Farquharson, R.J.; Pang, A.; Chen, D. An empirical analysis of the use of agricultural mobile applications among smallholder farmers in Myanmar. Electron. J. Inf. Syst. Dev. Ctries 2021, 87. [Google Scholar] [CrossRef]
- Shim, J.P.; Warkentin, M.; Courtney, J.F.; Power, D.J.; Sharda, R.; Carlsson, C. Past, Present, and future of decision support technology. Decis. Support Syst. 2002, 33, 111–126. [Google Scholar] [CrossRef]
- Paustian, M.; Theuvsen, L. Adoption of precision agriculture technologies by German crop farmers. Precis. Agric. 2017, 18, 701–716. [Google Scholar] [CrossRef]
- Churi, A.J.; Mlozi, M.R.; Mahoo, H.; Tumbo, S.D.; Casmir, R. A decision support system for enhancing crop productivity of smallholder farmers in semi-arid agriculture. Int. J. Inf. Commun. Technol. Res. 2013, 3, 238–248. [Google Scholar]
- Alvarez, J.; Nuthall, P.L. Adoption of computer based information systems: The case of dairy farmers in Canterbury, NZ, and Florida, Uruguay. Comput. Electron. Agric. 2006, 50, 48–60. [Google Scholar] [CrossRef]
- McCown, R. Locating agricultural decision support systems in the troubled past and socio-technical complexity of ‘models for management’. Agric. Syst. 2002, 74, 11–25. [Google Scholar] [CrossRef]
- Shtienberg, D. Will Decision-Support Systems Be Widely Used for the Management of Plant Diseases? Annu. Rev. Phytopathol. 2013, 51, 1–16. [Google Scholar] [CrossRef]
- Kerr, D. Factors influencing the development and adoption of knowledge based decision support systems for small, owner-operated rural business. Artif. Intell. Rev. 2004, 22, 127–147. [Google Scholar] [CrossRef]
- Prost, L.; Cerf, M.; Jeuffroy, M.-H. Lack of consideration for end-users during the design of agronomic models. A review. Agron. Sustain. Dev. 2012, 32, 581–594. [Google Scholar] [CrossRef]
- Rose, D.C.; Sutherland, W.J.; Parker, C.; Lobley, M.; Winter, M.; Morris, C.; Twining, S.; Ffoulkes, C.; Amano, T.; Dicks, L.V. Decision support tools for agriculture: Towards effective design and delivery. Agric. Syst. 2016, 149, 165–174. [Google Scholar] [CrossRef]
- He, C.; Parra, D.; Verbert, K. Interactive recommender systems: A survey of the state of the art and future research challenges and opportunities. Expert Syst. Appl. 2016, 56, 9–27. [Google Scholar] [CrossRef]
- Armstrong, D.; Gibbs, I.; Johnson, F. Decision support—More about learning than software packages? In Proceedings of the Australian Farming Systems Conference, Toowoomba, Australia, 7–10 September 2003. [Google Scholar]
- Nguyen, N.; Wegener, M.; Russell, I. Decision support systems in Australian agriculture: State of the art and future development. Aust. Farm Bus. Manag. J. 2007, 4, 15–21. [Google Scholar]
- Fixen, P.E. Decision Support Systems in Integrated Crop Nutrient Management. In Proceedings of the International Fertilizer Society, Cambridge, UK, 15 December 2005. [Google Scholar]
- Batte, M.T.; Jones, E.; Schnitkey, G.D. Computer Use by Ohio Commercial Farmers. Am. J. Agric. Econ. 1990, 72, 935–945. [Google Scholar] [CrossRef]
- Antle, J.M.; Basso, B.; Conant, R.T.; Godfray, H.C.J.; Jones, J.W.; Herrero, M.; Howitt, R.E.; Keating, B.A.; Munoz-Carpena, R.; Rosenzweig, C.; et al. Towards a new generation of agricultural system data, models and knowledge products: Design and improvement. Agric. Syst. 2017, 155, 255–268. [Google Scholar] [CrossRef] [PubMed]
- Lacoste, M.; Powles, S. Beyond modelling: Considering user-centred and post-development aspects to ensure the success of a decision support system. Comput. Electron. Agric. 2016, 121, 260–268. [Google Scholar] [CrossRef][Green Version]
- Smith, R.; Kasprzyk, J.; Dilling, L. Participatory framework for assessment and improvement of tools (ParFAIT): Increasing the impact and relevance of water management decision support research. Environ. Model. Softw. 2017, 95, 432–446. [Google Scholar] [CrossRef]
- Parker, C.; Sinclair, M. User-centred design does make a difference. The case of decision support systems in crop production. Behav. Inf. Technol. 2001, 20, 449–460. [Google Scholar] [CrossRef]
- Valls-Donderis, P.; Ray, D.; Peace, A.; Stewart, A.; Lawrence, A.; Galiana, F. Participatory development of decision support systems: Which features of the process lead to improved uptake and better outcomes? Scand. J. For. Res. 2013, 29, 71–83. [Google Scholar] [CrossRef]
- Carberry, P.; Gladwin, C.; Twomlow, S. Linking simulation modeling to participatory research in smallholder farming system. In Modeling Nutrient Management in Tropical Cropping Systems, Proceedings of the ACIAR, 2004; Delve, R.J., Probert, M.E., Eds.; ACIAR: Canberra, ACT, Australia, 2004. Available online: https://publications.csiro.au/rpr/pub?list=BRO&pid=procite:eac2b9e9-c84a-4e42-9de2-2c4ad5303563 (accessed on 2 June 2021).
- Jakku, E.; Thorburn, P.J. A conceptual framework for guiding the participatory development of agricultural decision support systems. Agric. Syst. 2010, 103, 675–682. [Google Scholar] [CrossRef]
- Van Meensel, J.; Lauwers, L.; Kempen, I.; Dessein, J.; Van Huylenbroeck, G. Effect of a participatory approach on the successful development of agricultural decision support systems: The case of Pigs2win. Decis. Support Syst. 2012, 54, 164–172. [Google Scholar] [CrossRef]
- Thorburn, P.J.; Jakku, E.; Webster, A.J.; Everingham, Y.L. Agricultural decision support systems facilitating co-learning: A case study on environmental impacts of sugarcane production. Int. J. Agric. Sustain. 2011, 9, 322–333. [Google Scholar] [CrossRef]
- Hochman, Z.; Van Rees, H.; Carberry, P.S.; Hunt, J.R.; McCown, R.L.; Gartmann, A.; Holzworth, D.; Dalgliesh, N.P.; Long, W.; Peake, A.S.; et al. Re-inventing model-based decision support with Australian dryland farmers. 4. Yield Prophet® helps farmers monitor and manage crops in a variable climate. Crop. Pasture Sci. 2009, 60, 1057–1070. [Google Scholar] [CrossRef]
- Hunt, J.; van Rees, H.; Hochman, Z.; Carberry, P.; Holzworth, D.; Dalgliesh, N.; Brennan, L.; Poulton, P.; van Rees, S.; Huth, N.; et al. Yield Prophet®: An online crop simulation service. In Proceedings of the 13th Australian Agronomy Conference, Perth, Australia, 10–14 September 2006. [Google Scholar]
- Carberry, P.S.; Hochman, Z.; McCown, R.L.; Dalgliesh, N.P.; Foale, M.A.; Poulton, P.L.; Hargreaves, J.N.G.; Hargreaves, D.M.G.; Cawthray, S.; Hillcoat, N.; et al. The FARMSCAPE approach to decision support: Farmers’, advisers’, researchers’ monitoring, simulation, communication and performance evaluation. Agric. Syst. 2002, 74, 141–177. [Google Scholar] [CrossRef]
- Hochman, Z.; Coutts, J.; Carberry, P.S.; McCown, R.L. The FARMSCAPE experience. Simulations aid participative learning in risky farming systems in Australia. In Cows Up a Tree: Knowing and Learning for Change in Agriculture. Case Studies from Industrialised Countries; Cerf, M., Ed.; INRA Editions: Paris, France, 2000. [Google Scholar]
- Keating, B.A.; Thorburn, P.J. Modelling crops and cropping systems—Evolving purpose, practice and prospects. Eur. J. Agron. 2018, 100, 163–176. [Google Scholar] [CrossRef]
- Robertson, M.; Kirkegaard, J.; Rebetzke, G.; Llewellyn, R.; Wark, T. Prospects for yield improvement in the Australian wheat industry: A perspective. Food Energy Secur. 2016, 5, 107–122. [Google Scholar] [CrossRef]
- Robertson, M.J.; Rebetzke, G.J.; Norton, R.M. Assessing the place and role of crop simulation modelling in Australia. Crop Pasture Sci. 2015, 66, 877–893. [Google Scholar] [CrossRef]
- Hochman, Z.; Lilley, J. Impact of simulation and decision support systems on sustainable agriculture. Aust. Agric. 2020, 337–356. Available online: https://publications.csiro.au/rpr/pub?pid=csiro:EP194047 (accessed on 2 June 2021).
- Chatterjee, S.; Goswami, R.; Bandopadhyay, P. Methodology of identification and characterization of farming systems in irrigated agriculture: Case study in West Bengal State of India. J. Agric. Sci. Technol. 2015, 17, 1127–1140. [Google Scholar]
- Emtage, N.; Suh, J. Variations in socioeconomic characteristics, farming assets and livelihood systems of Leyte rural households. Ann. Trop. Res. 2005, 27, 35–54. [Google Scholar]
- Leeson, J.Y.; Sheard, J.W.; Thomas, A.G. Multivariate classification of farming systems for use in integrated pest management studies. Can. J. Plant Sci. 1999, 79, 647–654. [Google Scholar] [CrossRef]
- Asfaw, A.; Admassie, A. The role of education on the adoption of chemical fertiliser under different socioeconomic environments in Ethiopia. Agric. Econ. 2004, 30, 215–228. [Google Scholar] [CrossRef]
- Mahapatra, A.K.; Mitchell, C.P. Classifying tree planters and non planters in a subsistence farming system using a discriminant analytical approach. Agrofor. Syst. 2001, 52, 41–52. [Google Scholar] [CrossRef]
- Bidogeza, J.C.; Berentsen, P.B.M.; De Graaff, J.; Lansink, A.G.J.M.O. A typology of farm households for the Umutara Province in Rwanda. Food Secur. 2009, 1, 321–335. [Google Scholar] [CrossRef]
- Chikowo, R.; Zingore, S.; Snapp, S.; Johnston, A. Farm typologies, soil fertility variability and nutrient management in smallholder farming in Sub-Saharan Africa. Nutr. Cycl. Agroecosystems 2014, 100, 1–18. [Google Scholar] [CrossRef]
- Tittonell, P.; Leffelaar, A.P.; Vanlauwe, B.; van Wijk, T.M.; Giller, E.K. Exploring diversity of crop and soil management within smallholder African farms: A dynamic model for simulation of N balances and use efficiencies at field scale. Agric. Syst. 2006, 91, 71–101. [Google Scholar] [CrossRef]
- Daxini, A.; Ryan, M.; O’Donoghue, C.; Barnes, A.P.; Buckley, C. Using a typology to understand farmers’ intentions to-wards following a nutrient management plan. Resour. Conserv. Recycl. 2019, 146, 280–290. [Google Scholar] [CrossRef]
- Zingore, S.; Murwira, H.; Delve, R.; Giller, K. Soil type, management history and current resource allocation: Three dimensions regulating variability in crop productivity on African smallholder farms. Field Crop. Res. 2007, 101, 296–305. [Google Scholar] [CrossRef]
- Makate, C.; Makate, M.; Mango, N. Farm household typology and adoption of climate-smart agriculture practices in smallholder farming systems of southern Africa. Afr. J. Sci. Technol. Innov. Dev. 2018, 10, 421–439. [Google Scholar] [CrossRef]
- Lopez-Ridaura, S.; Frelat, R.; van Wijk, M.T.; Valbuena, D.; Krupnik, T.J.; Jat, M.L. Climate smart agriculture, farm house-hold typologies and food security An ex-ante assessment from Eastern India. Agric. Syst. 2018, 159, 57–68. [Google Scholar] [CrossRef] [PubMed]
- Kostrowicki, J. Agricultural typology concept and method. Agric. Syst. 1977, 2, 33–45. [Google Scholar] [CrossRef]
- Kyi, K.M. Farmer Vulnerability Amidst Climate Variability: A Case Study of Dry Zone of Myanmar. 2012. Available online: https://www.themimu.info/sites/themimu.info/files/documents/Case%20Study_DryZone_FarmerVulnerablity-ClimateViration_KhinMoeKyi_ICIRD2012.pdf (accessed on 22 May 2021).
- Levy, P.S.; Lemeshow, S. Sampling of Populations: Methods and Applications; John Wiley & Sons: Hoboken, NJ, USA, 2013. [Google Scholar]
- Cochran, W.G. Sampling Techniques, 3rd ed.; John Wiley & Sons: Hoboken, NJ, USA, 1977. [Google Scholar]
- Costello, A.B.; Osborne, J. Best practices in exploratory factor analysis: Four recommendations for getting the most from your analysis. Pract. Assess. Res. Eval. 2005, 10, 1–9. [Google Scholar] [CrossRef]
- Memon, M.A.; Ting, H.; Cheah, J.-H.; Thurasamy, R.; Chuah, F.; Cham, T.H. Sample Size for Survey Research: Review and Recommendations. J. Appl. Struct. Equ. Model. 2020, 4, 1–20. [Google Scholar] [CrossRef]
- Flaming, A.; Canty, M.; Javetski, G.; Lesh, N. The CommCare Evidence Base for Frontline Workers. 2016. Available online: http://www.dimagi.com/wp-content/uploads/2016/06/CommCare-Evidence-Base-July-2016.pdf (accessed on 22 November 2019).
- Farquharson, R.; Ramilan, T.; Thar, S.P.; Eldridge, S.M.; Than, S.M.; Li, Y.; Chen, D. Nitrogen fertility management by smallholder farmers in Myanmar: Current practices and opportunities. In Proceedings of the 2019 Conference of the Australasian Agricultural and Resource Economics Society, Melbourne, Australia, 12–15 February 2019. [Google Scholar]
- Jezeer, R.E.; Santos, M.J.; Boot, R.G.; Junginger, M.; Verweij, P.A. Effects of shade and input management on economic performance of small-scale Peruvian coffee systems. Agric. Syst. 2018, 162, 179–190. [Google Scholar] [CrossRef]
- Köbrich, C.; Rehman, T.; Khan, M. Typification of farming systems for constructing representative farm models: Two illustrations of the application of multi-variate analyses in Chile and Pakistan. Agric. Syst. 2003, 76, 141–157. [Google Scholar] [CrossRef]
- Gorton, M.; Douarin, E.; Davidova, S.; Latruffe, L. Attitudes to agricultural policy and farming futures in the context of the 2003 CAP reform: A comparison of farmers in selected established and new Member States. J. Rural Stud. 2008, 24, 322–336. [Google Scholar] [CrossRef]
- Field, A.; Miles, J.; Field, Z. Discovering Statistics Using R; SAGE Publications: New York, NY, USA, 2012. [Google Scholar]
- Alvarez, S.; Paas, W.; Descheemaeker, K.; Tittonell, P.; Groot, J. Typology Construction, a Way of Dealing with Farm Diversity: General Guidelines for the Humidtropics; Wageningen University: Wageningen, The Netherlands, 2014; Available online: http://humidtropics.cgiar.org/wp-content/uploads/downloads/2015/04/Typology-guidelines_v2.pdf (accessed on 2 February 2021).
- Tittonell, P.; Muriuki, A.; Shepherd, K.; Mugendi, D.; Kaizzi, K.; Okeyo, J.; Verchot, L.; Coe, R.; Vanlauwe, B. The diversity of rural livelihoods and their influence on soil fertility in agricultural systems of East Africa—A typology of smallholder farms. Agric. Syst. 2010, 103, 83–97. [Google Scholar] [CrossRef]
- Scrucca, L.; Fop, M.; Murphy, T.B.; Raftery, A.E. mclust 5: Clustering, Classification and Density Estimation Using Gaussian Finite Mixture Models. R J. 2016, 8, 289–317. [Google Scholar] [CrossRef]
- Fraley, C.; Raftery, A.E.; Murphy, T.B.; Scrucca, L. mclust Version 4 for R: Normal Mixture Modeling for Model-Based Clustering, Classification, and Density Estimation. Technical Report No. 597, Department of Statistics, University of Washington. 2012. Available online: https://stat.uw.edu/sites/default/files/files/reports/2012/tr597.pdf (accessed on 31 January 2021).
- Fraley, C.; E Raftery, A. Model-Based Clustering, Discriminant Analysis, and Density Estimation. J. Am. Stat. Assoc. 2002, 97, 611–631. [Google Scholar] [CrossRef]
- R C Team. A Language and Environment for Statistical Computing; R Foundation for Statistical Computing: Vienna, Austria, 2020; Available online: http://www.R-project.org/ (accessed on 31 January 2021).
- Revelle, W. Procedures for Physchological, Psychometric, and Personality Research; R Package Version 2.0.12; North-Western University: Evanston, IL, USA, 2020; Available online: https://CRAN.R-project.org/package=psych (accessed on 31 January 2021).
- Ramilan, T.; Thar, S.P.; Than, S.M.; Aung, N.M.; Farquharson, R. Characterisation of farming systems in Central Myanmar. In Proceedings of the 61st AARES Annual Conference, Brisbane, Australia, 2–5 February 2017. [Google Scholar]
- Ashby, J.A.; Sperling, L. Institutionalising participatory, client-driven research and technology development in agriculture. Dev. Chang. 1994, 4, 753. [Google Scholar]
- Okali, C.; Sumberg, J.; Farrington, J. Farmer Participatory Research: Rhetoric and Reality; Intermediate Technology on behalf of the Overseas Development Institute: London, UK, 1994. [Google Scholar]
- Dimes, J.; Twomlow, S.; Carberry, P. Application of New Tools: Exploring the Synergies between Simulation Models and Participatory Research in Smallholder Farming Systems. 2003. Available online: https://www.researchgate.net/publication/266084116_Application_of_new_tools_exploring_the_synergies_between_simulation_models_and_participatory_research_in_smallholder_farming_systems (accessed on 22 November 2019).
- Kemmis, S.; McTaggart, R.; Nixon, R. The Action Research Planner: Doing Critical Participatory Action Research; Springer Science & Business Media: Berlin, Germany, 2013. [Google Scholar]
- Pretty, J.N. Participatory learning for sustainable agriculture. World Dev. 1995, 23, 1247–1263. [Google Scholar] [CrossRef]
- Cornwall, A.; Jewkes, R. What is participatory research? Soc. Sci. Med. 1995, 41, 1667–1676. [Google Scholar] [CrossRef]
- Yin, R.K. Qualitative Research from Start to Finish, 2nd ed.; The Guilford Press: London, UK, 2015. [Google Scholar]
- Kraaijvanger, R.; Almekinders, C.; Veldkamp, A.; Veldkamp, T. Identifying crop productivity constraints and opportunities using focus group discussions: A case study with farmers from Tigray. NJAS Wagening. J. Life Sci. 2016, 78, 139–151. [Google Scholar] [CrossRef]
- Alvarez, S.; Timler, C.J.; Michalscheck, M.; Paas, W.; Descheemaeker, K.; Tittonell, P.; Andersson, J.A.; Groot, J.C.J. Capturing farm diversity with hypothesis-based typologies: An innovative methodological framework for farming system typology development. PLoS ONE 2018, 13, e0194757. [Google Scholar] [CrossRef] [PubMed]
- Bazeley, P.; Jackson, K.E. Qualitative Data Analysis with NVivo; SAGE Publications Limited: London, UK, 2013. [Google Scholar]
- Haileslassie, A.; Craufurd, P.; Thiagarajah, R.; Kumar, S.; Whitbread, A.; Rathor, A.; Blummel, M.; Ericsson, P.; Kakumanu, K.R. Empirical evaluation of sustainability of divergent farms in the dryland farming systems of India. Ecol. Indic. 2016, 60, 710–723. [Google Scholar] [CrossRef]
- Harwood, J.; Heifner, R.; Coble, K.; Perry, J.; Somwaru, A. Managing Risk in Farming: Concepts, Research and Analysis; U.S. Department of Agriculture, Economic Research Service: Washington, DC, USA, 1999.
- Dillon, C.R. A Framework for Economic Analysis of Cropping Systems: Profitability, Risk Management, and Resource Allocation. J. Crop. Prod. 2003, 9, 409–432. [Google Scholar] [CrossRef]
- Kahan, D. Managing Risk in Farming; Food and Agriculture Organization of the United Nations (FAO): Rome, Italy, 2008. [Google Scholar]
- Gallardo, M.; Elia, A.; Thompson, R.B. Decision support systems and models for aiding irrigation and nutrient management of vegetable crops. Agric. Water Manag. 2020, 240, 106209. [Google Scholar] [CrossRef]
- Hochman, Z.; Carberry, P.S. Emerging consensus on desirable characteristics of tools to support farmers’ management of climate risk in Australia. Agric. Syst. 2011, 104, 441–450. [Google Scholar] [CrossRef]
- Afroz, S.; Singh, R. Farmers’ attitude towards digital green participatory videos for agricultural information dissemination. J. Community Mobilization Sustain. Dev. 2018, 13, 239–244. [Google Scholar]
- Bently, J.W.; Mele, P.V. Sharing ideas between cultures with videos. Int. J. Agric. Sustain. 2011, 9, 258–263. [Google Scholar] [CrossRef]


Publisher’s Note: MDPI stays neutral with regard to jurisdictional claims in published maps and institutional affiliations. |
© 2021 by the authors. Licensee MDPI, Basel, Switzerland. This article is an open access article distributed under the terms and conditions of the Creative Commons Attribution (CC BY) license (https://creativecommons.org/licenses/by/4.0/).