2.1. Real Data
This retrospective study used 4 years of multiple-bull pasture breeding (2012 to 2015) and subsequent calving data (2013 to 2016). Cattle populations were purebred Angus and advanced generation composites MARC I, MARC II, and MARC III [
12]. Only bulls and cows aged 2 and older at the time of breeding were included in data analyzed. In addition, only bulls passing breeding soundness exams for physical and semen traits were used in breeding pastures. A few bulls were removed for injury or other reasons and were replaced by different bulls unless it was late in the breeding season. Any bull not in the breeding pasture for at least 90% of the breeding season was eliminated from analyses. In 2012, some older cows in each of the 3 composite populations were synchronized and bred by AI 15 d after younger cows entered breeding pastures. The synchronized cows entered the same breeding pastures younger cows were in 9 d after AI and 39 d before the end of pasture breeding. Calves sired by AI were eliminated from data, but those sired by the pasture bulls were retained for analysis. Pastures and cow and bull assignments are described in
Table 1. Assuming half of AI cows were open after timed AI, the average assigned open cows per bull was 23.6.
The patterns of bull usage in the edited data are shown in
Table 2. Included were 79 unique bulls with 141 breeding opportunities, ranging from 38 bulls with one opportunity each to 4 bulls used each of the 4 years. Across years there were 27, 37, 37, and 40 breeding opportunities for calf years 2013, 2014, 2015, and 2016, respectively. Forty-one bulls had an average of 2.5 breeding opportunities, and 38 bulls had a single opportunity.
Sires and calves were genotyped with 4 genotyping panels across 4 years. Two were low-density panels based on parentage markers [
13] using the Bovine Parentage Panel (Eureka Genomics, Hercules, CA, USA) or implemented with TruSeq DNA technology (Illumina Inc., San Diego, CA, USA). Two were higher density panels with more than 50,000 SNP consisting of parentage, linkage, and functional SNP (BovineSNP50, Illumina Inc., San Diego, CA; GeneSeek Genomic Profiler F250, Neogen, Lansing, MI, USA). A higher proportion of calves born in early years were genotyped with only parentage panels. Most calves born in 2016 and all but 3 bulls (1 Angus, 1 MARC I, and 1 MARC II) were genotyped with GeneSeek Genomic Profiler F250.
A set of parentage SNP [
13] in common across the 4 genotyping panels was identified. These SNP were used to identify sires based on exclusions [
4]. Additional steps were taken to try to resolve some ambiguous sire identifications, including expanding exclusions to additional SNP if available, calculating the genotypic correlations between a calf and potential sires [
14], and re-genotyping some animals. Calves genotyped with higher density panels (48.8%) were matched with sires genotyped with high density (33.8%) or only parentage (15.0%) genotyped with parentage panels were matched with sires genotyped with high density (15.6%) or only parentage (35.6%). Most genotyped calves were matched to a single sire, but several MARC II calves born in 2013 and 2015 and some Angus calves born in 2015 were not genotyped. Sires of 3 calves with <100 genotypes also were not identified.
The distribution of number-of-calves per bull opportunity (bull within pasture and year) was skewed (
Table 3) as has been observed in other studies of sire prolificacy. The median and mode of the distribution is 18 with values from 0 to 57. A square root transformation was applied to the data before analysis.
Repeatability was estimated from the variance components for random effects for between bull (bull) and within bull across years and pastures (e) as . Variance components were estimated using PROC GLIMMIX (SAS Institute Inc., Cary, NC, USA) from the model , where is number of calves sired by bull k in pasture j () nested within year i (). Additional fixed categorical or continuous factors were individually added to this base model to test for possible explanatory variables for bull prolificacy. Based on results of individual variables, bull age category and scrotal circumference were added to the base model for testing jointly. All reported statistical probabilities are based on data transformed by square root, but reported means and regression coefficients of explanatory variables are from analyses of untransformed data.
2.2. Simulating Errors in Pooling Allele Frequency
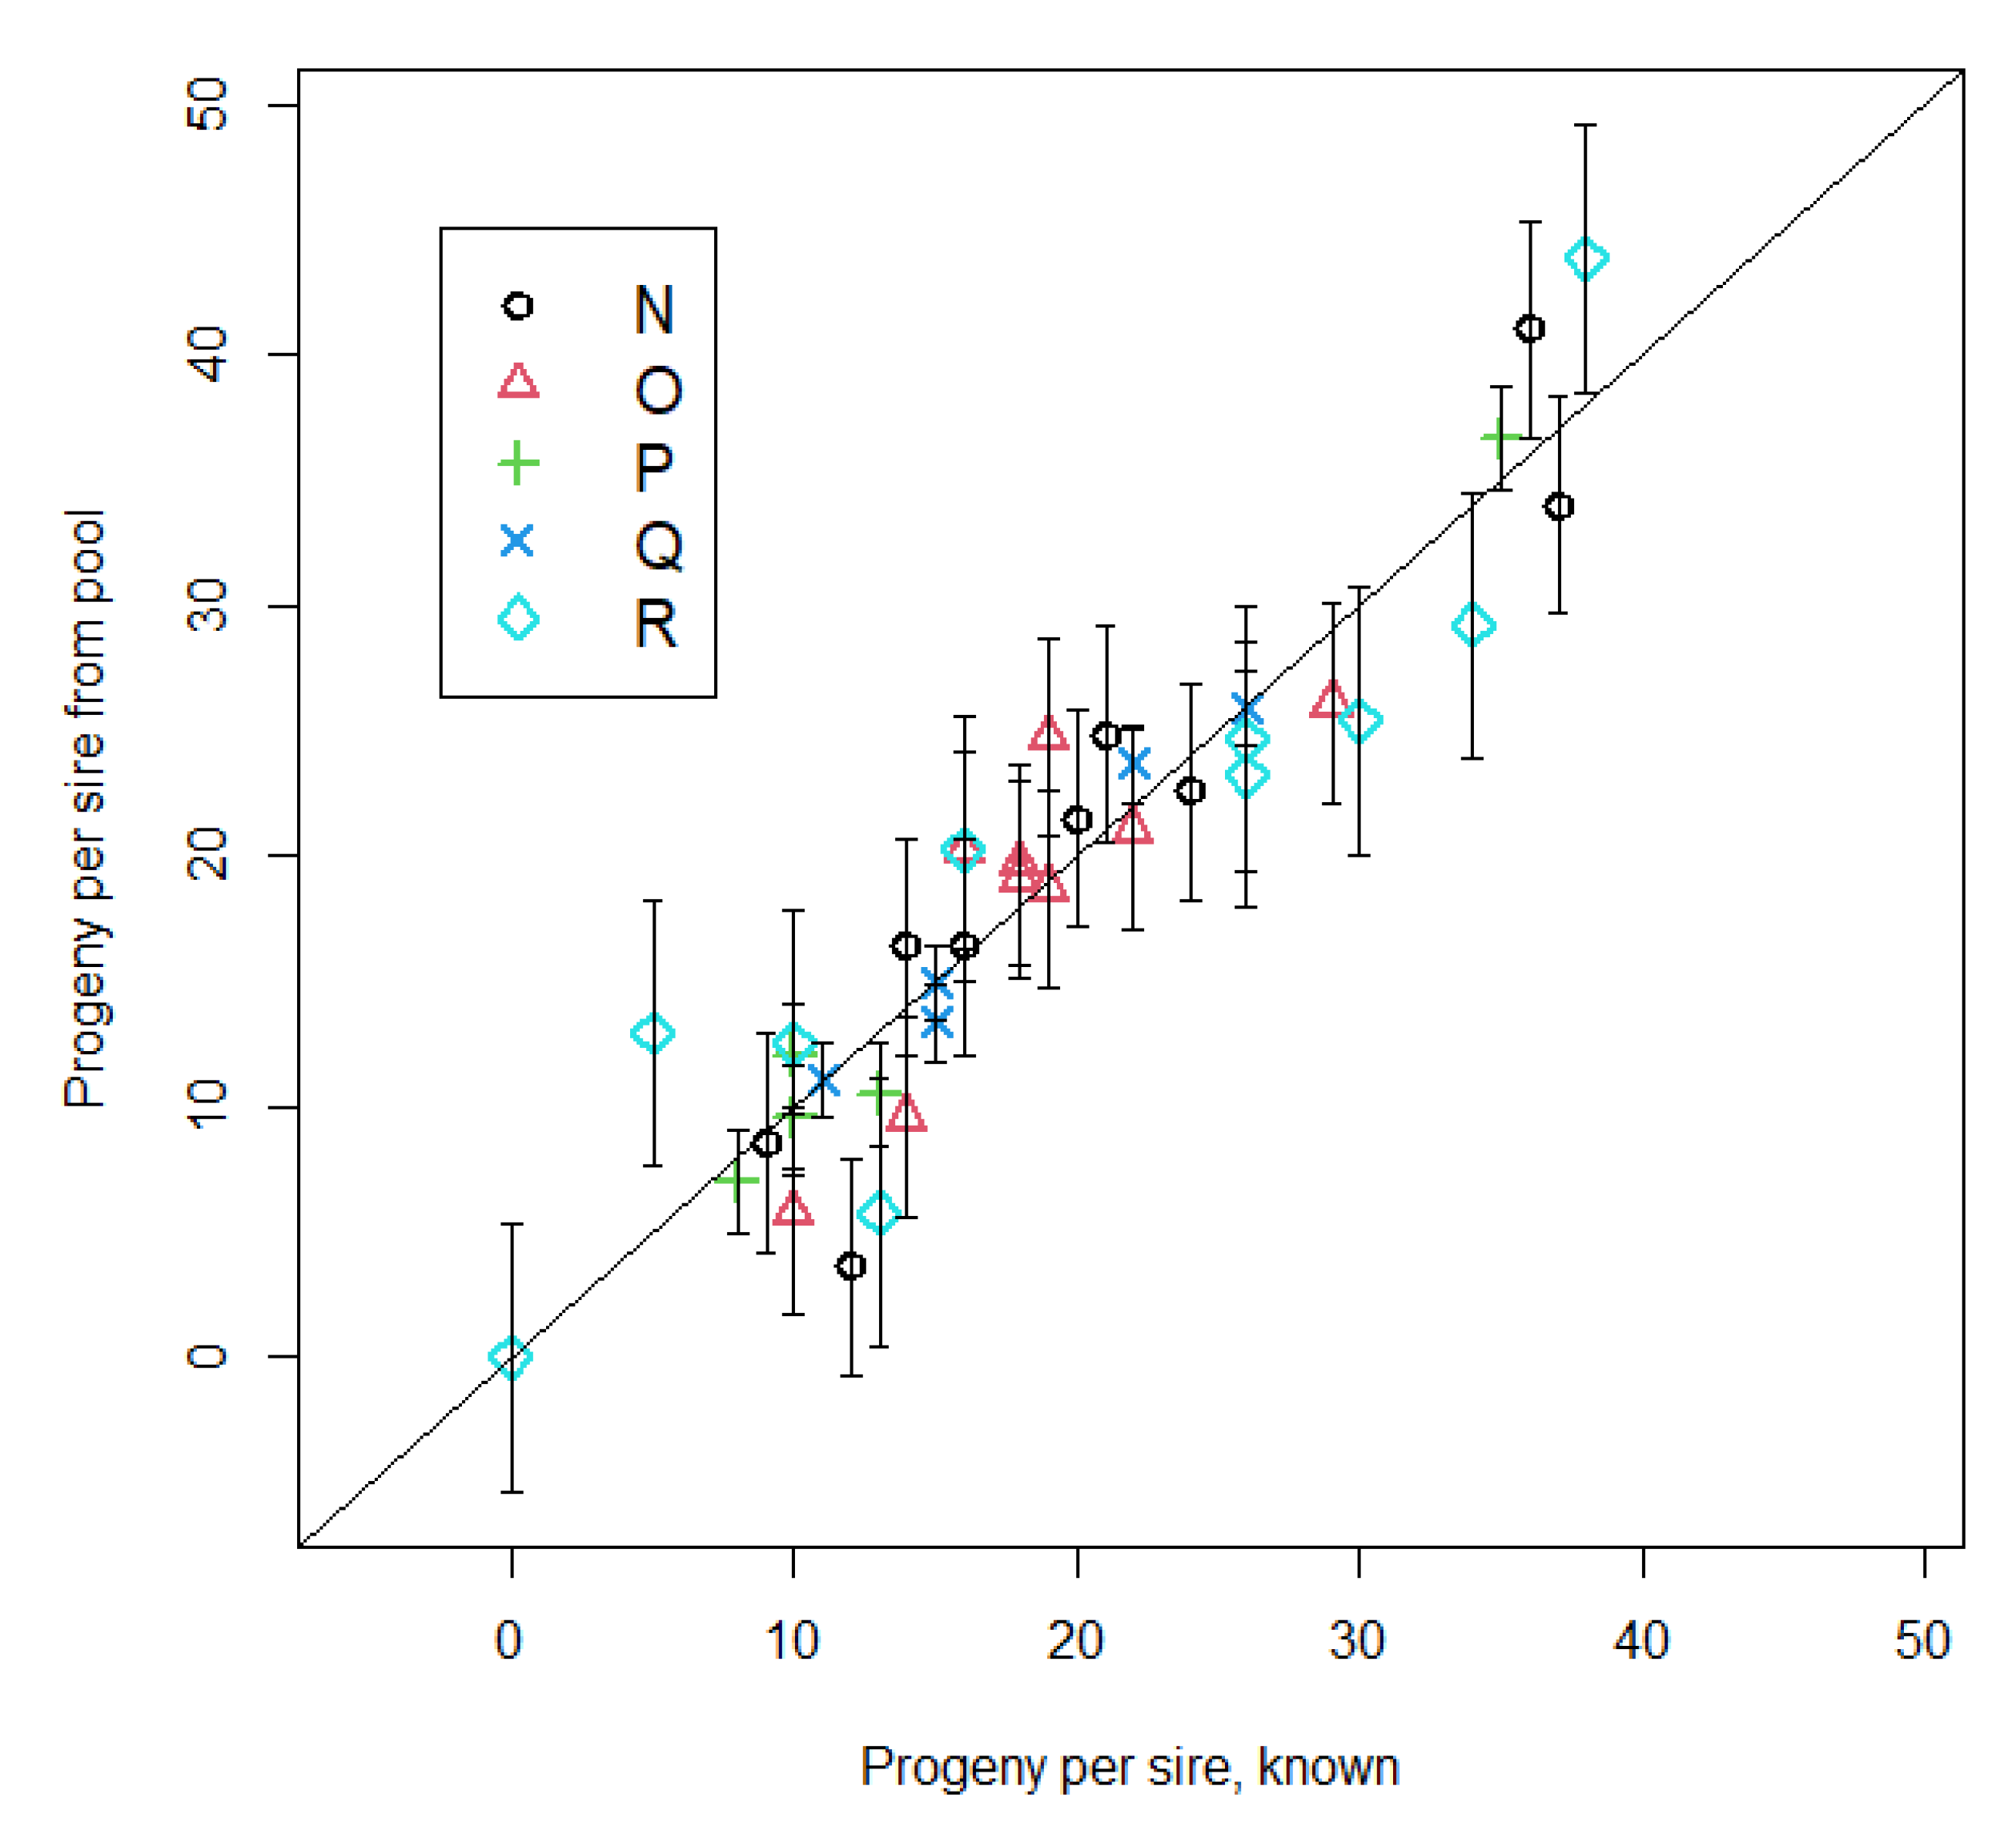
The concept of using pooled calf DNA to estimate bulls’ prolificacies was tested by simulating DNA pooling of actual genotypes of calves born in 2016 and genotyped with the Genomic Profiler F250 and sired by bulls genotyped with the same panel. Five pastures (N, O, P, Q, and R;
Table 1) with 189,165, 76, 89, and 198 calves and 9, 9, 5, 5, and 10 bulls, respectively, were used after removing bulls and calves without Genomic Profiler F250 genotypes. Simulations used 14,190 autosomal SNP common to both BovineSNP50 and GeneSeek Genomic Profiler F250 panels.
Simulation of pooling was a function of the actual allele frequencies for the calves in a pasture as well as pool construction and technical errors. Pool construction error or random unintended differences in the contribution of individual calves to the pool can result from incorrect DNA measurement or quantification; pipetting error; or cross contamination between pools, or between pools and individual animals. Technical error is the result of variation in the ratio of X (red dye intensity) to Y (green dye intensity) for samples with the same allele frequency (replicated pools) or the same genotype (replicated individuals or individuals of the same genotype). Standard deviations for pool construction error and technical error were estimated from replicated pools in earlier studies that have the same real or underlying allele frequency as if the animals in the pool had been individually genotyped [
15,
16]. Pooling allele frequency was estimated as the average of genotypes (copies of B allele) weighted by the random calf contribution divided by 2. Pool construction error was simulated as a Dirichlet distribution with SD = 0.0024 equivalent to using symmetric shape (alpha) parameter of 20 when pool size is 92. The Dirichlet distribution is parameterized by a shape parameter, alpha, for each calf in the pool. For example, for a pool size of 150 calves the parameterization included a vector of 150 elements all having the same value of 20. The magnitude of alpha determines how peaked the distribution of calf contributions is. Alpha = 10 would have less peaked and more variable animal contributions than alpha = 20. Simulated technical error was drawn from a normal distribution with a mean of zero and SD of 0.07.
Estimating the number of calves sired by a bull can be improved by knowing average genotype frequencies of the dams. Three levels of average dam allele frequency information were compared: (1) none, (2) a simulated, pooled estimate of allele frequencies from the 94.5% of dams with genotypes, and (3) average allele frequencies of the dams with genotypes. Quadratic programming [
17] to compute sire contributions while both not adjusting and adjusting for dam pooling allele frequency is included in an R script that is part of the
Supplemental Files.
When dam information was not included in the quadratic programming analysis, dam allele frequencies were proportional to the residual after subtracting predicted sire allele frequencies from calf pooling allele frequency (r2 ~0.8; data not shown). Adding dam frequencies would be expected to improve the accuracy of sire solutions at an additional cost of sampling cows and genotyping pools. Three levels of average dam allele frequency information were compared: (1) none, (2) pooled estimate of allele frequencies from the 94.5% of dams with genotypes with simulated pool construction and technical error incorporated, and (3) allele frequencies of the dams with genotypes.


 ,
, 
