Article

Low Light Alters the Photosynthesis Process in Cigar Tobacco via Modulation of the Chlorophyll Content, Chlorophyll Fluorescence, and Gene Expression

1
Key Laboratory of Tobacco Biology and Processing, Ministry of Agriculture and Rural Affairs, Tobacco Research Institute, Chinese Academy of Agricultural Sciences, Qingdao 266101, China
2
Graduate School of Chinese Academy of Agricultural Sciences, Beijing 100081, China
3
Haikou Cigar Research Institute of Hainan Provincial Branch of China National Tobacco Corporation, Haikou 571100, China
*
Author to whom correspondence should be addressed.
These authors contributed equally to this work.
Agriculture 2021, 11(8), 755; https://doi.org/10.3390/agriculture11080755
Submission received: 13 July 2021 / Revised: 2 August 2021 / Accepted: 5 August 2021 / Published: 9 August 2021
(This article belongs to the Section Crop Production)

Abstract

:
Shading or low light (LL) conditions are a key and necessary cultivation technique in cigar wrapper tobacco production. However, the effect of low light on the photosynthesis in cigar tobacco is not clear. Therefore, this study is designed to know the photosynthesis of cigar tobacco under different light intensities (T200, T100, and T50 μmol m−2 s−1). The results reveal that under low light, T50 especially improved the light interception and increased carbon utilization, as witnessed by a higher specific leaf area and lower specific leaf weight. Low light intensity caused better light interception and carbon utilization in cigar tobacco leaves, and thus thinner leaves are more able to use low light efficiently. The chlorophyll content is related to the photosynthesis process; thus, LL affected the photosynthesis process by lowering the chlorophyll content. Similarly, LL also altered the photosynthetic efficiency by lowering the QY_Lss, qP_Lss, and Rfd_Lss. Additionally, higher expression of Lhcb4.2, Lhcb6, PsbA, PsbB, and PsbD under low light, especially T50, shows that the PSII and antenna proteins complex efficiently utilized the absorbed energy for photosynthesis. Finally, the lower photosynthesis, particularly in T50, is attributed to the downregulation of genes related to NADPH production (petH) and the rubisco enzyme synthesis-related gene (rbcs) for CO2 fixation in the Calvin cycle. Overall, the results show that the photosynthesis is decreased under LL intensities which might be related to lower chlorophyll content and downregulation of petH and rbcs genes.

Graphical Abstract

1. Introduction

Light is life, as it dictates the plant’s growth and development throughout its lifecycle. Light is a key regulator of various plant developmental processes, as it plays a crucial role in germination and leaf and floral development [1]. Light is the most rapidly changing factor among other environmental limitations; thus, plants need to adjust their fitness and perform the physiological functions necessary for growth and development. Light quality and quantity both greatly influence the carbon metabolism via photosynthesis and also affect other parameters related to plant growth, development, and metabolism at morpho-physiological, biochemical, and molecular levels [2]. Yang et al. [3] suggest that both light quality and intensity affected plant physiology and biochemistry via changes in photosynthesis, leaf anatomy, and hormone contents. Additionally, higher light intensities have improved the antioxidant defense biochemistry, physiology, and photosynthesis characteristics of wheat seedlings in contrast to low light intensities [4]. As we all know, light is necessary for photosynthesis, and low light stress (LL) compromises plants’ photosynthetic efficiency; thus, low light is considered one of the main limiting growth factors [5].
Low light alters the morphological traits, chlorophyll content, and photosynthesis attributes in Brassica compestris [6], Brassica napus [7], Setaria italica [8], soybean [9], and wheat [10]. Plants absorb the light energy via PSII and PSI and drive the photosynthesis process by generating NADPH and ATP energy molecules. Photosynthetic electron transport is responsible for the generation of NADPH and ATP (chemical energy stored molecules), which is then used for the conversion of CO2 into sugars. It is well known that LL alters the plant’s morphological traits and physiological processes, especially photosynthesis. Leaf gaseous exchange is a well-known technique for studying the photosynthesis process [11]. Leaf gaseous exchange and chlorophyll fluorescence are important means for telling us about the photosynthesis process [12]. Previous studies demonstrated that LL is responsible for a decrease in net photosynthesis rate and stomatal conductance [6,8,13]. Similarly, chlorophyll fluorescence parameters such as PSII quantum yield, photochemical coefficient, and electron transport rate are significantly decreased under LL and ultimately photosynthesis [5,14,15]. LL affects the photosynthesis process not only at the physio-chemical level but also at the gene expression level. Sun et al. [16] propose that the lower photosynthetic capacity in the cucumber plant is due to the downregulation of Rubisco-related gene expression. In tomato seedlings, low light downregulates the PSII reaction center-related gene (PsbA, PsbB, PsbD, PsbP, and cab), indicating that photosynthesis is affected at the transcriptional level [5]. Additionally, LL also downregulates the genes related to the light-harvesting complex (LHC) (CAB genes), PSII reaction center, and electron transport chain (PSIIPSB27-H1, OEE1, OEE2) in a rice low light-sensitive cultivar compared to a low light-tolerant cultivar [17].
As the previous studies show, light intensities affect the quality of crops; for example, higher light intensities improve the quality of soybean via higher enzyme activities and their related genes involved in carbon metabolism [9]. In another study, the quality of pakchoi (Brassica chinensis L.) is improved by higher uptake of glycine, but its uptake is strongly dependent on light intensities [18]. Commonly, tobacco is grown in an open environment, while cigar tobacco is grown in open fields under shading conditions. Wrapper tobacco is the outer part of the cigar which is thin in texture and usually dominates the flavor of a cigar. The expensive hard-to-obtain wrapper leaves are acquired from plants grown in shady environments which are used as a cover towards the end of manufacturing high-quality cigars [19]. Shading or low light (LL) conditions are a key and necessary cultivation technique in cigar wrapper tobacco production. However, the effect of low light on the photosynthesis in cigar tobacco is not clear. Therefore, this study is designed to know the photosynthesis of cigar tobacco under different light intensities.

2. Materials and Methods

2.1. Plant Materials, Growth Conditions, and Treatments

The experiment was carried out at the Jimo experimental station of Tobacco Research Institute of Chinese Academy of Agricultural Sciences (Qingdao, China). The cigar tobacco (Nicotiana tabacum L. cv. H382) which was provided by Haikou Cigar Research Institute of Hainan Provincial Branch of China National Tobacco Corporation (Hainan, China) was used in this study. Seeds were sown in small trays containing a mixture of peat and vermiculite (V/V: 1:1). After germination, the seedlings were then transferred to seedling trays that were filled with the same mixture as mentioned above. When the seedlings grew up to six leaves, they were transferred into 19 cm × 14 cm (diameter × depth) plastic pots with one seedling per pot. The seedlings of normal growth and development having six leaves were selected and placed in an LED-based light growth chamber. Blue and red spectra were used as a light source for the different light intensities. The growing conditions of the growth chamber had 28 °C and 24 °C day and night temperatures, respectively; 60 ± 5% relative humidity; and 15 h/9 h photoperiod. Three light intensity levels were set as T200 (control-light intensity was 200 ± 15 μmol m−2 s−1), T100 (100 ± 15 μmol m−2 s−1), and T50 (50 ± 15 μmol m−2 s−1). Each treatment was comprised of 24 potted seedlings. A leaf was labeled before the plants were subjected to different light intensities for 10 days. Figure 1 shows the entire experimental sketch and setup.

2.2. Measurement of Plant Growth and Leaf Traits

Three biological repeats from each treatment were sampled for biomass and specific leaf weight analysis. The plants were divided into leaves, roots, and stems. First, the leaves were photographed using a digital camera. After photography, the leaves, roots, and stem were dried in an oven at 105 °C for 0.5 h and then dried to a constant weight at 80 °C to determine their total dry biomasses. The leaf area was determined by using the photos of the leaves of each treatment in Adobe Photoshop CC2019 software (Adobe Systems, San Jose, CA, USA) [20]. Specific leaf weight (SLW) is the ratio of leaf dry mass to leaf area [21], and specific leaf area (SLA) is the ratio of leaf area to leaf dry mass [22].

2.3. Determination of Chlorophyll Content

Briefly, following the method of Fan et al. [23], the chlorophyll content was determined on leaf discs (1.22 cm2) which were punctured from the middle portion of the labeled leaf. The leaf discs were divided into narrow strips and put into a 5 mL tube having 80% acetone solution. The sample tubes were kept in dark for 24 h at room temperature. The absorbance of the extract was measured at 663 and 645 nm using a spectrophotometer (SHIMADZU-UV 2600 spectrophotometer, Shimadzu Corporation, Kyoto, Japan).
Chl a = 12.7 OD663 − 2.69 OD645
Chl b = 22.9 OD645 − 4.86 OD663

2.4. Determination of Chlorophyll Fluorescence Parameters

Pulse amplitude modulated (PAM) fluorescence imaging system (Fluor Cam FC 800, Photon Systems Instruments, Brno, Czech Republic) was used to study the chlorophyll fluorescence characteristics of the cigar tobacco leaves under different light intensities. The leaves were dark-adapted for 30 min before taking the measurements which allow the leaves to open the PSII reaction centers. Following the protocol of Khan et al. [24], the leaf was kept under FluorCam to obtain the kinetic chlorophyll fluorescence parameters. The quenching analysis was carried out on the cigar tobacco leaf in order to measure Fo and Fm. Based on the basic chlorophyll fluorescence signals, the maximal photochemical efficiency (Fv/Fm), the actual photochemical efficiency (QY_Lss), steady-state non-photochemical quenching (NPQ_Lss), photochemical quenching coefficient (qP_Lss), non-photochemical quenching coefficient (qN_Lss), and the ratio of fluorescence decline (Rfd_Lss) were calculated. The equations for the above parameters are as follows:
Fv/Fm = (Fm_Lss − Fo_Lss)/Fm_Lss
QY_Lss = (Fm_Lss − Ft_Lss)/Fm_Lss
NPQ_Lss = (Fm − Fm_Lss)/Fm_Lss
qP_Lss = (Fm_Lss − Ft_Lss)/(Fm_Lss − Fo_Lss)
qN_Lss = (Fm − Fm_Lss)/(Fm − Fo_Lss)
Rfd_Lss = (Fp − Ft_Lss)/Fm_Lss

2.5. Light Response Curve Measurement

To obtain and construct the light response curve, all photosynthesis measurements are acquired on the labeled leaf with a leaf temperature of 25 °C, a CO2 concentration of 400 μmol m−2 s−1, and relative humidity of 60%. A portable photosynthesis system LI-COR 6800 (LI-COR Inc., Lincoln, NE, USA) was used for the measurements. The leaf was acclimated under a PAR of 1800 μmol m−2 s−1 for 30 min to avoid photo-inhibition before measurements. After a stable value, the leaves were immediately exposed to a series of PAR for 3 min or so in the following order: 1800, 1500, 1200, 900, 600, 300, 200, 150, 100, 70, 30, and 0 μmol m−2 s−1. The net photosynthetic rate (Pn) was determined after each light intensity stabilized at 120 s [25].

2.6. RNA Extraction, cDNA Synthesis, and qRT-PCR

The total RNA was extracted from the leaves of the cigar tobacco under different light intensities using FastPure Plant Total RNA Isolation Kit reagent (Vazyme, Nanjing, China) according to the manufacturer’s instructions. After RNA extraction, the cDNA was synthesized using HiScript III qRT SuperMix reversed transcriptase (Vazyme, Nanjing, China). The qRT-PCR was performed using SYBR Premix Ex Taq II (Takara, Japan) in the Applied Biosystems QuantStudio3 Real-Time PCR system (Thermo Fisher, Waltham, MA, USA). Actin gene was used as an internal reference gene, and the data were analyzed using the 2−∆∆Ct method of three biological repeats [26]. The primers used in this study are provided in Table 1.

3. Statistical Analysis

The collected data were statistically analyzed using one-way ANOVA in SAS (Statistical Analysis System), software version 9.1 (SAS Institute Inc., Cary, NC, USA). The data were presented as mean ± SE (standard error). The LSD (least significant difference) test was used to determine the significant variations between the means using p < 0.05. OriginPro 9.1 (OriginLab Corporation, Northampton, MA, USA) was used for plotting the graphs.

4. Results

4.1. Plant Growth and Leaf Traits

Figure 2 portrays the effect of LL on plant biomass and various leaf traits. The plant dry weight (DW) is significantly reduced under LL. A 15% and 45% reduction is observed in T100 and T50 relative to that of T200 (Figure 2A). In response to LL, the leaf area (LA) is increased with 22% and 12% increment in T100 and T50, respectively, compared with T200 light intensity (Figure 2B). The leaf specific area (LSA) is also significantly affected under LL. The LSA of T100 and T50 are 34% and 77% greater, respectively, relative to T200 (Figure 2C). Additionally, the leaf specific weight (LSW) is reduced in response to low light stress. A 25% and 44% reduction is observed in LSW of T100 and T50, respectively, in comparison with T200 (Figure 2D).

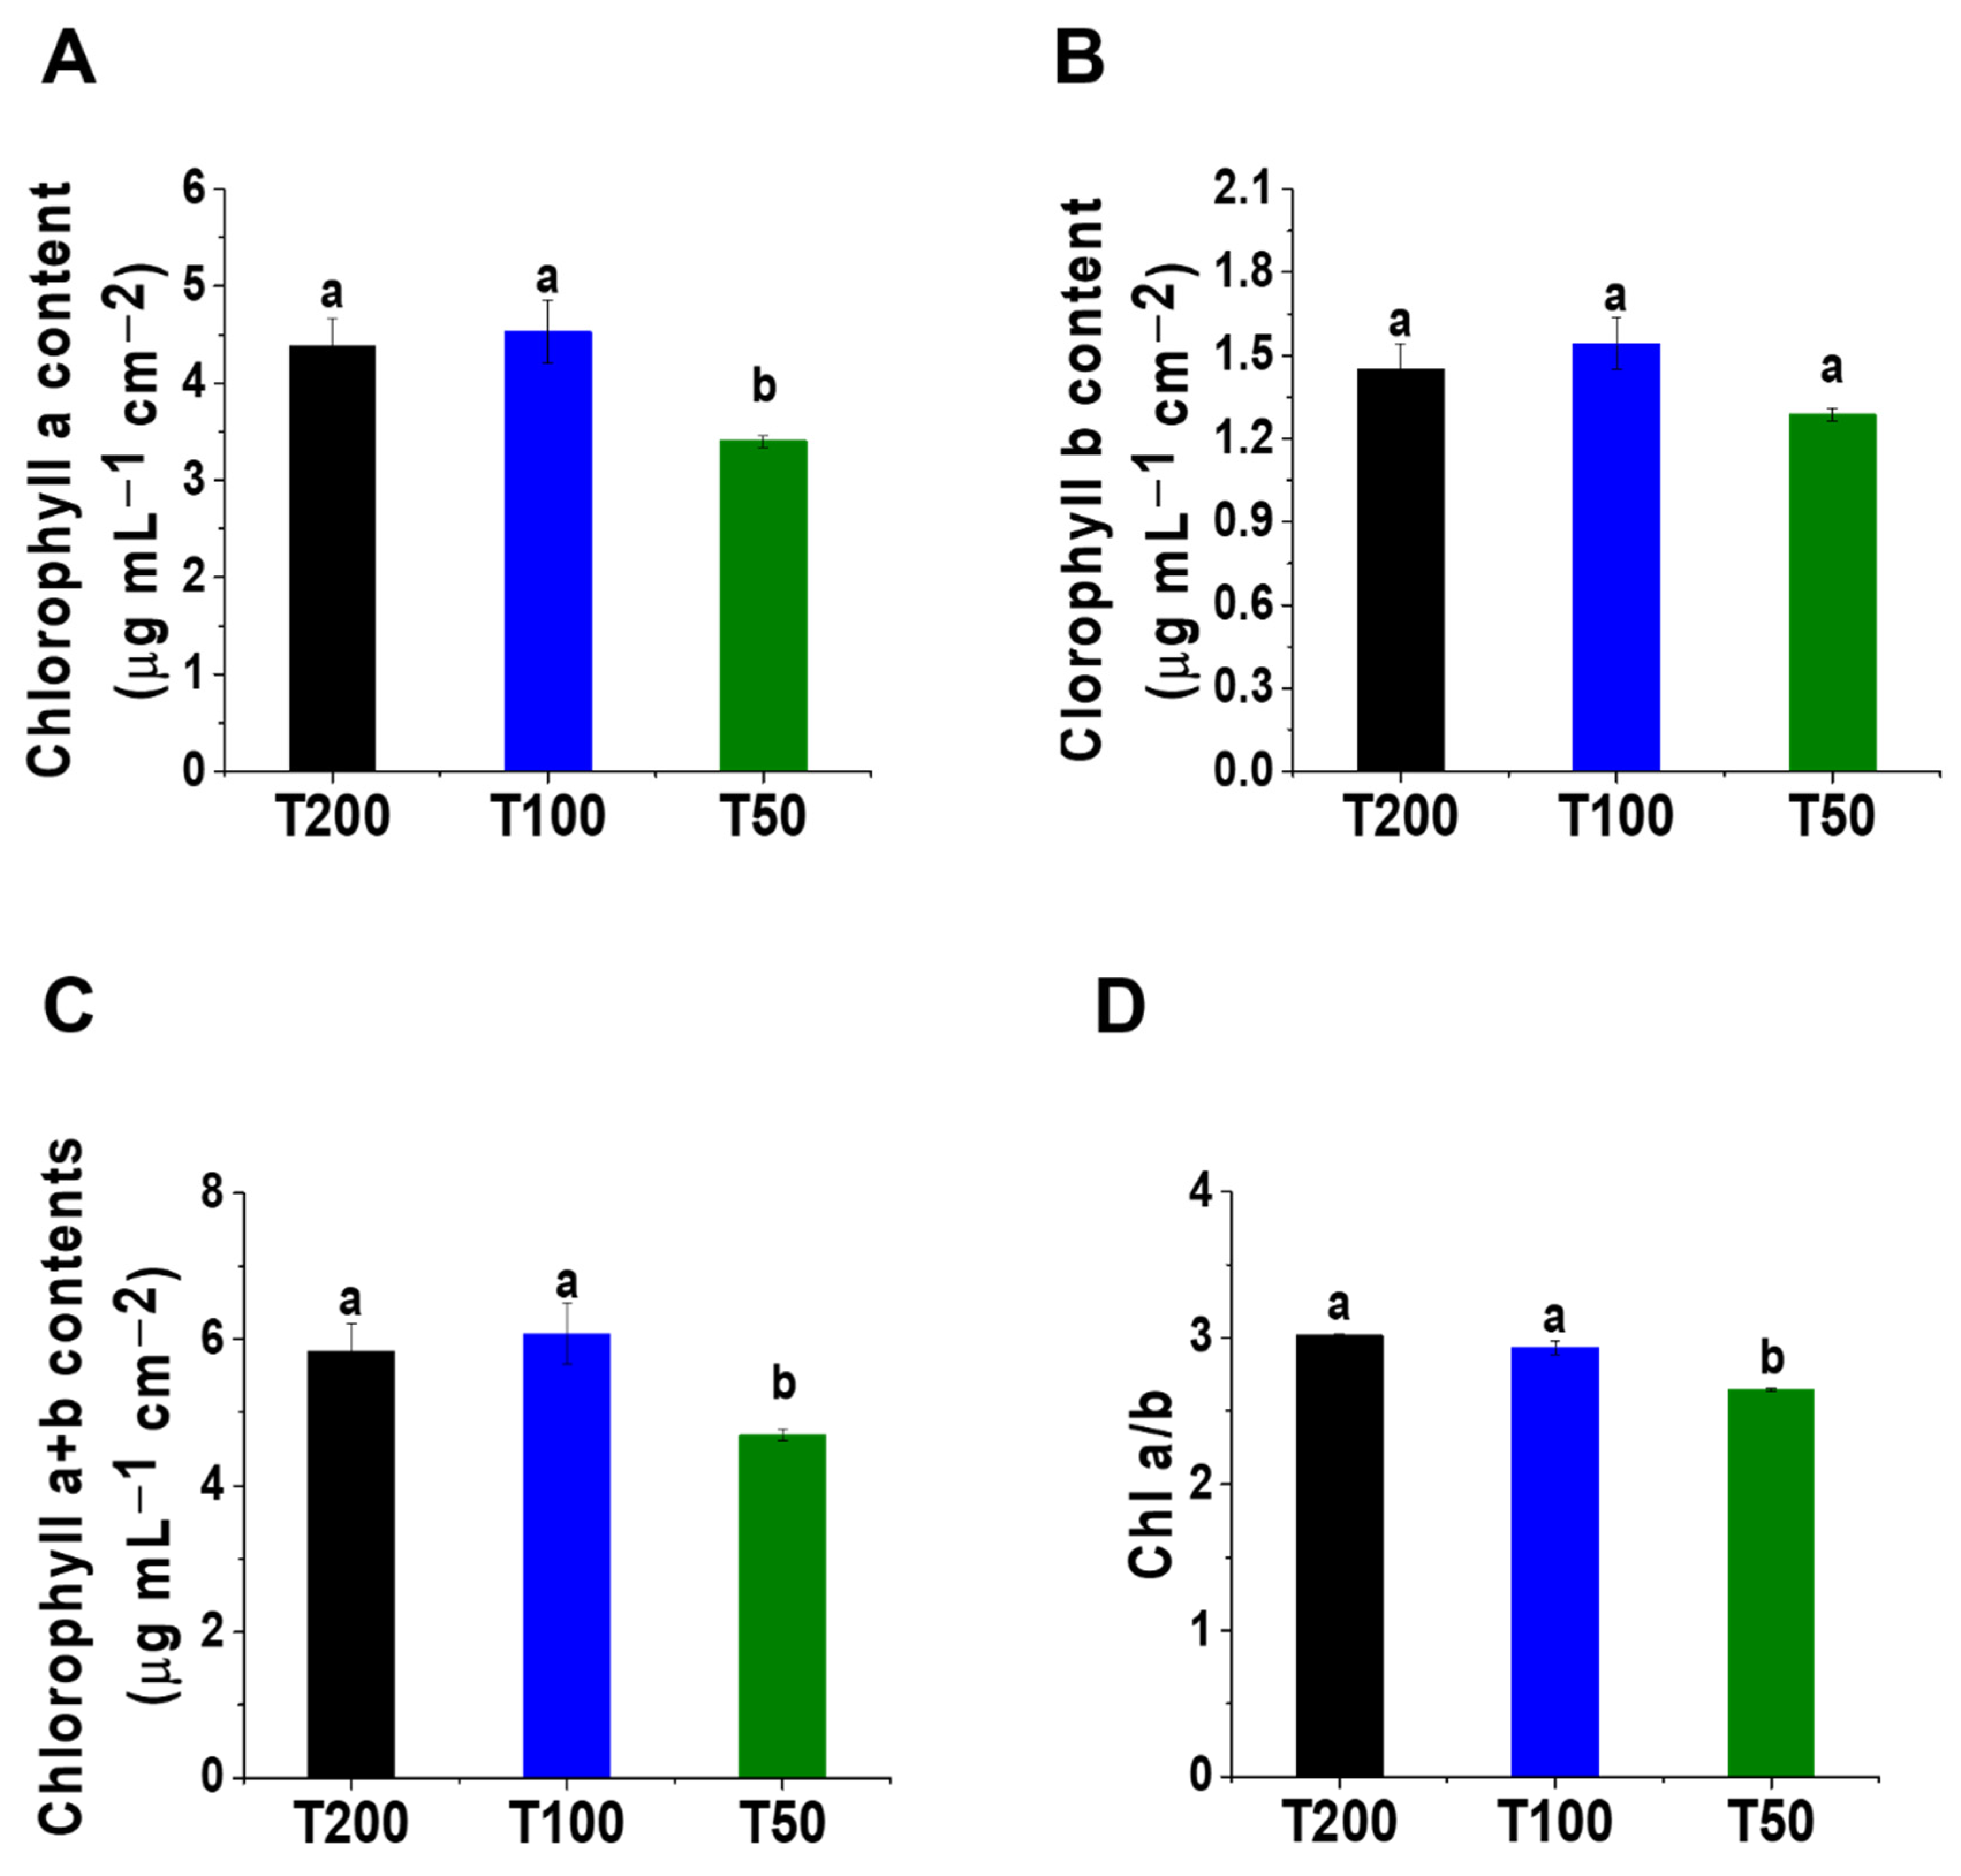
4.2. Changes in Chlorophyll Content

Low light significantly affected chlorophyll pigment contents (Figure 3). Chlorophyll a content (chl a) under only T50 shows a 22% reduction relative to T200, while T100 is found statistically similar to the control (Figure 3A). The chlorophyll b content (chl b) is not affected under LL (Figure 3B). The total chlorophyll content (Chl a + b) is also reduced in response to low light with a 20% reduction in T50 in comparison with T200 (Figure 3C). Similarly, the chlorophyll a and b ratio also shows a decrease in its values only under the T50 treatment (Figure 3D). The chl a/b of T50 is 12% lower, while T100 is not statistically different from that in T200.

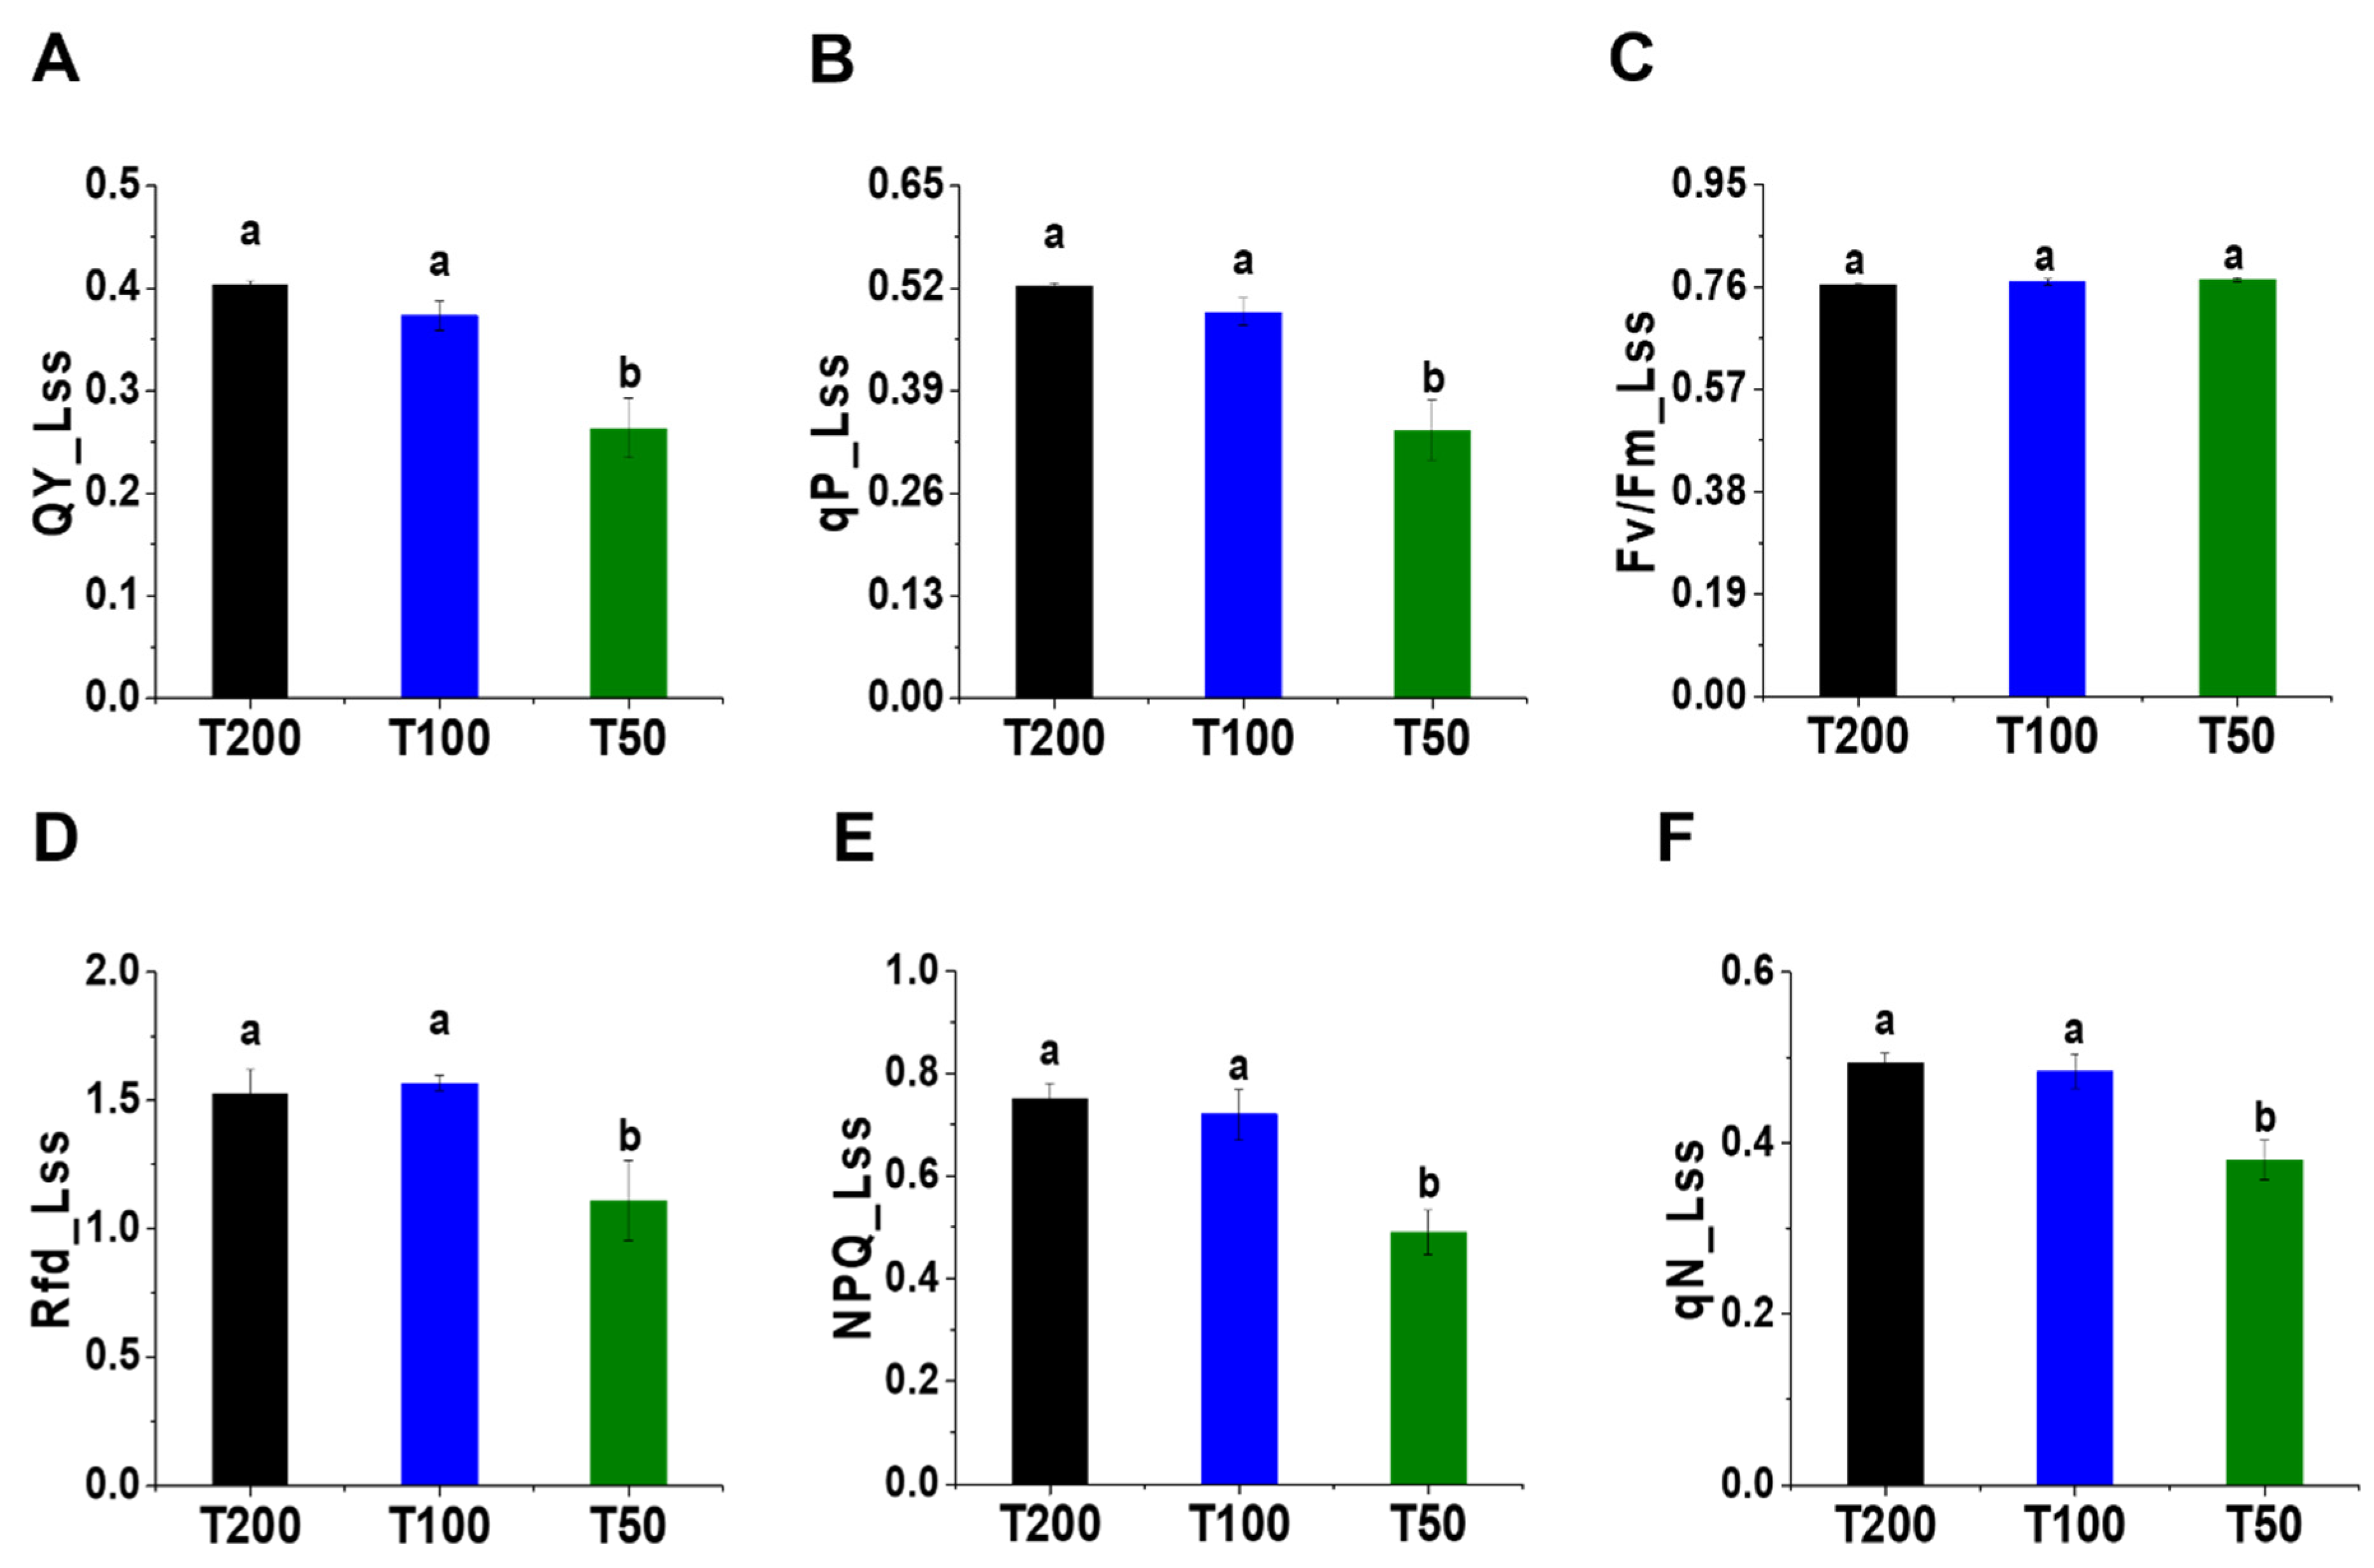
4.3. Changes in Chlorophyll Fluorescence Parameters

Leaves exposed to low light stress show a reduction in the PSII quantum yield (QY_Lss). The actual PSII quantum yield is 35% decreased in T50 only relative to the control (Figure 4A). The photochemical quenching coefficient (qP_Lss) also shows a reduction in its value and is 35% lower, while T100 is not significantly different relative to T200 (Figure 4B). Rfd_Lss also exhibits a reduction, which is lowered by 27% in the T50 treatment in comparison with that in T200, while T100 is found non-significant (Figure 4D). Furthermore, NPQ_Lss is also drastically decreased in response to low light stress. Its value is 35% lower in T50 than in T200 (Figure 4E). Finally, the non-photochemical coefficient (qP_Lss) is significantly influenced by LL. T100 shows no significant change, while a 23% reduction change is observed in T50 relative to T200 (Figure 4F).
Figure 5 portrays the representative images of the various chlorophyll fluorescence parameters such as QY_Lss, qP_Lss, Rfd_Lss, NPQ_Lss, and qN_Lss of cigar tobacco leaves under different light intensities. In comparison with T200, all the presented images of the various parameters in T100 show a decrease in the signal intensity at the leaf tip only, while in T50, the signal intensity is diminished from the leaf tip and margins to the middle portion and finally the entire leaf surface. The differences in the intensity of the signal show spatial heterogeneity.

4.4. Changes in the Characteristics of the Light-Response Curve

A light response curve is used to evaluate the photosynthetic efficiency of cigar tobacco in response to LL. It is revealed that photosynthesis increases gradually with an increase in light intensity (Figure 6A). However, the net photosynthesis rate is lower in T50 in comparison with T200. Leaves under low light (T50) show significant changes in apparent quantum efficiency (AQY), light compensation points (LCP), and dark respiration (Rd) (Figure 6B,E,F, respectively). The AQY, LCP, and Rd are 22%, 40%, and 51% lower in T50 in comparison with T200. However, the maximum photosynthesis rate (Pmax) and light saturation point (LSP) are not significantly influenced by the treatments (Figure 6C,D).

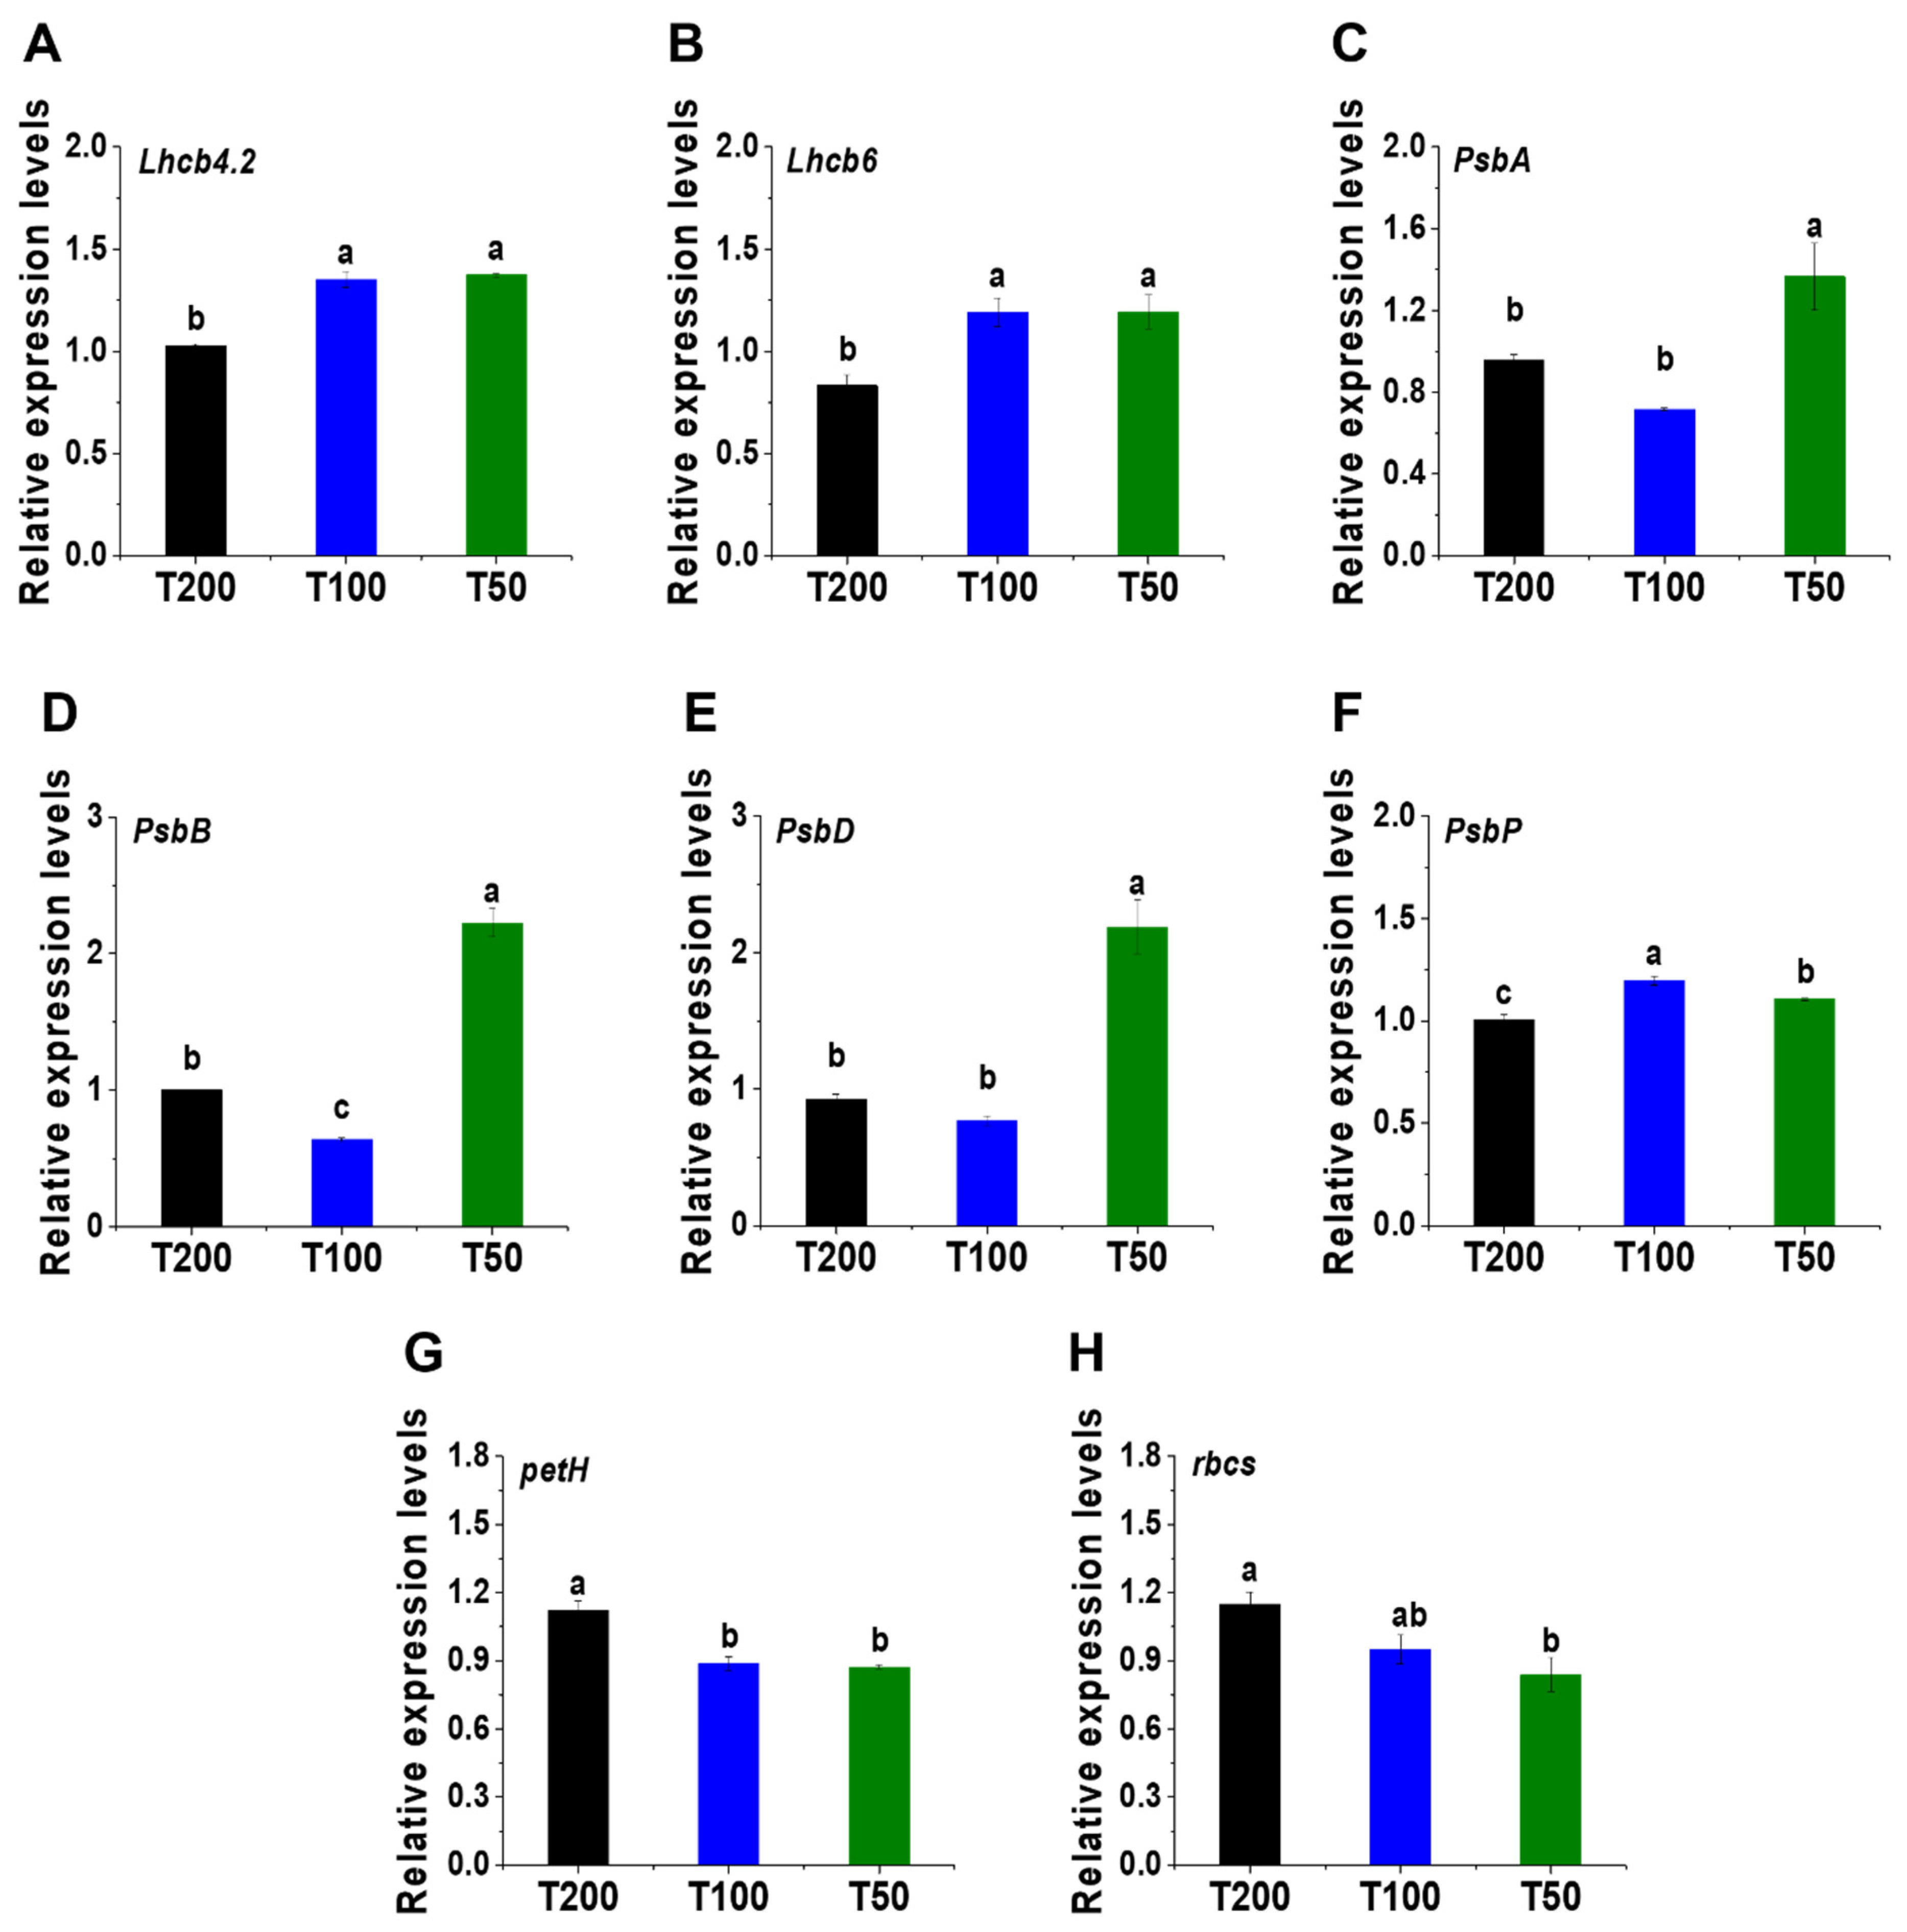
4.5. Changes in Gene Expression

The gene expression related to light-harvesting antenna complex (Lhcb4.2, Lhcb6), Photosystem II (PsbA, PsbB, PsbD, PsbP), ferredoxin-NADP reductase (petH), and Rubisco (rbcs) is evaluated under various low light conditions in cigar tobacco leaves (Figure 7). The transcript levels of Lhcb4.2 and Lhcb6 genes related to the light-harvesting antenna complex are significantly increased in both treatments of low light (T100 and T50) in comparison with the control (Figure 7A,B). In addition, the three genes PsbA, PsbB, and PsbD which encode the intrinsic proteins of Photosystem II are significantly upregulated in T50 relative to the control (Figure 7C–E), while the expression of PsbB alone is decreased in T100. The expression levels of PsbA and PsbD are found non-significant in T100 in comparison with the control (T200). The PsbP gene which encodes the extrinsic proteins is upregulated in both T100 and T50 in comparison with T200 (Figure 7F). Furthermore, the petH gene related to ferredoxin-NADP reductase enzymes as well as the Rubisco synthesis-related gene rbcs is downregulated in both T100 and T50 (low light treatments) related to the control (Figure 7G,H).

5. Discussion

Light intensity affects plants morphologically, as plant height, leaf number, and leaf dry mass have a strong relationship with light intensity [27]. In another study, shading results in total plant dry mass reduction [28]. The results of our study demonstrate that leaf dry weight is lowered under low light. Leaf area (LA) growth determines the light interception [29], which is of great importance to improve the photosynthetic efficiency of a plant [30]. Overall, the results show that LA and specific leaf area (SLA) are increased, while specific leaf weight (SLW) is decreased in response to low light intensity. Higher SLA shows that thinner leaves represent more carbon allocation to the leaf area, so the increment of SLA is more important in maximizing carbon gain per unit leaf mass under low light [31], thereby optimizing light interception. SLW, the leaf mass per unit area, is a developmental phenotypic plasticity factor, allows changes to buffer the effects of abiotic stresses, and is reduced under low light [32]. Carbon gain is important for plant growth and survival and hence for plant fitness. Thinner leaves are more able to use low light efficiently by promoting SLA and decreasing SLW to maximize more carbon gain [28]. Other studies also find an increment in LA and SLA under low light stress [33,34], thus confirming the results of this study.
Chlorophyll is responsible for driving the photosynthesis process and photosynthetic electron transport chain. It is an important photosynthetic pigment that determines the photosynthetic efficiency of a plant and ultimately the plant’s growth [35]. In this study, chl a, total chlorophyll content, and chl-a/b are reduced under low light stress, while chl b is not significantly affected. The chl b absorbs the diffuse light with a short wavelength and transfers light energy in photosynthesis, thus improving the utilization efficiency in response to low light stress [6]. Other studies also find the reduction in chl a, total chl content, and chl-a/b under LL [5,8], which is in line with our results suggesting that low light stress impairs the photosynthetic machinery. Overall, the results suggest that the lower chlorophyll content under LL may explain the reduction in photosynthesis, as Dai et al. [36] also observed lower chlorophyll content and photosynthesis with an increase in shading.
Presently, chlorophyll fluorescence is a widely used technique in plant physiology to study the photosynthetic efficiency of plants [37]. Chlorophyll fluorescence is a powerful and broadly used technique to determine the changes in the photosynthesis process under stressful conditions, and in the past two decades, chlorophyll fluorescence techniques have been greatly improved [38]. QY_Lss is the actual quantum yield, which shows the light absorbed used in the photochemistry and gives a picture of the overall photosynthesis process; qP_Lss is the photochemical quenching coefficient, which shows open reactions centers [39]; and Rfd_Lss is used as an indicator for CO2 fixation/photosynthetic rates, which shows that plant vitality [40,41] is decreased in response to low light. Former studies show that low light stress or shading causes lower photosynthesis due to a reduction in QY_Lss and qP_Lss [5,9]. In this study, Rfd_Lss is lowered under LL which is congruent with [42], which also observed lower values of shading leaves relative to sunny leaves, indicating that a lower CO2 fixation rate and photosynthetic rate and a higher Rfd_Lss demonstrate greater photosynthesis rates [43]. Non-photochemical quenching (NPQ_Lss), which represents light energy dissipated as heat and is not used in photosynthesis and qN (non-photochemical quenching coefficient), is used to describe the efficiency of PSII in energy dissipation [39,44]; both are lowered under LL. The results of this study are corroborated by [9,14,45], which also observe a reduction in NPQ and qN, suggesting that under LL, the thermal dissipation is effectively reduced, and the antenna pigments utilize the absorbed energy for photosynthesis by PSII [46]. Chlorophyll fluorescence images (Figure 5) represent spatial heterogeneity under different light intensities. The signal intensity is decreased in T100 at the tip of the leaves only, while in T50, it is lowered at the tip, margins, and middle portion of the leaves. The lower signal intensities show that photosynthesis is restricted on those sites. Other studies also found spatial heterogeneity in chlorophyll fluorescence parameters under drought stress conditions and concluded that photosynthesis is negatively affected [24,47,48]. In this study, T50 shows greater restriction of the photosynthesis at the whole leaf surface area, especially the leaf tip and margins.
The light response curve possesses a key position in plant physiological ecology [49]. The maximal rate of photosynthesis and LCP is higher in plants under high light illumination than low light [50,51]. In this study, LL results in lower AQE, LCP, and Rd. Shading generally induces lower photosynthetic rates and LCP [52]. LCP is the level of light at which photosynthetic CO2 fixation matches respiratory losses. Under low light adaptation, plants with higher LCP and Rd values suggest that they consume more photosynthates to maintain normal physiological metabolism [25], while on the other hand, a low LCP is advantageous because it maintains a positive carbon balance under low light conditions [53].
The LHC II antenna system is comprised of major and minor protein complexes in which the Lhcb4 and Lhcb6 genes belong to the minor antenna system [54]. Higher plants capture the light energy through their antenna system and transfer it to the PSII reaction center. The Lhcb4, Lhcb5, and Lhcb6 play protective roles during photoinhibition that are involved in the energy transfer [44]. In our study, the Lhcb4.2 and Lhcb6 genes show upregulation in response to low light, which shows acclimation, and might capture light energy even under low light conditions. Therefore it is speculated that these genes play important roles in regulating leaf adaptation to low light and increase the efficiency of light absorption, thus improving weak light utility [55].
PsbA, PsbB, and PsbD are the intrinsic genes of the PSII system, which encodes D1, CP47, and D2 proteins, respectively [56], while the PsbP gene encodes the extrinsic protein of PSII, which participates in the normal function of photosynthetic water oxidation [57]. The activity of the PSII system is restricted by various environmental stresses affecting the synthesis of proteins required for its repair and proper functioning [58]. The expression of PsbA, PsB, and PsbD is repressed in oat plants under saline conditions, exhibiting damage to the PSII system [59], while 5-aminolevulinic acid application increases the PsbA and PsbD expression in wheat under drought, which represents the damage repair of the PSII system [60]. In our study, the expression levels of these genes are increased under T50 relative to the control, which indicates PSII damage repair under a low light environment. The PsbP gene product is an extrinsic subunit protein of PSII participating in oxygen evolution, and it is indispensable in higher plants for its proper functioning under normal conditions [57]. In our study, the PsbP gene is upregulated in both low treatments (T100 and T50) relative to the control, while it is downregulated under drought stress in barley [61] and seagrass (Zostera muelleri) under low light, suggesting that the plants tried to stabilize the PSII system and regulate their antenna size to capture more light for photosynthesis [62]. The PsbP gene in higher plants has PPL proteins (PsbP-like proteins), and PPL1 is required for efficient repair of a photodamaged PSII system, as the ppl1 mutant has a poor and delayed recovery of the photoinhibited-PSII system in comparison with wild-type plants [63]. In this study, the lower NPQ_Lss and qN_Lss and the upregulation of the PSII system and antenna protein complex-related genes (Lhcb4.2, Lhcb6, PsbA, PsbB, and PsbD) under LL (mainly in T50) explain how the thermal dissipation is effectively reduced and antenna pigments utilized the absorbed energy for photosynthesis by the PSII system [46]. Overall, the increased expression of Lhcb4.2, Lhcb6, PsbA, PsbB, and PsbD genes shows an establishment of consistent flow of electrons and might protect the photosynthetic machinery, thereby improving the photosynthetic system efficiency.
Plants possess a class of enzymes called ferredoxin-NADP+ oxidoreductase (FNR), which are responsible for the production of NADPH in the last step of the photosynthetic electron transport chain, and petH genes encodes the FNR enzymes which catalyze this reaction [64,65]. Yang et al. (2020) observe the downregulation of the petH gene and lower the photosynthesis rate under low light + Fr treatment, which supports the results of our study. Similarly, Rubisco is the most abundant protein in plant leaves, and life on earth is dependent on the photosynthetic ability of plants to convert atmospheric CO2 into 3-phosphoglycerate via Rubisco enzyme activity in the Calvin–Benson–Bassham pathway [66]. The Rubisco enzyme is encoded by large subunit proteins and small nuclear proteins by the expression of rbcL and rbcS genes, respectively [67]. Chen et al. [68] suggest that rbcL and rbcS are the potential molecular markers for breeding programs of high oil yield tea plant selections in combination with their photosynthetic efficiency. In this study, the photosynthesis is lower under low light (T50 treatment), which might be due to the downregulation of the rbcS gene, and the results are congruent with [16], which also postulated that the lower photosynthetic capacity in cucumber leaves is probably due to downregulation of Rubisco synthesis-related gene expression under low light.

6. Conclusions

In this study, cigar tobacco seedlings subjected to different light intensities (T200, T100, and T50 μmol m−2 s−1) are evaluated by dry biomass, SLW, SLA, chlorophyll content, chlorophyll fluorescence, light response curve, and photosynthesis-related gene expression. It has been shown that low light intensities decrease the SLW and increase the SLA, suggesting better light interception and carbon utilization. Lower LCP values under low light intensities highlight a positive carbon balance in cigar tobacco leaves. Similarly, LL intensities decrease the QY_Lss, qP_Lss, and Rfd_Lss, which ultimately lowers the photosynthetic efficiency of cigar tobacco. Additionally, lower NPQ_Lss and qN_Lss and higher expression of Lhcb4.2, Lhcb6, PsbA, PsbB, and PsbD under low light suggest that the light energy absorbed is utilized for photosynthesis, which shows an adaptation strategy. Finally, this study provides a piece of intriguing evidence that lower photosynthesis under T50 might be due to lower chlorophyll content and the downregulation of petH and rbcs genes. It is concluded from this study that on the one hand, low light altered the photosynthesis process, while on the other hand, it caused better light interception and carbon utilization in cigar tobacco leaves, and thus thinner leaves are more able to use low light efficiently.

Author Contributions

X.M. conceived, designed, and supervised the experiment; X.W. and R.K. conducted the experiment, finalized the figures and tables and their interpretation, and wrote the manuscript; X.W. and J.Z. carried out qRT-PCR studies; H.G. and H.L. edited and revised the manuscript. X.W. and R.K. contributed equally to this work. All authors have read and agreed to the published version of the manuscript.

Funding

This work was funded by the Agricultural Science and Technology Innovation Project of Chinese Academy of Agricultural Sciences (ASTIP-TRIC03) and Science and Technology Project of Hainan (201746000024055).

Institutional Review Board Statement

Not applicable.

Informed Consent Statement

Not applicable.

Data Availability Statement

Not applicable.

Conflicts of Interest

The authors declare no conflict of interest.

References

  1. De Wit, M.; Galvão, V.C.; Fankhauser, C. Light-mediated hormonal regulation of plant growth and development. Annu. Rev. Plant Biol. 2016, 67, 513–537. [Google Scholar] [CrossRef] [PubMed]
  2. Shafiq, I.; Hussain, S.; Raza, M.A.; Iqbal, N.; Asghar, A.M.; Raza, A.; Yuan-fang, F.; Mumtaz, M.; Shoaib, M.; Ansar, M.; et al. Crop photosynthetic response to light quality and light intensity. J. Integr. Agric. 2021, 20, 4–23. [Google Scholar] [CrossRef]
  3. Yang, F.; Fan, Y.; Wu, X.; Cheng, Y.; Liu, Q.; Feng, L.; Chen, J.; Wang, Z.; Wang, X.; Yong, T.; et al. Auxin-to-gibberellin ratio as a signal for light intensity and quality in regulating soybean growth and matter partitioning. Front. Plant Sci. 2018, 9, 56. [Google Scholar] [CrossRef] [Green Version]
  4. Yi, Z.; Cui, J.; Fu, Y.; Liu, H. Effect of different light intensity on physiology, antioxidant capacity and photosynthetic characteristics on wheat seedlings under high CO2 concentration in a closed artificial ecosystem. Photosynth. Res. 2020, 144, 23–34. [Google Scholar] [CrossRef]
  5. Lu, T.; Yu, H.; Li, Q.; Chai, L.; Jiang, W. Improving plant growth and alleviating photosynthetic inhibition and oxidative stress from low-light stress with exogenous GR24 in tomato (Solanum lycopersicum l.) seedlings. Front. Plant Sci. 2019, 10, 490. [Google Scholar] [CrossRef]
  6. Zhu, H.; Li, X.; Zhai, W.; Liu, Y.; Gao, Q.; Liu, J.; Ren, L.; Chen, H.; Zhu, Y. Effects of low light on photosynthetic properties, antioxidant enzyme activity, and anthocyanin accumulation in purple pak-choi (Brassica campestris ssp. Chinensis Makino). PLoS ONE 2017, 12, e0179305. [Google Scholar] [CrossRef]
  7. Yao, X.Y.; Liu, X.Y.; Xu, Z.G.; Jiao, X.L. Effects of light intensity on leaf microstructure and growth of rape seedlings cultivated under a combination of red and blue LEDs. J. Integr. Agric. 2017, 16, 97–105. [Google Scholar] [CrossRef]
  8. Yuan, X.Y.; Zhang, L.G.; Huang, L.; Qi, X.; Wen, Y.Y.; Dong, S.Q.; Song, X.E.; Wang, H.F.; Guo, P.Y. Photosynthetic and physiological responses of foxtail millet (Setaria italica L.) to low-light stress during grain-filling stage. Photosynthetica 2017, 55, 491–500. [Google Scholar] [CrossRef]
  9. Feng, L.; Raza, M.A.; Li, Z.; Chen, Y.; Khalid, M.H.; Du, J.; Liu, W.; Wu, X.; Song, C.; Yu, L.; et al. The influence of light intensity and leaf movement on photosynthesis characteristics and carbon balance of Soybean. Front. Plant Sci. 2019, 9, 1952. [Google Scholar] [CrossRef] [PubMed]
  10. Yang, H.; Dong, B.; Wang, Y.; Qiao, Y.; Shi, C.; Jin, L.; Liu, M. Photosynthetic base of reduced grain yield by shading stress during the early reproductive stage of two wheat cultivars. Sci. Rep. 2020, 10, 14353. [Google Scholar] [CrossRef]
  11. Haworth, M.; Marino, G.; Centritto, M. An introductory guide to gas exchange analysis of photosynthesis and its application to plant phenotyping and precision irrigation to enhance water use efficiency. J. Water Clim. Chang. 2018, 9, 786–808. [Google Scholar] [CrossRef] [Green Version]
  12. Long, S.P.; Bernacchi, C.J. Gas exchange measurements, what can they tell us about the underlying limitations to photosynthesis? Procedures and sources of error. J. Exp. Bot. 2003, 54, 2393–2401. [Google Scholar] [CrossRef] [Green Version]
  13. Sui, X.L.; Mao, S.L.; Wang, L.H.; Zhang, B.X.; Zhang, Z.X. Effect of low light on the characteristics of photosynthesis and chlorophyll a fluorescence during leaf development of sweet pepper. J. Integr. Agric. 2012, 11, 1633–1643. [Google Scholar] [CrossRef]
  14. Li, X.F.; Jin, L.; Zhu, C.Y.; Wen, Y.J.; Wang, Y. Combined stresses of light and chilling on photosynthesis of Fraxinus mandschurica seedlings in northeastern China. Photosynthetica 2018, 56, 1218–1223. [Google Scholar] [CrossRef]
  15. Kang, E.X.; Luo, J.J.; Qiu, H.Z.; Chen, N.L.; Su, D.; He, B.L. Effects of low temperature and light stress on gas exchange and chlorophyll fluorescence of pumpkin seedlings. Adv. Mater. Res. 2012, 450–451, 537–542. [Google Scholar] [CrossRef]
  16. Sun, J.L.; Sui, X.L.; Huang, H.Y.; Wang, S.H.; Wei, Y.X.; Zhang, Z.X. Low light stress down-regulated rubisco gene expression and photosynthetic capacity during cucumber (Cucumis sativus L.) leaf development. J. Integr. Agric. 2014, 13, 997–1007. [Google Scholar] [CrossRef] [Green Version]
  17. Sekhar, S.; Panda, D.; Kumar, J.; Mohanty, N.; Biswal, M.; Baig, M.J.; Kumar, A.; Umakanta, N.; Samantaray, S.; Pradhan, S.K.; et al. Comparative transcriptome profiling of low light tolerant and sensitive rice varieties induced by low light stress at active tillering stage. Sci. Rep. 2019, 9, 5753. [Google Scholar] [CrossRef]
  18. Ma, Q.; Cao, X.; Wu, L.; Mi, W.; Feng, Y. Light intensity affects the uptake and metabolism of glycine by pakchoi (Brassica chinensis L.). Sci. Rep. 2016, 6, 21200. [Google Scholar] [CrossRef] [Green Version]
  19. Borges, A.; Morejón, R.; Izquierdo, A.; Monzón, L.; Ortega, E.; Rodés, R. Nitrogen fertilization for optimizing the quality and yield of shade grown cuban cigar tobacco: Required nitrogen amounts, application schedules, adequate leaf nitrogen levels, and early season diagnostic tests. Beitr. Tab. Int./Contrib. Tob. Res. 2012, 25, 336–349. [Google Scholar] [CrossRef] [Green Version]
  20. Valencia, E.; Quero, J.L.; Maestre, F.T. Functional leaf and size traits determine the photosynthetic response of 10 dryland species to warming. J. Plant Ecol. 2016, 9, 773–783. [Google Scholar] [CrossRef] [Green Version]
  21. Hou, W.; Tränkner, M.; Lu, J.; Yan, J.; Huang, S.; Ren, T.; Cong, R.; Li, X. Diagnosis of nitrogen nutrition in rice leaves influenced by potassium levels. Front. Plant Sci. 2020, 11, 165. [Google Scholar] [CrossRef] [Green Version]
  22. Pauli, D.; White, J.W.; Andrade-Sanchez, P.; Conley, M.M.; Heun, J.; Thorp, K.R.; French, A.N.; Hunsaker, D.J.; Carmo-Silva, E.; Wang, G.; et al. Investigation of the influence of leaf thickness on canopy reflectance and physiological traits in upland and pima cotton populations. Front. Plant Sci. 2017, 8, 1405. [Google Scholar] [CrossRef] [PubMed] [Green Version]
  23. Fan, Y.; Chen, J.; Cheng, Y.; Raza, M.A.; Wu, X.; Wang, Z.; Liu, Q.; Wang, R.; Wang, X.; Yong, T.; et al. Effect of shading and light recovery on the growth, leaf structure, and photosynthetic performance of soybean in a maize-soybean relay-strip intercropping system. PLoS ONE 2018, 13, e0198159. [Google Scholar] [CrossRef] [PubMed]
  24. Khan, R.; Ma, X.; Shah, S.; Wu, X.; Shaheen, A.; Xiao, L.; Wu, Y.; Wang, S. Drought-hardening improves drought tolerance in nicotiana tabacum at physiological, biochemical, and molecular levels. BMC Plant Biol. 2020, 20, 486. [Google Scholar] [CrossRef]
  25. Gao, S.; Yan, Q.; Chen, L.; Song, Y.; Li, J.; Fu, C.; Dong, M. Effects of ploidy level and haplotype on variation of photosynthetic traits: Novel evidence from two Fragaria species. PLoS ONE 2017, 12, e0179899. [Google Scholar] [CrossRef] [PubMed] [Green Version]
  26. Livak, K.J.; Schmittgen, T.D. Analysis of relative gene expression data using real-time quantitative PCR and the 2-ΔΔCT method. Methods 2001, 25, 402–408. [Google Scholar] [CrossRef]
  27. Zervoudakis, G.; Salahas, G.; Kaspiris, G.; Konstantopoulou, E. Influence of light intensity on growth and physiological characteristics of common sage (Salvia officinalis L.). Braz. Arch. Biol. Technol. 2012, 55, 89–95. [Google Scholar] [CrossRef]
  28. Senevirathna, A.M.W.K.; Stirling, C.M.; Rodrigo, V.H.L. Growth, photosynthetic performance and shade adaptation of rubber (Hevea brasiliensis) grown in natural shade. Tree Physiol. 2003, 23, 705–712. [Google Scholar] [CrossRef] [Green Version]
  29. Weraduwage, S.M.; Chen, J.; Anozie, F.C.; Morales, A.; Weise, S.E.; Sharkey, T.D. The relationship between leaf area growth and biomass accumulation in Arabidopsis thaliana. Front. Plant Sci. 2015, 6, 167. [Google Scholar] [CrossRef] [Green Version]
  30. Bai, Z.; Mao, S.; Han, Y.; Feng, L.; Wang, G.; Yang, B.; Zhi, X.; Fan, Z.; Lei, Y.; Du, W.; et al. Study on light interception and biomass production of different cotton cultivars. PLoS ONE 2016, 11, e0156335. [Google Scholar] [CrossRef]
  31. Evans, J.R.; Poorter, H. Photosynthetic acclimation of plants to growth irradiance: The relative importance of specific leaf area and nitrogen partitioning in maximizing carbon gain. Plant Cell Environ. 2001, 24, 755–767. [Google Scholar] [CrossRef]
  32. Baird, A.S.; Anderegg, L.D.L.; Lacey, M.E.; Hillerislambers, J.; Van Volkenburgh, E. Comparative leaf growth strategies in response to low-water and low-light availability: Variation in leaf physiology underlies variation in leaf mass per area in Populus tremuloides. Tree Physiol. 2017, 37, 1140–1150. [Google Scholar] [CrossRef] [PubMed] [Green Version]
  33. Carneiro, I.C.S.; Pereira, E.G.; Souza, J.P. Combined effects of low light and water stress on Jatropha curcas L. promotes shoot growth and morphological adjustment. Acta Bot. Bras. 2015, 29, 467–472. [Google Scholar] [CrossRef]
  34. Valio, I.F.M. Effects of shading and removal of plant parts on growth of Trema micrantha seedlings. Tree Physiol. 2001, 21, 65–70. [Google Scholar] [CrossRef] [Green Version]
  35. Li, Y.; He, N.; Hou, J.; Xu, L.; Liu, C.; Zhang, J.; Wang, Q.; Zhang, X.; Wu, X. Factors influencing leaf chlorophyll content in natural forests at the biome scale. Front. Ecol. Evol. 2018, 6, 64. [Google Scholar] [CrossRef] [Green Version]
  36. Dai, Y.; Shen, Z.; Liu, Y.; Wang, L.; Hannaway, D.; Lu, H. Effects of shade treatments on the photosynthetic capacity, chlorophyll fluorescence, and chlorophyll content of Tetrastigma hemsleyanum Diels et Gilg. Environ. Exp. Bot. 2009, 65, 177–182. [Google Scholar] [CrossRef]
  37. Baker, N.R.; Rosenqvist, E. Applications of chlorophyll fluorescence can improve crop production strategies: An examination of future possibilities. J. Exp. Bot. 2004, 55, 1607–1621. [Google Scholar] [CrossRef] [Green Version]
  38. Guidi, L.; Lo Piccolo, E.; Landi, M. Chlorophyll fluorescence, photoinhibition and abiotic stress: Does it make any difference the fact to be a C3 or C4 species? Front. Plant Sci. 2019, 10, 174. [Google Scholar] [CrossRef] [PubMed]
  39. Maxwell, K.; Johnson, G.N. Chlorophyll fluorescence—A practical guide. J. Exp. Bot. 2000, 51, 659–668. [Google Scholar] [CrossRef]
  40. Lichtenthaler, H.K.; Babani, F.; Langsdorf, G. Chlorophyll fluorescence imaging of photosynthetic activity in sun and shade leaves of trees. Photosynth. Res. 2007, 93, 235–244. [Google Scholar] [CrossRef] [PubMed]
  41. Ptushenko, V.V.; Ptushenko, O.S.; Tikhonov, A.N. Chlorophyll fluorescence induction, chlorophyll content, and chromaticity characteristics of leaves as indicators of photosynthetic apparatus senescence in arboreous plants. Biochemistry (Moscow) 2014, 79, 260–272. [Google Scholar] [CrossRef]
  42. Lichtenthaler, H.K.; Buschmann, C.; Knapp, M. How to correctly determine the different chlorophyll fluorescence parameters and the chlorophyll fluorescence decrease ratio RFd of leaves with the PAM fluorometer. Photosynthetica 2005, 43, 379–393. [Google Scholar] [CrossRef]
  43. Adhikari, N.D.; Simko, I.; Mou, B. Phenomic and physiological analysis of salinity effects on lettuce. Sensors 2019, 19, 4814. [Google Scholar] [CrossRef] [Green Version]
  44. Chen, J.; Burke, J.J.; Xin, Z. Chlorophyll fluorescence analysis revealed essential roles of FtsH11 protease in regulation of the adaptive responses of photosynthetic systems to high temperature. BMC Plant Biol. 2018, 18, 11. [Google Scholar] [CrossRef] [PubMed] [Green Version]
  45. Shao, Q.; Wang, H.; Guo, H.; Zhou, A.; Huang, Y.; Sun, Y.; Li, M. Effects of shade treatments on photosynthetic characteristics, chloroplast ultrastructure, and physiology of Anoectochilus roxburghii. PLoS ONE 2014, 9, e85996. [Google Scholar] [CrossRef]
  46. Guo, H.X.; Liu, W.Q.; Shi, Y.C. Effects of different nitrogen forms on photosynthetic rate and the chlorophyll fluorescence induction kinetics of flue-cured tobacco. Photosynthetica 2006, 44, 140–142. [Google Scholar] [CrossRef]
  47. Yao, J.; Sun, D.; Cen, H.; Xu, H.; Weng, H.; Yuan, F.; He, Y. Phenotyping of arabidopsis drought stress response using kinetic chlorophyll fluorescence and multicolor fluorescence imaging. Front. Plant Sci. 2018, 9, 603. [Google Scholar] [CrossRef]
  48. Khan, R.; Zhou, P.; Ma, X.; Zhou, L.; Wu, Y.; Ullah, Z.; Wang, S. Transcriptome profiling, biochemical and physiological analyses provide new insights towards drought tolerance in nicotiana tabacum l. Genes 2019, 10, 1041. [Google Scholar] [CrossRef] [Green Version]
  49. Heschel, M.S.; Stinchcombe, J.R.; Holsinger, K.E.; Schmitt, J. Natural selection on light response curve parameters in the herbaceous annual, Impatiens capensis. Oecologia 2004, 139, 487–494. [Google Scholar] [CrossRef]
  50. Brooks, J.R.; Sprugel, D.G.; Hinckley, T.M. The effects of light acclimation during and after foliage expansion on photosynthesis of Abies amabilis foliage within the canopy. Oecologia 1996, 107, 21–32. [Google Scholar] [CrossRef]
  51. Davies, S.J. Photosynthesis of nine pioneer Macaranga species from Borneo in relation to life history. Ecology 1998, 79, 2292–2308. [Google Scholar] [CrossRef] [Green Version]
  52. Li, Q.; Deng, M.; Xiong, Y.; Coombes, A.; Zhao, W. Morphological and photosynthetic response to high and low irradiance of aeschynanthus longicaulis. Sci. World J. 2014, 2014, 347461. [Google Scholar] [CrossRef] [Green Version]
  53. Dias-Filho, M.B. Photosynthetic light response of the C4 grasses Brachiaria brizantha and B. humidicola under shade. Sci. Agric. 2002, 59, 65–68. [Google Scholar] [CrossRef] [Green Version]
  54. Jansson, S.; Pichersky, E.; Bassi, R.; Beverley, R.; Ikeuchi, M.; Melis, A.; Simpson, D.J.; Spangfort, M.; Staehelin, L.A.; Thornber, J.P. A Nomenclature for the genes encoding the chlorophyll a/b-binding proteins of higher plants. Plant Mol. Biol. Rep. 1992, 10, 242–253. [Google Scholar] [CrossRef]
  55. Tian, T.; Qiao, G.; Wen, Z.; Deng, B.; Qiu, Z.; Hong, Y.; Wen, X. Comparative transcriptome analysis reveals the molecular regulation underlying the adaptive mechanism of cherry (Cerasus pseudocerasus Lindl.) to shelter covering. BMC Plant Biol. 2020, 20, 27. [Google Scholar] [CrossRef] [Green Version]
  56. Sasi, S.; Venkatesh, J.; Daneshi, R.F.; Gururani, M.A. Photosystem ii extrinsic proteins and their putative role in abiotic stress tolerance in higher plants. Plants 2018, 7, 100. [Google Scholar] [CrossRef] [Green Version]
  57. Ifuku, K.; Nakatsu, T.; Shimamoto, R.; Yamamoto, Y.; Ishihara, S.; Kato, H.; Sato, F. Structure and function of the PsbP protein of Photosystem II from higher plants. Photosynth. Res. 2005, 84, 251–255. [Google Scholar] [CrossRef] [PubMed]
  58. Murata, N.; Takahashi, S.; Nishiyama, Y.; Allakhverdiev, S.I. Photoinhibition of photosystem II under environmental stress. Biochim. Biophys. Acta-Bioenerg. 2007, 1767, 414–421. [Google Scholar] [CrossRef] [Green Version]
  59. Alyammahi, O.; Gururani, M.A. Chlorophyll a fluorescence analysis reveals differential response of photosynthetic machinery in melatonin treated oat plants exposed to osmotic stress. Agronomy 2020, 10, 1520. [Google Scholar] [CrossRef]
  60. Wang, Y.; Wei, S.; Wang, J.; Su, X.; Suo, B.; Qin, F.; Zhao, H. Exogenous application of 5-aminolevulinic acid on wheat seedlings under drought stress enhances the transcription of psbA and psbD genes and improves photosynthesis. Rev. Bras. Bot. 2018, 41, 275–285. [Google Scholar] [CrossRef]
  61. Daszkowska-Golec, A.; Collin, A.; Sitko, K.; Janiak, A.; Kalaji, H.M.; Szarejko, I. Genetic and physiological dissection of photosynthesis in barley exposed to drought stress. Int. J. Mol. Sci. 2019, 20, 6341. [Google Scholar] [CrossRef] [PubMed] [Green Version]
  62. Kumar, M.; Padula, M.P.; Davey, P.; Pernice, M.; Jiang, Z.; Sablok, G.; Contreras-Porcia, L.; Ralph, P.J. Proteome analysis reveals extensive light stress-response reprogramming in the seagrass Zostera muelleri (alismatales, zosteraceae) metabolism. Front. Plant Sci. 2017, 7, 2023. [Google Scholar] [CrossRef] [PubMed] [Green Version]
  63. Ishihara, S.; Takabayashi, A.; Ido, K.; Endo, T.; Ifuku, K.; Sato, F. Distinct functions for the two PsbP-like proteins PPL1 and PPL2 in the chloroplast thylakoid lumen of Arabidopsis. Plant Physiol. 2007, 145, 668–679. [Google Scholar] [CrossRef] [PubMed] [Green Version]
  64. Van Thor, J.J.; Hellingwerf, K.J.; Matthijs, H.C.P. Characterization and transcriptional regulation of the synechocystis PCC 6803 petH gene, encoding ferredoxin-NADP+ oxidoreductase: Involvement of a novel type of divergent operator. Plant Mol. Biol. 1998, 36, 353–363. [Google Scholar] [CrossRef] [PubMed]
  65. Song, A.; Li, P.; Fan, F.; Li, Z.; Liang, Y. The effect of silicon on photosynthesis and expression of its relevant genes in rice (Oryza sativa L.) under high-zinc stress. PLoS ONE 2014, 9, e113782. [Google Scholar] [CrossRef] [PubMed]
  66. Andersson, I.; Backlund, A. Structure and function of Rubisco. Plant Physiol. Biochem. 2008, 46, 275–291. [Google Scholar] [CrossRef]
  67. Gruber, A.V.; Feiz, L. Rubisco assembly in the chloroplast. Front. Mol. Biosci. 2018, 5, 24. [Google Scholar] [CrossRef]
  68. Chen, Y.; Wang, B.; Chen, J.; Wang, X.; Wang, R.; Peng, S.; Chen, L.; Ma, L.; Luo, J. Identification of rubisco rbcL and rbcS in Camellia oleifera and their potential as molecular markers for selection of high tea oil cultivars. Front. Plant Sci. 2015, 6, 189. [Google Scholar] [CrossRef] [Green Version]
Figure 1. This schematic flow shows the arrangement of the experiment. The cigar tobacco seedlings are grown under normal conditions and then subjected to different light intensities. The seedlings are kept for ten days under different light intensities. The different light intensities are 200 μmol m2 s1, 100 μmol m2 s1, and 50 μmol m2 s1.
Agriculture 11 00755 g001
Figure 2. Effect of different light intensities on plant dry weight (A), leaf area (B), specific leaf area (C), and specific leaf weight (D). The error bars on the mean values are ± SE (standard error). A column with different letters denotes significant differences using the LSD test at p < 0.05. T200 stands for the seedlings under a light intensity of 200 μmol m2 s1; T100 stands for the seedlings under a light intensity of 100 μmol m2 s1; and T50 stands for the seedlings under a light intensity of 50 μmol m2 s1.
Agriculture 11 00755 g002
Figure 3. Effect of different light intensities on chlorophyll a content (A), chlorophyll b content (B), chlorophyll a + b content (C), and chlorophyll a/b (ratio) (D). The error bar on each mean value column is ± SE. Lowercase letters on each column present significant differences using the LSD test at p < 0.05. T200 denotes 200 μmol m2 s1 of light intensity; T100 denotes 100 μmol m2 s1 light intensity; and T50 denotes 50 μmol m2 s1 of light intensity.
Agriculture 11 00755 g003
Figure 4. Effect of different light intensities on QY_Lss (A), qP_Lss (B), Fv/Fm_Lss (C), Rfd_Lss (D), NPQ_Lss (E), and qN_Lss (F). The values are expressed as mean ± SE. The lowercase letters on each column show significant differences at p < 0.05 using the LSD test. T200 symbolizes the seedlings under a light intensity of 200 μmol m2 s1; T100 symbolizes the seedlings under a light intensity of 100 μmol m2 s1; and T50 symbolizes the seedlings under a light intensity of 50 μmol m2 s1.
Agriculture 11 00755 g004
Figure 5. Representative chlorophyll fluorescence images show spatial heterogeneity. QY_Lss (PSII quantum yield), qP_Lss (open reaction centers), Rfd_Lss (fluorescence decline ratio), NPQ_Lss (non-photochemical quenching), and qN_Lss (non-photochemical quenching coefficient) of cigar tobacco seedlings under different light intensities. T200 represents the light intensity of 200 μmol m2 s1; T100 represents the light intensity of 100 μmol m2 s1; and T50 represents the light intensity of 50 μmol m2 s1.
Agriculture 11 00755 g005
Figure 6. The light response curve of cigar tobacco seedlings under different light intensities (A). The characteristics of the light-response curve such as apparent quantum efficiency (B), net photosynthesis rate (C), light saturation points (D), light compensation points (E), and dark respiration (F) are presented as means ± SE. The lowercase letters on each column show significant differences at p < 0.05 using the LSD test. T200 symbolizes the seedlings under a light intensity of 200 μmol m2 s1; T100 symbolizes the seedlings under a light intensity of 100 μmol m2 s1; and T50 symbolizes the seedlings under a light intensity of 50 μmol m2 s1.
Agriculture 11 00755 g006
Figure 7. Effect of different light intensities on photosynthesis-related gene expression. The different light intensities make differential changes in the transcript levels of Lhcb4.2 (A), Lhcb6 (B), PsbA (C), PsbB (D), PsbD (E), PsbP (F), petH (G), and rbcs (H) genes. The error bar on each mean value column is ± SE. T200 represents the light intensity of 200 μmol m2 s1; T100 represents the light intensity of 100 μmol m2 s1; and T50 represents the light intensity of 50 μmol m2 s1.
Agriculture 11 00755 g007
Table 1. Gene-specific primers list for qRT-PCR.
Gene NameForward Primer (5′–3′)Reverse Primer (5′–3′)
Lhcb4.2GATCTGGATTGAGGTCCTTGTTAGAATGATCCACCAGGGTAAAG
Lhcb6CTTCACTGGAGAACAGGGTTACGTCTCTCAAGCTTCTCTGTGTC
PsbAAGGTATCAGCACTATGGCTTTCACCAAGGTTAGCACGGTTAAT
PsbBCCGCCACAACGTCTATACAATTGCCGAACCATACCACATAG
PsbDGCTTTGCTATGCGCCATTCCTTCGGCTTGAGTTGGGTTA
PsbPCAGTTGATCACAGCCACAGTATTTAGCTCCCTTGAACCATCTC
petHAAGCAGCACCATCGAGAAAGTATGGTTCCTTGGGCTTGTA
rbcsGCTAACATGGTTGCACCTTTCCTGCATGCATTGCACTCTTC
ActinCAAGGAAATCACCGCTTTGGAAGGGATGCGAGGATGGA
Publisher’s Note: MDPI stays neutral with regard to jurisdictional claims in published maps and institutional affiliations.

