Article

Productivity and Efficiency in European Milk Production: Can We Observe the Effects of Abolishing Milk Quotas?

by
Lukáš Čechura
*,
Zdeňka Žáková Kroupová
and
Irena Benešová
Department of Economics, Faculty of Economics and Management, Czech University of Life Sciences Prague, Kamýcká 129, 16500 Prague, Czech Republic
*
Author to whom correspondence should be addressed.
Agriculture 2021, 11(9), 835; https://doi.org/10.3390/agriculture11090835
Submission received: 30 July 2021 / Revised: 26 August 2021 / Accepted: 27 August 2021 / Published: 31 August 2021

Abstract

:
The study aims to explore the sources of competitiveness of dairy producers before and after the abolition of milk quotas in selected EU member states. The investigation is based on the stochastic frontier modelling of an input distance function in the specification of the four-error-component model. The model is estimated with a multistep procedure employing the generalized method of moments estimator, addressing the potential endogeneity of netputs, and panel data gained from the FADN database. The results revealed that total factor productivity experienced an increasing trend in the majority of the analysed countries. Since the main driver of productivity growth was found to be the scale effect, our findings support the hypothesis that abolishing milk quotas has a positive effect.

1. Introduction

The dairy sector, which is one of the major contributors to the agricultural economy in the European Union (EU), was strongly affected for 30 years by milk production quotas. This iconic instrument of the Common Agricultural Policy (CAP) was implemented in 1984 in the face of milk overproduction resulting from milk price support. The milk quota regime restricted the amount of milk to be produced by each member state and, consequently, by individual dairy farms based on reference volumes from 1983, with the aim of stabilizing milk prices and producer incomes and reducing the European budget for market support [1]. Since its introduction, the milk quota has become a scarce factor that allows for profitable dairy producer prices and maintaining dairy production for less competitive regions and farmers [2]. This instrument was designed to deal with internal problems and did not have any impact on international trade [3].
The non-tradable quota has been criticised not just for its negative welfare effect due to price distortion but also because it leads to a lower average productivity level [4]. Therefore, the deregulation of the milk quota allocation would lead to increasing dairy farm efficiency over time [5]; however, Bouamra-Mechemache et al. [6] pointed out that this would be possible only with substantial liberalization of trade.
The CAP development resulting from pressure from the World Trade Organisation to liberalize the dairy market, as well as from the maintenance of inefficient dairy producers, led to the Luxembourg reform of 2003, which introduced gradual increases in milk quotas until 2013 [1,7]. The liberalization of the dairy market was completed by the revision of the 2003 reform framework (“Health Check”) in 2008, which endorsed the abolition of milk quotas by April 2015 after a “soft landing”, i.e., a 1% annual increase in milk quotas [8].
The gradual liberalization of the dairy sector, along with the price volatility during the first two decades of the 21st century, changed the whole dairy sector significantly. A government response has therefore been expected in many countries since the abolition of milk quotas. Thorsøe et al. [9] found differences in government responses, with regard to value chain organization, production factors and market orientation, to address the problem of price volatility at the national level. Fotis and Polemis [10] argue that the government (Greek) must provide incentives to attract more milk producers to increase the number of competitors within the industry.
The European dairy sector is quite heterogeneous regarding size and industrial structure and very often is located in disadvantaged regions [11]. The profitability and income levels of specialized dairy farms differ significantly, not just between member states but also within them. Poczta et al. [12] identified five types of dairy farms with regard to their size, production scale, manufacturing intensity, and profitability. They consider large- and medium-size farms with intensive production to be the most important for European milk production. The European Commission [13] explains the differences in income level of these farms using productivity, farm size, herd size, and milk production levels. This explanation omits the impact of technological changes that influence the productivity and profitability of the farms. As stated by Philippidis and Waschik [11], technological change is connected with structural change and has an effect on both the agricultural milk production sector and the dairy processing sector, in perfect competition as well as imperfect competition. Sobczyński et al. [14] consider the use of advanced technology to be a key factor in achieving a higher yield per cow in a chosen region of Poland, and, according to Žáková Kroupová et al. [15], it influences the total factor productivity change.
According to Eurostat [
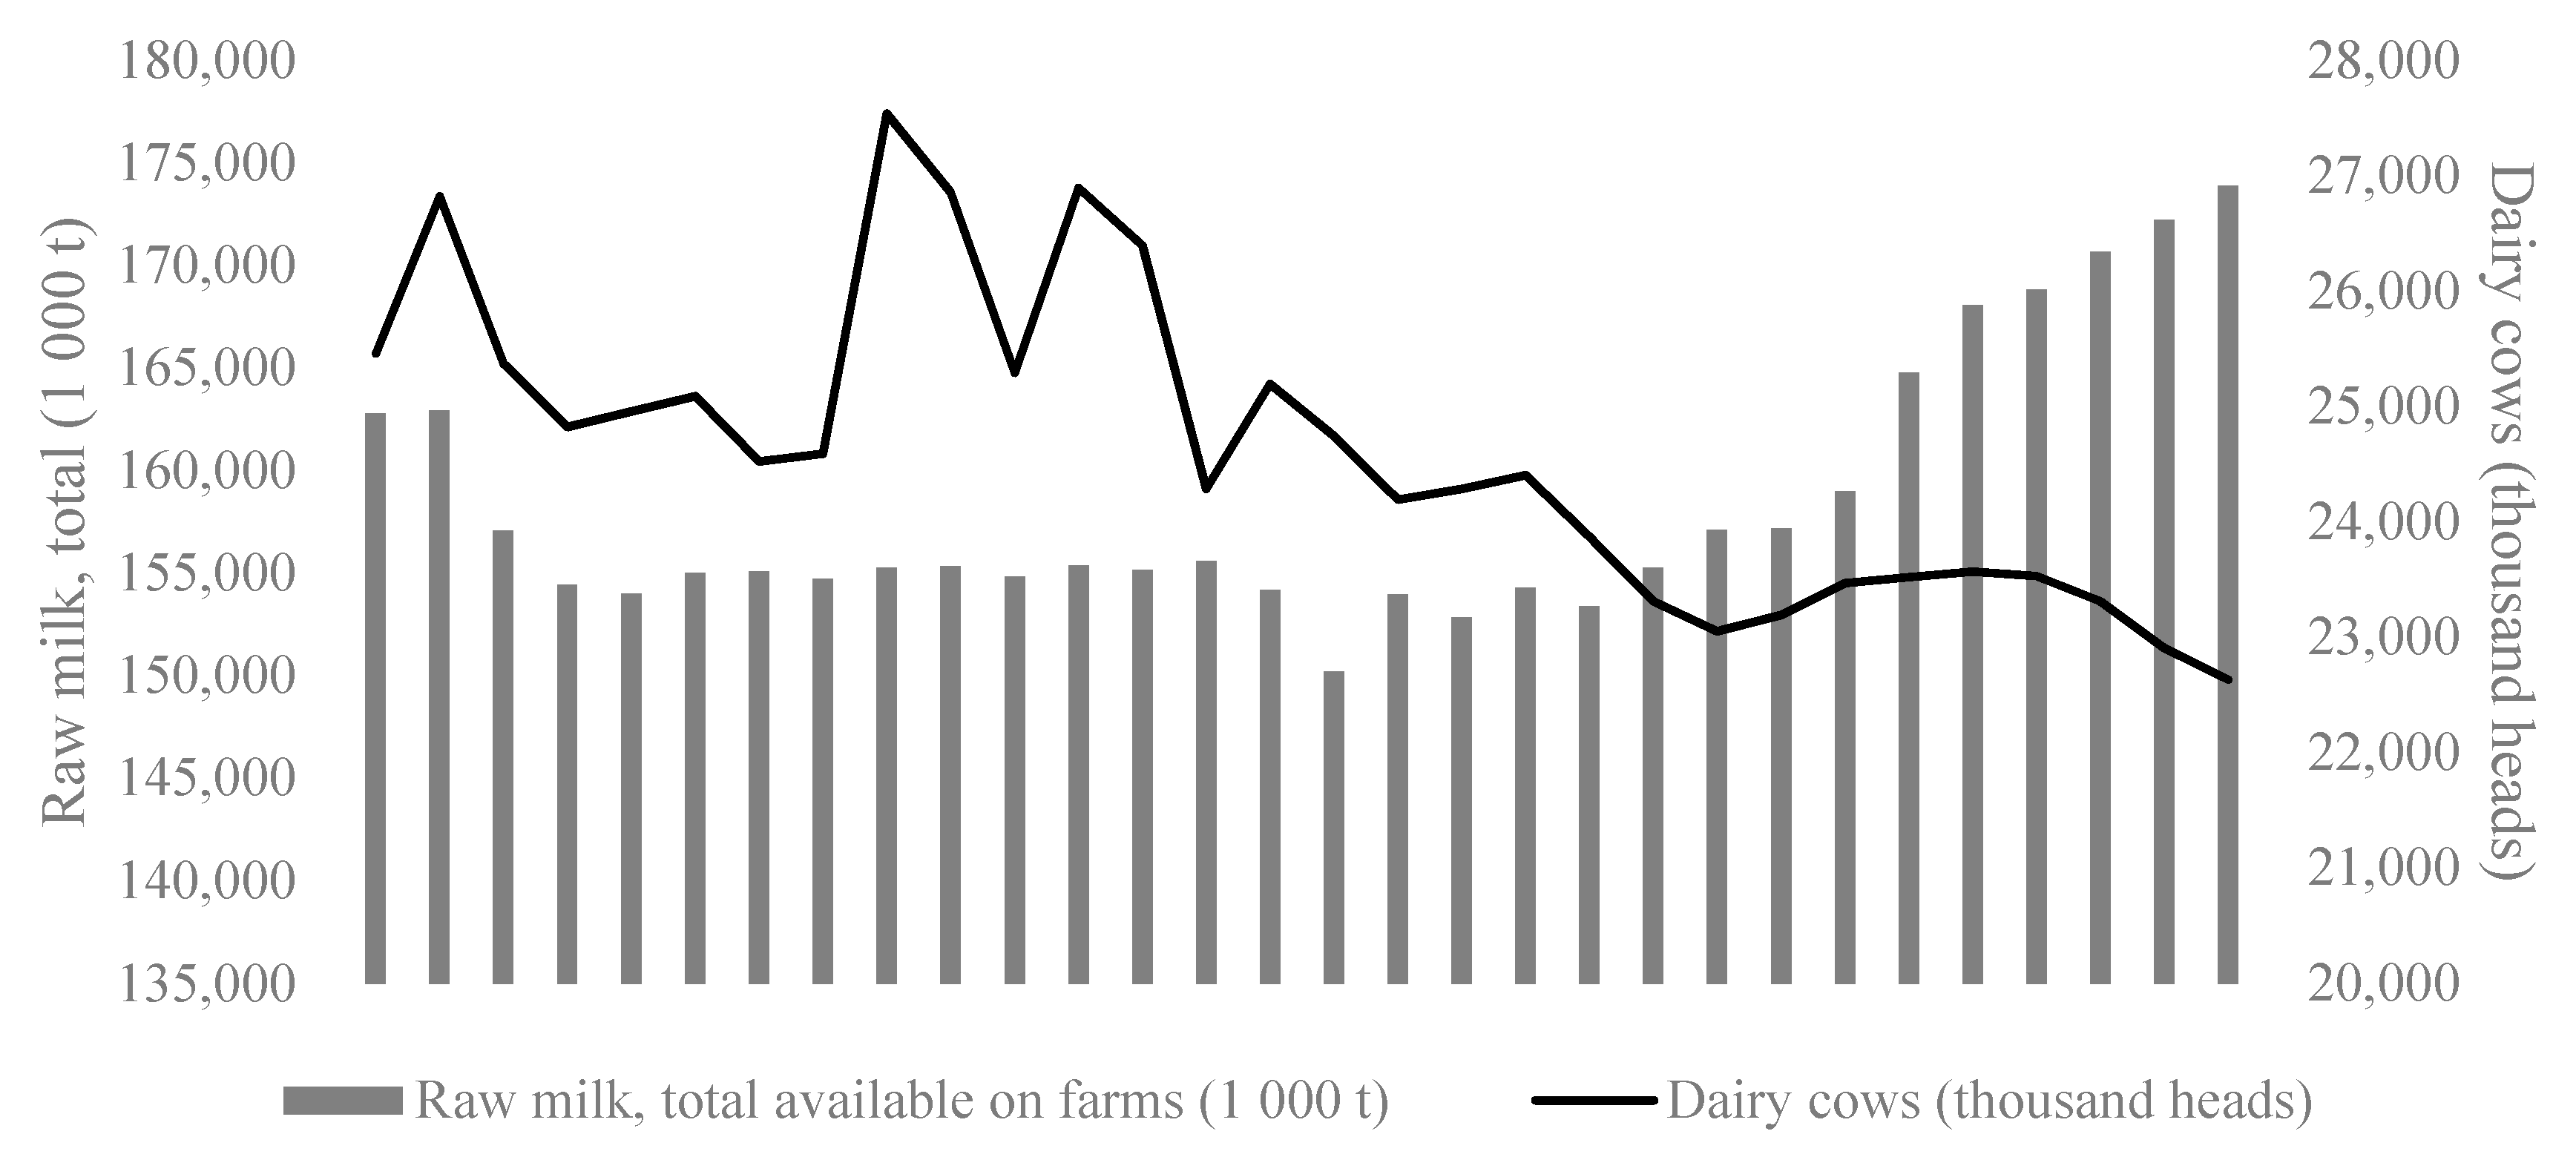
16], the development of the European dairy sector can be characterized by a considerable decrease in the number of agricultural holdings and an increase in the dairy sector, as well as a decrease in dairy cows under the period of the quota regime. Figure 1 illustrates the decreasing number of dairy cows in the European Union. It is evident that during the last two decades, the number of dairy cows has been gradually decreasing. This situation does not have an effect on the production of raw milk, which has witnessed the opposite trend.
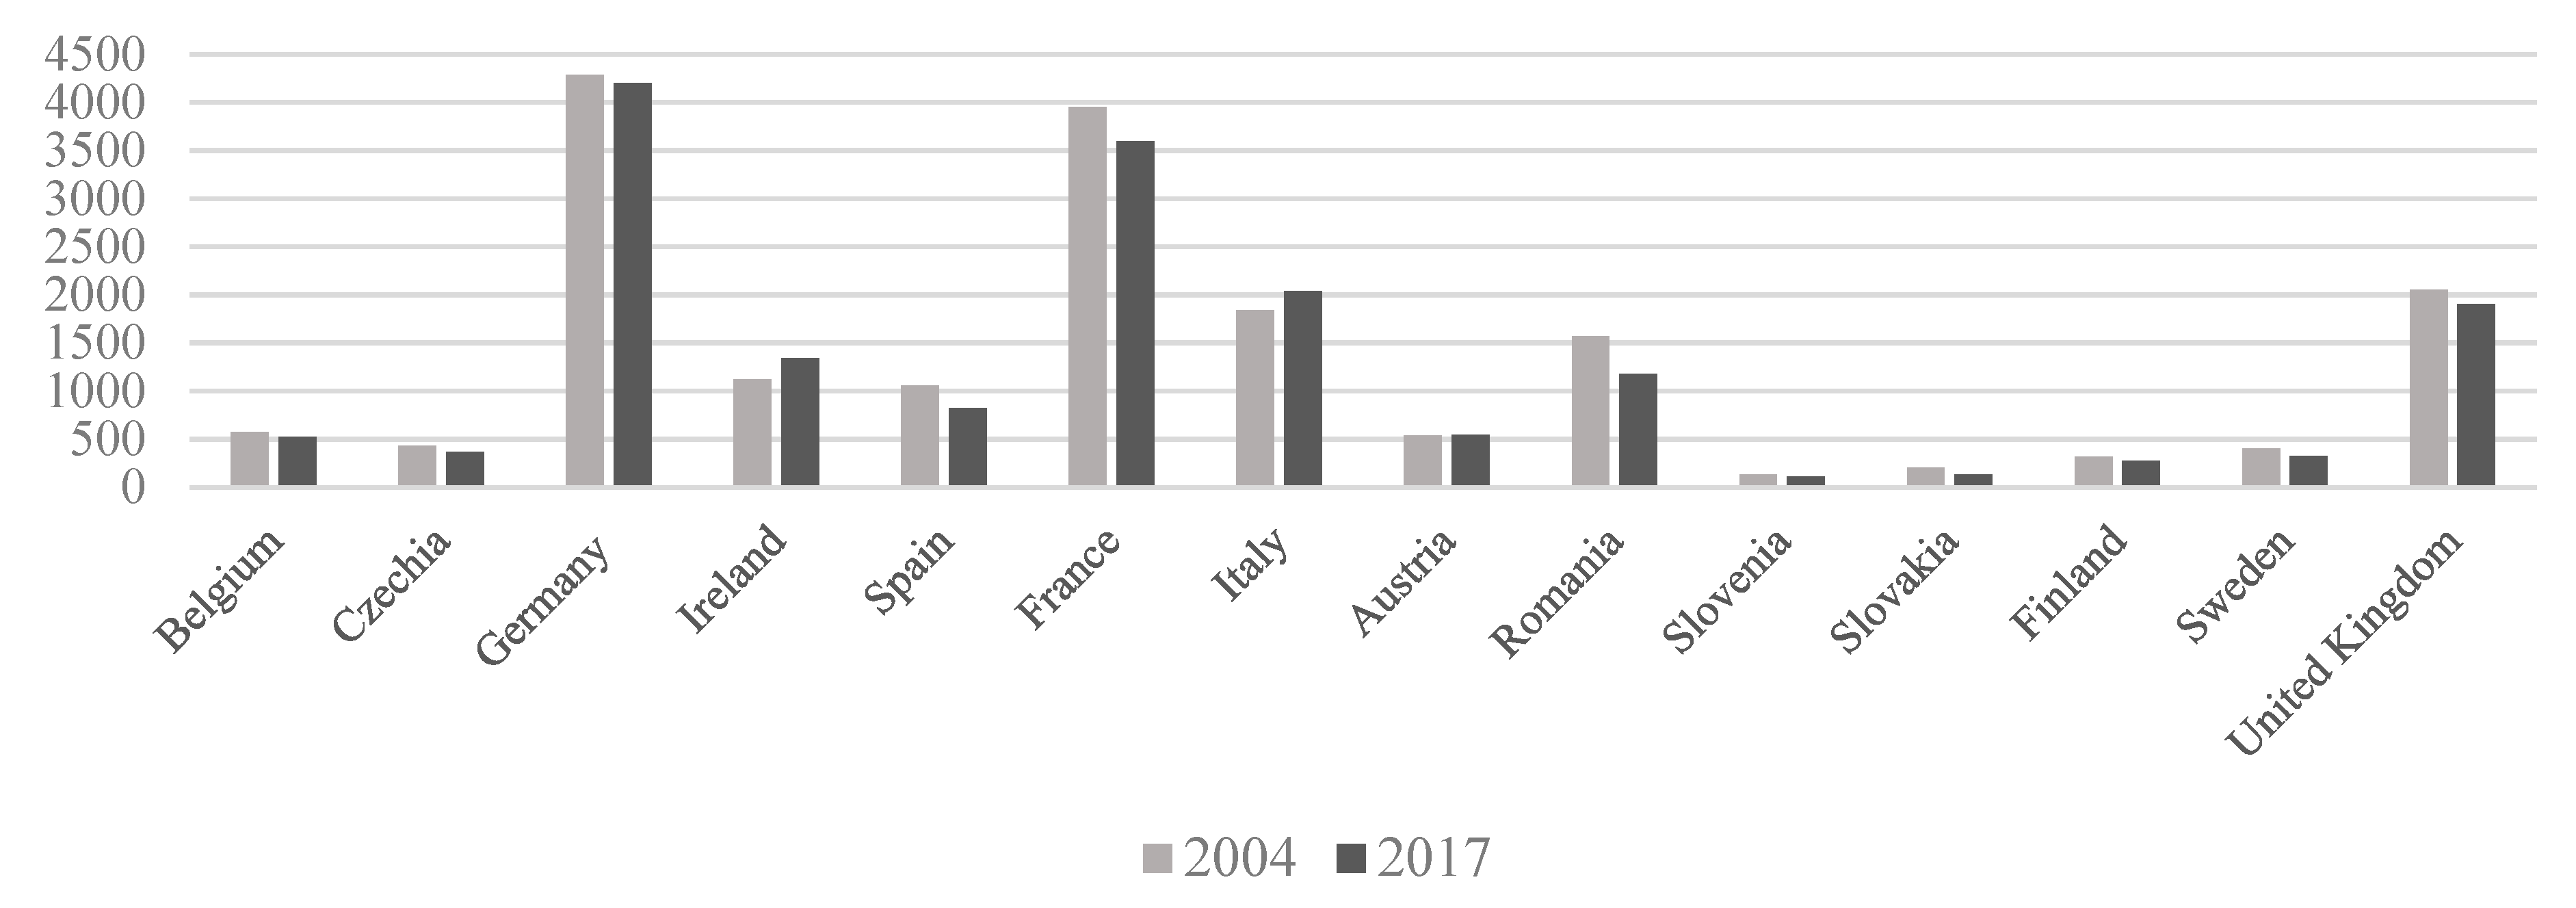
Within this timeframe, the EU-10 member states, in particular, showed a reduction of 81% in the number of farms with dairy cows and of 38% in the number of dairy cows. However, a decrease can be observed in the whole EU-28. Despite this considerable decrease in the dairy cow herd, the level of milk production was quite stable in the first two decades and has increased in recent decades. The same patterns can be observed in Figure 2 and Figure 3 for countries selected for our empirical analysis. These figures suggest that the abolition of milk quotas might have a positive effect on milk yield. However, milk yield is only a partial measure of productivity and does not consider other production factors, as is the case for total factor productivity.
Philippidis and Waschik [11] expect another expansion of milk production under the quota abolition, either on perfectly competitive models or imperfect competition model variants, especially in Belgium and the Netherlands. Klootwijk et al. [17] add that quota abolition led to an increase in the number of cows, and in farm intensity in terms of milk per hectare, by about 4% on Dutch farms. Oudendag et al. [18] expect a small increase in large dairy farms in the Netherlands. The limiting factor for future increases is the phosphate quota, which is comparable to the dairy quota [4,17,19].
The removal of milk quotas significantly changed the dairy business environment. Dairy farmers have started to face considerable milk price volatility, which affects their production and investment decisions [1,20,21,22]. New business strategies have also changed the dairy sector structure (i.e., the number of farms and farm size distribution) [23]. The strategy of expanding and benefiting from economies of scale, predicted by Groeneveld et al. [20] and proved by Klopčič et al. [22], moved the structure towards large dairy farms with greater economic efficiencies and investment possibilities in animals and also brought technological improvements [20,23]. These changes in context also modified the competitiveness of dairy farms and of the dairy production of member states as a whole.
Market deregulation is generally viewed as an important external driver of productivity growth [24]. Well-functioning free markets ensure that firms that are lagging behind their competitors lose market share or are even forced to cease their market participation, freeing the resources bound by their production activity and making them available for production by more productive firms. This process contributes to more efficient production at the sector level. Market regulation, however, hinders this resource reallocation by keeping firms with low efficiency and productivity in the market [25]. This suspicion can also be applied to the case of the quota system, which affects the efficiency of firms and markets by reducing the output of farms. Technological and structural changes would be constrained, especially under a fixed-quota system, where a trading quota is not permitted [26].
Specifically, in the European dairy sector, Huettel and Jongeneel [27] revealed that the exit mobility of Dutch and German dairy farms decreased under the quota regime, indicating that possibly less efficient farms were kept in the dairy sector. As Colman [28] and Areal et al. [26] proved, this negative effect is reduced under a more flexible quota system. The tradability of quotas allows efficient firms to expand their business at the expense of inefficient firms. Gillespie et al. [29] compared Irish dairy productivity before and after milk quota restrictions using stochastic frontier analysis (SFA) on 1979–2012 data and found that milk quotas negatively affected total factor productivity. Zeng et al. [30] also evaluated the impact of eliminating EU milk quotas on the total factor productivity of Irish dairy farms. Based on 2007–2015 data, they confirmed the results of Gillespie et al. [29] and, furthermore, highlighted the heterogeneous responses of dairy farmers depending on specialization, represented by the ratio of revenue from dairy production to total farm revenue. Farmers with a relatively high revenue ratio in dairy production are thought to experience a more positive impact from milk quota elimination. Interestingly, large dairy farms that have an advantage in productivity do not benefit more from milk quota deregulation, according to the results of Zeng et al. [30]. Frick and Sauer [25] estimated the impacts of market deregulation on German dairy sector productivity during the phase-out of the milk quota based on Bavarian farm data from 2000–2014, applying linear programming and stochastic frontier approaches. According to their results, the reallocation of resources towards more productive farms increased gradually during the phase-out of the EU milk quota due to its direct as well as indirect effects. Breustedt et al. [31] also examined the effect of abolishing milk quotas on a sample of Bavarian dairy farms. Utilizing data for the financial year 2004/2005 and data envelopment analysis, they predicted that organic dairy farms would lose their competitive advantage with the deregulation of the EU’s milk market regime in 2015. Finally, Areal et al. [26], applying a Bayesian stochastic frontier analysis on English and Welsh farm data from 2000 to 2005 to investigate the relationship between milk quotas and technical efficiency, supported the idea that abolishing the milk quota leads to a more competitive market for milk, which forces the least-efficient farms to leave milk production. The abolition of a milk quota brought a high expectation for farmers [32]. Its elimination has had an effect on the whole dairy sector [33,34].
Even before the cancelation dairy quota abolishment had attracted the attention of many studies, many of them were focused just on the situations in one or two countries. It can be said that some authors predicted an increase in milk supply together with decreasing prices for producers [18,35] as well as increasing competitiveness both within states [14] and globally [36]. The dairy sector was expected to be more dynamic than before the quota elimination [37], with a strong increase in intensity for the largest farms [1,20] with ultimately a slightly positive welfare effect [38].
The majority of previous studies predicted the possible impacts of quota deregulation using data prior to the policy implementation. This study seeks to fill the gap in the literature by providing a deep insight into the sources of competitiveness of milk producers before and after the abolition of milk quotas. The aim of this study is to explore how dairy farms in selected EU member states have been adapting to the new circumstances by employing new advances in productivity and efficiency analysis.
In particular, this study provides a robust estimate of the stochastic frontier models in the form of input distance function by employing the method which controls for the potential endogeneity of netputs in the four-step estimation procedure. The main contribution of this study is the empirical application of the recently developed approaches to robust efficiency and productivity analysis of milk producers in selected countries. Moreover, it complements the literature by the prediction of the impacts of milk quotas abolition using data prior and after the market deregulation. The study finds the support for the hypothesis of the positive effects of milk quotas abolition on productivity growth through the improvements in scale efficiency, i.e., the scale of operations.
The rest of the paper is organized as follows: The next section provides an overview of our empirical model, introduces data, and describes the empirical strategy. Then, the results and discussion are presented. Our conclusions are contained in the last section of the paper.

2. Materials and Methods

2.1. Methodology Used in the Study

Productivity is commonly defined as the ratio of a volume measure of output to a volume measure of inputs used [39]. Productivity can be measured at different levels, as partial measures (e.g., labour productivity) or as a multifactor measure. The most comprehensive measure is total factor productivity (TFP), which is a ratio of aggregated outputs and inputs. This analysis measures microlevel TFP dynamics employing the Törnqvist–Theil index (TTI), which is defined as the ratio of the revenue-share-weighted geometric mean of individual outputs to the cost-share-weighted geometric mean of individual inputs [40]. According to Bokusheva and Čechura [41], the logarithmic form of TTI is given by:
ln ( T F P i t T F P i ( t 1 ) ) = 1 2 m = 1 M ( R i t , m + R i ( t 1 ) , m ) ( ln y i t , m ln y i ( t 1 ) , m ) 1 2 j = 1 J ( S i t , j + S i ( t 1 ) , j ) ( ln x i t , j ln x i ( t 1 ) , j ) ,
where R m = p m y m m = 1 M p m y m are output revenue shares and S j = w j x j j = 1 J w j x j are input cost shares.
As was shown by Diewert [42], the TTI exactly determines changes in production that result from input adjustments when the underlying production technology is described using the translog functional form. TTI can be derived as the sum of three components: scale effect (SE = ln ι i t ), technical efficiency effect (TEC = ln υ i t ), and technological change (TC = ln τ i t ) effect:
ln T F P i t = ln ι i t + ln υ i t + ln τ i t .
These components can be derived from the transformation function. In this study, we assume that the transformation process of dairy farms can be well approximated by an input-distance function (IDF) [43] in translogarithmical functional form, that is, in the case of M-outputs (y), J-inputs (x), and time (t), and being defined as:
ln D i t I = α 0 + m = 1 M α m ln y m , i t + 1 2 m = 1 M n = 1 N α m n ln y m , i t ln y n i , t + m = 1 M j = 1 J γ m j ln y m , i t ln x j , i t + j = 1 J β j ln x j , i t + 1 2 j = 1 J k = 1 K β j k ln x j , i t ln x k , i t + δ t t + 1 2 δ t t t 2 + m = 1 M δ m t ln y m , i t t + j = 1 J δ j t ln x j , i t t ,
where subscripts i, with I = 1, 2, …, N, and t, with t = 1, …, T, refer to a certain producer and time (year), respectively. α, β, γ, and δ are vectors of the parameters to be estimated.
The IDF exhibits several interesting properties [44]: symmetry, monotonicity, linear homogeneity, and concavity in inputs and quasiconcavity in outputs. The symmetry restrictions imply that β j k = β k j and α m n = α n m . The linear homogeneity of degree 1 in inputs requires: j = 1 J β j = 1 ;   j = 1 J β j k = 0 ;   j = 1 J γ m j = 0 ;   j = 1 J δ j t = 0 and is imposed by normalising all the inputs by one input [45], which allows us to rewrite the IDF as:
ln D i t I   ln x 1 i t = α 0 + m = 1 M α m ln y m , i t + 1 2 m = 1 M n = 1 N α m n ln y m , i t ln y n i , t + m = 1 M j = 2 J γ m j ln y m , i t ln x ˜ j , i t + j = 2 J β j ln x ˜ j , i t + 1 2 j = 2 J k = 2 K β j k ln x ˜ j , i t ln x ˜ k , i t + δ t t + 1 2 δ t t t 2 + m = 1 M δ m t ln y m , i t t + j = 2 J δ j t ln x ˜ j , i t t ,
where ln x ˜ j , i t = ln x j , i t ln x 1 , i t .
Furthermore, the time trend included in the IDF allows for the capture of the joint effects of embedded knowledge, technology improvements, and learning-by-doing as well as input quality improvements [46]. Here, δt and δtt capture the global effect of technological change on the IDF, while δmt and δjt measure the bias of technological change.
For interpretation of the empirical estimates, the duality between the cost and input distance functions is another important property. That is, the derivative of the input distance function with respect to a particular input is equal to the cost-deflated shadow price of that input [47], and the elasticity of the IDF with respect to the mth output is equal to the negative of the cost elasticity of that output, and, as such, it provides information about the importance of the mth output in terms of cost [48].
Moreover, the IDF provides a measure of technical efficiency since its reciprocal is equal to the Farrell [49] input-based technical efficiency: T E I = 1 D I ( y , x , t ) . The technical efficiency can be introduced in (4), incorporating the latest approach to technical efficiency investigation proposed by Kumbhakar et al. [50] and Colombi et al. [51]. These authors emphasize the importance of considering latent heterogeneity (μi), to generate an unbiased estimate of time-invariant technical inefficiency (ηi), as well as the possibility of efficiency improvement represented by transient technical efficiency (uit). Replacing ln D i t I with both inefficiency terms, that is η i + u i t = ln D i t I , and introducing a statistical error term (vit) and latent heterogeneity (μi), the IDF takes the form of a generalized true random effect model (GTRE, see [52]):
  ln x 1 i t = α 0 + m = 1 M α m ln y m , i t + 1 2 m = 1 M n = 1 N α m n ln y m , i t ln y n i , t + m = 1 M j = 2 J γ m j ln y m , i t ln x ˜ j , i t + j = 2 J β j ln x ˜ j , i t + 1 2 j = 2 J k = 2 K β j k ln x ˜ j , i t ln x ˜ k , i t + δ t t + 1 2 δ t t t 2 + m = 1 M δ m t ln y m , i t t + j = 2 J δ j t ln x ˜ j , i t t η i u i t + μ i + v i t ,
where v i t ~ N ( 0 , σ v 2 ) , u i t ~ N + ( 0 , σ u 2 ) , η i ~ N + ( 0 , σ η 2 ) , and μ i ~ N ( 0 , σ μ 2 ) .
Based on the IDF (5) estimates, the components of TTI (2) can be easily derived. According to Bokusheva and Čechura [41], the scale effect, which captures the contribution of economies of scale, is measured as the difference between two indices: the first one is measured assuming constant returns to scale and the other is calculated under the assumption of varying returns to scale. After accounting for deviations from the sample means, this results in:
ln ι i t = 1 2 m = 1 M [ ( ζ i t , m + ζ ¯ m ) ( ln y i t , m ln x m ¯ ) + ζ ¯ m ln y m ¯ ζ i t , m ln y i t , m ¯ ] ,
where ζ i t , m = ( 1 R T S 1 ) ln D I ( x i t * , y i t , t ) ln y i t , m and R T S 1 = m = 1 M ln D I ( x i t * , y i t , t ) ln y i t , m .
The technical efficiency effect, which is associated with movements towards (away from) the frontier technology, is measured as a derivation from the sample mean:
ln υ i t = ln T E i t ln T E i t ¯ ,
where T E i t = exp ( u ^ i t ) .
Similarly, the technological change component, capturing the shift of frontier, is measured as a derivation from the sample mean:
ln υ i t = φ i t φ i t ¯ ,
where φ i t = ln D I ( x i t * , y i t , t ) ln t .

2.2. Estimation Strategy

The estimation strategy involves new advances in productivity and efficiency analysis. We introduced the GTRE model, and since the endogeneity problem usually frustrates researchers in productivity analysis and leads to inconsistent estimates, we used methods which control for the potential endogeneity. In particular, we address two potential sources of endogeneity (due to the heterogeneity as well as the simultaneity of inputs with technical efficiency) by using the system generalized method of moments (GMM) estimator.
The estimation of the GTRE model is undertaken as a multistep procedure. We follow Kumbhakar et al. [43] and rewrite the model in (5) as:
  ln x 1 i t = α 0 * + m = 1 M α m s ln y m , i t + 1 2 m = 1 M n = 1 N α m n ln y m , i t ln y n i , t + m = 1 M j = 1 J γ m j ln y m , i t ln x ˜ j , i t + j = 1 J β j s ln x ˜ j , i t + 1 2 j = 1 J k = 1 K β j k ln x ˜ j , i t ln x ˜ k , i t + δ t s t + 1 2 δ t t t 2 + m = 1 M δ m t ln y m , i t t + j = 1 J δ j t ln x ˜ j , i t t + α i + ε i t ,
where α 0 * = α 0 E ( η i ) E ( u i t ) , α i = μ i ( η i E ( η i ) ) and ε i t = v i t ( u i t E ( u i t ) ) .
This specification ensures that αi and εit have zero mean and constant variance. The multistep procedure consists of four steps [41]: In step 1, the two-step system GMM estimator [53,54] is used to obtain consistent estimates of the IDF parameters. The Arellano and Bover/Blundell and Bond [53,54] approach builds a system of two equations—the original equation (in levels) and the transformed one (in differences)—and employs two types of instruments: the level instruments for the differenced equations and the lagged differences for the equations in levels [55]. The validity of these instruments is tested by the Hansen J-test [56], which analyses the joint validity of the instruments, and the Arellano-Bond [57] test is used to analyse the autocorrelation in the idiosyncratic disturbance term (vit), which could render some lags invalid as instruments. In step 2, residuals are used from the system-GMM-level equation to estimate a random effects panel model employing the generalized least squares (GLS) estimator, with the aim of obtaining the theoretical values of α i and ε i t , denoted by α ^ i and ε i t ^ . In step 3, the transient technical inefficiency, u i t , is estimated using ε i t ^ and the standard stochastic frontier technique with assumptions: v i t ~ N ( 0 , σ v 2 ) , u i t ~ N + ( 0 ,   σ u 2 ) . In step 4, the persistent technical inefficiency, η i , is estimated using α ^ i and the stochastic frontier model with the following assumptions: μ i ~ N ( 0 , σ μ 2 ) , η i ~ N + ( 0 , σ η 2 ) . The overall technical efficiency (OTE) is quantified based on Kumbhakar et al. [52]: O T E i t = exp ( η ^ i ) exp ( u ^ i t ) . All these estimates are conducted using the STATA 14.0 software.

2.3. Data Used in the Study

The analysis uses a panel data set drawn from the Farm Accountancy Data Network (FADN) database provided by the European Commission’s Directorate-General for Agriculture and Rural Development (DG AGRI) in the framework of the VALUMICS project. The database contains information on approximately 80,000 agricultural holdings across the European Union and provides harmonised microeconomic data (physical as well as financial data). Our dataset involves twelve countries (the country selection corresponds to the countries in the VALUMICS project consortium): (i) top producers—Germany, France, the United Kingdom, and Italy (according to Eurostat, cow’s milk production in these three countries represents 52% of European milk production in the analysed period); (ii) middle producers—Spain, Ireland, Romania, Belgium, and Austria (with a 16% share of the total EU production); and (iii) low producers—Czechia, Sweden, and Finland (with a 5% share of the total EU production), and covers the period from 2004 to 2017. These country samples of farms consist of specialised COP (cereals, oilseeds, and protein crops), field crops, milk, cattle, mixed crops, mixed livestock, and mixed crop and livestock farms, according to the FADN farm typology. Since not all farms in the database have complete information, observations of those farms with negative and zero values of the variables of interest are excluded from the data set. Moreover, the data set is generated by keeping in the sample only farms with at least five (three in the case of Belgium and four in the case of Ireland) consecutive years of observations. This procedure decreases the problem associated with the entry and exit of producers from the database and allows the use of the GMM estimator with a sufficient number of lagged instruments. Five consecutive observations provide more flexibility for the selection of the valid set of instruments. However, in the case of Belgium and Ireland, we have to compromise between the number of observations and the minimum requirements of the GMM estimator. The final sample size is presented in Table 1.
For the estimation of the IDF, the following vectors of outputs and inputs are defined: milk output (yM), represented by the value of milk production; other livestock production (yAOL), measured as the difference between the value of livestock output minus milk output; and other farm output (yAOO), calculated as the difference between the value of farm total output and the value of total livestock output. The vector of inputs consists of: capital (K), represented by the sum of contract work and capital depreciation; land (L), expressed in hectares of Utilised Agricultural Area (UAA); labour (W), measured in annual working units (AWU); and materials, defined as total intermediate consumption (the sum of a farm’s total crop and livestock production-specific costs and total farming overheads without contract work). Material is used to normalize the three other input variables.
Monetary variables are deflated using the price indices from the EUROSTAT database (2010 = 100). The price indices for milk output and agricultural goods output (Eurostat, 2019) are used to deflate the output variables. The price index for machinery and other equipment is used to adjust the capital input, and the price index for goods and services currently consumed in agriculture is employed to deflate materials. The sample descriptive statistics of the variables of interest are provided in Table 2.

3. Results and Discussion

3.1. Milk Production Technology

Table 3 provides estimated first-order parameters and technological change parameters of the country-specific input distance functions in translog specification, together with the Hansen’s J-test and AR(2) test statistics (full country-specific IDF estimates are available on request from the authors). The results indicate that the majority of the first-order parameters of the IDFs are statistically significant even at the 1% significance level for all the analysed countries. Moreover, Hansen’s J-test statistics and the AR(2) test confirm the validity of the GMM estimates. Equally important, the theoretical assumptions are met by the estimates for all countries because all first-order coefficients have the expected signs (αm < 0 for all outputs, βj > 0 for all inputs). This implies that the IDFs are non-increasing in outputs and non-decreasing in inputs at the sample means, since all variables in logarithm are normalized by their sample mean. These results indicate that monotonicity conditions are fulfilled at the sample mean [48]. According to Karagiannis et al. [58], any IDF is concave in inputs and quasiconcave in outputs if the Hessian matrix of the second-order IDF’s parameter derivative is negative-definite with respect to outputs and positive-definite with respect to inputs, at the point of approximation. As Čechura and Hockmann [59] noted, this is fulfilled on the sample mean if βjj + βj2 − βj ≤ 0 for all j. Since all these conditions are met, the estimated input-distance functions seem to well approximate the production behaviour of farmers in selected European countries.
As Irz and Thirtle [47] stated, the elasticity of the IDF with respect to the jth input is equal to its cost share and captures the relative importance of that input in the production process. In line with this notion, the estimated input shares reveal that the agricultural holdings under investigation use highly material-intensive production technology since material inputs play a dominant role in cost structure. This is a common feature that can be found in all the analysed countries. The share of material evaluated on sample means is between 32% in Austria and 59% in Sweden, and the cost-share of labour ranges from 18% in Ireland to 37% in Belgium. The cost-share of capital for the analysed inputs is the lowest in Czechia, Finland, Ireland, Italy, Romania, and Spain, suggesting low capital intensity in milk production.
Furthermore, the IDF estimates indicate considerable differences in output elasticities among the countries. Milk production (yM) is the most important output in the majority of the analysed countries. There are two exceptions: Czechia and Romania, where the other output (yAOO) has the highest elasticity. This reflects the fact that milk production in these countries is mainly carried out on less specialized farms. For example, in Czechia more than two thirds of milk production is produced by farms with mixed production (crops and livestock) [60].
The absolute value of the sum of output elasticities is lower than 1 in all the analysed countries. In other words, the diseconomies of scale in European milk production become apparent, as was also found by Čechura et al. [46] by applying stochastic frontier analysis on farm-level data from 2004–2011 and by Žáková Kroupová et al. [15] using SFA and regional data for the period 2004–2016. Among all the countries under consideration, the sum of the IDF elasticities with respect to outputs is the highest for Czechia and East Germany, whereas the lowest value belongs to Austria, evaluated on country sample means. Because the concept of economies of scale is very close to the concept of economies to size [61], we can conclude that Czech sample agricultural holdings and especially East German milk producers tend to be close to the optimal size. The agricultural holdings in the rest of the countries have a substantial potential to improve their productivity by changing scales of operations, since moving to a technically optimal size would bring cost savings to EU dairy producers, as noted by Žáková Kroupová et al. [15].
Technological change (estimated using a time trend as a proxy variable) is statistically significant at the 5% level in: Belgium, Czechia, Finland, West and East Germany, Ireland, Italy, Spain, and the United Kingdom (see parameter δt in Table 3). In most of these countries the results indicate technological regress (positive parameters δt). This suggests that milk producers in these countries are characterised by a cost increase over the analysed period, evaluated on sample means. The predominance of technological regress was also found by Žáková Kroupová et al. [15]. Moreover, the technological regress in Czechia, Finland, and Ireland was found to be accelerating over the analysed period at the 5% level of significance. These results indicate that Czech, Finnish, and Irish milk producers were falling behind in innovative activities, and they foreshadow a potential loss of competitiveness in milk production in these three countries.
In addition, we rejected the null hypothesis about Hicks-neutral technological change in favour of biased technological change in most of the analysed countries (at a significance level of at least 10%). However, we cannot observe any common patterns.
Land-using biased technological change was estimated for Austria, Czechia, Italy, Spain, and the United Kingdom. This suggests that farmers in these five countries underwent structural changes, such as a switch to organic farming with a higher proportion of pastoral farming or an increase in home-grown feed production. As evidenced, it can be seen that organic milk production increased three times in Czechia in the analysed period [62].
Labour-saving technological change is characteristic of East German, Irish, and Italian milk production, whereas Spanish milk producers are characterised by a labour-using biased technological change.
Finally, a capital-using biased technological change was estimated in the majority of the analysed countries, except for Austria and France, which have a capital-saving technological change. These findings are in line with our expectations about the increasing role of new technologies in production with a higher added value, and with the information, we have in the dataset and that we found in other studies. For example, Heikilä et al. [63] provide evidence that milk producers in the majority of the analysed countries invested in fixed assets, e.g., in new construction with a loose-housing system and an automatic milking system.

3.2. Technical Efficiency

The overall technical efficiency was found to be high in all analysed countries (Table 4). The only exception is the UK, with overall technical efficiency of 73%. Other countries show overall technical efficiency higher than 80%, and half of them are even higher than 90%. This suggests that inputs are efficiently exploited, and there is only a little room to reduce costs by increasing overall technical efficiency. Moreover, the density of the efficiency estimate is narrow and skewed to higher values in the majority of countries. This indicates that we cannot observe huge differences among producers in most cases and that most producers are operating near the production frontier. The exceptions are Czechia and the UK, with higher intrasectoral variability.
The decomposition of overall technical efficiency into transient and persistent parts reveals that persistent technical inefficiencies contribute to a large extent to overall technical inefficiencies. That is, transient technical efficiency has a higher mean than persistent technical efficiency. Moreover, Figure 4 show improvements in transient technical efficiency at the beginning of the analysed period for countries with considerably low efficiency as compared to other countries. During that time, the transient efficiency was in most cases around 95%, which is close to the optimal value and does not provide considerable room for improvements. The estimates of persistent technical efficiency show that there is some room for improvements. The cost reduction is up to 10% in the majority of cases and up to 21% in the UK. Since the persistent technological efficiency also has a narrow distribution, we may conclude that we cannot observe considerable systematic failures in efficiency of input use in most of the analysed countries.

3.3. Total Factor Productivity Dynamics

Table 5 provides estimates of total factor productivity (TFP) measured as a comparison of TFP in a particular year to a country sample TFP average. Moreover, we investigate TFP dynamics by considering four-year averages. The results indicate an increasing trend for TFP in most countries. The trends have a different intensity and, in addition, we can observe different variability among the countries. The results show that in each country there are farmers with a TFP that is considerably higher than the country’s average and who thus have a substantial competitive advantage. On the other hand, we can observe farmers with a low TFP who might not be able to keep pace with competitors and who are expected to fall more and more behind.
Belgium, Czechia, Germany, and the UK are exceptions to the prevailing pattern of TFP increase in the analysed sample. These countries experienced an overall decreasing trend in TFP, but the dynamics in these countries seem to be idiosyncratic (see Table 5).
Table 6 presents figures on the TFP components that help us to reveal the sources of TFP dynamics. The results suggest that the main source of TFP growth is a scale-effect component. This is in line with the expectation that abolishing milk quotas leads to farm size adjustments in the direction of optimal size. In other words, the farms tend to adjust their scale of operations to increase scale efficiency, i.e., to exploit economies of scale. Then, the technical efficiency component does not contribute significantly in the analysed period to the TFP dynamics, which is in line with our findings in the previous chapter. Finally, technological change predominantly reduces the positive effect of the scale component of TFP growth. This finding does not support the expectation of moving to farms with greater investment strength; however, the result could be that we do not analyse only specialized milk farms.

4. Conclusions

This study provides the insights into the sources of competitiveness of milk producers before and after the abolition of milk quotas. We explored dairy farms in selected EU member states and focused on the productivity dynamics. Our aim was to study the effects of the abolishing of milk quotas. The investigation was based on the stochastic frontier analysis. We employed the input distance function in the specification of the generalized true random effect model. Moreover, to provide a robust estimate of this model, we employed the method which controls for the potential endogeneity of netputs in the four-step estimation procedure. The main contribution of this paper is the empirical application of the recently developed approaches to robust efficiency and productivity analysis of milk producers. Furthermore, we attempt to complement the literature that predicted the possible impacts of quota deregulation using data prior to the policy implementation by new findings using the data that includes the years after the abolishing of milk quotas. In particular, the deregulation of the milk quota allocation was expected to increase dairy farm efficiency and productivity over time [5].
Our results revealed considerable heterogeneity in production structure and production technology. Moreover, the average milk producer is characterized by increasing returns to scale in all analysed countries. However, the degree of diseconomies of scale differs among the countries substantially. These findings are in line with Čechura et al. [46] and Žáková Kroupová et al. [15]. The technological change was found to be negative in most of the countries. Moreover, we rejected the Hick’s neutral technological change. The estimated biased technological change is country specific, and we cannot observe any common patterns. The exception is capital input. We estimated a capital-using biased technological change in the majority of analysed countries. These results find again the support in Čechura et al. [46] and are in line with the observations of Klopčič et al. [22].
Similar to the results of Bokusheva and Čechura [41], we found high overall technical efficiency in all analysed countries except for the UK. Since the density of the efficiency estimate is narrow and skewed to higher values in the majority of countries, we may conclude that most producers are operating near the production frontier. The decomposition of overall technical efficiency into transient and persistent parts reveals that the persistent technical efficiency shows lower mean values as compared to transient technical efficiency. However, the room for improvement is small, up to 10% in the majority of cases. With respect to the distribution, which is also narrow and skewed to higher values, we may conclude that we cannot observe considerable systematic failures in the efficiency of input use in most of the analysed countries.
Furthermore, the results indicate an increasing trend for TFP in most countries, with different intensity and variability among the countries. The TFP decomposition shows two main sources of TFP dynamics. Whereas the technological change component was predominantly negative, the scale component was found as the main source of TFP growth. That is, the farms adjusted their scale of operations to increase scale efficiency, i.e., to exploit economies of scale. These results are fully in line with the expectation that milk quota abolishment leads to farm size adjustments in the direction of optimal size. That is, we found the support for the hypothesis of positive effects of the abolition of milk quotas on productivity that were predicted and/or observed by other studies, e.g., [11,27,29].
The future research will focus on the effects of the market deregulation or the abolition of milk quotas, respectively, on the group of specialized milk producers. In particular, we aim to investigate whether the observed scale effects are stronger for specialized milk producers and different size groups and what are the investments patterns with respect to the expected positive technological change.

Author Contributions

Conceptualization, L.Č. and Z.Ž.K.; methodology, L.Č. and Z.Ž.K.; validation, L.Č.; formal analysis, L.Č. and Z.Ž.K.; writing—original draft preparation, L.Č., Z.Ž.K. and I.B.; writing—review and editing, L.Č.; visualization, Z.Ž.K.; project administration, L.Č.; funding acquisition, L.Č. All authors have read and agreed to the published version of the manuscript.

Funding

The VALUMICS project “Understanding Food Value Chain and Network Dynamics” received funding from the European Union’s Horizon 2020 research and innovation programme, under grant agreement No. 727243. https://valumics.eu/.

Institutional Review Board Statement

Not applicable.

Informed Consent Statement

Not applicable.

Data Availability Statement

The access to the FADN data was provided by the European Commission’s Directorate-General for Agriculture and Rural Development (DG AGRI) in the framework of the VALUMICS project.

Conflicts of Interest

The authors declare no conflict of interest.

References

  1. Salou, T.; van der Werf, H.M.G.; Levert, F.; Forslund, A.; Hercule, J.; Le Mouël, C. Could EU Dairy Quota Removal Favour Some Dairy Production Systems over Others? The Case of French Dairy Production Systems. Agric. Syst. 2017, 153, 1–10. [Google Scholar] [CrossRef]
  2. Kempen, M.; Witzke, P.; Pérez Domínguez, I.; Jansson, T.; Sckokai, P. Economic and Environmental Impacts of Milk Quota Reform in Europe. J. Policy Model. 2011, 33, 29–52. [Google Scholar] [CrossRef]
  3. Moyer, H.W.; Josling, T. Agricultural Policy Reform: Politics and Process in the EU and US in the 1990s, 1st ed.; Routledge: London, UK, 2002; 286p. [Google Scholar]
  4. Kersting, S.; Hüttel, S.; Odening, M. Industry Dynamics under Production Constraints—The Case of the EU Dairy Sector. Econ. Model. 2016, 55, 135–151. [Google Scholar] [CrossRef]
  5. Sauer, J. Deregulation and Dairy Production Systems: A Bayesian Distance Function Approach. J. Product. Anal. 2010, 34, 213–237. [Google Scholar] [CrossRef]
  6. Bouamra-Mechemache, Z.; Chavas, J.P.; Cox, T.L. Interregional Analysis of the Impacts of Eliminating European Union Milk Production Quotas. In Proceedings of the Annual Meeting of American Agricultural Economics Association (New Name 2008: Agricultural and Applied Economics Association), Chicago, IL, USA, 5–8 August 2001; p. 16. [Google Scholar]
  7. Bouamra-Mechemache, Z.; Jongeneel, R.; Réquillart, V. EU Dairy Policy Reforms: Luxembourg Reform, WTO Negotiations and the Quota Regime. EuroChoices 2009, 8, 13–22. [Google Scholar] [CrossRef]
  8. European Commission. Council Regulation (EC) No 72/2009; European Commission: Brussel, Belgium, 2009. [Google Scholar]
  9. Thorsøe, M.; Noe, E.; Maye, D.; Vigani, M.; Kirwan, J.; Chiswell, H.; Grivins, M.; Adamsone-Fiskovica, A.; Tisenkopfs, T.; Tsakalou, E.; et al. Responding to Change: Farming System Resilience in a Liberalized and Volatile European Dairy Market. Land Use Policy 2020, 99, 105029. [Google Scholar] [CrossRef]
  10. Fotis, P.; Polemis, M. The Impact of Regulation in Shelf Life on Milk Price. Int. J. Econ. Bus. 2021, 28, 19–47. [Google Scholar] [CrossRef]
  11. Philippidis, G.; Waschik, R. Melitz Meets Milk: The Impact of Quota Abolition on EU Dairy Export Competitiveness. J. Agric. Econ. 2019, 70, 44–61. [Google Scholar] [CrossRef]
  12. Poczta, W.; Sredzi, J.; Chenczke, M. Economic Situation of Dairy Farms in Identified Clusters of European Union Countries. Agriculture 2020, 10, 92. [Google Scholar] [CrossRef] [Green Version]
  13. European Commission. EU Dairy Farm Report Based on 2016 FADN Data; European Commission Directorate-General for Agriculture and Rural Development: Brussel, Belgium, 2018. [Google Scholar]
  14. Sobczyński, T.; Klepacka, A.M.; Revoredo-Giha, C.; Florkowski, W.J. Dairy Farm Cost Efficiency in Leading Milk-Producing Regions in Poland. J. Dairy Sci. 2015, 98, 8294–8307. [Google Scholar] [CrossRef]
  15. Kroupová Žáková, Z.; Hálová, P.; Rumánková, L. Productivity of Czech Milk Production in European Comparison. Agris Online Pap. Econ. Inform. 2020, 3, 115–127. [Google Scholar] [CrossRef]
  16. Eurostat. Agriculture, Forestry and Fishery Statistics 2018 Edition; Eurostat: Luxembourg, 2018. [Google Scholar]
  17. Klootwijk, C.W.; Van Middelaar, C.E.; Berentsen, P.B.M.; de Boer, I.J.M. Dutch Dairy Farms after Milk Quota Abolition: Economic and Environmental Consequences of a New Manure Policy. J. Dairy Sci. 2016, 99, 8384–8396. [Google Scholar] [CrossRef] [Green Version]
  18. Oudendag, D.; Hoogendoorn, M.; Jongeneel, R. Agent-Based Modeling of Farming Behavior: A Case Study for Milk Quota Abolishment. In Modern Advances in Applied Intelligence, Proceedings of the 27th International Conference on Industrial Engineering and Other Applications of Applied Intelligent Systems, IEA/AIE 2014, Kaohsiung, Taiwan, 3–6 June 2014; Part I; Moonis, A., Jeng-Shyang, P., Shyi-Ming, C., Mong-Fong, H., Eds.; IEA/AIE: Kaohsiung, Taiwan, 2014; pp. 11–20. [Google Scholar]
  19. Kulkarni, P.; Mourits, M.; Nielen, M.; Van Den Broek, J.; Steeneveld, W. Survival Analysis of Dairy Cows in the Netherlands under Altering Agricultural Policy. Prev. Vet. Med. 2021, 193, 167–5877. [Google Scholar] [CrossRef]
  20. Groeneveld, A.; Peerlings, J.; Bakker, M.; Heijman, W. The Effect of Milk Quota Abolishment on Farm Intensity: Shifts and Stability. NJAS-Wagening. J. Life Sci. 2016, 77, 25–37. [Google Scholar] [CrossRef]
  21. Schulte, H.D.; Musshoff, O.; Meuwissen, M.P.M. Considering Milk Price Volatility for Investment Decisions on the Farm Level after European Milk Quota Abolition. J. Dairy Sci. 2018, 101, 7531–7539. [Google Scholar] [CrossRef] [PubMed] [Green Version]
  22. Klopčič, M.; Kuipers, A.; Malak-Rawlikowska, A.; Stalgiene, A.; Ule, A.; Erjavec, K. Dairy Farmers’ Strategies in Four European Countries before and after Abolition of the Milk Quota. Land Use Policy 2019, 88, 104169. [Google Scholar] [CrossRef]
  23. Borawski, P.; Guth, M.; Truszkowski, W.; Zuze, D.; Beldycka-Borawska, A.; Mickiewicz, B.; Szymanska, E.; Harper, J.K.; Dunn, J.W. Milk Price Changes in Poland in the Context of the Common Agricultural Policy. Agric. Econ. 2020, 66, 19–26. [Google Scholar] [CrossRef] [Green Version]
  24. Syverson, C. What Determines Productivity? J. Econ. Lit. 2011, 49, 326–365. [Google Scholar] [CrossRef] [Green Version]
  25. Frick, F.; Sauer, J. Deregulation and Productivity: Empirical Evidence on Dairy Production. Am. J. Agric. Econ. 2018, 100, 354–378. [Google Scholar] [CrossRef]
  26. Areal, F.J.; Tiffin, R.; Balcombe, K. Farm Technical Efficiency under a Tradable Milk Quota System. J. Dairy Sci. 2012, 95, 50–62. [Google Scholar] [CrossRef] [PubMed] [Green Version]
  27. Huettel, S.; Jongeneel, R. How Has the EU Milk Quota Affected Patterns of Herd-Size Change? Eur. Rev. Agric. Econ. 2011, 38, 497–527. [Google Scholar] [CrossRef]
  28. Colman, D. Inefficiencies in the UK Milk Quota System. Food Policy 2000, 25, 1–16. [Google Scholar] [CrossRef]
  29. Gillespie, P.R.; O’Donoghue, C.; Hynes, S.; Thorne, F.; Hennessy, T. Milk Quota and the Development of Irish Dairy Productivity: A Malmquist Index Using a Stochastic Frontier Approach. In Proceedings of the 29th International Conference of Agricultural Economists: International Conference of Agricultural Economists: Agriculture in an Interconnected World, Milan, Italy, 8–14 August 2015; p. 24. [Google Scholar]
  30. Zeng, S.; Gould, B.; Läpple, D.; Thorne, F. EU Milk Quota Elimination: Has the Productivity of Irish Dairy Farms Been Impacted? In Proceedings of the 90th Annual Conference of the Agricultural Economics Society, Chicago, IL, USA, 30 July–1 August 2017; p. 20. [Google Scholar]
  31. Breustedt, G.; Latacz-Lohmann, U.; Tiedemann, T. Organic or Conventional? Optimal Dairy Farming Technology under the EU Milk Quota System and Organic Subsidies. Food Policy 2011, 36, 223–229. [Google Scholar] [CrossRef] [Green Version]
  32. Kuipers, A.; Malak-Rawlikowska, A.; Stalgienė, A.; Ule, A.; Klopčič, M. European Dairy Farmers’ Perceptions and Responses towards Development Strategies in Years of Turbulent Market and Policy Changes. Agriculture 2021, 11, 293. [Google Scholar] [CrossRef]
  33. Klepacka, A.M.; Florkowski, W.J.; Revoredo-Giha, C. Can Family Farms Depend on Price Information? Testing Butter and Curd Price Integration in Poland. Agriculture 2021, 11, 434. [Google Scholar] [CrossRef]
  34. Bórawski, P.; Pawlewicz, A.; Parzonko, A.; Harper, J.K.; Holden, L. Factors Shaping Cow’s Milk Production in the EU. Sustainability 2020, 12, 420. [Google Scholar] [CrossRef] [Green Version]
  35. Mickiewicz, B.; Mickiewicz, A. Regional Differentiation of Milk Production Quota in Poland and Its Influence on the Milk Market. Econ. Sci. Rural Dev. Conf. Proc. 2015, 198–207. Available online: https://agris.fao.org/agris-search/search.do?recordID=LV2015000447 (accessed on 20 August 2021).
  36. Budzynska, A.; Chojnacki, P. Competitiveness of EU Dairy Industry in the Global Market after the Abolition of Milk Quotas. In Innovation Management and Education Excellence through Vision 2020, VOLS I–XI; Soliman, K., Ed.; Int Business Information Management ASSOC-IBIMA: 34 E Germantown Pike, NO. 327; Int Business Informat Management Assoc: Norristown, PA, USA, 2018; pp. 2778–2788. [Google Scholar]
  37. Boere, E.; Peerlings, J.; Reinhard, S.; Heijman, W. The Dynamics of Dairy Land Use Change with Respect to the Milk Quota Regime. Eur. Rev. Agric. Econ. 2015, 42, 651–674. [Google Scholar] [CrossRef] [Green Version]
  38. IPTS with the Collaboration of EuroCARE; GmbH, B. Economic Impact of the Abolition of the Milk Quota Regime-Regional Analysis of the Milk Production in the EU-Executive Summary Background. Available online: https://ec.europa.eu/info/sites/default/files/food-farming-fisheries/key_policies/documents/ext-study-milk-quota-ex-sum_2009_en.pdf (accessed on 20 August 2021).
  39. O’Donnell, C.J. Nonparametric Estimates of the Components of Productivity and Profitability Change in U.S. Agriculture. Am. J. Agric. Econ. 2012, 94, 873–890. [Google Scholar] [CrossRef]
  40. Coelli, T.J.; Rao, D.S.P.; O’Donnell, C.J.; Battese, G.E. An Introduction to Efficiency and Productivity Analysis, 2nd ed.; Springer: Berlin/Heidelberg, Germany, 2005. [Google Scholar]
  41. Bokusheva, R.; Cechura, L. Evaluating Dynamics, Sources and Drivers of Productivity Growth at the Farm Level; OECD Food, Agriculture and Fisheries Papers; OECD iLibrary: Paris, France, 2017; 64p. [Google Scholar] [CrossRef]
  42. Diewert, W.E. Exact and Superlative Index Numbers. J. Econom. 1976, 4, 115–145. [Google Scholar] [CrossRef]
  43. Caves, D.W.; Christensen, L.R.; Diewert, W.E. The Economic Theory of Index Numbers and the Measurement of Input, Output, and Productivity. Econometrica 1982, 50, 1393–1414. [Google Scholar] [CrossRef]
  44. Greene, W. Reconsidering Heterogeneity in Panel Data Estimators of the Stochastic Frontier Model. J. Econom. 2005, 126, 269–303. [Google Scholar] [CrossRef]
  45. Lovell, C.A.K.; Travers, P.; Richardson, S.; Wood, L. Resources and Functionings: A New View of Inequality in Australia. In Models and Measurement of Welfare and Inequality; Eichhorn, W., Ed.; Springer: Berlin/Heidelberg, Germany, 1994; pp. 787–807. [Google Scholar] [CrossRef]
  46. Cechura, L.; Grau, A.; Hockmann, H.; Levkovych, I.; Kroupova, Z. Catching Up or Falling Behind in European Agriculture: The Case of Milk Production. J. Agric. Econ. 2017, 68, 206–227. [Google Scholar] [CrossRef]
  47. Irz, X.; Thirtle, C. Dual Technological Development in Botswana Agriculture: A Stochastic Input Distance Function Approach. J. Agric. Econ. 2004, 55, 455–478. [Google Scholar] [CrossRef]
  48. Singbo, A.; Larue, B. Scale Economies, Technical Efficiency, and the Sources of Total Factor Productivity Growth of Quebec Dairy Farms. Can. J. Agric. Econ. 2016, 64, 339–363. [Google Scholar] [CrossRef] [Green Version]
  49. Farrell, M.J. The Measurement of Productive Efficiency. J. R. Stat. Soc. Ser. A 1957, 120, 253–290. [Google Scholar] [CrossRef]
  50. Kumbhakar, S.C.; Lien, G.; Hardaker, J.B. Technical Efficiency in Competing Panel Data Models: A Study of Norwegian Grain Farming. J. Product. Anal. 2014, 41, 321–337. [Google Scholar] [CrossRef]
  51. Colombi, R.; Kumbhakar, S.C.; Martini, G.; Vittadini, G. Closed-Skew Normality in Stochastic Frontiers with Individual Effects and Long/Short-Run Efficiency. J. Product. Anal. 2014, 42, 123–136. [Google Scholar] [CrossRef]
  52. Tsionas, E.G.; Kumbhakar, S.C. Firm Heterogenity, Persistent and Transient Technical Inefficiency: A Generalized True Random-Effects Model. J. Appl. Econom. 2014, 29, 110–132. [Google Scholar] [CrossRef]
  53. Arellano, M.; Bover, O. Another Look at the Instrumental Variable Estimation of Error-Components Models. J. Econom. 1995, 68, 29–51. [Google Scholar] [CrossRef] [Green Version]
  54. Blundell, R.; Bond, S. Initial Conditions and Moment Restrictions in Dynamic Panel Data Models. J. Econom. 1998, 87, 115–143. [Google Scholar] [CrossRef] [Green Version]
  55. Roodman, D. How to Do Xtabond2: An Introduction to Difference and System GMM in Stata. Stata J. 2009, 9, 86–136. [Google Scholar] [CrossRef] [Green Version]
  56. Hansen, L.P. Large Sample Properties of Generalized Method of Moments Estimators. Econometrica 1982, 50, 1029–1054. [Google Scholar] [CrossRef]
  57. Arellano, M.; Bond, S. Some Tests of Specification for Panel Data: Monte Carlo Evidence and an Application to Employment Equations. Rev. Econ. Stud. 1991, 58, 277–297. [Google Scholar] [CrossRef] [Green Version]
  58. Karagiannis, G.; Midmore, P.; Tzouvelekas, V. Parametric Decomposition of Output Growth Using A Stochastic Input Distance Function. Am. J. Agric. Econ. 2004, 86, 1044–1057. [Google Scholar] [CrossRef] [Green Version]
  59. Čechura, L.; Hockmann, H. Heterogeneity in Production Structures and Efficiency: An Analysis of the Czech Food Processing Industry. Pacific Econ. Rev. 2017, 22, 702–719. [Google Scholar] [CrossRef]
  60. Döbertová, M.; Lamprechtová, S. Vybrané Ekonomické Ukazatele Podniků Specializovaných Na Produkci Mléka v Období 2012 Až 2017 s Využitím Dat FADN. Náš Chov 2019. Available online: https://www.naschov.cz/vybrane-ekonomicke-ukazatele-podniku-specializovanych-na-produkci-mleka-v-obdobi-2012-az-2017-s-vyuzitim-dat-fadn/ (accessed on 20 August 2021).
  61. Chambers, R.G. Applied Production Analysis, 1st ed.; Cambridge University Press: Cambridge, MA, USA, 1988. [Google Scholar]
  62. Samsonová, P.; Hrabalová, A. Produkce a Odbyt Českého Biomléka. Zemědělec 2019, 20, 35. [Google Scholar]
  63. Heikkila, A.-M.; Myyra, S.; Pietola, K. Effects of Economic Factors on Adoption of Robotics and Consequences of Automation for Productivity Growth of Dairy Farms; Factor Markets Working Papers; 20 Centre for European Policy Studies: Brussels, Belgium, 2012; 18p. [Google Scholar]
Figure 1. Development of the total production of raw milk and number of dairy cows in the EU. Source: Eurostat. Note: Non-available data was replaced by means of valid surrounding values.
Agriculture 11 00835 g001
Figure 2. Development of dairy cows (thousand heads) in selected countries. Source: Eurostat.
Agriculture 11 00835 g002
Figure 3. Development of raw milk production (1000 t) in selected countries. Source: Eurostat.
Agriculture 11 00835 g003
Figure 4. Transient technical efficiency development. Source: authors’ own calculations.
Agriculture 11 00835 g004
Table 1. Structure of the data set. Source: FADN database and authors’ own calculations.
CountryAustriaBelgiumCzechiaFinlandFranceEast GermanyWest GermanyIrelandItalyRomaniaSpainSwedenUnited Kingdom
I1086405500385202549219463631055425655380415
N11,65139034671391318,225398815,193337579392603551530783553
Note: I is the total number of firms and N is the total number of observations.
Table 2. Descriptive statistics. Source: FADN database and own calculation.
VariableMilkOther Animal ProductionPlant ProductionLandLabourCapitalMaterial
CountryMeanStd. D. MeanStd. D.MeanStd. D.MeanStd. D.MeanStd. D.MeanStd. D.MeanStd. D.
Austria43,06932,85014,35911,81422,11123,58636302124,22813,10940,74724,442
Belgium106,14771,88656,36062,63345,62052,64269402142,74825,660114,50868,474
Czechia481,302442,284200,250260,303729,055823,57111089243733198,178199,8921,148,9821,123,097
Finland132,894103,08812,34412,15026,73931,00772452158,12850,825136,27496,237
France122,81473,54840,47843,96748,73062,290121762163,94739,195127,26080,847
East Germany 767,098845,925205,465369,172905,4501,232,8359328652023297,245301,2711,302,2811,491,043
West Germany107,93091,65832,51634,68933,43538,56671442136,40125,701109,65674,463
Ireland108,15873,09035,30434,67612,00714,55064342115,15719,134120,637121,051
Italy86,564107,14117,22123,13829,92149,43240582117,01717,36173,51790,356
Romania15,54756,065608322,48634,335181,6415723938650234,99432,366146,738
Spain132,696131,13219,07124,81414,74118,06132442115,15719,134120,637121,051
Sweden153,291155,42223,68129,04869,43978,5491091052247,41748,410179,945171,093
United Kingdom228,476239,70549,30244,07739,29156,536108843245,96534,117211,422206,848
Table 3. First-order parameters, technological change parameters, and tests of IDFs. Source: authors’ own calculations.
Coeff.AustriaBelgiumCzechiaFinlandFranceEast GermanyWest GermanyIrelandItalyRomaniaSpainSwedenUnited Kingdom
α_yM−0.3037−0.3194−0.3328−0.5298−0.4922−0.4385−0.3985−0.4135−0.3715−0.1349−0.6928−0.4092−0.5249
***************************************
α_yAOL−0.1564−0.2057−0.1632−0.0873−0.1710−0.1333−0.1603−0.2236−0.0871−0.1002−0.0564−0.0926−0.1640
***************************************
α_yAOO−0.1645−0.1585−0.4583−0.1447−0.1760−0.3804−0.1800−0.1309−0.2763−0.4258−0.0880−0.3078−0.1690
***************************************
β_L0.14350.07040.11840.09940.05310.05360.08270.22080.15360.21600.11550.06050.1122
************* ********************
β_W0.33510.36910.31950.25540.21680.18270.29910.17850.31970.32590.25310.26510.2801
***************************************
β_K0.19950.17070.07590.07410.24770.18080.09940.07460.11120.10310.06980.08090.1234
***************************************
δ_t−0.0009−0.00760.01250.0132−0.0009−0.04870.02880.00950.0044−0.0015−0.01390.0017−0.0141
********* *********** *** ***
δ_tt0.00180.00380.00530.00300.00200.02000.00220.00450.00050.00850.00480.00210.0076
****************** *** **********
δ_yMt−0.00210.0022−0.00320.01320.00230.0024−0.00540.00360.00130.0036−0.00800.0097−0.0082
***** ** *******
δ_yAOLt0.0017−0.0015−0.0019−0.00220.0030−0.0013−0.00190.0066−0.00530.0072−0.00040.0033−0.0032
*** ****
δ_yAOOt0.00090.00180.0062−0.0032−0.00080.0014−0.0009−0.00520.0091−0.0149−0.0020−0.00980.0098
** * ****** *****
δ_Lt−0.01290.0018−0.01870.0093−0.0026−0.00760.0015−0.0049−0.01300.0083−0.00760.0081−0.0157
*** *** *** ** **
δ_Wt0.0009−0.00430.0015−0.00600.00170.0186−0.00530.01060.01890.0024−0.0243−0.0024−0.0008
** ***** ***
δ_Kt0.0110−0.0093−0.0008−0.00820.0038−0.00410.00520.0050−0.00660.0014−0.0091−0.00990.0046
**** *** *** *****
Hansen test915.71373.14484.69367.131573.33353.36959.22370.81035.43193.41623.75353.59378.89
p-value0.0531.0000.1391.0000.0921.0000.0731.0000.3531.0001.0001.0001.000
AR (2) test−1.52−1.59−0.020.910.550.720−0.36−0.62−0.37−1.59−0.800.36−1.84
p-value0.1280.1120.9830.3630.5790.4680.7220.5360.7120.1120.4260.7180.066
Note: ***, **, * denotes significance at the 1%, 5%, and 10% levels, respectively.
Table 4. Overall technical efficiency and its decomposition. Source: authors’ own calculations.
CountryOverall TETransient TEPersistent TE
MeanStd. Dev.Min.Max.MeanStd. Dev.Min.Max.MeanStd. Dev.Min.Max.
Austria0.91870.01220.82240.95790.96010.00930.85140.99010.95680.00800.91780.9769
Belgium0.85340.04940.54580.95330.94540.01810.81800.98700.90260.04790.63780.9758
Czechia0.83440.05420.56180.93980.94200.01670.81360.98680.88570.05400.60960.9781
Finland0.89540.03070.75390.95050.96790.00610.91440.98820.92510.03060.78890.9733
France0.86810.04230.60710.95860.95060.01550.78190.99170.91310.04040.65810.9778
East Germany0.80830.09870.37620.98040.80920.09880.37670.98160.99880.00000.99880.9988
West Germany0.95240.01010.89660.97400.99800.00000.99790.99810.95430.01020.89840.9759
Ireland0.91210.04220.75170.97480.99650.00010.99620.99690.91530.04230.75440.9780
Italy0.91680.02210.79190.96370.99650.00000.99630.99670.92000.02210.79470.9670
Romania0.82900.03720.58840.91650.90080.03460.67500.97430.92010.01740.79290.9616
Spain0.92830.02160.81480.97280.99770.00000.99760.99780.93050.02160.81680.9750
Sweden0.91430.01810.78890.96420.94910.01610.83060.98700.96320.00790.93420.9793
United Kingdom0.72880.07640.37020.99050.92240.03300.68520.99050.78970.07450.49471.0000
Table 5. Total factor productivity development (TTI). Source: own calculation.
Country2004–20082009–20132015–2017
MeanStd. Dev.Min.Max.MeanStd. Dev.Min.Max.MeanStd. Dev.Min.Max.
Austria−0.0120.203−0.7720.792−0.0070.239−1.0520.8720.0410.257−1.2270.710
Belgium0.0370.154−0.6630.441−0.0130.177−0.9120.603−0.0690.179−0.5090.562
Czechia0.0080.173−0.7670.197−0.0010.158−0.9170.511−0.0100.161−0.7511.756
Finland−0.0370.159−0.8951.4870.0080.159−0.8830.3850.0630.144−0.6090.278
France−0.0080.100−0.5180.1970.0020.098−0.4520.5840.0120.094−0.4160.326
East Germany−0.0450.121−0.7500.3990.0580.092−0.3810.598−0.0610.090−0.5040.120
West Germany0.0070.152−0.7110.614−0.0030.151−1.1550.705−0.0090.139−0.8420.571
Ireland−0.0160.149−0.8400.652−0.0050.151−0.8161.7050.0290.132−0.6460.295
Italy−0.0100.225−0.9500.6390.0040.243−0.9621.5130.0190.242−0.7410.506
Romania−0.1040.397−0.8861.2640.0060.386−1.1151.5530.0060.440−1.4171.406
Spain−0.0120.138−0.5040.6600.0080.149−0.8450.6650.0020.137−0.4360.751
Sweden−0.0330.165−0.6470.3520.0150.173−1.1882.1520.0310.140−1.0310.243
United Kingdom0.0180.129−0.4330.452−0.0010.121−0.3740.961−0.0220.128−0.4611.023
Table 6. Decomposition of TFP. Source: own calculation.
CountryAustriaBelgiumCzechiaFinlandFranceEast GermanyWest GermanyIrelandItalyRomaniaSpainSwedenUnited Kingdom
2004–2008SEMean−0.0190.024−0.011−0.049−0.0150.001−0.001−0.033−0.011−0.093−0.025−0.042−0.007
Std.D.0.2020.1590.0040.1600.1000.0600.1540.1540.2240.3940.1170.1620.107
TECMean0.0000.002−0.0030.000−0.002−0.1100.0000.0000.000−0.0460.0000.000−0.015
Std.D.0.0090.0000.0010.0070.0170.1200.0000.0000.0000.0610.0000.0170.051
TCMean0.0080.0110.0220.0120.0090.0650.0080.0170.0020.0350.0130.0100.040
Std.D.0.0070.0000.0010.0070.0050.0310.0050.0110.0140.0140.0250.0090.020
2009–2014SEMean−0.006−0.0070.0010.0120.0030.0010.000−0.0050.004−0.0010.0100.019−0.001
Std.D.0.2370.1810.0030.1610.0990.0680.1530.1580.2430.3870.1230.1690.111
TECMean0.000−0.0010.0010.0000.0010.0900.0000.0000.0000.0020.000−0.0010.006
Std.D.0.0090.0000.0000.0060.0150.0480.0000.0000.0000.0370.0000.0170.027
TCMean−0.002−0.005−0.004−0.004−0.002−0.033−0.0030.0010.0000.005−0.002−0.003−0.006
Std.D.0.0080.0000.0010.0070.0060.0350.0060.0120.0140.0190.0310.0090.016
2015–2017SEMean0.052−0.0520.0160.0800.023−0.0070.0040.0500.0240.0330.0230.0410.012
Std.D.0.2540.1820.0050.1460.0930.0750.1410.1390.2420.4360.1110.1350.115
TECMean0.0000.0060.0010.0010.0000.0720.0000.0000.0000.0050.0000.0020.006
Std.D.0.0110.0010.0010.0050.0180.0550.0000.0000.0000.0350.0000.0170.030
TCMean−0.011−0.023−0.027−0.018−0.012−0.126−0.013−0.021−0.005−0.032−0.021−0.012−0.040
Std.D.0.0060.0000.0010.0060.0050.0210.0050.0090.0140.0150.0310.0080.011
Publisher’s Note: MDPI stays neutral with regard to jurisdictional claims in published maps and institutional affiliations.

