1. Introduction
Legumes and grasses can be cultivated and mechanically processed through a biorefinery system in order to locally produce feedstuff, energy and fertilizers. After screw pressing, grassland plants are separated into a protein-rich juice and a fibrous pulp [
1]. The liquid phase can be used as protein supplement for livestock and the fibrous pulp can be suitable as forage source for ruminants. Likewise, both liquid and solid phases can be used to produce bioenergy in the form of methane [
2]. According to Corona et al. [
3], the concept of green biorefinery refers to the conversion of fresh biomass into value-added products that leads to local grassland development; less dependency on protein-rich feed import; and further synergies between agricultural sectors, such as crop and livestock farming. The use of home-grown protein feed is especially important in organic farming, where circular bioeconomy is essential.
The fibrous pulp can be produced from the fresh forage directly after harvesting [
1,
4] or from the ensiled forage [
5]. However, Franco et al. [
6] indicated that large amounts of forage have to be processed in a short period of time when using fresh forage. There are logistical benefits in producing pulp from silage instead of from fresh forage as smaller amounts of silage can be processed daily or every other day on a dairy farm. Alternatively, pulp from fresh forage can be ensiled in round bales, which can be transported and used over a long period. It is important to highlight that the fibrous pulp is a byproduct and its direct comparison with the original forage for animal feeding is meaningless, if the diets are not adjusted based on the differences between the forages. The mechanical pressing removes moisture and soluble nutrients, increasing fibre content and decreasing the nutritional value of the pulp compared to the original forage [
5]. Those differences have to be considered when formulating diets, especially when feeding high-producing dairy cows, because dietary forage NDF content is the primary factor limiting intake and performance when high-producing dairy cows in early-to-mid lactation are fed forage-based diets [
7].
When using a high-NDF forage source as fibrous pulp for dairy cows, the total amount of dietary forage NDF can be controlled by reducing the forage to concentrate ratio or by partially replacing the original forage. In order to limit the amount of forage NDF in the diet of high-producing dairy cows, Savonen et al. [
5] evaluated grass silage pulp (SP) by gradually replacing silage for SP. Two diets containing SP were compared to a silage-based diet, where SP replaced silage at 25 and 50% of the total forage dry matter (DM). The authors concluded that SP can be used in diets for high-producing dairy cows when the SP is mixed with the original silage. However, to our knowledge, no study has evaluated the complete substitution of silage for SP on milk production of dairy cows.
We hypothesized that the mechanical process of pressing the silage would increase fibre digestibility of SP. The greater fibre digestibility could compensate for the increased fibre content of the SP-based diet, resulting in similar milk yield of dairy cows fed the silage-based diet. The aim of this study was to evaluate the complete substitution of grass-clover silage for SP on milk production of dairy cows in an organic production system.
2. Materials and Methods
The experiment was conducted at the organic dairy farm Sötåsen Agricultural High School, Töreboda, Sweden (N 58°41′, E 14°8′), from 23 November 2020 to 14 April 2021. The experiment was approved by the Gothenburg Research Animal Ethics Committee (case number: 003106, 5.8.18-09145/2020).
2.1. Experimental Forages
The grass-clover leys were harvested three times in the growth cycle of 2020. The first cut was on 4 June, followed by the second and third cuts on 13 July and 16 September, respectively. Forage mixtures were mowed in the afternoon on the day before chopping and wilted to reach around 300 g/kg DM. Wilted forages were chopped by a harvester (JF Stoll FCT 1060) to a theoretical length of 25 mm. A chemical additive (Helm Gräs, Helm Scandinavien A/S, Hornslet, Denmark) containing formic acid (36.5–50%), propionic acid (10–30%) and sodium formate (10–20%) was applied at 4.0 L/t of forage on the harvester and the chopped forage was ensiled in bunker silos.
Silos containing forages from two different cuts were opened simultaneously and equally mixed (50% of each cut on DM basis) during feed-out. Due to the higher forage yields early in the summer, silage from first cut was used throughout the study and mixed with second or third cut silage. Silos containing silages from first and third cuts were opened simultaneously on 23 November 2020 and equally mixed until 19 January 2021, when the silage from third cut finished. Thus, the silo containing silage from the second cut was opened on 20 January 2021 and equally mixed with silage from the first cut until the end of the experiment on 14 April 2021.
Every Monday, Wednesday and Friday, silage from each cut was either equally mixed to compose the silage treatment or transported to the biorefinery, pressed through the screw press (Cir-Tech, Skærbæk, Denmark) at 1.5 ton/h and equally mixed to produce the SP treatment. The twin screw press speed was limited to 70% of its full capacity and the amperage was set at 25, which provided a pressing power of 3000 watts. The chemical composition of the experimental silage and the SP are presented in
Table 1.
2.2. Cows, Experimental Design and Diets
Seventy-two lactating cows (28 primiparous and 44 multiparous) of Holstein (49), Swedish Red (11), Jersey (8), and mixed breeds (Swedish Red x Ayrshire cattle) (4) were used in a completely randomized block design. At the beginning of the experiment, the primiparous cows were on average (mean ± SD) at 25.5 ± 7.9 kg/d of milk yield (MY), 28.7 ± 7.3 kg/d of energy corrected milk (ECM), 127 ± 117 days in milk (DIM), 738 ± 122 kg of body weight (BW) and 2.9 ± 0.4 body condition score (BCS). The multiparous cows were on average (mean ± SD) at 34.4 ± 10.7 kg/d MY, 37.9 ± 9.7 kg/d ECM, 124 ± 125 DIM, 617 ± 102 kg of BW and 2.7 ± 0.3 BCS.
Cows were blocked based on their breed, lactation number, DIM and ECM yield and randomly assigned to one of the two treatments within block (n = 36). Cows were divided into two groups and kept in a loose housing system. The experiment started with an adaptation period of two weeks, when all the cows received the same diet containing a mixture of 50% silage and 50% SP as forage source. After the adaptation period, the experiment lasted for 120 d with cows receiving the assigned diet (silage- or SP-based diet) continuously.
Diets were formulated according to the regulations for organic production [
9] that standardises the inclusion of dietary forage based on the DIM of the cows. Cows must receive a diet containing a minimum of 50% of forage DM intake during their first three months of lactation and thereafter a diet containing a minimum of 60% of forage DM intake (9). To minimize the difference in intake regulation by filling effect, the experimental diets were formulated aiming to have similar forage NDF concentrations between treatments. However, due to the organic production regulations that limits the minimum forage inclusion, the forage NDF concentration of the SP-based diet was still greater than the silage-based diet, even with greater inclusion of silage compared to SP. The forage DM proportions were 61% and 50% for cows from 1 to 100 DIM and 73% and 60% for cows from 101 to 365 DIM for the silage and SP groups, respectively. The ingredients and chemical composition of the diets, averaged over cows within each group throughout the experiment, are presented in
Table 2.
Forages and concentrates were fed to the cows separately. Silage and SP were mixed with the mineral/vitamin mix in separate TMR mixers (Cormall Feed Mixer-Multimix and GEA MVM 10 Mixer, respectively) and delivered to each group twice a day by an automatic feeding wagon (DEC SR, Rovibec Agrisolutions, Nicolet, QC, Canada). Concentrates were individually fed in automatic feed stations (DeLaval feed station FSC400, Peterborough, ON, Canada) placed in each pen. The chemical composition of the concentrate ingredients is presented in
Table A1.
2.3. Data Collection Feed Sampling and Chemical Analysis
Forage intake was calculated on group basis by weighing the total forage offered and the refusals in the next morning. Therefore, the total forage intake was divided by the number of cows in the group to estimate the average daily intake for each experimental group. Intakes of the concentrates were individually recorded by an automatic system (DeLaval feed station FSC400) and adjusted based on MY. As forage intake was measured at group level and concentrate was offered according to the MY of each block of cows, no statistical analysis was performed. However, the average mean of intake over time for each treated group was calculated and presented in
Table 2.
Milk yield was registered twice a day when cows were milked at 0500 and 1500 h in a fishbone milking parlour. Milk samples were collected at milking in the afternoon and the following morning every other week throughout the experiment. The milk was analysed for fat, protein, and lactose (MilkoScan FT-Foss, Hilleroed, Denmark) by Eurofins Steins laboratory Inc. Energy corrected milk was calculated according to Sjaunja et al. [
10].
Body weight and BCS were recorded before feeding time once a month, starting at the beginning of the experiment. Individual body weights were recorded by weighing the cows without feed or water restriction. The BCS was evaluated by a trained veterinarian on a 5-point scale, in 0.25-unit increments, where 1 = very thin and 5 = very fat, as described by Edmonson et al. [
11].
A sample of each of the feed ingredients of the diets was collected once a week and then stored at −20 °C until the end of the experiment, when samples were composed monthly and analysed at LKS mbH (Lichtenwalde, Germany). The DM concentration of forages, orts, and concentrates was determined by drying 150 g samples in a drying cabinet at 60 °C for 24 h at the Department of Animal Environment and Health, Swedish University of Agricultural Sciences (SLU), Skara.
Samples of forages, orts, and concentrates were milled to pass through a 1-mm screen before laboratory analysis. Ash was determined by combustion at 525 °C for 16 h. Fibre components (NDF, ADF, and ADL) were determined by the fibre technology method, as described by Van Soest et al. [
12]. The NDF analysis was modified by adding heat-stable α-amylase (Novozymes, Bagsvaerd, and Denmark) and omitting sodium sulphite. Concentrations of NDF, ADF, and ADL were corrected for residual ash after ADL treatment.
Indigestible NDF and NDF digestibility (NDFD) were determined by in vitro incubation of 0.5 g dried and milled sample in Ankom F57 filter bags for 240 h at 39 °C in a Daisy II-incubator according to Goeser and Combs [
13]. The rumen fluid and buffer solution were changed every second day during the incubation. The IVOMD of silages was analysed by incubation at 38 °C for 96 h of 0.5 g of dried, milled sample in 49 mL of buffer and 1 mL of rumen fluid [
14,
15]. Ether extract concentration was determined by filtering the sample treated with hot hydrochloric acid; the residue was washed and dried, followed by extraction with petroleum ether.
The concentration of N was determined by the Kjeldahl method and CP concentration was calculated as total N × 6.25. Protein fractions (A, B
1, B
2, B
3, and C) were determined according to Licitra et al. [
16] and is based on degradability characteristics according to the Cornell Net Carbohydrate and Protein System [
17]. Fraction A is non protein nitrogen and is nitrogen in the filtrate after precipitation with tungstic acid. Fraction B is degradable true protein and can be further divided into; B
1 that is soluble in borate-phosphate buffer at rumen pH and is rapidly degraded in the rumen; B
2 that is soluble in neutral detergent solution, but insoluble in borate-phosphate buffer and the rumen degradation rate is intermediate; B
3 that is soluble in acid detergent solution but insoluble in neutral detergent solution. Fraction B
3 is associated with cell walls and has a slower degradation rate than fractions B
1 and B
2. The C fraction is insoluble in acid detergent solution and is considered to be indigestible. The rumen undegradable CP (RUP), at a 5% passage rate/h was calculated according to Kirchhof et al. [
8].
Water soluble carbohydrates (WSC) were determined by HPLC analysis of free glucose and fructose and then hydrolysis of sucrose and fructans to glucose and fructose and summed these together. Fermentation characteristics (pH, acids, alcohols, and ammonia N) were analysed in the silage and SP. The pH was measured in a water extract of the silage and the SP using a pH meter (Metrohm 654). Concentrations of organic acids and alcohols were determined by HPLC after purification and addition of H2SO4 (LKS FMUAA 166:2019-10). Ammonia N was analysed by adding potassium carbonate solution; the volatile nitrogenous bases were separated by micro diffusion and collected in a boric acid solution and treated with sulfuric acid.
2.4. Statistical Analysis
A power analysis test was performed using JMP Pro (version 16, SAS) to estimate the sample size. The fixed parameters considered a level of significance in an F test of 0.05 and a standard deviation for ECM of the cows within the block of 3 kg. The expected difference to detect significance was 1 kg ECM. The test aimed to estimate the sample size for a power of 75%. The minimum sample size required in the power test was sixty-five cows. The present study used seventy-two lactating cows, which showed a statistical power of 80%.
Data on milk yield, ECM and milk components were analysed as a randomized block design using the MIXED procedure of SAS (version 9.4, SAS Institute Inc., Cary, NC, USA) with week as repeated measures using the covariance structure that provided the best fit according to Bayesian information criterion. Body weight and BCS data were analysed using the same model but did not include week as repeated measures. The model included treatment, time, and treatment-by-time interaction as fixed effects, and block and cow within block as random effects. The statistical model was:
where Y
ijkl is the observed response, µ is the overall mean, F
i is the fixed effect of forage (i = 1 to 2), T
j is the fixed effect of time (j = 1 to 17 for MY; j = 1 to 8 for ECM and milk components; j = 1 to 4 for BCS and BW), FT
ij is the fixed effect of the interaction between forage and time, B
k is the random effect of block, C
l (B
k) is the random effect of cow within block, and e
ijkl is the error term.
Degrees of freedom were calculated using the Kenward Rogers option. Statistical significance was considered at p ≤ 0.05 and tendency to significance at 0.05 < p ≤ 0.10.
4. Discussion
The process of pressing the silage to extract the juice removed not only moisture but also WSC and nonprotein nitrogen, creating a drier forage with proportionally greater fibre content than the original silage. The diets used in the present study were formulated to have similar forage NDF, aiming to reduce the difference in filling effect of the diets on intake regulation. However, even with greater inclusion of silage compared to SP, the diets showed important differences that have to be considered when comparing the complete substitution of silage for SP in the dairy cow diets. When compared to the silage-based diet, the SP-based diet was drier and with greater content of fibre components, such as NDF, ADF and forage NDF, which might have affected DMI and consequently milk production of dairy cows [
7].
In the current study, the dietary DM varied from 533 g/kg in the silage-based diet to 671 g/kg in the SP-based diet and DMI was numerically greater for cows fed silage than for cows fed the SP-based diet, suggesting that DMI might have been affected by the DM content of the diet. However, the effect of dietary DM concentration on DMI and performance of dairy cows has previously been evaluated and results do not suggest that DM contents of diets play a major role on DMI and milk production. Leonardi et al. [
18] evaluated two diets varying in DM contents (808 vs. 644 g/kg) for lactating cows and concluded that dietary DM did not affect DMI or milk production. However, Miller-Cushon and DeVries [
19] claimed that the previous study tested diets that were much drier than regularly used in production dairy herds, and proposed a new study, in which the dietary DM concentration was compared in a more common range (576 vs. 479 g/kg). The authors observed that the drier diet showed a greater DMI, but milk production did not differ. Later, Fish and DeVries [
20] compared diets that ranged in DM concentrations from 617 to 519 g/kg, and concluded that dietary DM had no effect on DMI or milk production of lactating cows.
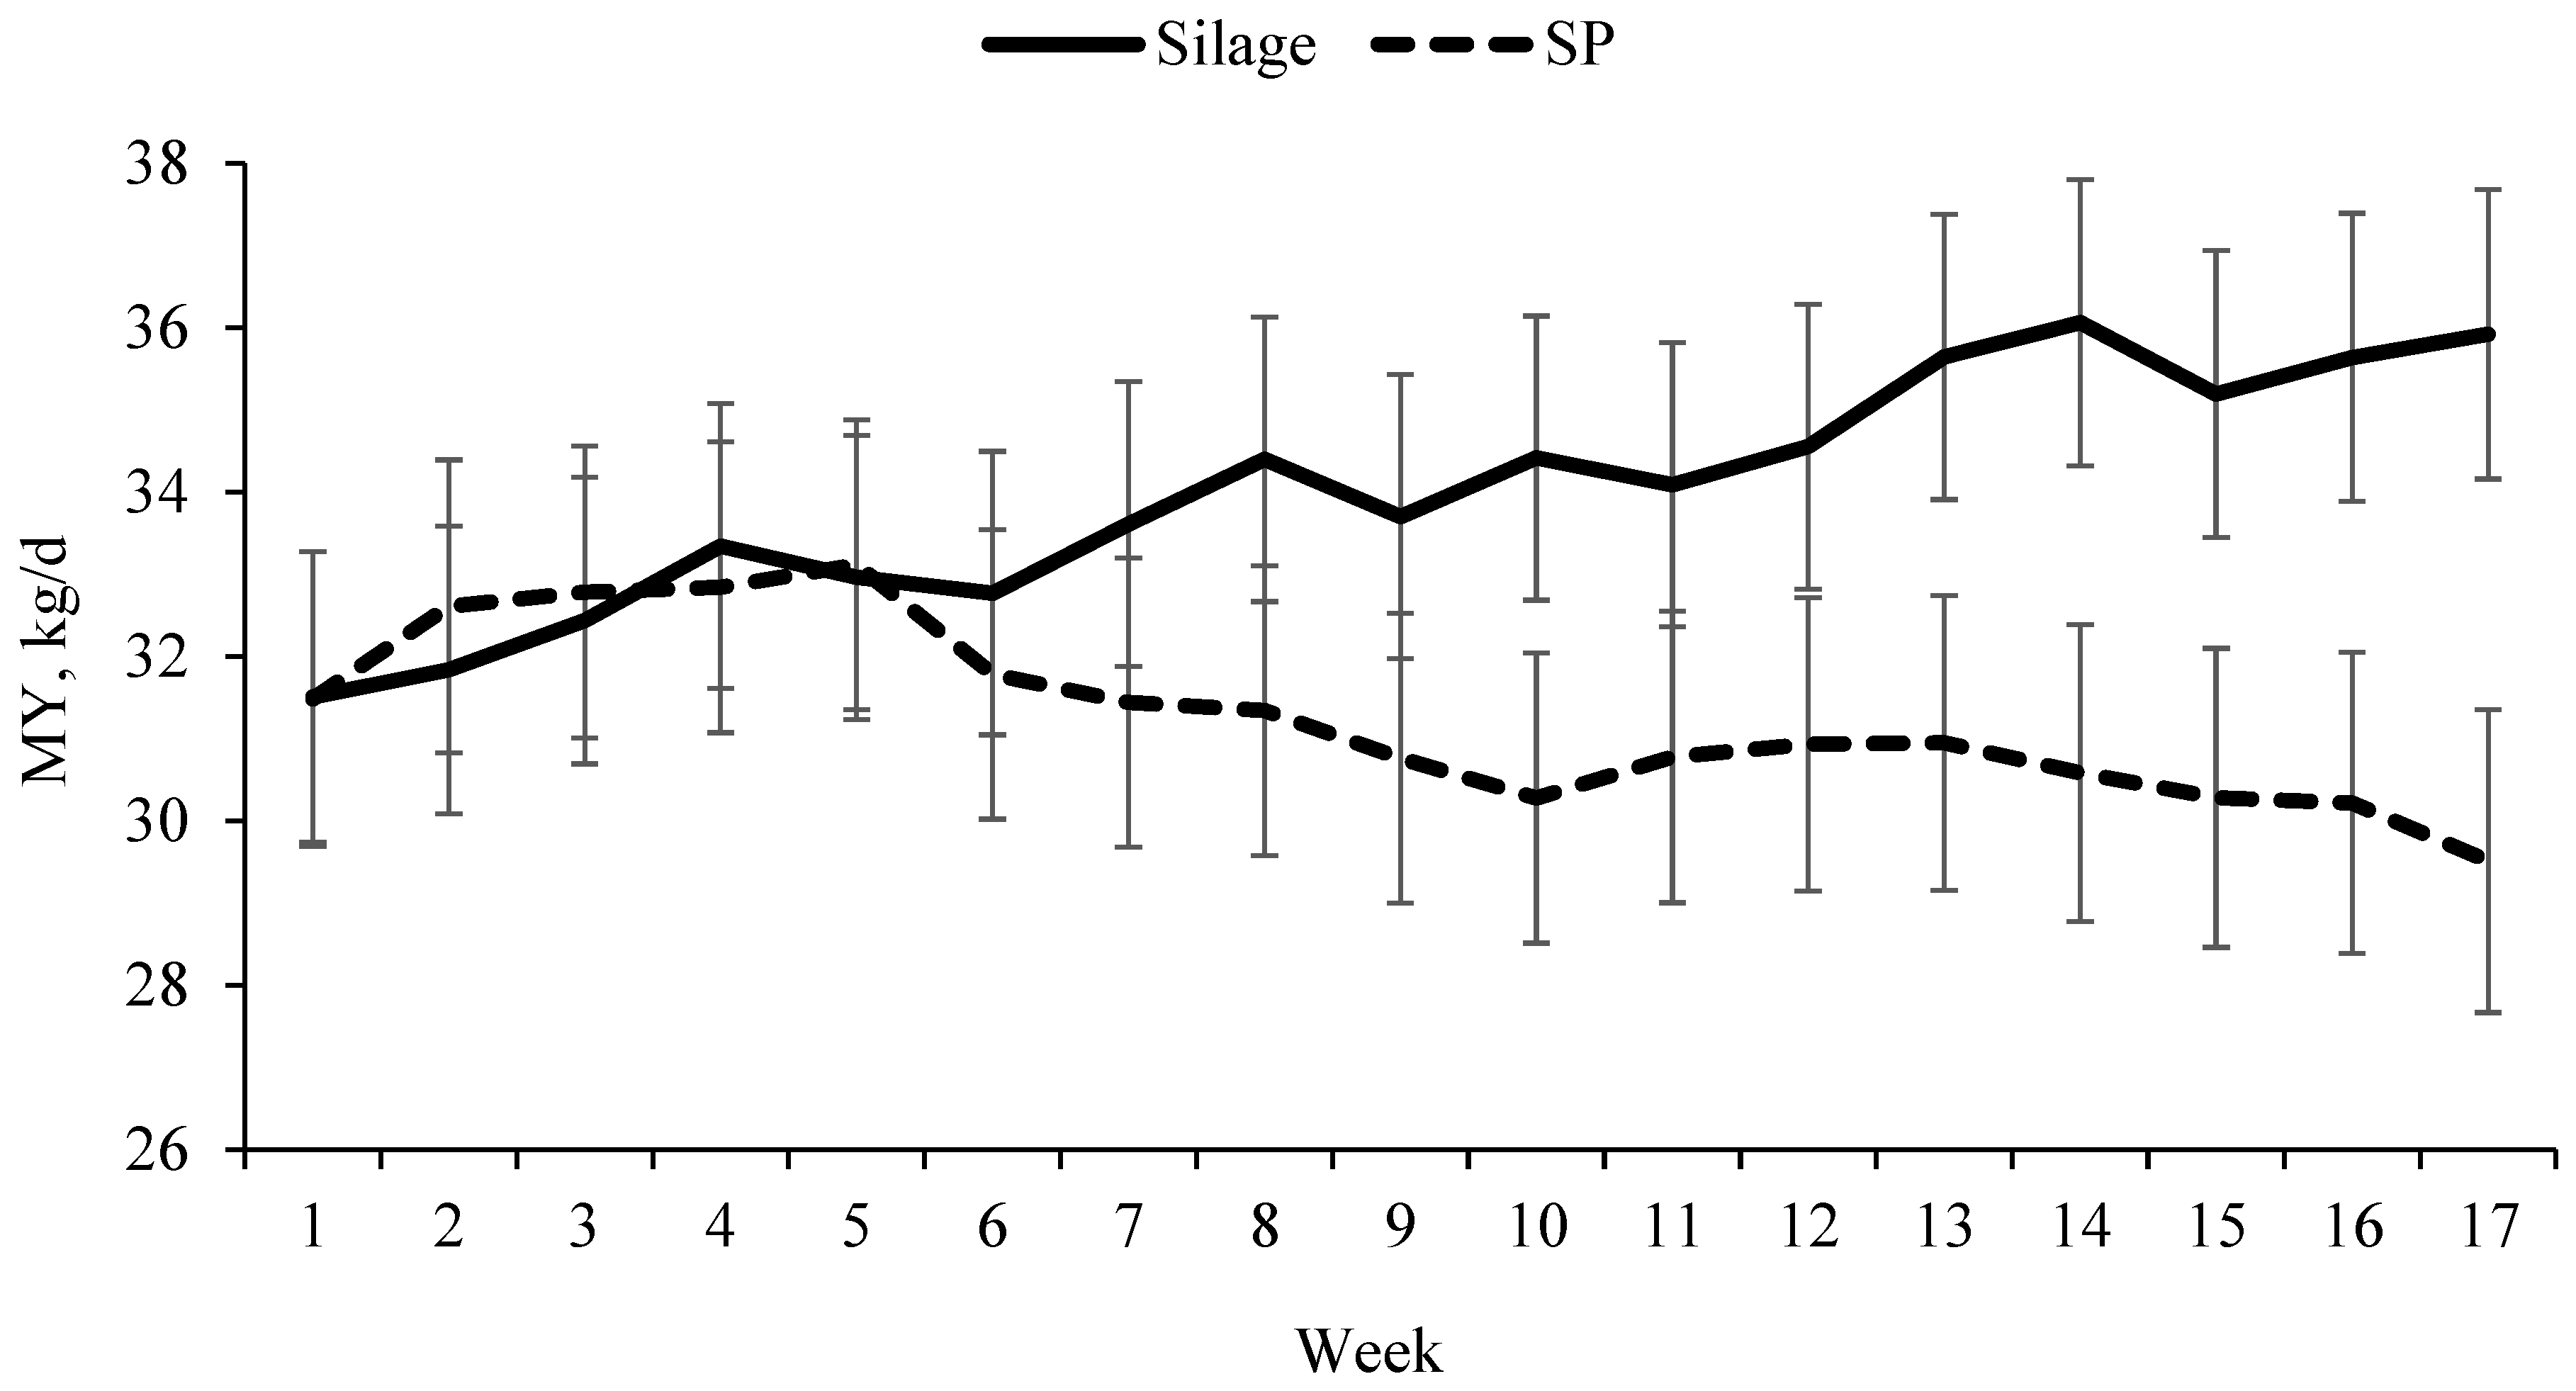
On the other hand, the dietary forage NDF concentration was 9.1% higher in the SP-based diet (310 g/kg DM) compared to the silage-based diet (284 g/kg DM), while the DMI and milk production decreased at similar proportions, where DMI decreased by 8.2%, MY by 8% and ECM yield by 12% for cows receiving the SP-based diet compared to cows receiving the silage-based diet. In a recent meta-regression study, Allen et al. [
21] evaluated the effect of dietary filling factors on lactating cows and observed that dietary forage NDF concentration was negatively correlated with DMI and MY. According to Allen [
7], the dietary forage NDF concentration is the main factor limiting intake when intake is regulated by fill capacity of the rumen due to its slow passage rate. To our understanding, the effect of treatments on intake and milk production was more related to the diet formulation than to the forage source itself, suggesting that if SP and silage were included in the diet at the same forage NDF concentration cows would likely present a similar intake and milk production.
Silage pulp is a byproduct and its utilization in diets of lactating dairy cows should be performed with caution. In case of complete substitution of silage for SP, the inclusion of forage should be based on the dietary forage NDF concentration, otherwise intake can be compromised. If the forage to concentrate ratio cannot be reduced to meet a proper dietary forage NDF concentration in the diet, as in the present study due to the organic production regulations, the complete replacement of silage for SP is not recommended. Another alternative to use SP in the diet of dairy cows is to partially include it by mixing with silage. Savonen et al. [
5] compared diets that substituted 0.25 or 0.50 (DM basis) of the silage with SP to a diet containing only silage as forage. The authors observed that the substitution of 50% of the silage for SP did not affect DMI or MY, but there was a tendency of lower ECM when compared to the silage-based diet. However, when 25% of the silage was substituted by SP, no difference was reported on MY or ECM but intake was greater, reducing its feed efficiency when compared to the silage-based diet. The authors concluded that the reduction in performance was considered mild and SP can be partially included in the diet of dairy cows if there is a reduced feed cost associated.
The milk composition between treatments was similar throughout the current study, however, as MY was generally greater for cows fed the silage-based diet, yields of milk components were greater than when cows received the SP-based diet. Body weight and BCS were not affected by the treatments throughout the study, suggesting that milk production was supported by the diets only and body reserves were preserved. We hypothesized that the mechanical pressing during silage juice extraction would increase the digestibility of the fibre in the SP, resulting in greater NDF digestibility that could compensate for the greater NDF content. However, there was no difference in NDF digestibility between silage and SP, and the greater in vitro OM digestibility observed in the silage was basically related to the greater concentrations of CP and WSC, and greater proportion of protein Fraction A, which has rapid and complete rumen degradation, compared to SP. Similar results were observed by Savonen et al. [
5] when SP replaced 50% (DM basis) of the dietary silage. The authors evaluated the apparent total tract digestibility in dairy cows using indigestible NDF as internal marker and reported that there was no difference in NDF digestibility between forages, but OM digestibility was greater for silage compared to the silage-SP mixture [
5].
The smaller concentration of CP observed in SP was caused by the loss of nonprotein nitrogen (Fraction A) during the mechanical pressing, which increased the proportion of rumen undegradable protein. Nonprotein nitrogen represents the majority of CP in silage [
22], which easily and extensively can be hydrolyzed to ammonia in the rumen [
23], reducing the efficiency of nitrogen utilization that increases urinary excretion by ruminants [
24]. Thus, the reduction of nonprotein nitrogen concentration in SP compared to the original silage might benefit not only the ruminant nutrition, but also the environmental concerns related to livestock waste.
In conclusion, the mechanical pressing process did not increase fibre digestibility in SP, thus, the complete substitution of silage for SP reduced the milk production of dairy cows over time.


