Abstract
In rice–wheat rotation areas of China, traditional wheat seeders have severe blockage, low working efficiency and poor seeding quality. In this study, a pneumatic shooting technology was designed, consisting mainly of a nozzle, shell and acceleration tube. To improve the sowing depth of the pneumatic shooting device, the response-surface methodology of structure parameters and CFD simulation technology was adopted in this work. The effects of working pressure, acceleration-tube diameter and throat distance on the steady airflow length (SAL) and steady airflow velocity (SAV) were studied by airflow field analysis, and the response-surface method was introduced to obtain the optimal parameter combination of the pneumatic shooting device for wheat. The optimal parameter combination was working pressure 686 kPa, acceleration tube diameter 8 mm and throat distance 20 mm. The simulation result showed that the optimized device of pneumatic shooting performs faster and has more stable airflow field characteristics in comparison to the initial device. The field test demonstrated that the optimized device has about 68% higher seeding depth than the initial device. The average field-seeding depth of the optimized device was 19.95 mm, which is about 68% higher than the initial device. The emergence rate for the optimized device was about 88.7% without obvious reduction. CFD and response-surface methods positively affect the optimization of pneumatic wheat-shooting devices, and the significance was also confirmed.
1. Introduction
As one of the three major grain crops in China, wheat plays a vital role in ensuring national food security. According to the National Bureau of Statistics data, wheat yield in China will be 131.68 million tons in 2020 [1], accounting for about 17% of the world wheat production. Rice–wheat rotation areas located in the Yangtze River Basin are reported as the primary grain-production bases in China, accounting for more than 37% of total wheat-planting areas [2]. Due to the sticky clay soil texture and serious wet damage of the fields in this area, there is a severe blockage, low working efficiency and poor seeding quality for the existing rice-stubble wheat seeders [3,4,5,6]. Therefore, it is essential to innovate mechanized sowing technology and improve wheat-sowing quality in rice–wheat rotation areas.
Different from traditional seeding equipment, wheat-shooting technology is not in direct contact with the soil [7]. It has the advantages of no adhesion and blockage, minor soil disturbance and high operation efficiency [8,9]. Wheat-shooting technology includes two types: mechanical shooting and pneumatic shooting. Because of accurate operation and good acceleration effect, the pneumatic wheat-shooting technology is more suitable for wheat sowing in rice-stubble fields. Current research mainly focuses on the wheat soil-ripping parameters of pneumatic wheat shooting under different conditions [10], but there is little study on the internal airflow field analysis and performance improvement of it. As a reliable flow-field-analysis technology, computational fluid dynamics (CFD) has a wide application in the design and research of wheat seeding [11,12,13]. Zhao Xiaoshun et al. developed a vacuum-precision, seed-metering device for wheat to improve seed-metering uniformity [14]. With the pressure and velocity simulation of the air chamber by CFD, the structural parameters of the seed-metering device were optimized. And tests showed that the seeding qualified rate of seedlings was 86.66%, and the unqualified rate of seedlings was 5.09%, which meets wheat-precision drilling requirements. Liu Junxiao et al. analyzed the pneumatic loss caused by narrow, long characteristics, and bending of the pinhole-tube wheat uniform-seeding mechanism [15]. The Fluent software was applied to study the airflow pressure variation of different parameter combinations under the orthogonal simulation test, and the principle and types of pneumatic loss were clarified. Test results proved the reliability of the numerical analysis. With the assistance of the fluid-dynamics software, Cheng Xiupei et al. simulated the impacts of different diameters of suction holes on the airflow field of the precision seed-metering device for wheat and thereby produced the optimal diameter parameters of suction holes ranging from 1.4 mm to 1.8 mm [16].
Improving the sowing depth of the pneumatic shooting device is important to ensure wheat-sowing quality. In this paper, CFD is used to study the airflow field of the pneumatic wheat-shooting device (PWSD), aiming at improving acceleration performance. For this purpose, much work was carried out by the kinematic and simulation analysis for the response-surface optimization experiment. We established simulation models based on kinematic analysis of the pneumatic shooting process and acquired the best parameters’ combination via the response-surface experiment. Finally, field-test verification of the optimized PWSD was conducted.
2. Materials and Methods
2.1. Structure and Working Principle of the PWSD
Figure 1a displays the overall structure of the PWSD [17], and the device is mainly composed of nozzle, shell and acceleration tube. The nozzle and acceleration tube were arranged on the interior and bottom of the shell, respectively.
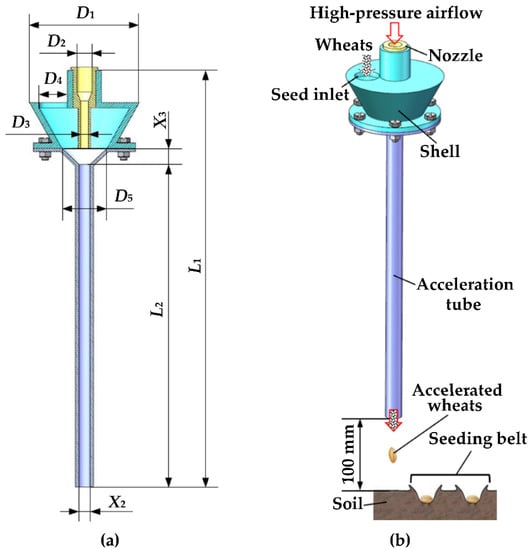
Figure 1.
(a) Structure of the PWSD. (b) Pneumatic shooting principle.
The pneumatic wheat-shooting principle is shown in Figure 1b. Before sowing, the ground distance from the bottom of the acceleration tube to the soil surface is 100 mm. After the high-pressure airflow enters the pneumatic wheat-shooting device, a supersonic jet-flow field is formed in its internal cavity. Firstly, the high-pressure airflow enters the nozzle and is compressed to form a compressed airflow. The compressed airflow is ejected from the nozzle to form a jet flow after that. Then the jet flow enters the acceleration tube to develop a positive-pressure acceleration zone. Meanwhile, a vacuum-pressure zone is produced in the shell. Wheat is inhaled into the shell under the entrainment of the vacuum-pressure zone [18,19], and then it is continuously accelerated under the action of the positive-pressure acceleration zone in the acceleration tube. Finally, the wheat with high kinetic energy is shot out from the acceleration tube and is lodged into the soil to complete wheat seeding. With the forward thrust of the seeder, a sowing belt composed of single wheat-seed holes is formed in the soil. Table 1 displays the geometric information of the PWSD.

Table 1.
Geometric information of the PWSD.
2.2. Optimization of PWSD Based on Airflow Simulation
To improve the performance of the PWSD, both a computational analysis and an optimization experimental study were carried out [20,21]. The optimization experiment was designed by a response-surface method, and the internal airflow-field characteristics were acquired by CFD.
2.2.1. Experimental Design
The response-surface optimization experiment of the three factors and three levels, based on the single-factor test results [22], was conducted by Box-Behnken central composite design [23,24,25]. The influence of the working pressure X1, the acceleration tube diameter X2 and the throat distance X3 on SAV Y1 and SAL (length of the region with steady airflow velocity) Y2 were analyzed under the different parameter combinations. There were 17 experimental groups in the response-surface experiment scheme. After the experiment, the velocity curve of the central airflow field of the PWSD was extracted, followed by two kinds of analysis: multiple regression fitting analysis and variance analysis. The optimal combination parameters of the PWSD were predicted. The coding of factor levels is shown in Table 2.
Table 2.
Factor level coding.
2.2.2. Construction of Simulation Model
Grid Model
The grid features and extraction of the computational domain are crucial and determine the results of the flow-field analysis [26,27]. SolidWorks 2016 software was adopted to construct the various three-dimensional PWSD models. Then the internal cavity was extracted as the computational domain using SpaceClaim 18.2 software, as shown in Figure 2a. The pressure inlet boundary was given on inlet 1 based on the working pressure of the experiment design scheme, and on inlet 2 with the relative pressure value of 0 kPa. The pressure outlet boundary was given on outlet 1 with the relative pressure value of 0 kPa. All the walls were no-slip wall boundaries. CFD cells of computational domain meshed by Fluent 18.2 software were employed as shown in Figure 2b. According to the structure size of the computational domain in globally scoped sizing, the minimum element size and the maximum element size of the mesh models were 0.2 mm and 30 mm, respectively. The growth rate was 1.2, and the grid type was polyhedral mesh. In addition, curvature function was selected for object faces, and edges and the normal angle was set at 15°; cells per gap was set at 10 in proximity for the edge zone to increase local mesh density, which is because the gas expansion at the nozzle outlet leads to drastic changes in the airflow velocity [28,29]. According to the wall function requirement of the turbulence model, five boundary layers were set near the wall. Statistical data pointed out that the maximum aspect ratio, the y+, and the minimum orthogonal quality of all simulation models were controlled in the range of 19–27, 30–280, and 0.5–0.62, respectively.
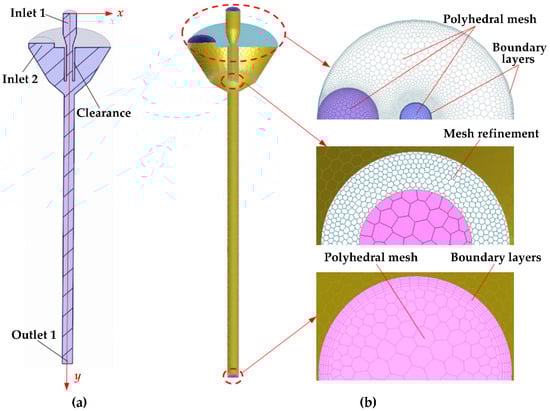
Figure 2.
(a) Computational region of the PWSD. (b) Grids of the computational region.
Computational Model
Due to the supersonic speed of airflow in the PWSD, this study defined the airflow as a continuous compressible phase. The following three equations expressed the basic control equations in the CFD simulations represented by the mass and momentum conservation equation and the energy equation [30]:
where xi, xj, and xk are the components of Cartesian coordinates; ui, uj, and uk are the mean airflow-velocity components; τij is the stress tensor of airflow; ρ is the density of airflow; qi is the heat flux; μ is the viscosity of airflow; p is the mean airflow pressure; Fi is the body-force of airflow; E is the total airflow energy.
Taking the jet-flow characteristics of narrow and long pipes into consideration, the RNG k-ε model was used in this study. The follow two equations displayed the turbulent kinetic energy and turbulent dissipation:
where k is the turbulent kinetic energy; ε is the turbulent dissipation rate; μc is the equivalent coefficient; αk and αε are the airflow Prandtl numbers; Gv is the velocity gradient; C1ε and C2ε are the empirical constants.
The SIMPLE algorithm was adopted to access the pressure–velocity coupling in the simulation [31]. The turbulent kinetic energy was solved by using the second order upwind and finally to improve the computational accuracy. The simulation converges after the RMS residual were less than 1 × 10⁻⁴ and airflow velocity of inlet 1 reached steady state.
3. Results and Analysis
Table 3 presents the response-surface experiment combinations and results.
Table 3.
Experiment combinations and results.
Figure 3 shows the velocity variation regularity of the central airflow field (y-axis) for each group after simulation.
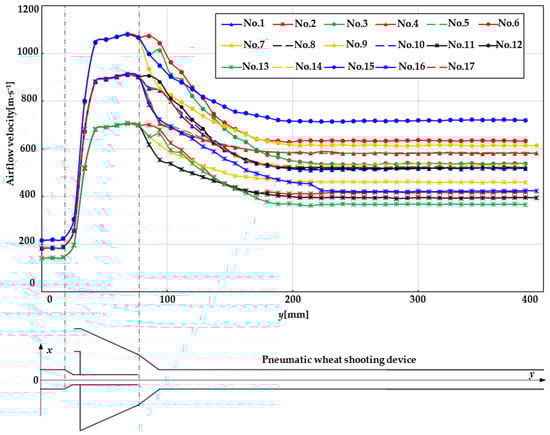
Figure 3.
Velocity curve of central airflow field.
Overall, the central airflow velocity showed a sharp increase to a maximum value when y was 23–75 mm, because the high-pressure airflow was compressed [32] as it passed through the nozzle. The airflow velocity presented a gradual decrease trend in the y range of 75–220 mm, and the reason is that the airflow was ejected from the nozzle to produce an air-expansion effect [33]. Finally, the airflow velocity remained relatively constant in the acceleration tube. The steady airflow velocity was between the maximum airflow velocity and the high-pressure airflow velocity for each experiment. The higher the high-pressure airflow velocity, the greater the maximum airflow velocity. Table 3 lists the response values of Y1 and Y2 that were measured based on Figure 3, and the interaction law between Y1, Y2 and X1, X2, X3 was analyzed.
3.1. Regression Model Construction
The two-factor interactive (2FI) regression model presenting the interactive influences of X1, X2, X3 on Y1, Y2 was established based on Table 3. The regression equations are expressed as:
Table 4 reveals the variance analysis of the regression equations. There was a highly significant level (p < 0.001) for the 2FI regression model of Y1, Y2. The significant level (p > 0.05) of the lack of fit for all 2FI regression models implies a relatively good fitting degree in the range of the experimental parameters. Therefore, by using the 2FI regression model of Y1 and Y2, the working and structural parameters of the PWSD can be analyzed and predicted.
Table 4.
Variance analysis of 2FI regression equation.
On the angle of the main effect, X1, X2 and X3 had highly significant effects on Y1, while X1 and X2 significantly affected Y2. On the angle of the interaction effects, the interactive factor X1X2 performed a highly significant effect on Y1, and X2X3 displayed a highly significant effect on Y1 and Y2. However, X1X3 displayed no significant effect on Y1 and Y2. Consequently, the 2FI regression models were optimized to remove the insignificant items on the conditions if p < 0.01 for the model and p > 0.05 for the lack of fit (Equations (8) and (9)).
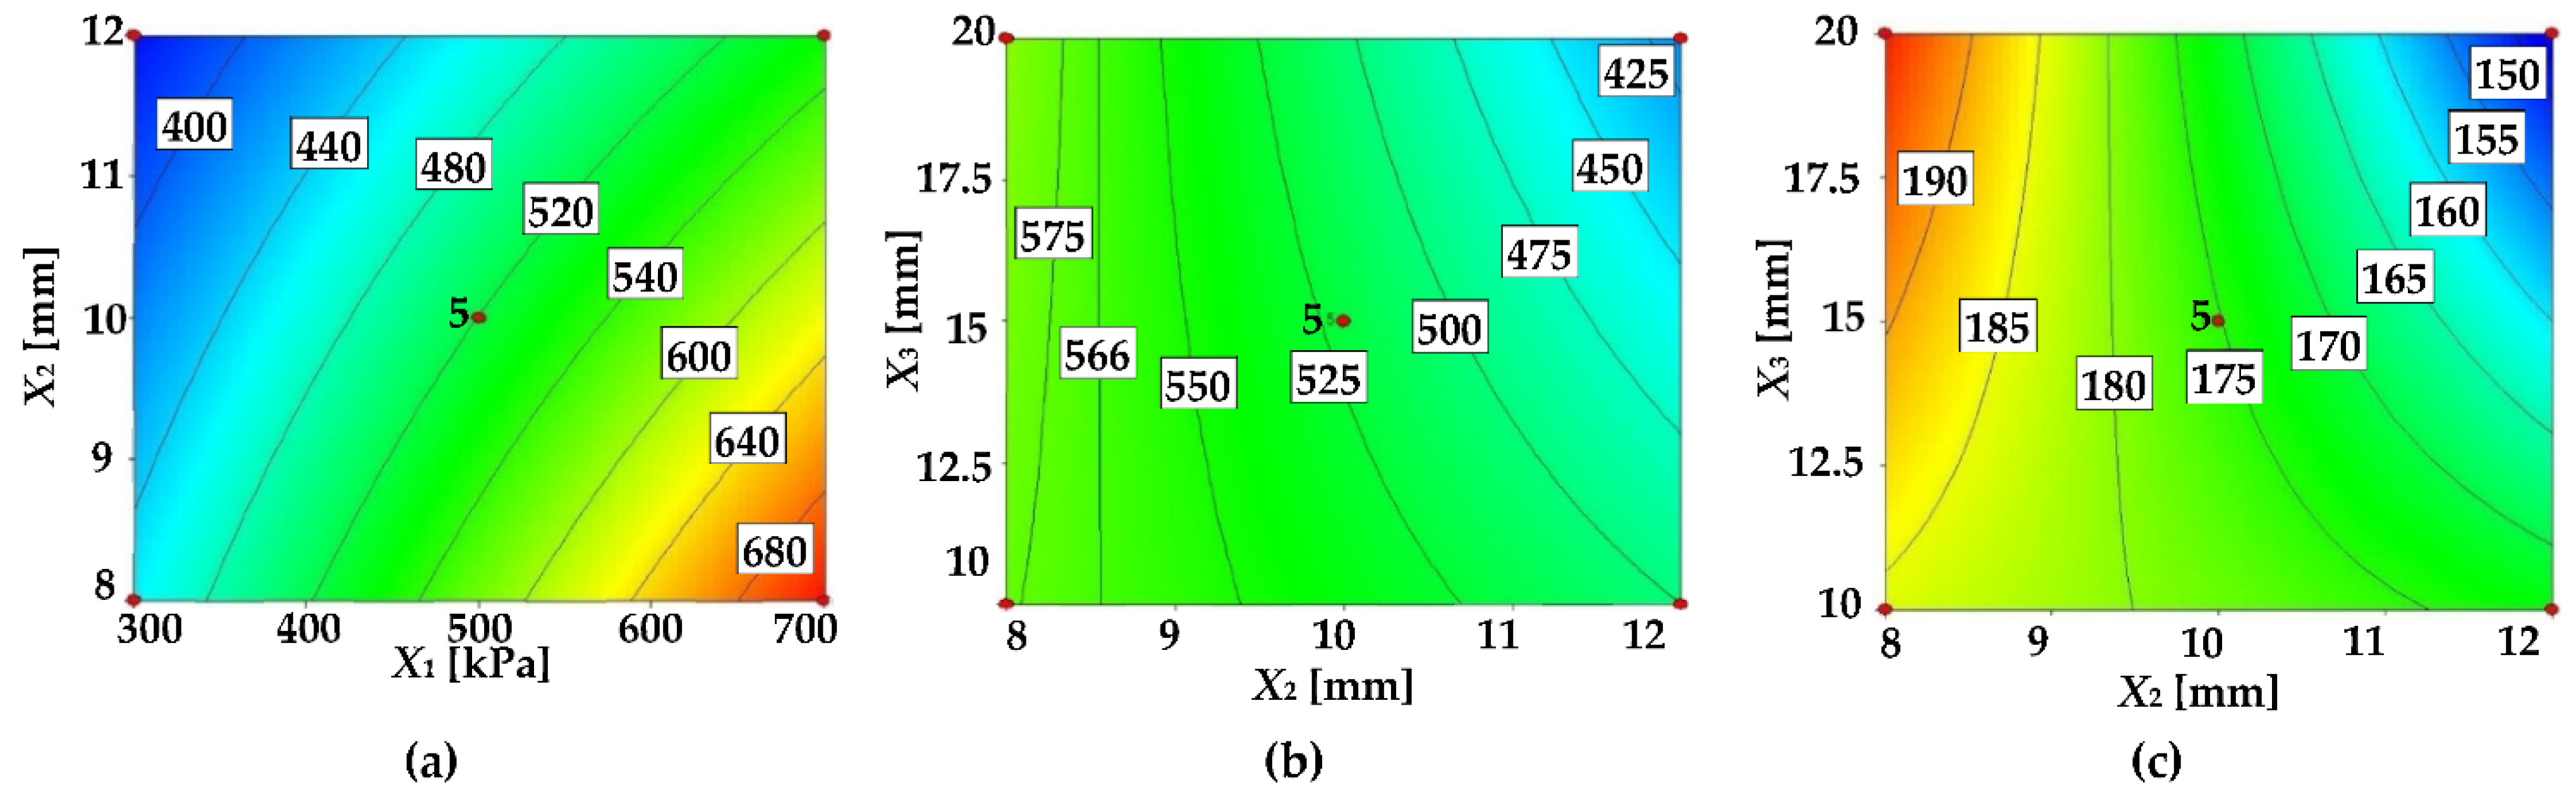
3.2. Influences of the Interactive Factors on Indexes
Based on the significance analysis results (Table 4), this study separately analyzed the influences of the interactive factors X1X2, X1X3 and X2X3 on Y1 and Y2. The interaction of X1 and X2 on Y1 with X3 = 15 mm is shown in Figure 4a. X1 and X2 were all positively correlated with Y1. Increasing X1 and reducing X2 was conducive to improving Y1. The reason is that the initial airflow of high-pressure airflow increased as X1 increased, and the airflow was compressed with the decreasing of X2, which resulted in an improvement in Y1. The interaction of X2 and X3 on Y1 with X1 = 500 kPa is shown in Figure 4b. Y1 gradually increased with X1 under the same X3 level. X3 had a positive correlation with Y1 when X2 was 8–8.6 mm, but a negative correlation when X2 was 8.6–12 mm. This is because there was an optimal X3 value, so the final section of jet flow was equal to X2 [34,35], and then the optimal airflow field could be obtained. Therefore, an optimal parameter combination of X1, X2 and X3 maximized Y1.
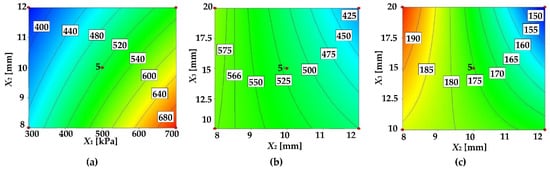
Figure 4.
Interaction analysis of significant interactive factor. (a) Y1 = f(X1,X2,0). (b) Y1 = f(0,X2,X3). (c) Y2 = f(0,X2,X3).
The interaction of X2 and X3 on Y2 with X1 = 500 kPa is shown in Figure 4c. Y2 decreased with the increase of X2 under the same X3 level. In addition, there was a negative correlation between X3 and Y2 as X2 was 8–9.5 mm and a positive correlation with X2 was 9.5–12 mm. Hence, an optimal parameter combination of X1, X2 and X3 maximized Y2.
4. Optimization and Verification
4.1. Optimization
Combined with restraint conditions, a response-surface optimization method was applied to obtain the maximum Y1 and Y2. The restraint condition is given as:
Equations (8)–(10) are solved, and the optimal parameter combination is displayed below: X1 is 686 kPa, X2 is 8 mm and X3 is 20 mm, while Y1 is 718 m·s−1 and Y2 is 188 mm according to the 2FI regression model.
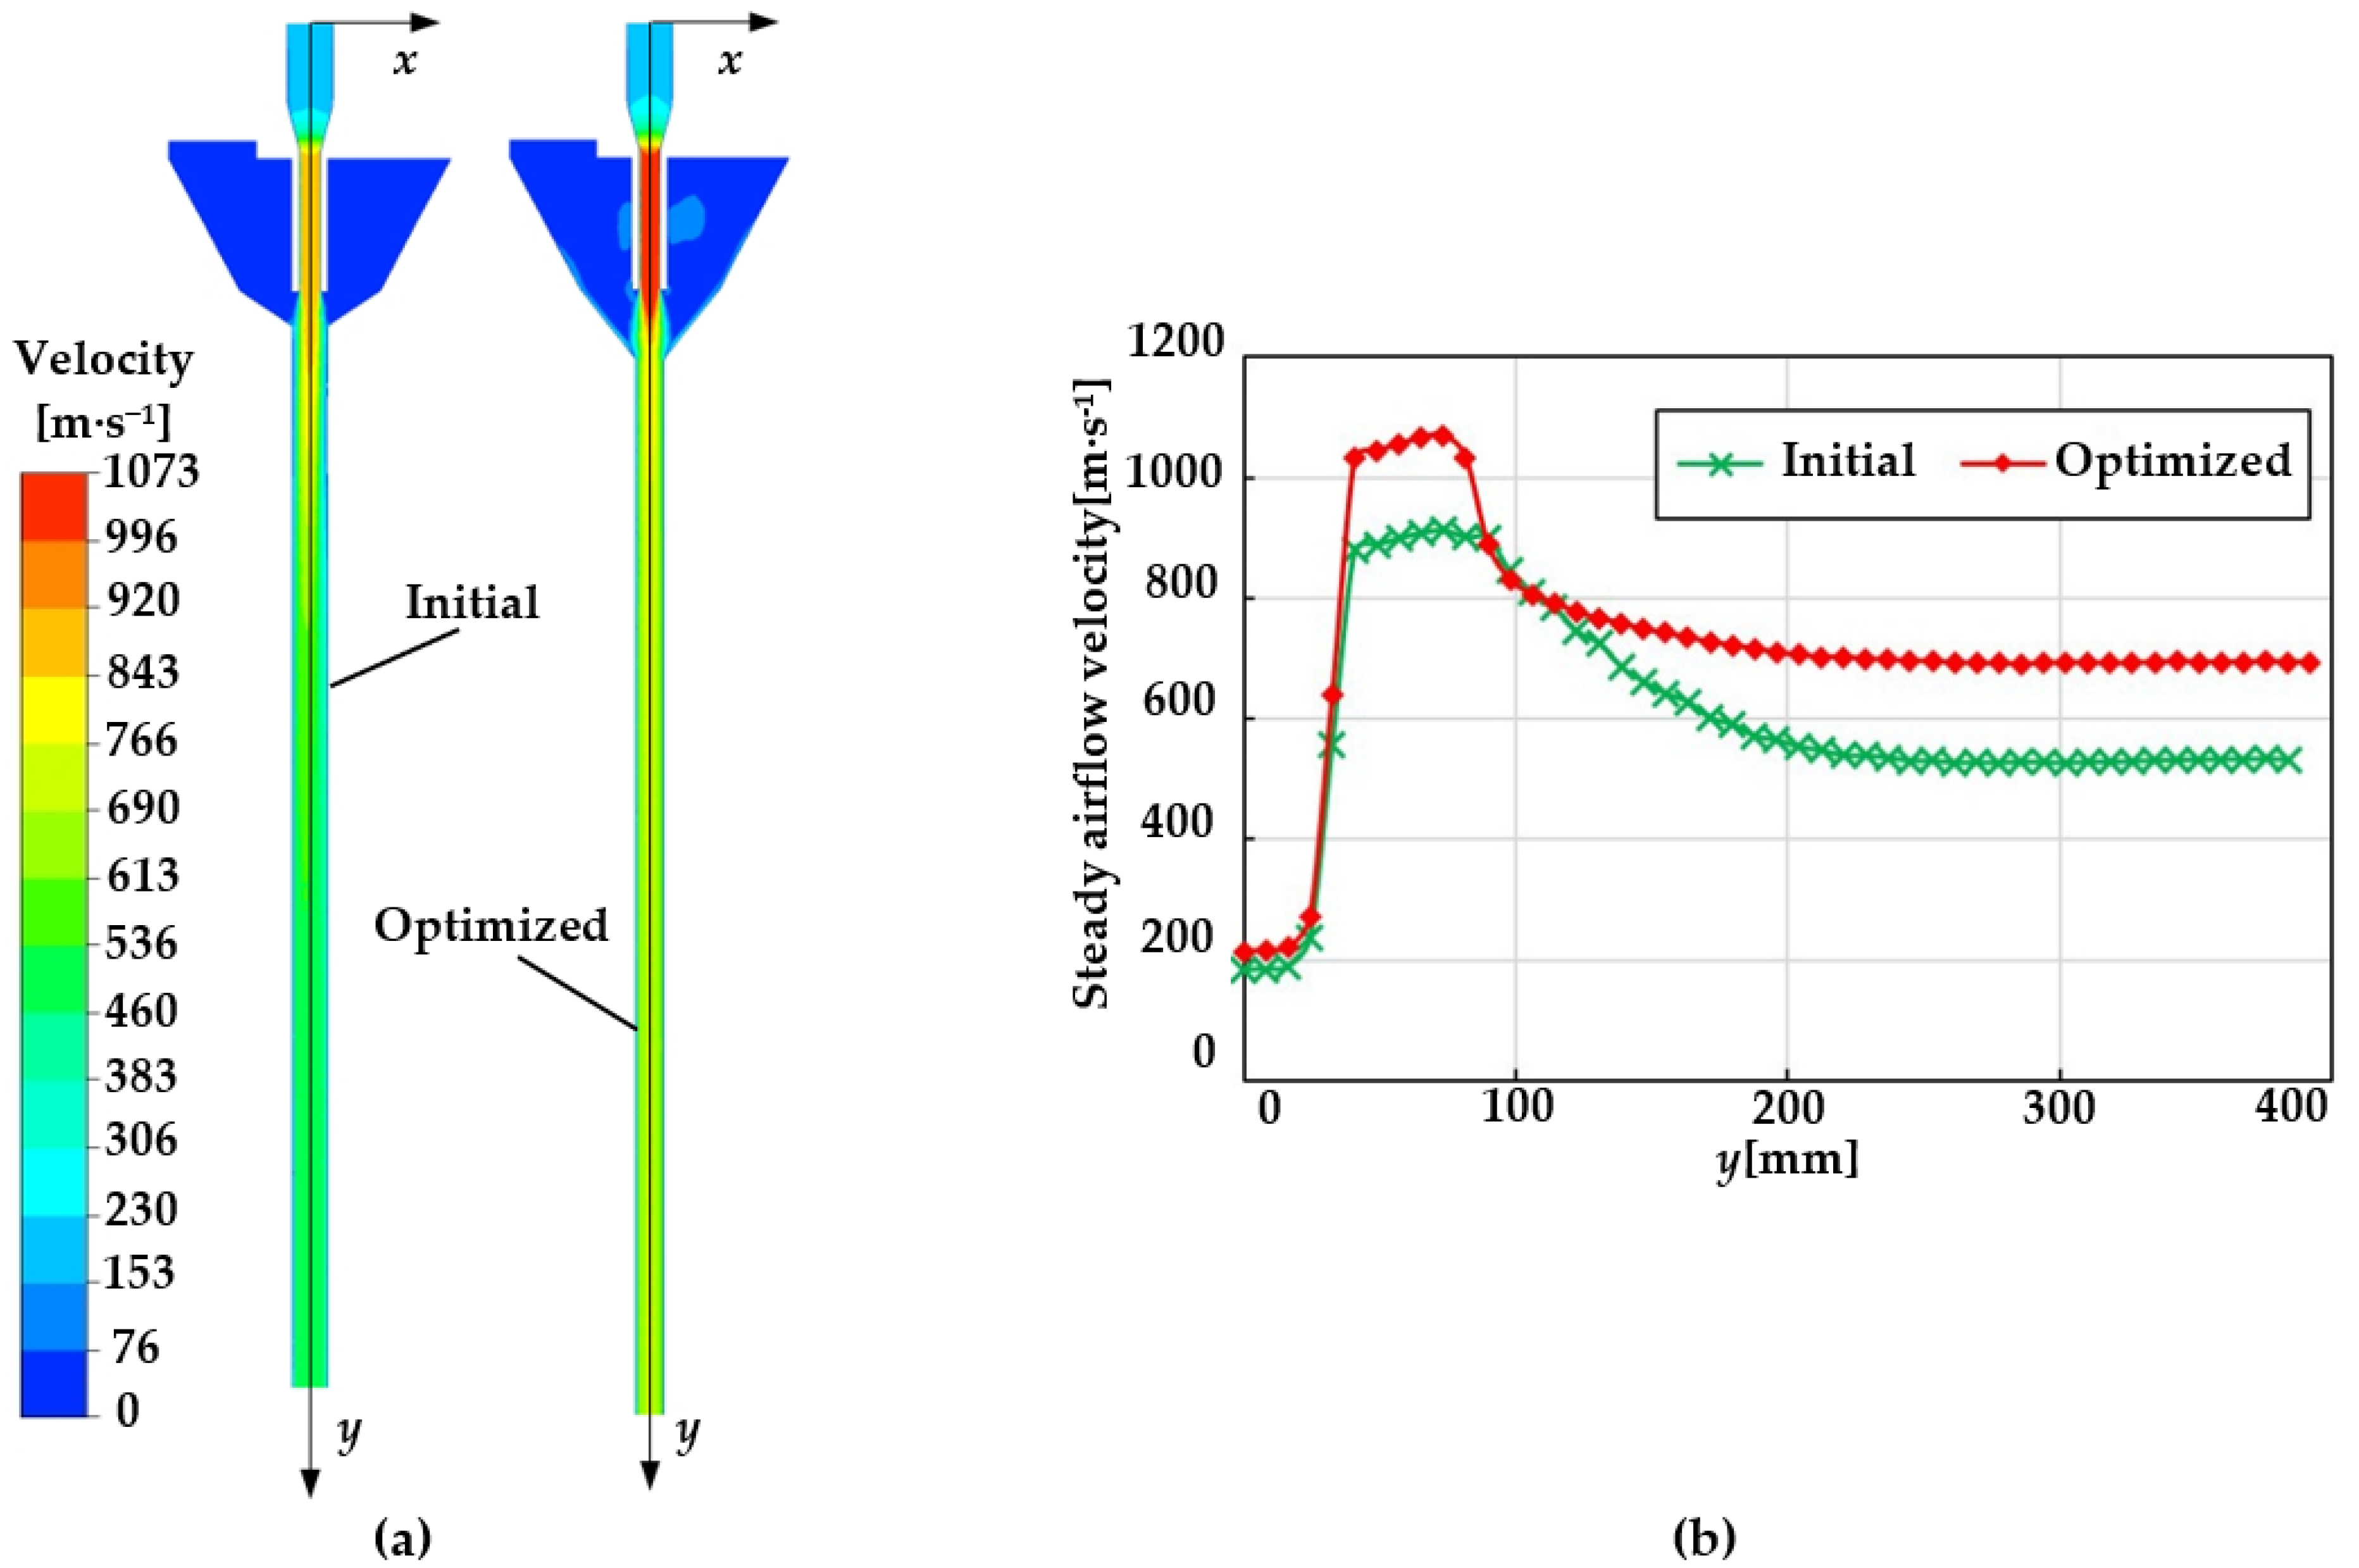
4.2. Simulation Comparison
The velocity airflow field was evaluated for the PWSD with the initial combination of parameters (X1 = 500 kPa, X2 = 10 mm, X3 = 10 mm) and the optimized combination of parameters (X1 = 686 kPa, X2 = 8 mm, X3 = 20 mm), as shown in Figure 5. The optimized device displayed superior performance of faster and more stable airflow field in relation to the initial device in general. The initial device obtained parameters of Y1 and Y2 of 524 m·s−1 and 176 mm, respectively, whereas the optimized device performance was 718 m·s−1 and 188 mm, respectively (Figure 5). After improvement of the PWSD, Y1 significantly increased by 34.5% while Y2 increased by 9.1%. Furthermore, a comparative analysis between the optimized simulation results and the predicted results of the 2FI regression model shows that there is little difference because the errors of Y1 and Y2 are 1.8% and 2.1% for the initial and optimized device, indicating that a good accuracy of the model for parameter optimization.
Figure 5.
(a) Velocity field of initial and optimized. (b) Velocity curve of initial and optimized.
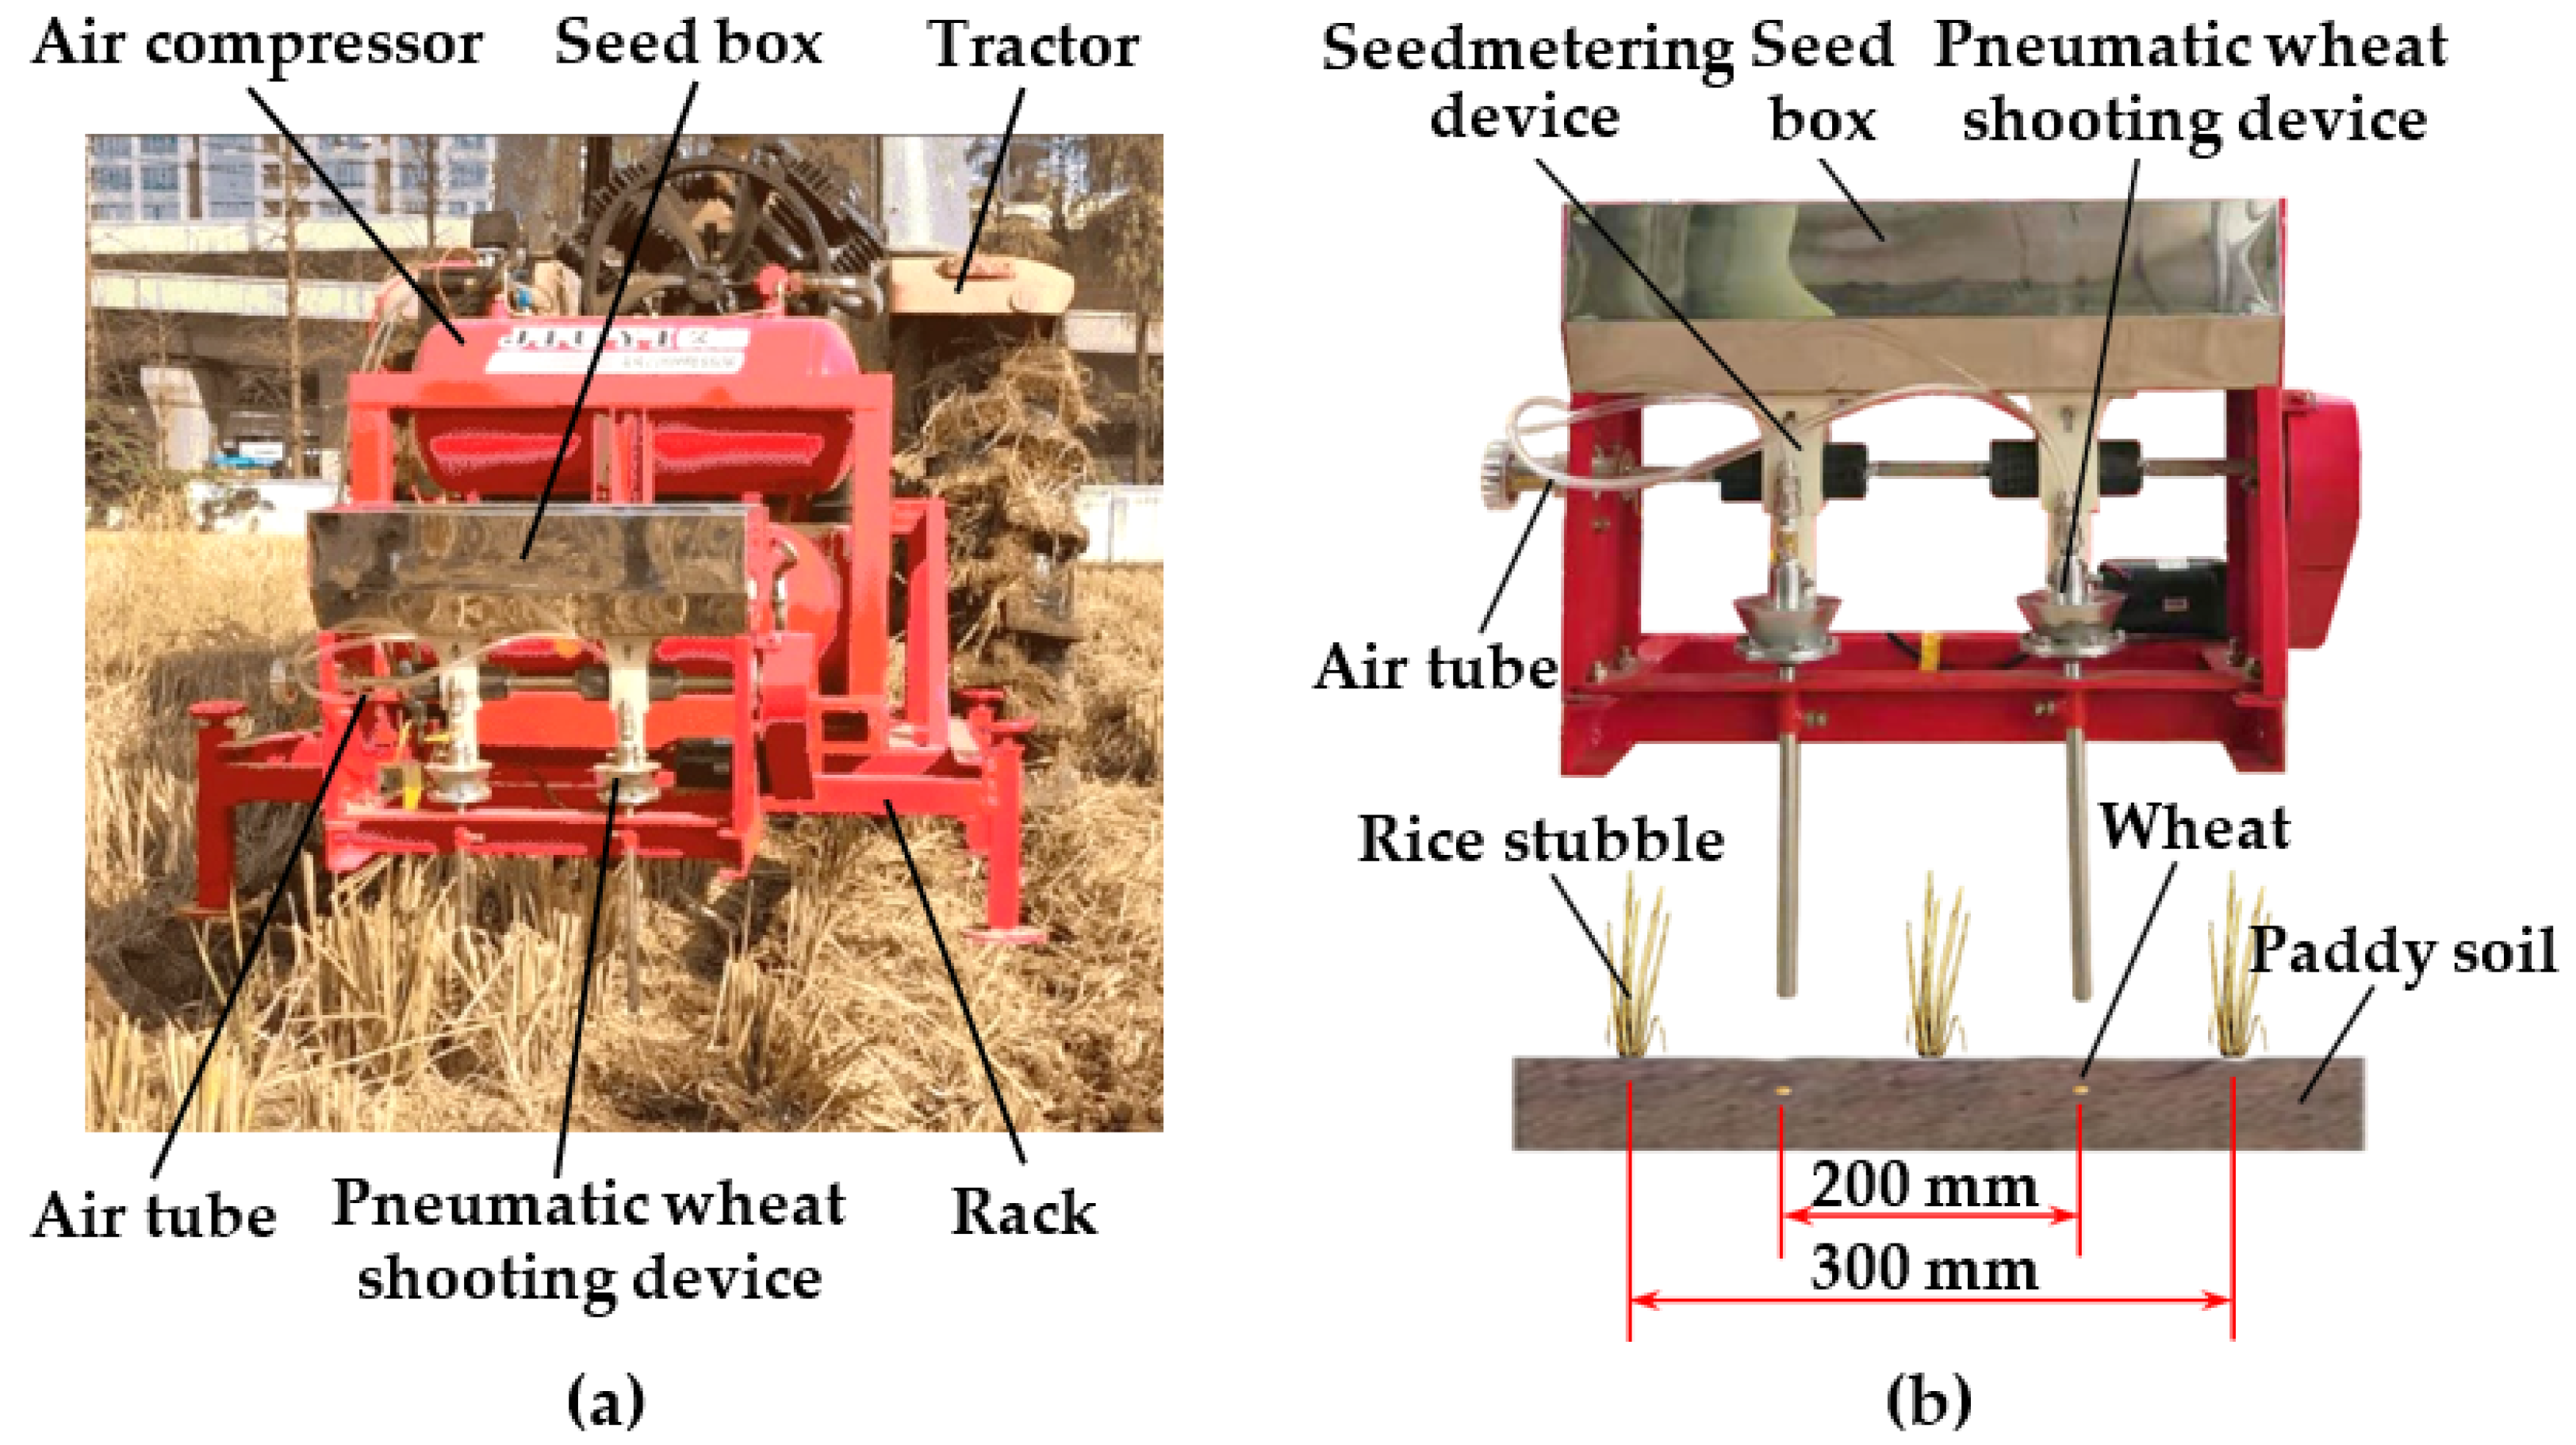
4.3. Field-Test Verification
Field-test verification of the initial and optimized devices was carried out with the pneumatic wheat-shooting principle prototype. The principle prototype comprises a rack, air compressor, air tube and PWSD, as shown in Figure 6a. We set the working pressure of the air compressor to provide continuous and stable high-pressure airflow, and the high-pressure airflow was input to the pneumatic wheat-shooting device through the air tube.
Figure 6.
(a) Structure of principle prototype of pneumatic wheat-shooting. (b) Pneumatic wheat-shooting scheme in the field.
The PWSD conducts seeding on the no-till soil between the rows of rice stubble, as shown in Figure 6b. The rice-stubble height was 200–350 mm; the coverage of rice straw was about 608 g·m−2; Zhengmai 9023, which is a large-scale planted variety of wheat in Hubei Province, was used for this test. Perennial rice–wheat rotation is conducted in this test plot, and the soil type is clayey paddy soil with heavy texture and high moisture content. The soil moisture content was 40.3%, and the soil compactness was 35–70 kPa within the soil depth of 0–50 mm.
4.3.1. Test Method
In accordance with the China National Standard GB/T 20865-2017 “No-till and less till fertilization planter” and GB/T 6973-2005 “Testing methods of single seeding drills (precision drills)”, the pneumatic wheat-shooting test was conducted. Shooting depth was measured to reflect the operating performance of the initial and optimized device.
Field Seeding Depth
The vertical distance from the bottom of the wheat seed hole to the ground surface was measured with an electronic vernier caliper, and a total of 50 seeding points were counted. A total of 5 measuring sites were selected every 5 m along the working direction, and 10 seeding-depth values were randomly measured in each measuring site. The field seeding depth and stability coefficient equations can be calculated as follows:
where HQS is field-seeding depth; HQSi is field-seeding depth of point i; SQS is the standard deviation of field-seeding depth; CQSV is the stability coefficient of the field-seeding depth.
Emergence Rate
Five test areas were randomly selected, and the wheat emergence rate was determined by the 5-point sampling method. The emergence rate equations can be calculated as follows:
where CQSM is the emergence rate; ai is the number of wheat seedlings per row; n is the measurement number; AQS is theoretical sowing rate.
4.3.2. Test Results and Analysis
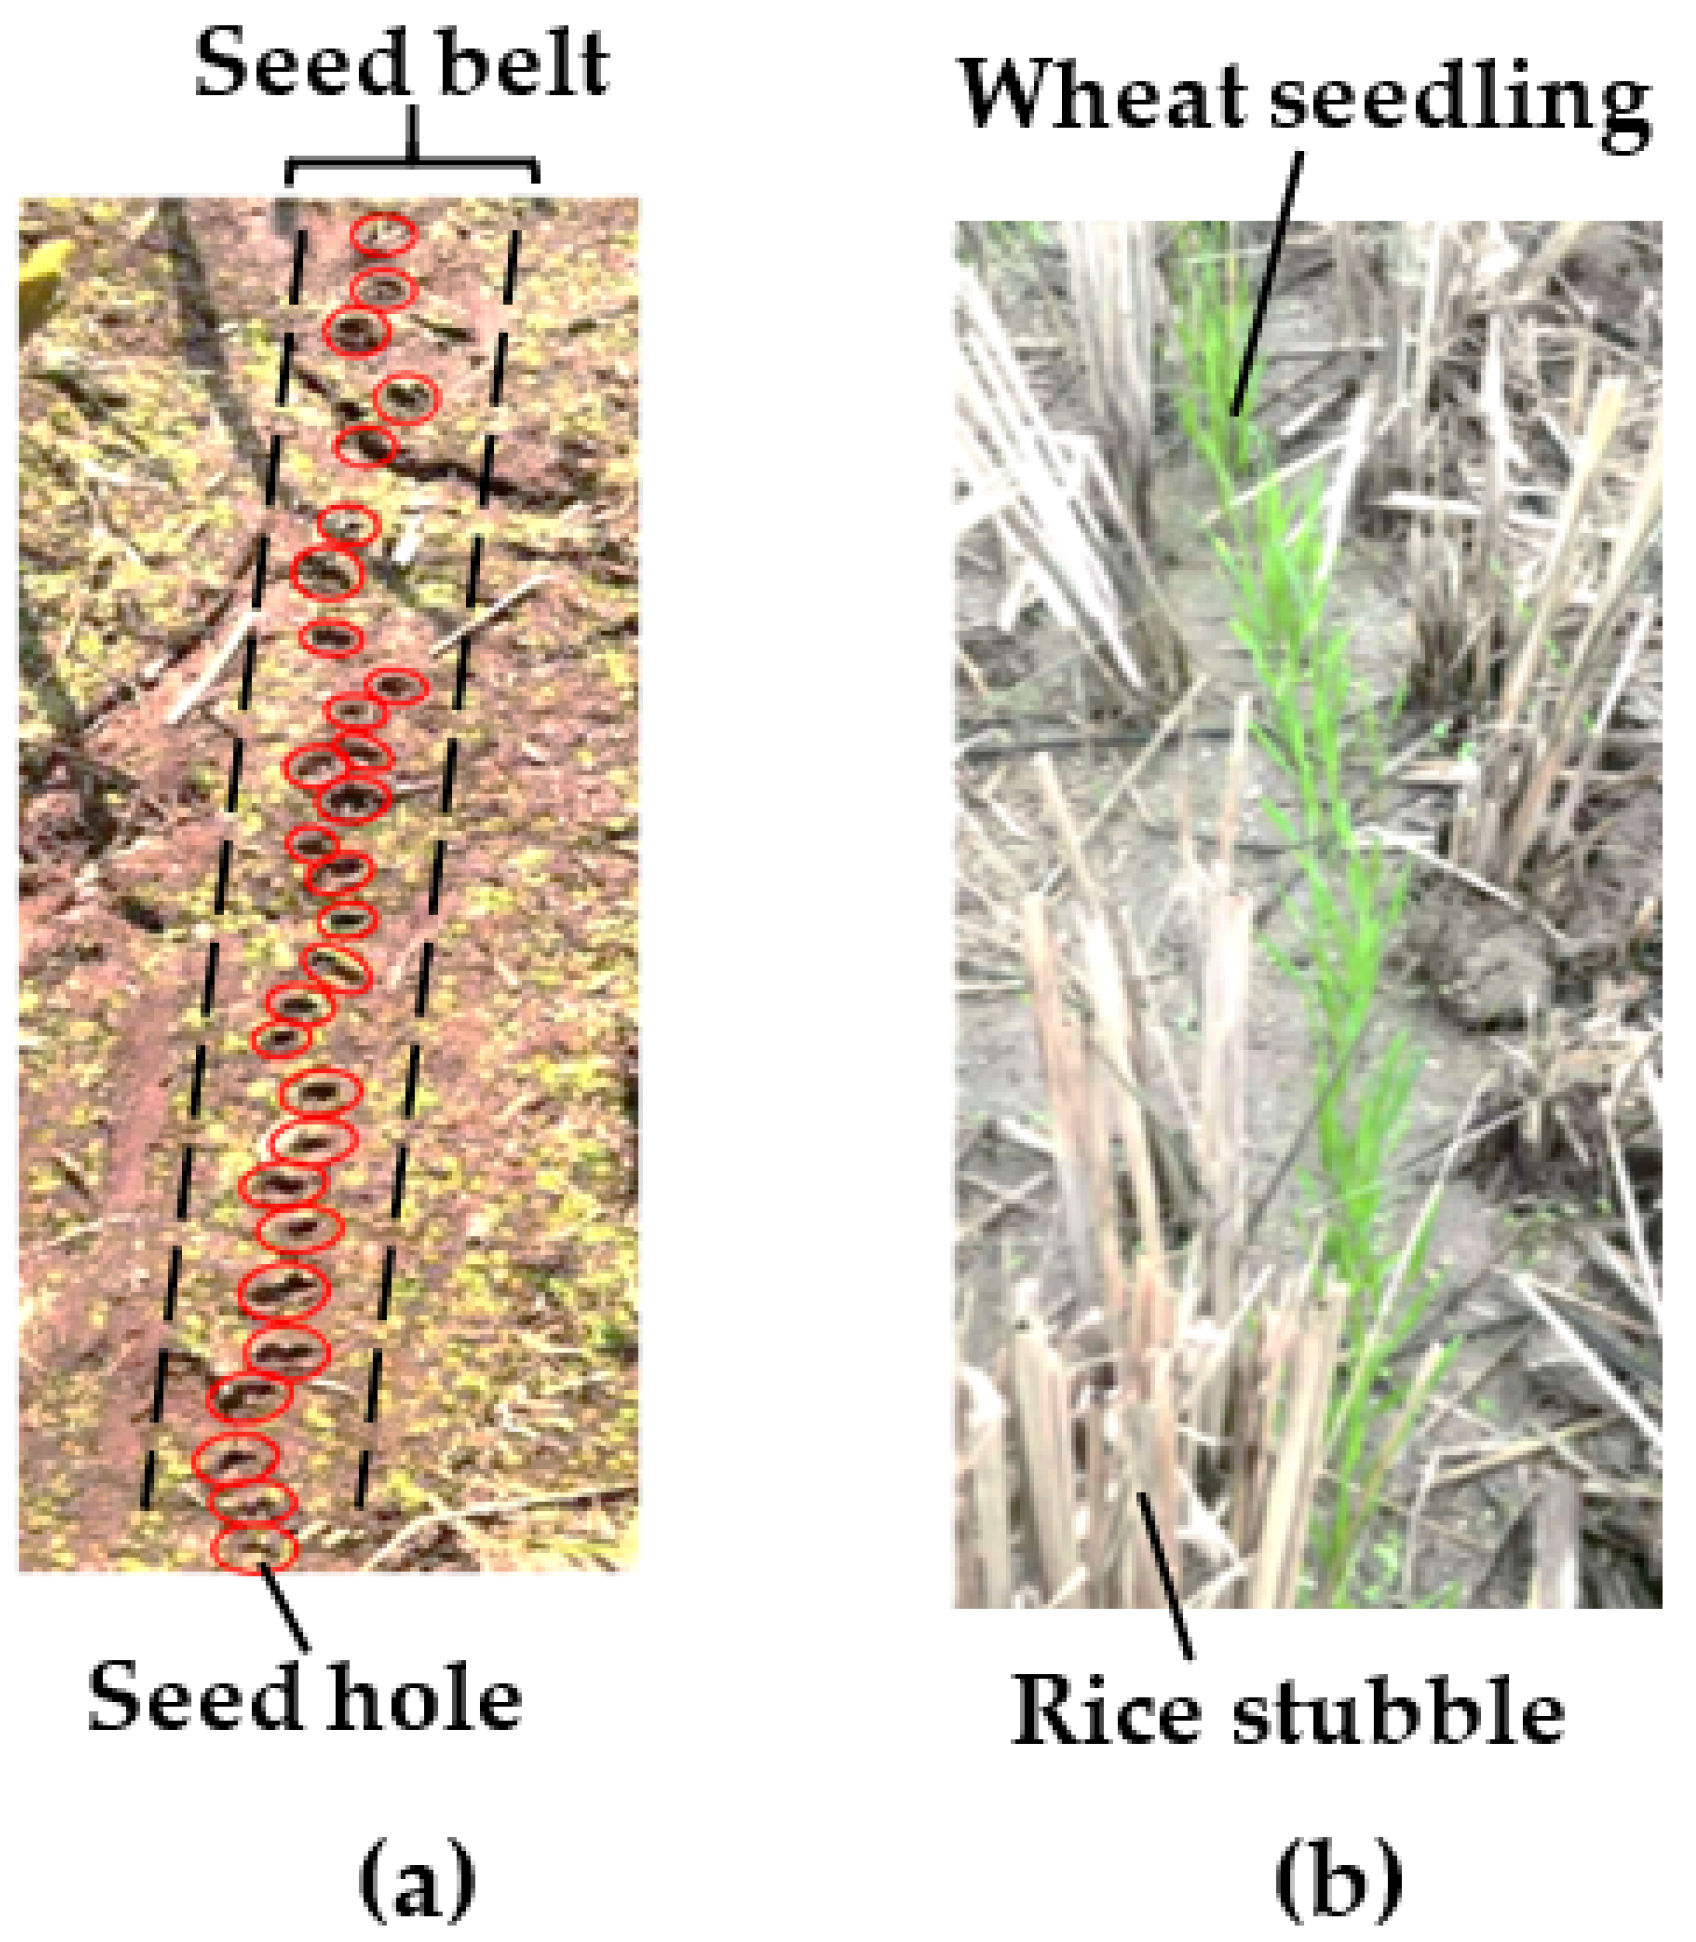
Under the field experimental conditions, the seeding operation of the pneumatic wheat-shooting principle prototype was relatively stable. The wheat was lodged into the soil and formed a single seed hole in the soil, and there was no broken strip of seed belt after pneumatic wheat shooting, as shown in Figure 7a.

Figure 7.
(a) Pneumatic wheat-shooting effect in field. (b) Seeding emergence.
Test results of pneumatic wheat seeding are shown in Table 5. The field seeding depth for the initial and optimized device was 9.96–13.12 mm and 16.24–23.74 mm, respectively. The total stability coefficients for both the initial and optimized device were more significant than 90%, which meets the requirements of Chinese national standards. The average field seeding depth of the optimized device was 19.95 mm, which was about 68% higher than the initial device, indicating that the acceleration performance of the airflow field was improved after optimization design so that wheat achieved a deeper field seeding depth with higher velocity.
Table 5.
Field seeding depth for initial and optimized pneumatic wheat-shooting device.
Meanwhile, wheat realized a good emergence result, as shown in Figure 7b. The emergence rate for the optimized device and initial device was about 88.7% and 88.4%, respectively. The emergence rate of the optimized device was much higher than 69.8% of the traditional artificial sowing method, and there was little difference compared with 88.3% of the shallow rotary-tillage seeding technology [36,37]. The above simulation optimization design scheme and model are relatively reliable and can optimize a PWSD.
5. Conclusions
- (1)
- In this paper, the optimization of a PWSD was performed. There was a positive correlation between wheat velocity and airflow velocity for the pneumatic shooting process, and shooting depth was related to wheat velocity and soil properties. The shooting depth showed a positive correlation with the wheat velocity under the same soil environment. For the PWSD, the response-surface method and CFD simulation were utilized to maximize SAV and SAL, by which wheat can be sown deeper;
- (2)
- The central airflow velocity of the pneumatic wheat-shooting device showed a sharp increase to a maximum value, then presented a gradual decrease trend, and finally remained relatively constant by simulation analysis. The steady airflow velocity was between the maximum airflow velocity and the high-pressure airflow velocity for each experiment. The higher the high-pressure airflow velocity, the greater was the maximum airflow velocity;
- (3)
- Through the response-surface optimization and CFD simulation analysis, the optimal parameter combination of working pressure 686 kPa, acceleration tube diameter 8 mm and throat distance 20 mm was obtained, and the simulation result of SAV and SAL was 718 m·s−1 and 188 mm, respectively. The optimized device had a faster and more stable airflow field than the initial one in general. After optimization, the steady airflow velocity significantly increased by 34.5%, and the SAL increased by 9.1%. The field test showed that the average field seeding depth of the optimized device was about 68% higher than the initial device, and the emergence rate for the optimized device was about 88.7% without obvious reduction, which meets the requirements of Chinese national standards.
Author Contributions
Writing—original draft preparation, C.W., J.H. and H.L.; writing—review and editing, Q.W., C.L., H.Y. All authors have read and agreed to the published version of the manuscript.
Funding
This research was funded by the China Agriculture Research System of MOF and MARA (Grant No.CARS-03); National Natural Science Foundation of China No. 52175260.
Institutional Review Board Statement
Not applicable.
Data Availability Statement
Not applicable.
Acknowledgments
The authors would like to thank the Conservation Tillage Research Center for its support.
Conflicts of Interest
The authors declare no conflict of interest.
References
- China National Bureau of Statistics. Available online: https://www.stats.gov.cn/ (accessed on 12 December 2020).
- China Industrial Information Network. Available online: https://www.chyxx.com/industry/ (accessed on 1 December 2020).
- Li, C.S.; Tang, Y.L.; Xie, L.S.; Huang, G.; Zhong, G.X.; Wu, C.; Cheng, S.L. Design and experiment of 2BMFDC-6 half-tillage seeder of wheat after rice. Southwest Chin. J. Agric. Sci. 2011, 24, 789–793. [Google Scholar]
- Sidhu, H.S.; Singh, M.; Humphreys, E.; Sidhu, B.; Dhillon, S.S.; Blackwell, J.; Bector, V.; Sidhu, M.; Singh, S. The happy seeder enables direct drilling of wheat into rice stubble. Aust. J. Exp. Agric. 2007, 47, 844–854. [Google Scholar] [CrossRef] [Green Version]
- Zhang, X.M.; Zhang, J.M.; Xia, J.F.; Zhang, S.; Li, J.B.; Wu, H. Design and experiment on critical component of cultivator for straw returning in paddy field and dry land. Chin. Soc. Agric. Eng. 2015, 31, 10–16. [Google Scholar]
- Tang, Y.L.; Huang, G.; Yuan, L.X. High-benefit cultivation technique of surface seeding and mulching rice straw for wheat after rice. Crops 2000, 3, 22–24. [Google Scholar]
- Diao, P.S.; Du, R.C.; Yang, Z.D.; Yang, S.D. Theoretical research on pneumatic seeding. J. Agric. Mech. 2005, 27, 94–96. [Google Scholar]
- Wang, Y.B.; Li, H.W.; He, J.; Wang, Q.J.; Lu, C.Y.; Liu, P.; Yang, Q.L. Parameters optimization and experiment of mechanical wheat shooting seed-metering device. Chin. Soc. Agric. Eng. 2020, 36, 1–10. [Google Scholar] [CrossRef]
- Wang, Y.B.; Li, H.W.; Wang, Q.J.; He, J.; Lu, C.Y.; Liu, K.H. Design and experiment of wheat mechanical shooting seed-metering device. Chin. Soc. Agric. Eng. 2020, 51, 73–84. [Google Scholar]
- Wang, C.; Li, H.W.; He, J.; Wang, Q.J.; Cheng, X.P.; Wei, Z.C.; Liu, J.X. Effect of incident angle on wheat soil-ripping parameters by pneumatic seeding. Chin. Soc. Agric. Eng. 2019, 35, 32–39. [Google Scholar]
- Singh, R.C.; Singh, G.; Saraswat, D.C. Optimisation of design and operational parameters of a pneumatic seed metering device for planting cottonseeds. Biosyst. Eng. 2005, 92, 429–438. [Google Scholar] [CrossRef]
- Ariafar, K.; Buttsworth, D.; Sharifi, N.; Malpress, R. Ejector primary nozzle steam condensation: Area ratio effects and mixing layer development. Appl. Thermal Eng. 2014, 71, 519–527. [Google Scholar] [CrossRef]
- Chang, J.F.; Dong, Y.P.; Liu, Q.L.; Guo, F.Q.; Zhang, T.H.; Zhang, K.W. Experimental study and numerical simulation on flow field of venturi scrubber purifying biomass gas. Chin. Soc. Agric. Eng. 2012, 28, 186–192. [Google Scholar]
- Zhao, X.X.; Yu, H.L.; Ma, Y.J.; Zhang, J.G.; Sang, Y.Y.; Huo, X.J. Parameter optimization and experiment of negative pressure precision seed-metering device for wheat. Chin. Soc. Agric. Eng. 2017, 33, 11–18. [Google Scholar]
- Liu, J.X.; Wang, Q.J.; Li, H.W.; He, J.; Lu, C.Y.; Wang, C. Numerical Analysis and Experiment on Pneumatic Loss Characteristic of Pinhole-tube Wheat Uniform Seeding Mechanism. Chin. Soc. Agric. Eng. 2020, 51, 29–37. [Google Scholar]
- Cheng, X.P.; Lu, C.Y.; Meng, Z.J.; Yu, J.Y. Design and parameter optimization on wheat precision seed meter with combination of pneumatic and type hole. Chin. Soc. Agric. Eng. 2018, 34, 1–9. [Google Scholar]
- Wang, C.; Lu, C.; Li, H.; He, J.; Cheng, X. Preliminary bench experiment study on working parameters of pneumatic seeding mechanism for wheat in rice-wheat rotation areas. Int. J. Agric. Biol. Eng. 2020, 13, 66–72. [Google Scholar] [CrossRef]
- Hemidi, A.; Henry, F.; Leclaire, S.; Seynhaeve, J.M.; Bartosiewicz, Y. CFD analysis of a supersonic air ejector. part i: Experimental validation of single-phase and two-phase operation. Appl. Thermal Eng. 2009, 29, 1523–1531. [Google Scholar] [CrossRef] [Green Version]
- Xie, J.; Liu, Y.Y.; Wang, J.F. Effects of nozzle structures of air impinging freezer on heat transfer characteristics of steel strip surface. Chin. Soc. Agric. Eng. 2018, 34, 292–298. [Google Scholar]
- Ghalandari, M.; Koohshahi, E.M.; Mohamadian, F.; Shamshirband, S.; Chau, K.W. Numerical simulation of nanofluid flow inside root canal. Eng. Appl. Comput. Fluid Mech. 2019, 13, 254–264. [Google Scholar] [CrossRef]
- Suvarnakuta, N.; Pianthong, K.; Sriveerakul, T.; Seehanam, W. Performance analysis of a two-stage ejector in an ejector refrigeration system using computational fluid dynamics. Eng. Appl. Comput. Fluid Mech. 2020, 14, 669–682. [Google Scholar] [CrossRef]
- Wang, C.; Li, H.W.; He, J.; Wang, Q.J.; Lu, C.Y.; Wang, J.X. Design and experiment of pneumatic wheat precision seed casting device in rice-wheat rotation areas. Chin. Soc. Agric. Eng. 2020, 51, 43–53. [Google Scholar]
- Liu, Y.; Luo, C.; Zong, W.; Huang, X.; Ma, L.; Lian, G. Optimization of Clamping and Conveying Device for Sunflower Oil Combine Harvester Header. Agriculture 2021, 11, 859. [Google Scholar] [CrossRef]
- Jin, C.Q.; Guo, F.Y.; Xu, J.S.; Li, Q.L.; Chen, M.; Li, J.J.; Yin, X. Optimization of working parameters of soybean combine harvester. Chin. Soc. Agric. Eng. 2019, 35, 10–22. [Google Scholar]
- Hu, Y.; Chen, Y.; Wei, W.; Hu, Z.; Li, P. Optimization Design of Spray Cooling Fan Based on CFD Simulation and Field Experiment for Horticultural Crops. Agriculture 2021, 11, 566. [Google Scholar] [CrossRef]
- Kong, F.; Kim, H.D. Analytical and computational studies on the performance of a two-stage ejector-diffuser system. Int. J. Heat Mass Transf. 2015, 85, 71–87. [Google Scholar] [CrossRef]
- Ruangtrakoon, N.; Thongtip, T.; Aphornratana, S.; Sriveerakul, T. CFD simulation on the effect of primary nozzle geometries for a steam ejector in refrigeration cycle. Int. J. Therm. Sci. 2013, 63, 133–145. [Google Scholar] [CrossRef]
- Wang, L.; Yan, J.; Wang, C.; Li, X. Numerical study on optimization of ejector primary nozzle geometries. Int. J. Refrig. 2017, 76, 219–229. [Google Scholar] [CrossRef]
- Pereira, P.R.; Varga, S.; Soares, J.; Oliveira, A.C.; Lopes, A.M.; Almeida, F.G.; Carneiro, J.F. Experimental results with a variable geometry ejector using R600a as working fluid. Int. J. Refrig. 2014, 46, 77–85. [Google Scholar] [CrossRef]
- Hewedy, N.; Hamed, M.H.; Abou-Taleb, F.S.; Ghonim, T.A. Optimal performance and geometry of supersonic ejector. J. Fluids. Eng. 2008, 130, 436–445. [Google Scholar] [CrossRef]
- Wang, C.; Li, H.; Wang, J.; He, J.; Wang, Q.; Lu, C. CFD simulation and optimization of a pneumatic wheat seeding device. IEEE Access 2020, 8, 214007–214018. [Google Scholar] [CrossRef]
- Ruangtrakoon, N.; Aphornratana, S. Development and performance of steam ejector refrigeration system operated in real application in Thailand. Int. J. Refrig. 2014, 48, 142–152. [Google Scholar] [CrossRef]
- Sriveerakul, T.; Aphornratana, S.; Chunnanond, K. Performance prediction of steam ejector using computational fluid dynamic: Part 2. Flow structure of a steam ejector influenced by operating pressure and geometries. Int. J. Therm. Sci. 2007, 46, 823–833. [Google Scholar] [CrossRef]
- Chen, W.X.; Xue, K.K.; Chen, H.Q.; Chong, D.T.; Yan, J.J. Experimental and Numerical Analysis on the Internal Flow of Supersonic Ejector Under Different Working Modes. Heat Transf. Eng. 2018, 39, 700–710. [Google Scholar] [CrossRef]
- Arihant, S.; Abdus, S. Performance analysis of an ejector for flare gas recovery. Geosyst. Eng. 2014, 17, 169–177. [Google Scholar]
- Li, C.; Tang, Y.; Wu, C.; Huang, G. Effect of sowing patterns on growth, development and yield formation of wheat in rice stubble land. Chin. Soc. Agric. Eng. 2012, 28, 36–43. [Google Scholar]
- Singh, A. Evaluation of wheat sowing technologies under paddy residue conditions. Int. J. For. Crop Improv. 2015, 6, 43–48. [Google Scholar] [CrossRef]

Publisher’s Note: MDPI stays neutral with regard to jurisdictional claims in published maps and institutional affiliations. |
© 2022 by the authors. Licensee MDPI, Basel, Switzerland. This article is an open access article distributed under the terms and conditions of the Creative Commons Attribution (CC BY) license (https://creativecommons.org/licenses/by/4.0/).