Article

The Microcosmic Mechanism and Empirical Test of Uncertainty on the Non-Linear Fluctuation of Chinese Grain Prices-Based on the Perspective of Global Economic Policy Uncertainty

College of Economic and Management, Henan Agricultural University, Zhengzhou 450000, China
*
Author to whom correspondence should be addressed.
Agriculture 2022, 12(10), 1526; https://doi.org/10.3390/agriculture12101526
Submission received: 30 August 2022 / Revised: 18 September 2022 / Accepted: 19 September 2022 / Published: 22 September 2022
(This article belongs to the Special Issue Application of Econometrics in Agricultural Production)

Abstract

:
The dramatic fluctuations in grain prices and the threat to grain security caused by global economic policy uncertainty have been a social concern and a challenging area for price management authorities to regulate. Based on general equilibrium analysis in microeconomics, this paper constructs a mathematical model of the impact of global economic policy uncertainty on grain price fluctuation. It then examines the micro mechanism of non-linear grain price fluctuation under the dominant market mechanism and measures the non-linear shock effect of global economic policy uncertainty on grain prices using a threshold regression model. The results show that soybean and corn prices are subject to a two-zone fluctuation pattern due to global economic policy uncertainty. The impact has significant non-linear characteristics and is significantly greater in the high zone than that in the low zone. Accordingly, this paper offers government departments advice on better regulating and managing the market supply and demand and smoothing out sharp fluctuations in grain prices caused by changes in global economic policies.

1. Introduction

Grain security is an essential foundation for national security and a vital prerequisite for the proper functioning of national production. Moreover, as a country’s economic development is based on the effective industrial production of the country’s workforce, grain security is a “ballast” for economic development. The stability of the grain market depends on market security, or an adequate supply and stable prices [1]. The importance of maintaining a stable grain market is particularly significant as the consumer price of grain in China has been largely determined by the market since the country’s reform and opening up [2]. With the higher level of openness and the increased cost of domestic grain production in China, the ratio of grain imports to domestic production has continuously risen, reaching as high as 24% in 2021. Agricultural imports have become an important support to ensure grain security [3,4]. However, in recent years, the global economic policy uncertainty has continued to rise, along with the outbreak of the financial crisis and the European debt crisis, which has negatively impacted trade and supply on the global grain market and sharply increased price volatility [5,6,7]. In particular, the Sino-Us Trade in 2018 and the Russia-Ukraine Conflict in 2022 have disrupted grain exports from the U.S. and Ukraine, which are major importers of grain to China, bringing about changes in grain prices. When economic policy uncertainty rises, the more unstable the market environment, the more companies will adopt a wait-and-see policy, choosing to delay or reduce investment to hedge the risks arising from uncertainty, and consumers will choose to reduce consumption as they are pessimistic about future expectations [8]. Increased global economic policy uncertainty will not only directly impact agricultural cultivation in the grain-producing region, but also cause grain supply shortages in other countries, increasing inflation and affecting social stability [9]. It follows that global economic policy uncertainty can change grain imports and consumer expectations, causing changes in supply and demand, and ultimately affecting grain prices. Therefore, the impact of global economic policy uncertainty cannot be ignored in the study of grain price movements [10].
How does global economic policy uncertainty cause grain price fluctuation? The grain price change is essentially caused by the interaction between supply and demand. However, since the reform and opening up, the global economic policy uncertainty has increasingly impacted grain prices in China. In the future, grain consumption in China, a major grain importer, will considerably outpace domestic grain output due to the country’s burgeoning grain processing, livestock, and bioenergy industries [11,12]. As a result, dramatic fluctuations in international grain prices usually have a significant effect on domestic grain prices [13,14]. Global economic policy uncertainty has a greater impact on the stability of agricultural imports than Chinese economic policy uncertainty [10]. The international grain market is in a relatively smooth equilibrium when global economic policy is stable. Thus, both sides can cooperate in rational transactions based on grain prices and their own requirements, and grain prices are relatively constant [15]. When global economic policies change and trade protectionism prevails, major grain exporting countries usually reduce exports or even temporarily refrain from exporting their products to circumvent policy changes, causing China’s grain imports to fall and total domestic grain supply to decrease. At the same time, export prices of agricultural products increase, impacting the domestic grain market through the path of commodity competition [16]. International trade and market price information are transmitted to the domestic market through the import channel, which inevitably drives up domestic consumer price indices and price levels, further affecting the grain market [17,18]. Farmers or grain enterprises on the supply side usually choose to sell or hoard grain in an effort to maximize their earnings because they anticipate a continuing increase in future grain prices when various sorts of information are conveyed to the domestic market. To limit additional price increases, firms or consumers on the demand side choose to hold grain reserves in anticipation of rising grain prices. The abnormal behavior of suppliers and demanders creates a ‘resonance effect’, which speeds up the deviation of grain prices from normal levels due to the convergence of market behavior [19].
What are the characteristics of price fluctuation in the Chinese grain market? Through empirical techniques, scholars have found non-linear characteristics of grain price fluctuation with significant fluctuation clustering [20]. Paul et al. [21] used a VECM (vector error correction model) to study the speed of adjustment in the corresponding price channel. Carlos et al. [22] studied the impact of international agricultural products on the price transmission of agricultural products in China through ECM (error correction model) in the long and short term. Zhang et al. [23] used a non-linear autoregressive distributed lag model to analyze the dynamic correlation between soybean, corn, rice, and wheat prices in China and international grain prices. Wang et al. [24] used a TVP-FAVAR (time-varying parameter factor-augmented vector autoregressive model) to study the relationship between economic policy uncertainty and grain prices in seven countries. Nilavongse et al. [25] and Kido et al. [26] used the VAR (vector autoregressive model) and the FAVAR (factor-augmented vector autoregressive model) to confirm that domestic agricultural prices fall after receiving shocks from U.S. economic policy uncertainty. Tan et al. [27] used the TVP-FAVAR to study the impact of economic policy uncertainty on prices in the agricultural chain in China. Liu et al. [5], Wen et al. [28] and Long et al. [29] used TVAR (time-varying autoregressive model) and ARDL (autoregressive distributed lag model) to investigate the impact of economic policy uncertainty on agricultural commodity prices, respectively. They found that agricultural commodity prices exhibit significant real-time, sudden and asymmetric fluctuation characteristics. Using panel quantile regression, Zhu et al. [30] demonstrated that economic policy uncertainty has a significant negative impact on agricultural prices in China. For each of these, a higher level of uncertainty has a stronger impact on grain prices than a lower level of uncertainty has [31]. Using a SVAR (structural vector autoregressive model), Wei et al. [15] found that corn price fluctuation was affected by global economic policy uncertainty, with a “bimodal” negative effect and a “unimodal” positive effect, and rice price fluctuation showed a “unimodal” negative effect and a “unimodal” positive effect. By analyzing the relationship between economic policy uncertainty and Chinese grain futures prices, Xiao et al. [32] concluded that the relationship was significant, and the wheat price was less affected than the soybean and corn prices. Agricultural time series datasets are mostly nonlinear and nonstationary in nature [33].
In summary, in the context of increasing grain demand in China, continuous adjustment of international economic policies, and frequent trade disputes, stabilizing grain prices and reducing the impact of global economic policy uncertainty on grain prices have become hot issues for academic research. The majority of empirical models, including TVAR and ECM, are used to analyze the effects of global trade on grain prices, according to a review of the literature that is currently available. However, there are few theoretical analyses on the non-linear movements of grain prices caused by global economic policy uncertainty. This paper will concentrate on the shock of global economic policy uncertainty on grain prices and the non-linear fluctuation pattern of grain prices in the context of the global outbreak of COVID-19 and the ongoing conflict between Russia and Ukraine. The marginal contributions of this paper are as follows: (1) In terms of research perspective, global economic policy uncertainty is introduced into the analytical framework of grain price fluctuation, enriching the study of the influencing factors of grain price volatility; (2) in terms of research content, based on microeconomic theory, a mathematical and theoretical model is constructed from both the supply and the demand sides to systematically explain the micro-mechanisms of uncertainty shocks accelerating grain price non-linear fluctuations; (3) in terms of research ideas, to accurately understand the laws governing grain price fluctuations, timely and effectively control the impact of uncertainty on grain prices, ensure the efficacy of the current price control strategies, and make improvements to them, we will analyze the impact of global economic policy uncertainty on grain prices empirically through models and further study the non-linear characteristics of grain price fluctuations under different regional systems.

2. Data Analysis

The impact of economic policy changes is extensive. It will not only affect the domestic economy, but also spread to other countries through trades and capital flows. In order to depict the overall level of economic policy uncertainty in the major global economies, the global economic policy uncertainty index of Baker et al. [34] was chosen. This index was created by using the newspaper coverage frequency approach. Figure 1 below shows the movement of the global economic policy uncertainty index with respect to the growth rate of major grain prices in China.
As shown in Figure 1, between January 2002 and April 2020, the global economic policy uncertainty index and Chinese grain price growth rates have moved to a large extent, with six significant periods of overall fluctuation, particularly in recent years. The first period began with the 9-11 terrorist attacks, which plunged the US economy into recession and spread globally through trade, capital flows, international market prices and financial market contagion [5]. As a result, global economic policy uncertainty rose and reached a value of 157.9 in March 2003. During this time, corn prices increased by 10.6%, while soybean prices increased by 9.6%. The second period was the 2008 global financial crisis. It triggered a severe credit crisis, brought about by the balance of payment imbalances and frequent adjustments in national economic policies, all of which caused the value of global economic policy uncertainty to soar, reaching 203.9 in October 2008 [35,36]. Soybean prices rose by a maximum of 12.1% in March 2008 and fell by a maximum of 6.8% in November 2008, while corn price fell from a 3% increase to a 5.3% decline. The third phase was characterized by the European debt crisis in 2011, which led to a higher global economic policy uncertainty index, mostly due to its impact on international economic stability, rising to 211.6 in August 2011. Corn prices rose from 2.7% to 3.3% lower during this period. The fourth period was marked by a series of events from 2015 to 2017, including the European migration crisis, the UK’s referendum on the European Union, the election of Donald Trump as US President, and political unrest in Brazil, France and South Korea. These occasions exacerbated the level of global economic policy uncertainty. The global economic policy uncertainty index is above 230 and highly fluctuating in June 2006, November 2016, December 2016, January 2017, and March 2017. During this period, corn prices improved from a maximum decline of 6.7% to a maximum increase of 2.3%. The fifth period started with the US-China economic and trade war in 2018, which intensified disruptions to trade, cross-border investment and supply chains, causing elevated global economic policy uncertainty, reaching a record high of 335.5 in December 2018 [37]. Corn prices fell by a maximum of 7.6% in October 2016 and rose by a maximum of 7.3% in January 2018. The sixth period was the year 2020, when the COVID-19 outbreak caused a massive global industrial shutdown, trade slowdown, reduced investment and an unusually complex trade environment [38,39,40], with the Global Economic Policy Uncertainty Index reaching another record high of 437.1 in May 2020. During the period, soybean prices rose by 4.6% and corn prices by 4.5%.
Therefore, there is a correlation between Chinese grain prices and the global economic policy uncertainty index, but how does global economic policy uncertainty affect Chinese grain prices? What are the patterns of change in Chinese grain prices? These will be the central questions of this paper, from the theoretical to the empirical part of the study.

3. Theoretical Analysis

Existing articles mostly use empirical models to analyse the impact of economic policies on grain prices and the volatility characteristics of grain prices, with few theoretical aspects. The next part of this paper will use the articles by Liu [5] and Stokey [8] as arguments to study in detail the impact of global economic policy uncertainty on Chinese grain prices in terms of both transmission paths and micro-mechanisms.

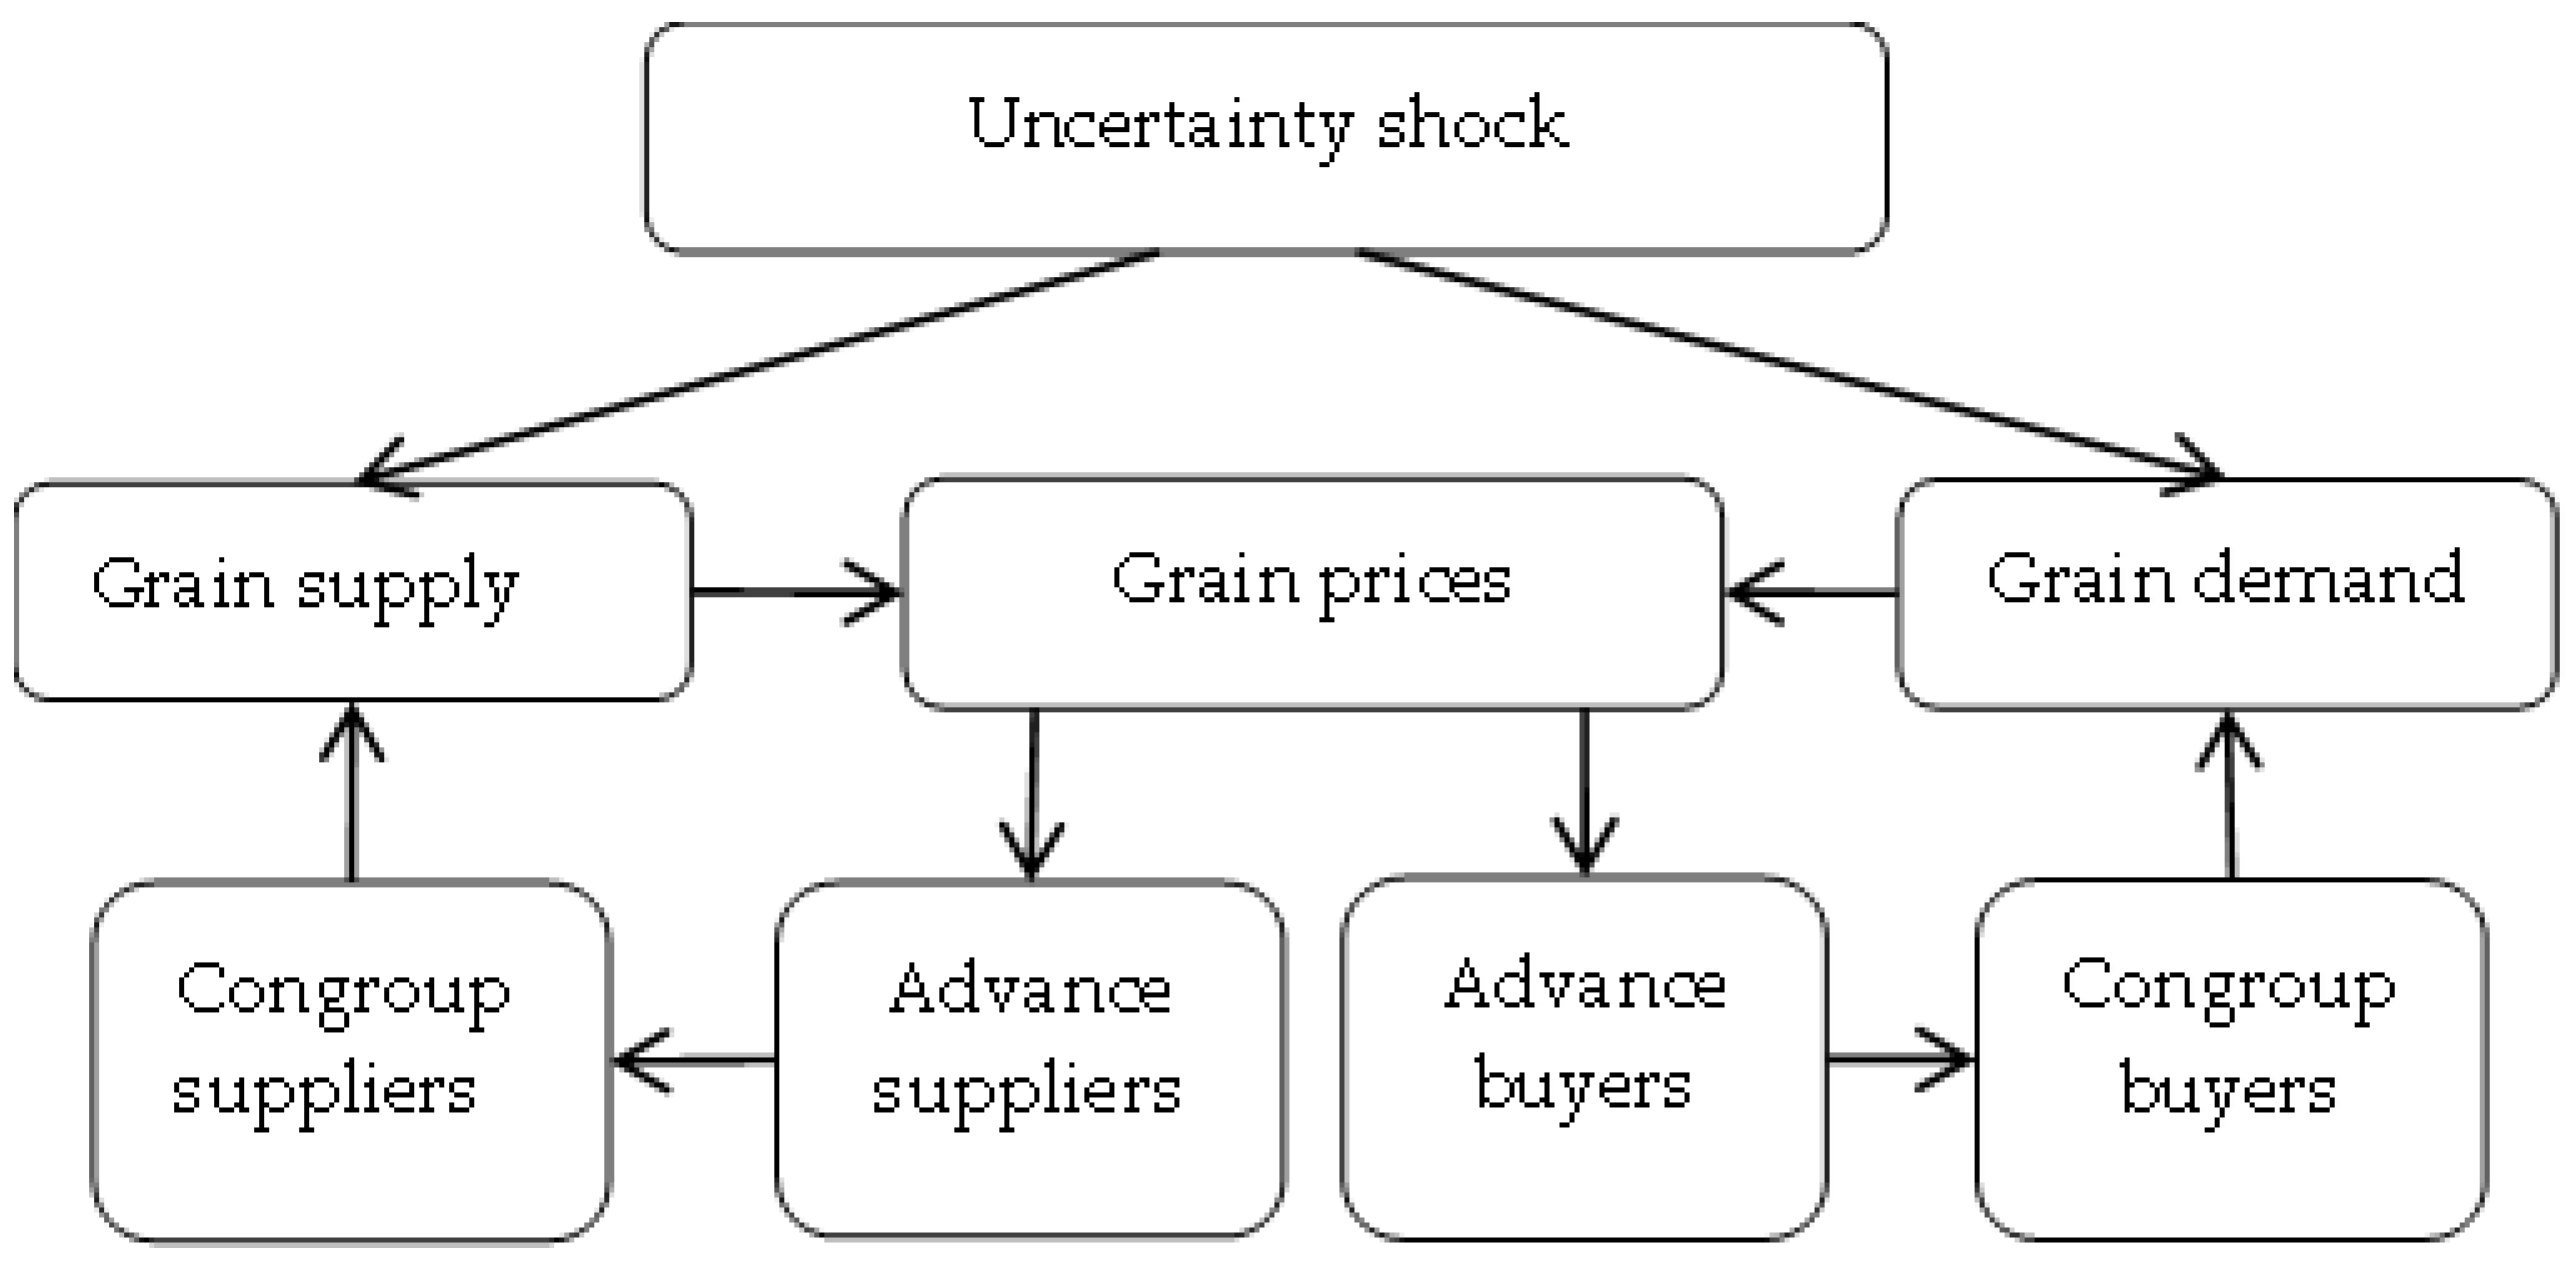
3.1. The Transmission Path of Grain Price Fluctuation Caused by Uncertain Factors

Due to the long cycle of grain cultivation, grains are usually harvested one or two seasons every year and stored centrally by grain storage or processing enterprises after purchase. Alternatively, large-scale farmers or farms store by themselves and then place grain in the market according to the demand of enterprises, such as grain and oil processing and feed processing, to maintain a continuous supply of products from the enterprises’ sales network and a stable market supply and demand. As a result, the main supply body in the Chinese grain market is the grain suppliers, and the main buyers are the grain and oil processing and feed processing enterprises. When the grain market suffers from uncertainty shocks such as financial crises and trade disputes, the grain supply chain will be disrupted first, causing a gap between supply and demand in the market and changes in grain prices. The extent of prices changes depends on the intensity of the uncertainty shock.
When grain prices rise, on the supply side, some suppliers are the first to recognize the bullish price signals due to their corporate advantages and make the decision to sell less and hoard more, while other suppliers obtain relevant information from the decision-making process of the first suppliers and decide whether to sell less and hoard more. In a perfectly competitive market, the impact of one supplier’s reduction in hoarding on grain supply is minimal; however, the behavior of decision makers usually has a “herding effect”. When the first supplier decides to reduce hoarding together, other suppliers follow the herd, leading to an accelerated rise in grain prices. As suppliers’ returns to selling increase during the rise in grain prices, the cost of hoarding also increases, so suppliers do not hoard indefinitely, and hoarding ends when the marginal cost of hoarding equals the marginal benefit. On the demand side, buyers who are sensitive to market reactions are the first to recognize the correlation between uncertain events and grain supply and the trend towards higher grain prices. Therefore, they can quickly increase their purchases and stockpile more. Subsequent followers make the same decision, and the same herd behavior increases demand for grain across the regional market, fueling higher grain prices. In this process, buyers increase their returns from over-purchasing and the capital cost of hoarding increases, snapping up until marginal returns equal marginal costs. Eventually, the supply and demand will achieve an equilibrium at the new price level, and the benefit per unit of product for the supplier in the price increase equals the additional expenditure for the demander, with the demander’s cohort behavior only contributing to the accelerated price increase.
The analysis of when uncertainty shocks cause a fall in grain market prices is as above and will not be repeated. The transmission path of uncertainty shocks to grain prices is shown in Figure 2.

3.2. The Micro-Mechanism of Grain Price Fluctuation Caused by Uncertain Factors

The formation of the equilibrium price depends on the interaction of supply and demand in the market. When the supply or demand changes, the equilibrium price in the market will also change. For a particular country or region’s grain market, taking into account the effects of uncertainty, the supply and demand functions are expressed as:
Q t s = δ + γ · P + ε t s
Source: Formula (1) is adapted from textbooks by the author.
Q t d = α β · P + ε t d
Source: Formula (2) is adapted from textbooks by the author.
δ , γ , α , β are all constant and δ , γ , α , β > 0 , ε t s , ε t d are the uncertainty shocks of supply and demand, respectively. When supply and demand are equal in the market, the market price is in equilibrium. According to the theory of the cobweb model, under normal conditions, the current production of an agricultural product Q t s depends on the price of the previous period P t 1 , and the supply function is:
Q t s = S ( P t 1 )
Source: Formula (3) is adapted from textbooks by the author.
The quantity demanded for the agricultural product in the current period Q t d is determined by the price in the current period P t , and then the demand function is:
Q t d = D ( P t )
Source: Formula (4) is adapted from textbooks by the author.
When there is a gap between supply and demand, the grain prices on the market during the period can be calculated using the following:
P t = P t 1 + ϕ ( Q t d Q t s )
Source: Formula (5) is adapted from textbooks by the author.
ϕ is the price adjustment factor. According to Equations (1)–(5), when there is an effect of uncertainty, the amount of change in grain prices is:
Δ P = P t P t 1 = ϕ ( α β · P t 1 + ε t d ) ( δ + γ · P t + ε t s )
Source: Formula (6) is calculated by the author based on Formulas (1)–(5).
Formula (6) shows that the maximum value of the supply-demand imbalance following the impact of uncertainty determines the cumulative change in prices Δ P in the dynamic adjustment of grain supply and demand.
In practice, when there are uncertain changes in global economic policy triggered by events such as financial crises and trade frictions, there will be market-savvy individuals on both the supply and demand sides of a particular market who will be the first to perceive the signals of market changes and make anticipatory decisions about the future movement of grain prices in the market. If the market price is expected to continue to move higher (lower) in the future, with a greater impact on their own interests, the first movers on both the supply and demand sides will quickly take appropriate measures to maximize their own interests, such as selling or snapping up. When a large number of suppliers or demanders in the market take the same “rational” measures, this can lead to a herding effect, exacerbating the fluctuation of grain prices in the market as a whole.
Next, this paper will analyze the mechanisms that shape the non-linear fluctuation of grain prices when global economic policy uncertainty affects price expectations from both the supply and demand sides.

3.2.1. Micro Drivers of Non-Linear Price Fluctuation in Response to Shocks on the Supply Side of Grain

If the market encounters oversupply caused by the global economic policy uncertainty during the operation, the farmer or grain storage company, as the seller, will be in a dominant position and have absolute decision-making power over the sale of grain. For example, suppose a trade dispute breaks out in a certain period, leading to import disruptions in grain-importing countries and a domestic supply shortage. In that case, grain companies anticipate a rise in market prices so that the buying company will adjust its business decision to hoard that grain, which delays or limits supply, leading to a further deterioration of the grain supply shortage and exacerbating price increases. Next, this paper constructs a model of firms’ decisions to sell raw grains or products in order to analyze the micro-mechanisms of non-linear fluctuations in grain prices exacerbated by global economic policy uncertainty.
Assuming that the normal market demand is met continuously throughout the year during the storage period of the grain business in accordance with seasonal differences in the market, the daily storage cost per unit of product is V C , the duration of storage is 360 days, the annual cost per unit of product for annual storage is 360 · V C , the maximum storage volume of the business is Q , the average stock is Q / 2 , and the total average annual storage cost is 180 · V C · Q . In the absence of a shock to the industry, the daily volume of a grain sold is Q d and the sales price is P 0 .
If global economic policy uncertainty causes an oversupply in the market, grain prices will rise and continuously grow as expected. The firm will reduce market supply and choose to increase its stockpile by pressing stocks and delaying sales to increase future earnings. Assuming a fixed depression rate of γ 0 , the daily depression is Q d γ 0 and the time available for sale of stocks increases from m 0 days to m days. The firm reduces the amount of stock out and the desired daily increase in price is Δ P d , then the marginal revenue earned by the firm from each day’s pressed stock is:
M R = Q d γ 0 Δ P d
Source: Formula (7) is the author’s calculation based on daily depression and desired daily increase in price.
In addition to the planned full year cost of 180 · V C · Q , the increase in pressurized storage also entails an additional cost of capital employed, i.e., an incremental cost. The incremental cost per unit of grain consumed per day during pressurized sales (including maintenance costs, capital costs, etc.) is represented by C d . For ease of analysis, only the incremental costs during the period of pressure storage are considered here. Since the total amount of grain sold by the firm with delay is accumulated gradually, the profit function of the firm from m 0 to m is:
R = P 0 · Q d · ( 1 γ 0 ) ( m m 0 ) + m 0 m Q d · γ 0 · ( Δ P d C d ) ( m m 0 ) d m
Source: Formula (8) is the author’s calculation based on total revenue and costs.
Taking the partial derivative of the above equation with respect to m yields:
d R / d m = P 0 · Q d ( 1 γ 0 ) + Q d · γ 0 · ( Δ P d C d ) ( m m 0 )
Source: Formula (9) is calculated based on Formula (8) by the author.
When dR/dm = 0, there are extreme values of the profit function, and it further follows that:
Δ P d = C d [ ( 1 γ 0 ) · P 0 ] / [ ( m m 0 ) · γ 0 ]
Source: Formula (10) is calculated based on Formula (9) by the author.
The total increase in grain prices during the m m 0 period was:
Δ P m = Δ P d ( m m 0 ) = C d ( m m 0 ) ( 1 / γ 0 1 ) p 0
Source: Formula (11) is calculated based on Formula (10) by the author.
From Formula (11), it can be seen that as the hoarding rate γ 0 increases, the price increment Δ P m increases. The market price cannot, of course, be set by a single seller in a fully competitive market, but businesses or farmers tend to be convergent, or in what economists refer to as the “herd effect” of the seller’s market decision, and from Equation (11), the rise in grain prices has a certain non-linear character.

3.2.2. Micro Drivers of Non-Linear Price Fluctuation in Response to Shocks on the Demand Side of Grain

If the actual daily consumption of an agricultural product by grain processors or individual consumers totals G d , each batch of agricultural product purchased would be available for consumption for the next n 0 days in the absence of global economic policy uncertainty. Normal produce purchases can be expressed as the product of normal daily produce consumption at G d and the number of days available for consumption at n 0 is G d · n 0 . If the current price of the produce is P , then the current expenditure function for a normal purchase is C n 0 = P · G d · n 0 . If the agricultural product encounters a global economic policy change that leads to an increase in the price of the agricultural product, the processor or consumer will expect the price to continuously increase in the future. In order to reduce the loss of future benefits, the current purchase of the commodity will be increased so that the number of days available for consumption for each purchase of the commodity increases to n days, then the purchase at this time is the product of the actual daily consumption G d and the number of days available for consumption n , and the expenditure function is C n = P · G d · n .
Due to the price expectation for that agricultural product, the processing firm or the consumer will benefit financially by over-purchasing the agricultural product at the current price, but since doing so incurs higher capital costs, the firm or the consumer has to bear the capital cost of the over-purchase portion, so the potential profit to the firm or the individual consumer from the increased purchase is
π = Δ P n · G d · ( n n 0 ) P · ( 1 + r ) n 1 · G d · ( n n 0 )
Source: Formula (12) is the author’s calculation based on the benefits and costs to the consumer.
Among them, r represents the interest rate and Δ P n is the difference between the expected n and the current n 0 market price of grain. To maximize profit, the partial derivative of Equation (12) gives:
d π / d n = Δ P n · G d P · [ ( 1 + r ) n 1 ] · G d P · ( 1 + r ) n · ln ( 1 + r ) · G d · ( n n 0 )
Source: Formula (13) is calculated based on Formula (12) by the author.
A maximum value of potential profit exists when d π / d n = 0 , from which it follows that:
Δ P n = P · [ ( 1 + r ) n + ( n n 0 ) · ( 1 + r ) n · ln ( 1 + r ) 1 ]
Source: Formula (14) is calculated based on Formula (13) by the author.
When global economic policy uncertainty shocks cause downstream processing grain firms and consumers to expect higher prices, the greater the volume of grain and grain storage is purchased by firms and consumers. At a given interest rate, the longer the number of days of grain or grain storage is purchased, the greater the fluctuation is caused in grain market prices, which remain non-linear in nature from Formula (14).
It is clear from the overall market performance that when a particular agricultural product encounters a global economic policy change that leads to higher prices, the short-term supply in the market decreases and demand increases, leading to even greater price fluctuation, with the overall grain price movement being the sum of (11) and (14), i.e., the total market price movement for a particular grain species is:
Δ P = C d ( m m 0 ) ( 1 / γ 0 1 ) p 0 + P · ( 1 + r ) n + ( n n 0 ) · ( 1 + r ) n · ln ( 1 + r ) 1
Source: Formula (15) is calculated based on Formula (14) by the author.
The above equation shows that the superposition of the cumulative supply-side effect and the cumulative demand-side effect determines the total amount of price changes. When global economic policy changes lead to an oversupply of grain in the market, grain prices will rise, and grain storage companies or farmers will choose to maximize their own interests by means of pressuring and selling. Meanwhile, as rational buyers or economic people, processing enterprises or individual consumers perceive market information, expect future grain prices to continue to increase, and choose to over-purchase in the current period in order to reduce the loss of future benefits and increase purchases and storage. The presence of a decision cohort effect, however, can lead to a rapid decline in the supply of that grain on the market and a rapid climb in demand, causing grain prices to rise rapidly in a short period of time, collectively driving n prices to reach the expected price P n after the period, accelerating price deviations from normal levels. Furthermore, in the process of rising grain prices, when the price rises to a certain level, demanders will choose new substitutes, or the state introduces relevant policies to put in reserve grain, the grain supply increases, and demand decreases. At this point, grain enterprises or farmers will appropriately increase the amount of grain sold, so that the grain reaches a stable level at the new price level, and eventually the price forms a new equilibrium point. During this adjustment process, grain prices move at a rapid rate followed by a slow rate, showing significant non-linear fluctuation characteristics.
To conclude, the above analysis shows that global economic policy uncertainty is an important causal factor in exacerbating grain price fluctuation. Precautionary purchases by a few key actors could create grain price spikes and severe local food shortages [41]. The micro-motivations of grain price fluctuation are seen from the supply and demand sides combined, with price fluctuation caused by a disruption in the supply–demand balance of grain.

4. Empirical Test

4.1. Variable Selection and Data Sources

Since China officially joined the WTO in December 2001, the 16th National Congress of the Communist Party of China in 2002 clearly proposed the development of modern agriculture. Therefore, based on the data availability, this paper selects monthly time series data from January 2002 to April 2021.
(1)
Dependent variable. Achieving “basic self-sufficiency in grains and absolute safety in rations” is the strategic goal of China’s grain industry. From the statistical data, wheat as a ration control effect is better, and the price is relatively stable. Corn is used for feed production and industrial raw materials, which is greatly affected by downstream industries. It is a net import category, and its price fluctuates wildly. The external dependence on soybean is extremely high, as high as 90%, and international trade is an important factor of external impact. Therefore, this paper selects the SOYB (soybean market price) and the CORN (corn market price) as the research objects, and the data come from the Brick Agricultural Database.
(2)
Independent variable. The GEPU (Global Economic Policy Uncertainty Index) is mainly calculated based on the ratio of each monthly EPU (Economic Policy Uncertainty Index) value of each country to the share of newspapers discussing economic policy uncertainty in the current month. The data come from the Economic Policy Uncertainty Website.
(3)
Control variables. Improving the national economic level will inevitably stimulate domestic demand and then promote the price increase [42]. This paper selects the GDP (gross domestic product) to measure the level of economic growth as the macroeconomic factor affecting grain prices. The data come from the National Bureau of Statistics. Petroleum has a solid industrial purpose and is closely related to economic activities [5]. This paper selects the international crude price as a proxy variable for OIL (oil price). The data come from the World Bank Website. Seed price is an important part of planting cost. In this paper, SSEE (soybean seed price) and CSEE (corn seed price) are selected as important factors to measure planting cost. Grain production and imports directly affect grain prices from the supply side. This paper selects SYIE (soybean yield), SIMP (soybean import volume), CYIE (corn yield), and CIMP (corn import volume) to measure the level of grain supply in the domestic market. The data come from the Forward-Looking Database.
We performed CPI deflation for SOYB, CORN and OIL, then seasonally adjusted all data except GEPU and GDP, and finally used growth rate data for estimation.

4.2. Model Settings

As an important structural change model, the threshold regression model can obtain the threshold through model calculation and divide the sample data into different divisions. Thus, the function model can present the characteristics of line segments and show that the threshold variables in different divisions are affected. The degree of explanation of the explanatory variables can clearly examine the mechanism transition point of the global economic policy uncertainty on the nonlinear change of grain prices in this study and provide a reference value for ensuring grain security. Therefore, this paper uses the threshold regression model proposed by Tong [43] and Hansen [44] to analyze the nonlinear characteristics of grain prices under the influence of global economic policy uncertainty.
The basic expression of the threshold model is set as:
y t = α 0 + i = 1 n α i x i I ( q i , γ ) + e i
Among them, y t is the explained variable, x i is the explanatory variable, I ( q i , γ ) is the indicative function, the threshold variable q i is on the γ set, and e i is the disturbance term, which is independent and identically distributed. When the function has only one threshold, Equation (16) can be expressed as:
y t = ( α 0 + i = 1 n α i x i ) I ( q i < γ 1 ) + ( β 0 + i = 1 n β i x i ) I ( q i γ 1 ) + e i
Among them, γ 1 is the threshold parameter, and the conversion conditions of zone 1 and zone 2 are q i < γ 1 and q i γ 1 , respectively. The parameter α i is the autoregressive slope when q i < γ 1 , the parameter β i is the autoregressive slope when q i γ 1 , and e i is the disturbance term. Next, when the variables in the above formula are denoted by X i = ( 1 , x 2 , x 3 x n ) and X i ( γ ) = ( X i I ( q i < γ 1 ) X i I ( q i γ 1 ) ) respectively, we obtain:
y i = X i α I ( q i < γ 1 ) + X i β I ( q i γ 1 ) + e i
or
y i = X i ( γ ) θ + e i
where θ = ( α β ) . Since the threshold regression equation is nonlinear and discontinuous, the maximum likelihood estimation method is used to determine the values of γ and θ , and we can obtain:
θ ^ ( γ ) = ( i = 1 n X i ( γ ) X i ( γ ) ) 1 ( i = 1 n X i ( γ ) y i )
This calculates the residual e ^ i = y i X i ( γ ) θ ^ ( γ ) , whose residual sum of squares is C.
σ n 2 ( γ ) = 1 n i = 1 n e i ( γ ) 2
Assuming that γ is restricted to a bounded set γ ¯ , γ _ , the expression that minimizes the above is:
γ ^ = arg min σ n 2 ( q i )
According to the threshold variable estimation principle of the threshold regression model, the residual sum of squares is minimized. As such, we can derive the threshold parameter estimates and then obtain the other parameter estimates.

4.3. Stationarity Test

The threshold regression model requires smooth data, and this paper uses the common ADF (augmented Dickey–Fuller unit root test) to test whether the time series data are stable. The original hypothesis of the ADF is that there is a unit root. It is critical to determine the lag order ρ in conducting the ADF. This paper determines the lag order ρ based on AIC (Akaike information criterion). In general, the smaller the AIC value, the better the model fit and the more accurate the model is, so the model with the smallest AIC value is given priority. The critical value of the ADF at the 5% significance level is −3.429. Whether the series is smooth is determined by observing whether the p-value is less than 0.05. The results show that all variables reject the original hypothesis. Therefore, all variables are smooth series. The ADF for ordinary time series data can be operated using EViews software, and the subsequent empirical tests were also performed using EViews software. The specific test results are presented in Table 1 below.

4.4. Nonlinear Test

To verify the nonlinearity of soybean and corn price fluctuations, this paper adopts the BDS statistic to test whether there is nonlinearity in price fluctuations. Original hypothesis H 0 of the BDS statistic test: time series is an independent and identically distributed process. Alternative hypothesis H 1 : time series is a non-independent and identically distributed process. Rejecting the original hypothesis indicates that the series is nonlinear at the significance level. We set ε = 0.7 , the embedding dimension n = 5 , and performed bootstrap sampling 10,000 times to enhance test result accuracy. The BDS test results show that with the increase of the embedding dimension, the value of the BDS statistic increases gradually, and the test probability value is extremely small. Therefore, the price of soybean and corn rejects the original hypothesis at the 1% significance level; that is, the series has nonlinear characteristics. The test results are shown in Table 2 below.

4.5. Determination of Lag Periods and Thresholds

The lag period of the model is determined according to the AIC information criterion. When there are a series of alternative lag periods, the lag period corresponding to the minimum AIC value is selected. Therefore, the lag periods of the threshold variables of soybean and corn prices are determined to be 8 and 9 lags, respectively. Based on the Bai–Perron Su-F test, the threshold values were determined sequentially, and a threshold parameter, i.e., a split value of 19.995, was obtained when the global economic policy uncertainty index with lags of 8 and 9 was used as the threshold variable for soybean and corn prices, respectively. The sample data were divided into two zone systems, and the specific threshold determination results are shown in Table 3 and Table 4.

4.6. Threshold Regression Results

Under the 1% significance level and Bai–Perron’s critical value method, a threshold is the best option. Additionally, the threshold estimation parameter for the threshold variables of soybean and corn prices are obtained by using the global economic policy uncertainty index with a lag of five periods. The threshold is 19.995, and Table 5 and Table 6 display the results of the threshold regression.
According to the above table, the R2 and AIC values of the soybean and corn price threshold models are higher than those of the linear regression, indicating that the threshold regression model can more accurately reflect the changes in the prices of these two grains than the linear regression model. Moreover, the number that passes the significance test in the high-division model, which is greater than the threshold, is greater than the number that passes the significance test in the linear model. Among them, six variables of soybean passed the significance test in the high zone system, and four passed the significance test in the linear model. Six variables of corn passed the significance test in the high zone system, while only three did so in the linear model. It can be observed that the threshold regression model can better fit the changing trend of these two grain price series than the linear regression model, which also shows that the changes in soybean and corn prices are somewhat nonlinear. Therefore, applying the threshold regression model makes more sense.
By analyzing the results of the threshold regression model for soybean and corn price, we can conclude that:
(1)
The coefficient of GEPU for zone 2 is greater than that of GEPU for zone 1. In the threshold model for soybean and corn, the value of the coefficient of GEPU for the high zone system is higher than that for the low zone system, which indicates that GEPU rapidly raises the price of soybean and corn after moving from zone 1 to zone 2. On the other hand, while traveling from zone 2 to zone 1, the coefficient and price both drop rapidly.
(2)
In general, the coefficients of the lag terms in zone 2 are larger than those in zone 1, and all of the significant lag terms in zone 2 have larger coefficients. SOYB and CORN are more volatile within zone 2 than in zone 1. In other words, when SOYB and CORN are above the threshold, GEPU has a greater impact on them, and they move at a faster rate of change, whereas when fluctuations are lower, GEPU has less impact, and SOYB and CORN exhibit a more stable dynamic equilibrium.
(3)
The sum of the coefficients in zone 2 is greater than that in zone 1. For the SOYB in zone 2 and zone 1 models, the sums of the coefficients are 2.145 and 1.062, respectively. The total coefficients for the CORN in zone 2 and zone 1 models are 2.033 and 0.803, respectively. The sum of the coefficients for the zone 2 model is greater, indicating that SOYB and CORN has a greater impact on later periods in the early part of zone 2. If SOYB and CORN exceeds the threshold, i.e., when in zone 2, SOYB and CORN produces fluctuations under the influence of GEPU, which has a greater impact on later prices, resulting in large fluctuations in SOYB and CORN in later periods. In contrast, under zone 1, i.e., below the threshold, SOYB and CORN fluctuate but have a smaller impact on later prices, resulting in smaller SOYB and CORN fluctuations in later periods. Furthermore, in zone 2, both the positive effects of GDP and OIL on SOYB and CORN are more prominent, demonstrating that soybean, as an agricultural product with higher reliance on imports, is more vulnerable to the influence of global factors. Corn, as an industrial feedstock and feed grain, is more sensitive to domestic economic growth. Overall, under the influence of global economic policy uncertainty and price cycles, the fluctuations of SOYB and CORN show non-linear characteristics, and the impact in zone 2 is greater than that in zone 1.
The main reason for the existence of only one threshold for the price increasing period in the empirical test results may be that when the value of global economic policy uncertainty is small, the economy is in a period of prosperity. Therefore, supply and demand are in a relatively stable economic environment, which will not affect the price expectations of market suppliers and buyers, so grain prices will not change to a large extent. When the value of global economic policy uncertainty is large, the economy is in a recession, trade protectionism rises, policy risks intensify [15], international trade exchanges decrease and the trade environment is unstable. As such, supply and demand sides make corresponding decisions according to their own expectations (suppliers press their stocks and sell, demanders rush to buy), further widening the gap between supply and demand in the market and intensifying grain price fluctuation. At the same time, the movement of grain prices is characterized by significant sectoral changes, with grain prices being more affected by global economic policy uncertainty in the high sector and less affected in the low sector. The main reason for this is that when global economic policy uncertainty is low, the market adjustment mechanism plays a major role in maintaining grain prices in a dynamic equilibrium situation without large fluctuations. When global economic policy uncertainty is high, “adverse selection” occurs between suppliers and demanders, and the market’s own regulatory mechanism fails, with supply changing in the opposite direction and demand changing in the positive direction. In addition, when global economic policy uncertainty is high, macroeconomic variables are more unpredictable, leading to a more sensitive response of grain prices to shocks [45]. As a result, when the degree of global economic policy uncertainty is high, grain price fluctuation increases and deviates from the equilibrium price at a faster rate, showing clear non-linear fluctuation characteristics.

5. Results and Discussion

5.1. Results

This paper analyzes the micro-mechanisms of grain price fluctuation under global economic policy uncertainty shocks from the supply and the demand sides, and uses a threshold regression model to test the impact effects of global economic policy uncertainty on soybean and corn prices, respectively. The results include the following main points. Firstly, soybean and corn prices exhibit significant non-linear volatility characteristics due to GEPU, with greater volatility within zone 2 than zone 1. Secondly, soybean and corn prices are subject to GEPU shocks with only one threshold for periods of price increases. Thirdly, the fluctuations of both soybean and corn prices have obvious zonal variation characteristics, with a threshold value of 19.995, and are less influenced in the regime below the threshold, showing a more stable dynamic equilibrium. The main reason is that when the global economic policy uncertainty index is low and the economy is booming, the market is stable, and prices are stable. When the global economic policy uncertainty index is high and the economy is in recession, international trade is hampered, consumer demand is weakened, the gap between supply and demand in the market increases and prices fluctuate. During this period, suppliers and demanders have an ‘economic man’ assumption and seek to maximize their profits and will make ‘speculative’ decisions based on their own experience and expectations of future price movements when prices change in the current period. As a result, soybean and corn prices tend to move more rapidly and then more slowly, i.e., there are significant non-linear fluctuations.

5.2. Discussion

This paper suggests the following recommendations. Firstly, strengthen supply and demand management and supervision. Accelerate the construction of market management systems at all stages of production, processing and marketing of major grains so as to smooth the internal circulation and avoid “intestinal obstruction”. From the demand side, the government and the media should make efforts to guide consumers’ expectations, respond to public opinion and provide scientific guidance for purchases simultaneously to prevent the media or unscrupulous enterprises from taking the opportunity to spread inaccurate information. Thereby, it can reduce panic in times of grain price fluctuations, such as massive hoarding and rush to buy. Meanwhile, the grain saving behavior of people should be vigorously advocated to practice the big grain concept, improve the grain structure, increase green consumption and reduce the consumption dependence on individual grain varieties. From the supply side, strengthen the supply monitoring of large grain enterprises, and promptly crack down on malicious grain stockpiling, selling and other behaviors.
Secondly, strengthen market monitoring and regulation. When the year-on-year grain price index exceeds the threshold value, the relevant departments should immediately react and thoroughly investigate the reasons for the rise. When prices are rising, timely and reasonable measures should be taken to increase supply to curb its sharp rise. When prices are falling, grain storage should be increased to promote inter-regional circulation or export to maintain stable market prices and ensure stable income for upstream producers.
Finally, create an international general circulation pattern. Increase international multilateral trade cooperation, strengthen the construction of mechanisms such as cooperation among Belt and Road countries, establish a multi-channel pattern of grain or grain stuff import and export, diversify imports and exports, avoid a pattern of highly concentrated import and export countries, disperse the price risks caused by uncertainty, ensure a stable source of international grain imports, and thus guarantee stable grain prices in the domestic market.

Author Contributions

Conceptualization, J.H. and H.L.; data curation, H.L.; formal analysis, J.H. and H.L.; funding acquisition, Z.H.; methodology, H.L.; software, H.L.; supervision, J.H., Z.H., J.D. and F.J.; writing—original draft, H.L.; writing—review and editing, J.H. and H.L. All authors have read and agreed to the published version of the manuscript.

Funding

This work was supported by grants from the Strategic Research Project of the Education and Science Commission of the Ministry of Education (No.2021-29); the Humanities and Social Sciences Research Planning Project of the Ministry of Education (20YJA790027); and the Henan Province Soft Science Project (222400410269).

Institutional Review Board Statement

Not applicable.

Informed Consent Statement

Not applicable.

Data Availability Statement

The data presented in this study are openly available in the National Bureau of Statistics, Brick Agricultural Database, Economic Policy Uncertainty, World Bank and the Forward-Looking Database.

Conflicts of Interest

The authors declare no conflict of interest.

References

  1. Nechaeva, M.; Nechaev, V.; Larinina, T.; Kulakov, V. Agricultural Machinery Market Development for Ensuring Food Security. IOP Conf. Ser. Earth Environ. Sci. 2019, 403, 12167. [Google Scholar] [CrossRef]
  2. Lv, F.; Deng, L.Y.; Zhang, Z.T.; Wang, Z.Y.; Wu, Q.Y.; Qiao, J.M. Multiscale Analysis of Factors Affecting Food Security in China, 1980–2017. Environ. Sci. Pollut. Res. Int. 2021, 29, 6511–6525. [Google Scholar] [CrossRef]
  3. Luo, P.F.; Tanaka, T. Food Import Dependency and National Food Security: A Price Transmission Analysis for the Wheat Sector. Foods 2021, 10, 1715. [Google Scholar] [CrossRef] [PubMed]
  4. Porkka, M.; Guillaume, J.H.A.; Siebert, S.; Schaphoff, S.; Kummu, M. The Use of Food Imports to Overcome Local Limits to Growth. Earths Future 2017, 5, 393–407. [Google Scholar] [CrossRef]
  5. Liu, L.; Chen, L.Y.; Li, Y.S. Global Economic Policy Uncertainty and China’s Grain Price Volatility—Based on the Perspective of Asymmetry Analysis. J. Agrotech. Econ. 2020, 5, 17–31. [Google Scholar] [CrossRef]
  6. Li, Y.; Li, J. How Does China’s Economic Policy Uncertainty Affect the Sustainability of Its Net Grain Imports? Sustainability 2021, 13, 6899. [Google Scholar] [CrossRef]
  7. Frimpong, S.; Gyamfi, E.N.; Ishaq, Z.; Agyei, S.K.; Agyapong, D.; Adam, A.M. Can Global Economic Policy Uncertainty Drive the Interdependence of Agricultural Commodity Prices? Evidence from Partial Wavelet Coherence Analysis. Complexity 2021, 2021, 8848424. [Google Scholar] [CrossRef]
  8. Stokey, N.L. Wait—And—See: Investment Options under Policy Uncertainty. Rev. Econ. Dyn. 2016, 21, 246–265. [Google Scholar] [CrossRef]
  9. Li, D.N. Analysis of the Impact of Global Economic Policy Uncertainty and RMB Exchange Rate on Chinese Economic Growth and Price Level—A Theoretical and Empirical Study Based on Asymmetric Perspective. Master’s Thesis, Qingdao University, Qingdao, China, 2020. [Google Scholar] [CrossRef]
  10. Zhang, Z.H. Does Economic Policy Uncertainty Undermine Stability of Agricultural Imports? Evidence from China. PLoS ONE 2022, 17, e0265279. [Google Scholar] [CrossRef]
  11. Wu, F.W.; Shen, Y.F.; Zhang, J.H.; Xu, Q. Analysis of the Impact of Biofuel Ethanol Development on Chinese grain security from the Perspective of “Competition with Grain for Land”. J. Agrotech. Econ. 2009, 1, 21–29. [Google Scholar]
  12. Yu, S.; Li, G.S. Agricultural Production and Grain Consumption in China: A long-term projection. China Econ. Rev. 2019, 53, 15–29. [Google Scholar] [CrossRef]
  13. Wang, X.S.; Xie, S.X. How Do Prices of Foreign Agricultural Products Affect Prices of Chinese Agricultural Products? Econ. Res. J. 2012, 47, 141–153. [Google Scholar]
  14. Li, G.S.; Cao, B.M.; Ma, X.L. China’s Grain Market Opening and International Grain Price Fluctuation—An Analysis Based on Spillover Effects of Grain Price Fluctuation. Chin. Rural. Econ. 2015, 8, 44–52. [Google Scholar]
  15. Wei, C.J.; Zhang, B.B. The Shock of Global Economic Policy Uncertainty and International Grain Price Fluctuation: Theoretical and Empirical Analysis. Econ. Probl. 2018, 3, 90–95. [Google Scholar]
  16. Yang, G.L.; Zheng, M.R.; Liu, J. An Empirical Analysis of the Impact of Global Economic Policy Uncertainty on China’s Grain Price Volatility. Sci. Technol. Cereals Oils Foods 2020, 28, 1–10. [Google Scholar] [CrossRef]
  17. Ouyang, Z.G.; Qian, L. Non-linear Transmission Effects of International Factors on Inflation in China. Econ. Res. J. 2015, 50, 89–102. [Google Scholar]
  18. Wang, E.P.; An, N.; Gao, Z.F.; Kiprop, E.; Geng, X.H. Consumer food stockpiling behavior and willingness to pay for food reserves in COVID-19. Food Secur. 2020, 12, 739–747. [Google Scholar] [CrossRef]
  19. Ke, B.S. Chinese Farmers’ Grain Stock and Its Effect on Market. China Rural. Surv. 1996, 6, 8–13. [Google Scholar]
  20. Xie, J.Z.; Ye, S.; Tu, X.J. An Analysis of the Effect and Influence of Food Financialization on Food Price Fluctuation—Based on GARCH and EGARCH models. J. Southwest Univ. Soc. Sci. Ed. 2018, 44, 19–25. [Google Scholar] [CrossRef]
  21. Paul, R.K.; Karak, T. Asymmetric Price Transmission: A Case of Wheat in India. Agriculture 2022, 12, 410. [Google Scholar] [CrossRef]
  22. Carlos, A.; Bryce, C.; Fred, G. Agricultural Price Transmission: China Relationships with World Commodity Markets. J. Commod. Mark. 2017, 7, 28–40. [Google Scholar] [CrossRef]
  23. Zhang, X.Y.; Liu, Y.F. The Dynamic Impact of International Agricultural Commodity Price Fluctuation on Chinese Agricultural Commodity Prices. Int. Grain Agribus. Manag. Rev. 2020, 23, 391–409. [Google Scholar] [CrossRef]
  24. Wang, J.T.; Zheng, Y.J. Economic Policy Uncertainty and Grain Prices Fluctuation. Front. Soc. Sci. Technol. 2019, 1, 37–64. [Google Scholar] [CrossRef]
  25. Nilavongse, R.; Rubaszekł, M.; Uddin, G.S. Economic policy uncertainty shocks, economic activity, and exchange rateadjustments. Econ. Lett. 2020, 186, 108765. [Google Scholar] [CrossRef]
  26. Kido, Y. The Transmission of US Economic Policy Uncertainty Shocks to Asian and Global Financial Markets. N. Am. J. Econ. Financ. 2018, 46, 222–231. [Google Scholar] [CrossRef]
  27. Tan, Y.; Hu, H.T.; Li, D.S. The lmpact of Economic Uncertainty on the Price of Agricultural Products from Perspective of lndustrial Chain. J. Agrotech. Econ. 2018, 7, 80–92. [Google Scholar] [CrossRef]
  28. Wen, J.; Khalid, S.; Mahmood, H.; Zakaria, M. Symmetric and Asymmetric Impact of Economic Policy Uncertainty on Grain Prices in China: A new evidence. Resour. Policy 2021, 74, 102247. [Google Scholar] [CrossRef]
  29. Long, S.; Li, J.; Luo, T. The Asymmetric Impact of Global Economic Policy Uncertainty on International Grain Prices. J. Commod. Mark. 2022, 78, 101570. [Google Scholar] [CrossRef]
  30. Zhu, H.M.; Huang, R.; Wang, N.L.; Hau, L.Y. Does Economic Policy Uncertainty Matter for Commodity Market in China? Evidence from Quantile Regression. Appl. Econ. 2020, 52, 2292–2308. [Google Scholar] [CrossRef]
  31. Zhang, J.H.; Hua, J.G.; Tang, H.C.; Wu, Y.P. Economic Policy Uncertainty and Price Fluctuation of Agricultural Products. J. Agrotech. Econ. 2019, 5, 110–122. [Google Scholar] [CrossRef]
  32. Xiao, X.Y.; Tian, Q.S.; Hou, S.X.; Li, C.G. Economic Policy Uncertainty and Grain Futures Price Fluctuation: Evidence from China. China Agric. Econ. Rev. 2019, 11, 642–654. [Google Scholar] [CrossRef]
  33. Paul, R.K.; Garai, S. Performance Comparison of Wavelets-based Machine Learning Technique for Forecasting Agricultural Commodity Prices. Soft Comput. 2021, 25, 12857–12873. [Google Scholar] [CrossRef]
  34. Baker, S.R.; Bloom, N.; Davis, S.J. Measuring Economic Policy Uncertainty. Q. J. Econ. 2016, 131, 1593–1636. [Google Scholar] [CrossRef]
  35. Choi, M.J.; Hwang, S.; Im, H. Cross-border Trade Credit and Trade Flows during the Global Financial Crisis. Int. Rev. Econ. Financ. 2022, 82, 497–510. [Google Scholar] [CrossRef]
  36. Aftab, M.; Phylaktis, K. Economic Integration and Exchange Market Pressure in a Policy Uncertain World. J. Int. Money Financ. 2022, 128, 102701. [Google Scholar] [CrossRef]
  37. Liu, Q.D. Study on the Impact of the China-U.S. Trade War on China and the World Economy. J. Asia Soc. Sci. 2021, 2, 109–129. [Google Scholar] [CrossRef]
  38. Hu, G.H.; Liu, S. Economic Policy Uncertainty (EPU) and China’s Export Fluctuation in the Post-pandemic Era: An Empirical Analysis based on the TVP-SV-VAR Model. Front. Public Health 2021, 9, 788171. [Google Scholar] [CrossRef]
  39. Yao, H.Z.; Zuo, X.X.; Zuo, D.X.; Lin, H.; Huang, X.M.; Zhang, C.F. Study on Soybean Potential Productivity and Grain Security in China under the Influence of COVID-19 Outbreak. Geogr. Sustain. 2020, 1, 163–171. [Google Scholar] [CrossRef]
  40. Mei, D.X.; Xie, Y.T. US Grain Commodity Futures Price Fluctuation: Does Trade Policy Uncertainty Matter? Financ. Res. Lett. 2022, 48, 103028. [Google Scholar] [CrossRef]
  41. Falkendal, T.; Otto, C.; Schewe, J.; Jägermeyr, J.; Konar, M.; Kummu, M.; Watkins, B.; Puma, M.J. Grain Export Restrictions during COVID-19 Risk Food Insecurity in Many Low- and Middle-Income Countries. Nat. Food 2021, 2, 11–14. [Google Scholar] [CrossRef]
  42. Yang, J.; Jiang, H.M. Analysis of Fluctuations and Influential Factors for Pork Price in Jilin Province. Chin. J. Anim. Sci. 2015, 51, 39–43. [Google Scholar]
  43. Tong, H. Threshold Models in Nonlinear Time Series Analysis. In Lecture Notes in Statistics; Springer: Berlin/Heidelberg, Germany, 1983. [Google Scholar] [CrossRef]
  44. Hansen, B. Sample Splitting and Threshold Estimation. Econometrica 2000, 68, 575–603. [Google Scholar] [CrossRef]
  45. Joets, M.; Mignon, V.; Razafindrabe, T. Does the Fluctuation of Commodity Prices Reflect Macroeconomic Uncertainty? Energy Econ. 2017, 68, 313–326. [Google Scholar] [CrossRef] [Green Version]
Figure 1. Global economic policy uncertainty index and soybean and corn price growth rates. Sources: The graph shown above is the author’s plot based on the above data. The data of the corn and soybean prices come from the Brick Agricultural Database. The data of the global economic policy uncertainty index come from the Economic Policy Uncertainty Website.
Agriculture 12 01526 g001
Figure 2. Transmission path of the impact of uncertainty shock on grain price changes. Sources: The picture is drawn by the author by analyzing the impact of uncertainty on grain prices.
Agriculture 12 01526 g002
Table 1. ADF test results.
VariableADFp
GEPU−18.089<0.0001
SOYB−4.1540.006
CORN−3.7290.021
GDP−9.217<0.0001
OIL−11.885<0.0001
SYEI−15.844<0.0001
SIMP−15.929<0.0001
CYEI−15.536<0.0001
CIMP−16.267<0.0001
SSEE−9.254<0.0001
CSEE−10.782<0.0001
Table 2. Nonlinear test results.
SOYB, CORNSOYBCORN
DimensionpBootstrap Sampling-pBDS
Statistics
Standard QuantityZ
Statistics
BDS
Statistics
Standard QuantityZ Statistics
2<0.0001<0.00010.0540.0077.9620.0320.0065.246
3<0.0001<0.00010.1080.0119.9490.0540.0105.612
4<0.0001<0.00010.1440.01311.1790.0620.0115.835
5<0.0001<0.00010.1600.01311.8730.0630.0126.009
6<0.0001<0.00010.1700.01313.0680.0780.0126.040
Table 3. Soybean price threshold quantity determination results.
Threshold VariableThreshold
Determination
F StatisticS-F StatisticCritical ValueSequential ValueSplit Value
GEPU (-5)0 vs. 1 *2.74538.44327.0319.99519.995
1 vs. 21.20416.85829.24
Note: * indicates that it passed the significance test at the 5% level.
Table 4. Corn price threshold quantity determination results.
Threshold VariableThreshold
Determination
F StatisticS-F StatisticCritical ValueSequential ValueSplit Value
GEPU (-5)0 vs. 1 *2.70840.62327.0319.99519.995
1 vs. 21.04215.62929.24
Note: * indicates that it passed the significance test at the 5% level.
Table 5. Soybean price model regression results.
VariablesLinear
Regression
pThreshold Regression (Zone 1)
GEPU (−5) < 19.995
pThreshold Regression (Zone 2)
19.995 ≤ GEPU (−5)
p
GEPU (−5)−0.0440.499−0.099 *0.0630.165 ***0.010
SSEE0.082 **0.0150.109 *0.0890.246 ***0.001
GDP0.3810.7810.0890.8420.124 *0.067
OIL−0.313 **0.015−0.065 ***0.0041.801 **0.031
SYIE0.981 *0.0960.082 **0.015−0.182 **0.040
SIMP−0.291 *0.0760.8530.103−0.0410.663
C0.0890.351−0.0070.2030.032 **0.019
Sum of variable coefficients0.8851.0622.145
F-statistic2.966106.232
R20.6600.789
Adjusted R20.6350.731
Note: ***, ** and * represent significance tests at 1%, 5% and 10% levels, respectively.
Table 6. Corn price model regression results.
VariablesLinear
Regression
pThreshold Regression (Zone 1)
GEPU (−5) < 19.995
pThreshold Regression (Zone 2)
19.995 ≤ GEPU (−5)
p
GEPU (−5)−0.0020.981−0.061 **0.0210.117 **0.036
CSEE0.985 ***0.0030.003 **0.0100.066 ***0.002
GDP0.4450.7520.4570.9150.648 **0.019
OIL−0.322 **0.011−0.177 ***0.0030.203 *0.080
CYIE0.1060.8740.643 *0.0881.5320.558
CIMP−0.017 *0.078−0.1140.102−0.631 **0.019
C−0.5850.3940.0520.2480.098 ***0.000
Sum of variable coefficients0.6040.8032.033
F-statistic1.961106.232
R20.6510.891
Adjusted R20.6250.785
Note: ***, ** and * represent significance tests at 1%, 5% and 10% levels, respectively.
Publisher’s Note: MDPI stays neutral with regard to jurisdictional claims in published maps and institutional affiliations.

