Article

Spatial Distribution, Pollution Characteristics, and Health Risk Assessment of Heavy Metals in Soils from a Typical Agricultural County, East China

1
Shandong Institute of Geophysical and Geochemical Exploration, Jinan 250013, China
2
School of Earth Sciences, Chengdu University of Technology, Chengdu 610059, China
3
Shandong Provincial Bureau of Geology & Mineral Resources, Jinan 250013, China
4
Institute of Geophysical & Geochemical Exploration, Chinese Academy of Geological Sciences, Langfang 065000, China
5
College of Geo-Exploration Science and Technology, Jilin University, Changchun 130012, China
*
Author to whom correspondence should be addressed.
Agriculture 2022, 12(10), 1565; https://doi.org/10.3390/agriculture12101565
Submission received: 1 September 2022 / Revised: 21 September 2022 / Accepted: 21 September 2022 / Published: 28 September 2022
(This article belongs to the Special Issue Agricultural Environmental Pollution, Risk Assessment, and Control)

Abstract

:
This study collected 1135 topsoil samples of cultivated land in Laiyang County, eastern China, to analyze the distribution, pollution and health risks of heavy metals (As, Cd, Cu, Cr, Hg, Ni, Pb and Zn). The results show that: (1) the levels of eight heavy metals at some sites were higher than the risk screening values in China, and there was heavy metal pollution. (2) An improved geoaccumulation index was used to evaluate soil pollution. The average value of Igeo before and after improvement was 0.32 (Iml, no pollution to medium pollution) and −0.04 (Iol, no pollution), respectively. (3) Hg and Cd were identified as the main contributors to ecological risk in this study, with a cumulative ecological risk contribution percentage > 65%. The results of the potential ecological risk index (PERI) show that 9.3% of the sampling sites were considered to have moderate ecological risk. (4) As, Pb, Ni and Cu made a contribution of >95% in terms of non-carcinogenic risk to adults and children through different exposure routes, and different soil intake routes posed no non-carcinogenic risk to adults; there was a sampling site with HQChildren > 1, which was consistent with the non-carcinogenic risk site, indicating that children in this location and surrounding areas are more likely to face dual health risks. Therefore, it is necessary to promote the risk management of heavy metals in the study area in order to safely use soil resources.

1. Introduction

As the main component of cultivated land, the quality of soil can directly affect crop growth, food safety, and even biological health [1,2,3,4,5]. According to the National Survey Bulletin on Soil Pollution (2014) [6], 19.4% of the cultivated land in China exceeded the designated standards for heavy metals, among which cadmium (Cd), nickel (Ni), copper (Cu), arsenic (As), mercury (Hg), and lead (Pb) were identified as the main pollutants. The Global Assessment of Soil Pollution: Report (2021) [7] pointed out that the growing demand for agricultural products and industrial systems, as well as the growing global population, has led to the serious pollution of cultivated soil. The accumulation of heavy metals in cultivated soil leads to declines in soil fertility and soil function, which affect the yield and quality of crops [3]. Moreover, these heavy metals can enter the human body via the food chain, thereby posing a considerable threat to human health [8]. Consequently, the Joint Environmental Protection Agency has listed the eight heavy metals Pb, Cd, chromium (Cr), Hg, As, Cu, zinc (Zn), and Ni as priority targets for pollutant control [9,10].
Cultivated soil is one of the prominent sinks of heavy metals. A combination of high geological background, secondary enrichment during pedogenesis, and human activities can contribute varying degrees of heavy metal pollution, which often exceed the respective standards for cultivated soil [11,12]. Heavy metals are characterized by high toxicity, non-biodegradability, and bioaccumulation in cultivated soils [13,14,15,16,17], and can enter the human body directly via skin contact, inhalation, or ingestion, thereby posing a potential risk to health [18,19], examples of which include Minamata disease caused by Hg pollution [20,21] and Itai-itai disease attributable to the long-term consumption of Cd-contaminated rice [22,23]. Consequently, it is necessary to study the enrichment, spatial distribution, and sources of heavy metals in soil, particularly from the perspective of pollution and health risk assessments. In this regard, the most effective strategy for dealing with the pollution of cultivated land is to conduct comprehensive soil environmental quality and pollution assessments, examine the potential ecological and health risks of heavy metals, and take proactive measures to avoid the high labor and capital costs of future pollution treatment and landscape restoration [24,25]. Among the analytical approaches currently adopted to determine the correlations and sources of heavy metals in soil, principal component analysis (PCA), cluster analysis, and the positive matrix factorization (PMF) model are routinely applied, whereas the ecological risk index and health risk assessments are mainly used to evaluate the ecological impact of heavy metals and determine the risk of exposure to soil-borne heavy metals [26,27,28,29,30,31]. Moreover, some scholars [13,25] are of the opinion that in order to effectively and objectively evaluate the pollution status and risks posed by soil-borne heavy metals in a specific area, it is necessary to concurrently evaluate the spatial distribution and pollution characteristics of these metals, as well as conducting risk assessments.
The area selected for investigation in the present study is located in Laiyang County in the east of China, which from a geomorphological perspective is a self-contained small watershed system, with cultivated land distributed on either side of the main river. The watershed area is small and the water system is simple, and as such, is less affected by external interference factors. By studying such small watersheds, it is possible to more accurately identify local heavy metal distribution, pollution, and sources, and conduct health risk characteristic assessments. Focusing on this hilly agricultural area of Laiyang County, we set out with the following research objectives: (1) to analyze the content and distribution characteristics of heavy metals in cultivated soil, based on heavy metal reference values, correlations, and surface geochemical characteristics; (2) to analyze the pollution characteristics of heavy metals in cultivated land using an improved geoaccumulation index method; and (3) to assess the potential ecological risks of heavy metals in cultivated soil and the health risks associated with human exposure. The results of this study will contribute to furthering our understanding of the spatial distribution and risk characteristics of soil-borne heavy metals in cultivated land lying within small watersheds, as well as the accurate classification management and safe utilization of soils in typical small watersheds with high geological backgrounds.

2. Materials and Methods
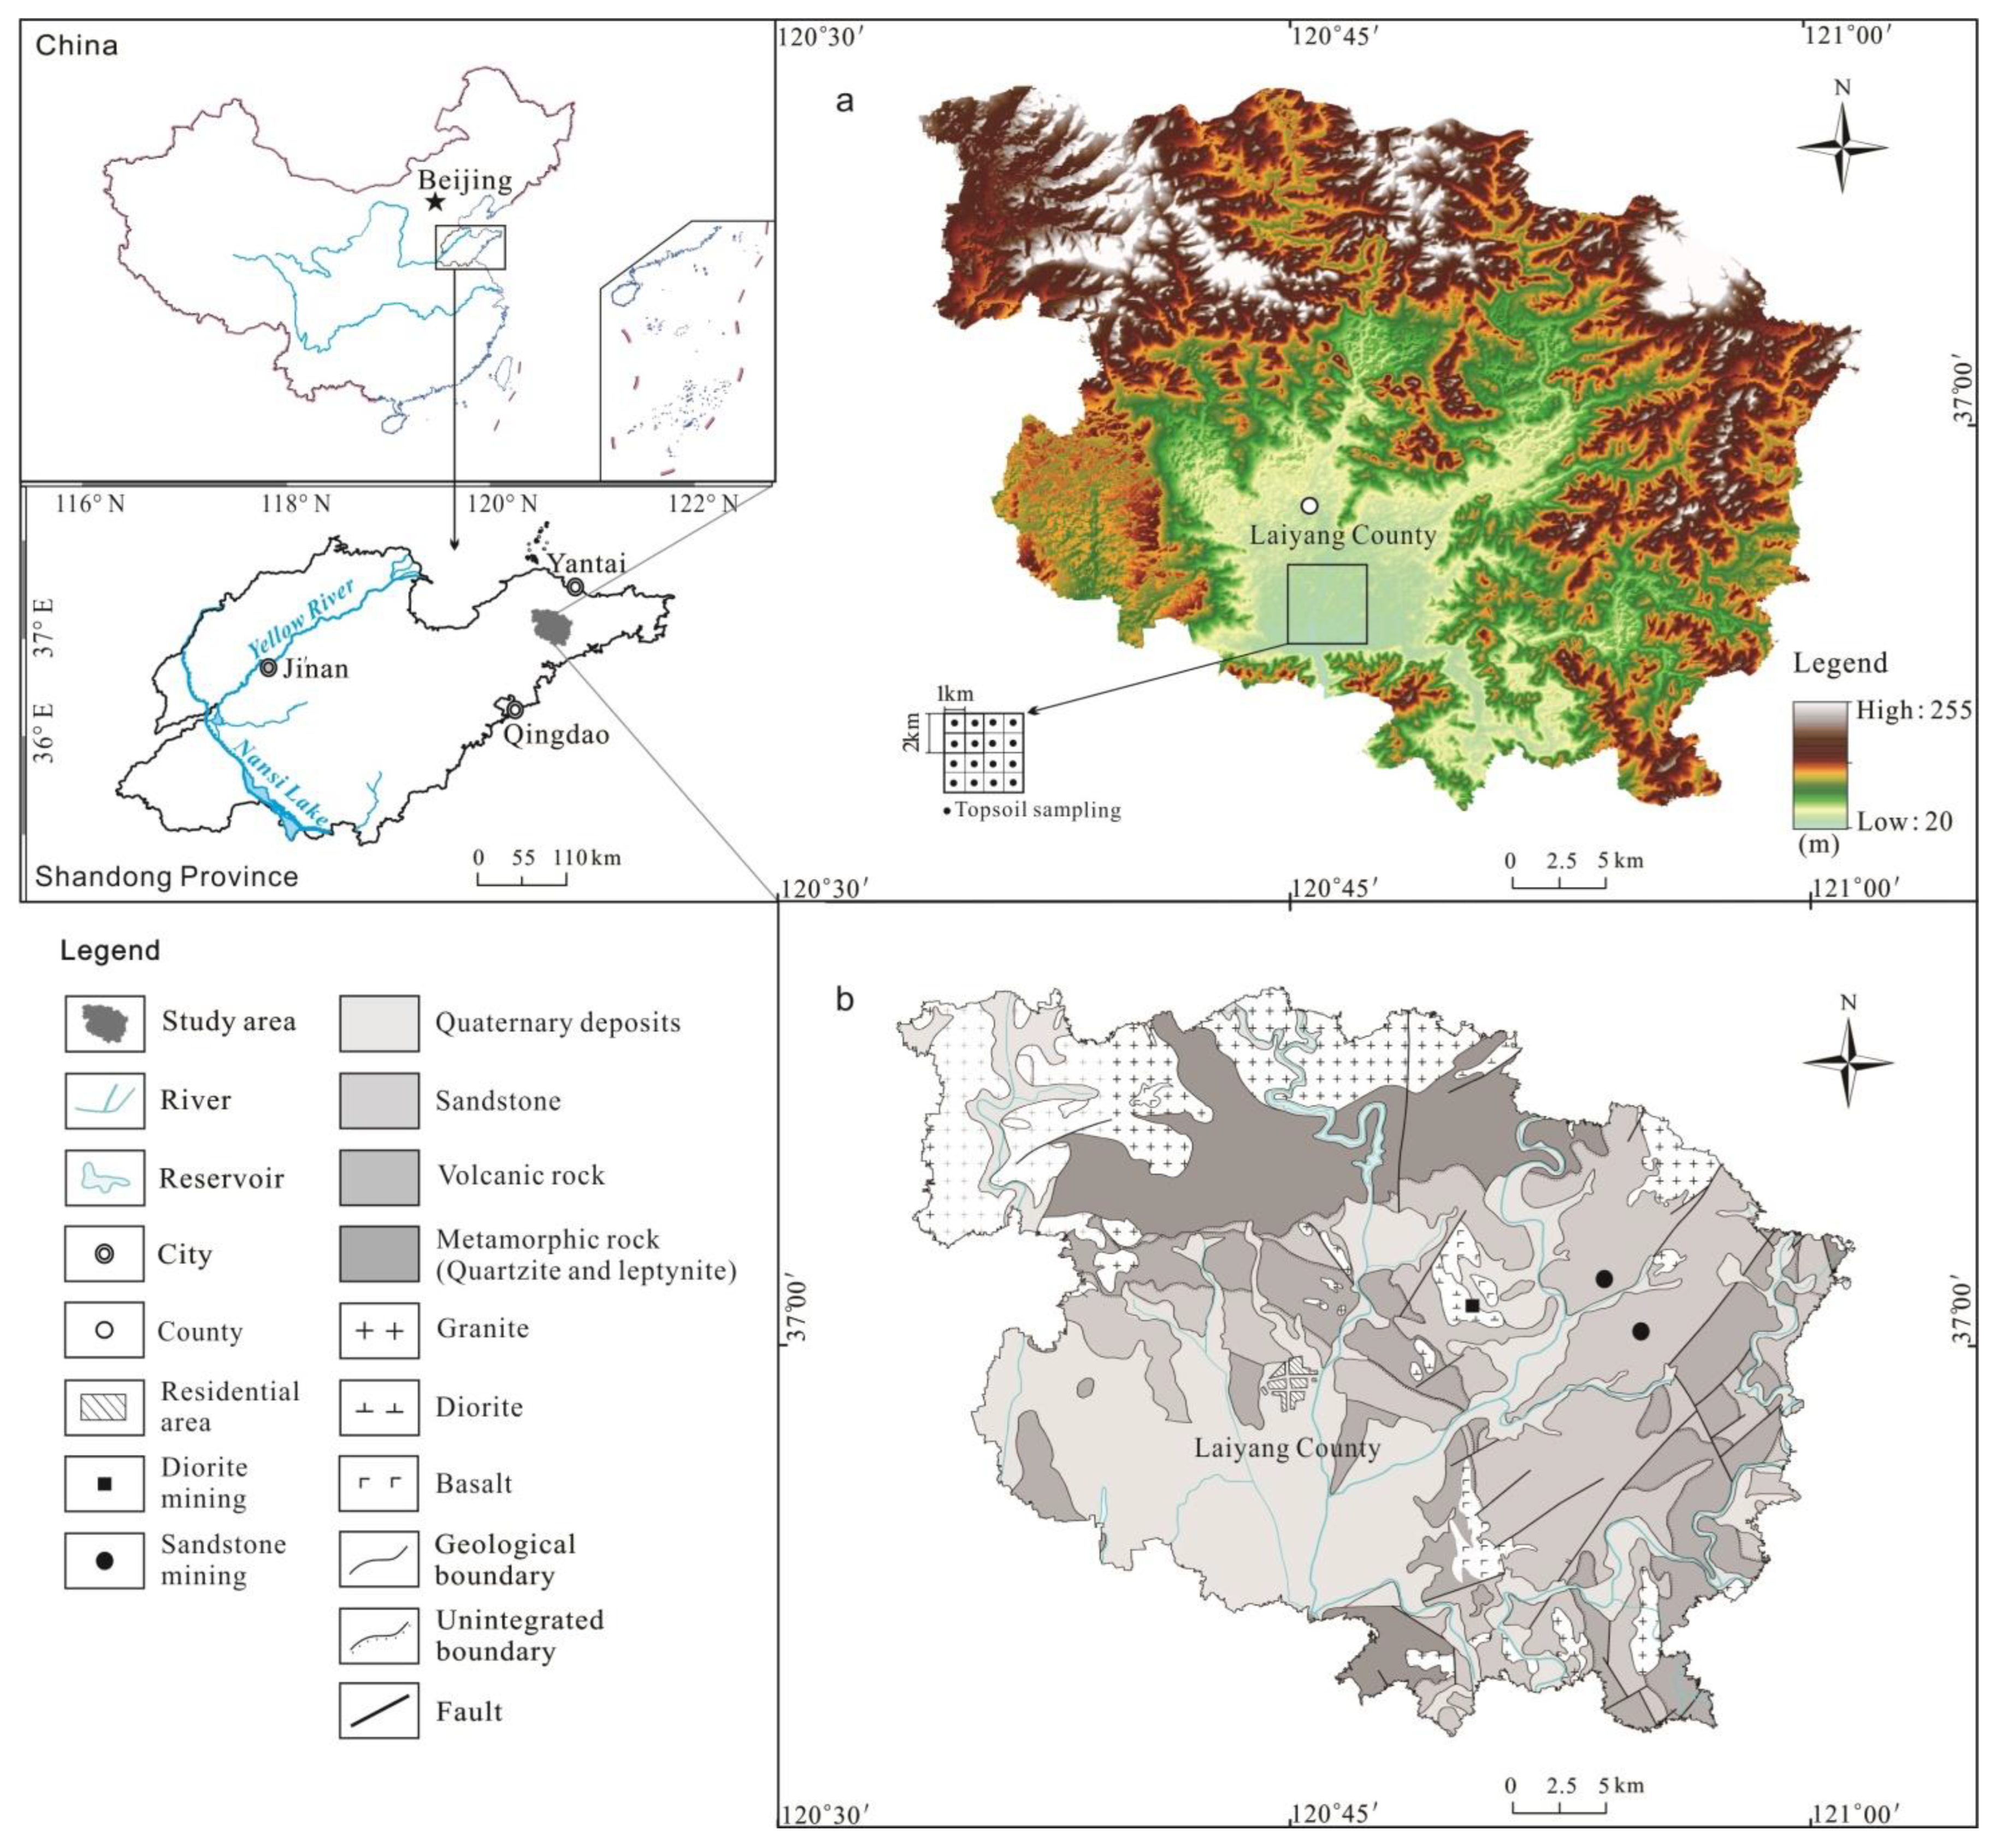
2.1. Study Area

Laiyang County, located in the east of Shandong Province (Figure 1), is the main area in China for the cultivation of Laiyang pears, a renowned high-quality agricultural product. The geographical coordinates of the study area, which covers approximately 1091 km2, are 120°31′–121°00′ E, 36°48′–37°09′ N. The main land-use type is arable land, which accounts for 83% of the total. The study area lies within the north temperate monsoon zone. There are four distinct seasons, a year-round southeasterly prevailing wind, and sufficient sunlight. Annual averages for precipitation, temperature, relative humidity, sunshine hours, wind speed, and frost-free periods are 800 mm, 11.2℃, 73%, 2996 h, 2.7 m/s, and 173 days, respectively. The study area is typical of the hilly landforms in eastern Shandong Province, with the terrain sloping from north to south (Figure 1a). Mountains, hills, and plains account for 21.5%, 47.06%, and 31.43% of the total area, respectively. The area is located along the northeastern margin of the Jiaolai Basin of the North China Plate, where northeasterly trending fault structures have developed. Rock outcrops include Archean, Proterozoic basement metamorphic rock series, Mesozoic Cretaceous, Cenozoic Paleogene, Neogene, and magmatic rocks, which are mainly distributed in the northern part of the study area. On the basis of the relationship between the rocks and the soil-forming parent materials, the outcrops are mainly classified as Quaternary sediments, sandstones, volcanic rocks, metamorphic rocks, granites, diorites, and basalt parent materials (Figure 1b). The soil types in the study area mainly include brown, riparian fluvo-aquic, coarse bone, and cinnamon soils. The study area is dominated by agriculture, and the non-metallic minerals are mainly quarried for construction material [32,33,34].

2.2. Sampling and Analysis

Topsoil samples were collected from 1135 sampling sites in cultivated land in the study area at a sampling density of 1 point km−2 (Figure 1a). The topsoil samples were extracted to a depth of 20 cm, and at each sample site we collected of five sub-samples, which were mixed to give a single composite sample, the fresh mass of which was at least 1500 g.
The soil samples were placed in a ventilated area to dry naturally. Then, they were passed through a 10-mesh (pore size 2 mm) nylon sieve. For each sample, 100g was obtained via an aliquot device for sample preparation, ground, and passed through a 200-mesh (pore size 75 μm) nylon sieve for analysis. The techniques applied for heavy metal analyses were as follows. (1) Pb, Ni, Cr, Zn, and Cu were determined by X-ray fluorescence spectrometry (Axiosmax; PANalytical B.V, Almelo, The Netherlands), for which 4.00 g aliquots of sampled soils were initially introduced evenly into a low-pressure polyethylene plastic ring, which was placed on a press, and subjected to powder pressing prior to analysis. (2) Cd was determined by graphite furnace atomic absorption spectrometry (GF-AAS, PE600; Thermo Elemental, Waltham, MA, USA). Aliquots (0.2500 g) of powdered sample were placed in a polytetrafluoroethylene crucible, and digested by the addition of a mixed acid solution (HF–HClO4–HNO3). The samples were then shaken to obtain a constant volume for testing. (3) As and Hg were determined by hydride generation–atomic fluorescence spectrometry (AFS9750; Beijing Haiguang Instrument, Beijing, China). Soil samples (0.5000 g) were placed in colorimetric tubes, and dissolved by the addition of aqua regia and incubation in a water bath. Following incubation, the suspensions were made up to volume by the addition of 10% hydrochloric acid and shaken well prior to determination. The pH of samples was determined using a potentiometric method (PHS-3C; Shanghai Precision Scientific Instrument Co., Ltd., Shanghai, China), the values of which are displayed to two decimal points. The detection limits set for As, Cd, Cr, Cu, Hg, Ni, Pb, and Zn were 0.2, 0.02, 2, 1, 0.0003, 2, 1, and 2 mg kg−1, respectively, which are all below the minimum requirements of the Land Quality Geochemical Evaluation Specifications (DZ/T0295-2016). Prior to use, all glassware used in analyses was soaked in 10% nitric acid solution for 24 h, all reagents were of analytical grade, and the water used for analyses was ultrapure. For analytical purposes, we determined values for 50 duplicate samples and four national standard soil materials (GBW-07403) for quality control. The sample repeatability inspection pass rate and the abnormal point repeated inspection pass rate were established to be 92.1–97.5%, and 95.3–99.6%, respectively, and the values obtained for the standard samples were all within the accepted error range.

2.3. Statistical Analysis

SPSS 19.0 (IBM Inc., Armonk, NY, USA) and Origin 2022 (Origin Lab Corporation., Northampton, MA, USA) were used for data processing and statistical analysis. The number of decimal places of the reported values for raw data and various statistical parameters were determined by comprehensively considering the national standard detection limit and the reliable value of the actual detection limit in the laboratory. The suitability of the sample data was assessed using the Kaiser–Meyer–Olkin (KMO) and Bartlett spherical tests. Maps were produced using ArcGIS 10.2 (Esri, Redlands, CA, USA), and graphics were generated using CorelDraw X8 (Corel, Ottawa, ON, Canada).

2.4. Evaluation Method

2.4.1. The Geoaccumulation Index Method and Its Improvement

The geoaccumulation index [35] is a quantitative index that is used to assess the degree of heavy metal pollution in soils and sediments [36,37]. The index takes into account the extant natural geological processes, and can directly reflect the level of heavy metal pollution through changes in the measured values of heavy metal elements relative to the environmental background value [14]. It is calculated using the following formula:
I g e o = log 2 C i K × B i ,
where Igeo is the geoaccumulation index (abbreviated as Iol herein); Ci is the concentration of heavy metal i in the surface soil of the study area (mg kg−1); Bi is the geochemical background value of heavy metal i in the soil (mg kg−1); and K is the change conversion coefficient (the general value of which is 1.5). A change in geoaccumulation index values can reflect the pollution characteristics of soil. The corresponding grading standards are as follows [14,35,37]: unpolluted (Igeo < 0), unpolluted to moderately polluted (0 ≤ Igeo < 1), moderately polluted (1 ≤ Igeo < 2), moderately to severely polluted (2 ≤ Igeo < 3), severely polluted (3 ≤ Igeo < 4), severely to extremely polluted (4 ≤ Igeo < 5), and extremely polluted (Igeo ≥ 5).
However, the uncertainty in the selection of evaluation parameters and the size of samples used in the traditional evaluation of the cumulative index results in certain differences in the evaluation of soil accumulation, and the large span of the degree of pollution classification standards also contributes to inaccuracies in the evaluation results [29,38]. To overcome these problems, in the present study, we adopted an enhanced version of the geoaccumulation index method [38]. Calculations performed using the Nemerrow index method [15,39] are based on the sub-index results of a single factor, taking the maximum sub-index and the mean value of the sub-index, which can not only reflect the influence of a single factor but also deals with the comprehensive situation of multiple factors. Using this method, the average values of heavy metal concentrations in soil at sampling sites in the study area and the square mean of the maximum value of heavy metal concentrations were used to replace the single heavy metal concentration in formula (1). Accordingly, this approach not only comprehensively takes into consideration the pollution of heavy metals at each sampling point, but also highlights the severity of pollution. It can thus effectively evaluate the degree of specific heavy metal pollution in the watershed [38]. The formulae used to derive values for the improved geoaccumulation index are as follows:
P a v e l = 1 n i = 1 n C n K × B
P m a x l = C m a x K × B
I m l = log 2 ( P a v e l 2 + P m a x l 2 ) / 2 ,
where Pave1 is the average value of the heavy metal concentration variation index of n sampling points in the study area; Cn is the heavy metal concentration of the nth sampling site (mg kg−1); and B is the environmental background value of a specific heavy metal, which in this study is the geochemical background value of topsoil in Shandong Province (mg kg−1). Pmax1 is the variation index of heavy metal concentrations at the sampling point with the highest concentration; Cmax is the maximum concentration of heavy metals (mg kg−1); and Im1 is the improved geoaccumulation index. The value of the coefficient K remains 1.5, and we used the grading standard of the in situ cumulative index method.

2.4.2. Potential Ecological Risk Index

The potential ecological risk index (PERI) was first proposed by the Swedish scholar Hakanson [40] and combines toxicological, environmental, chemical, and ecological effects to express the potential ecological risks of heavy metals via intuitive and interpretable quantitative values [30,41,42,43]. It is calculated using the following formulae:
E r i = T r i × C i C n i
P E R I = i = 1 m E r i ,
where Ci is the topsoil content of heavy metal element i (mg kg−1); Cni is the geochemical background value of heavy metal element i in the topsoil of Shandong Province (mg kg−1); Eri is the potential ecological hazard index of heavy metal element i; and Tri is the toxicity response coefficient of soil heavy metal i, which refers to the heavy metal toxicity level sequence proposed by Hakanson [40]: Hg (=40) > Cd (=30) > As (=10) > Pb = Cu = Ni(=5) > Cr (=2) > Zn (=1). PERI serves as a comprehensive ecological risk index for a specific environment, which is the sum of all risk factors for each heavy metal in the cultivated soil environment. The single element potential ecological hazard index (Eri) is divided into the following five grades from low to high [31,44]: Eri < 40 represent a slight ecological hazard; 40 ≤ Eri < 80, a moderate ecological hazard; 80 ≤ Eri < 160, a considerable ecological hazard; 160 ≤ Eri <320, a strong ecological hazard; and Eri ≥ 320, a significantly strong ecological hazard. PERI is divided into the following four grades from low to high [31]: PERI < 150 represents a slight ecological risk; 150 ≤ PERI < 300, a moderate ecological risk; 300 ≤ PERI < 600, a strong ecological risk; and PERI ≥ 600, a significantly strong ecological risk.

2.4.3. Health Risk Assessment

The health risk associated with heavy metals is dependent on two factors, one of which is the level of environmental pollution, including the concentration, form, and toxic effects of heavy metals [26,45], and the second is human exposure behavior, including the behavior and characteristics of humans exposed to environmental heavy metals [18,27,46]. Heavy metals in soils can enter the human body through hand–oral ingestion, skin contact, and inhalation via attachment to dust particles, thereby posing a potential risk to health [14,47,48,49,50]. In this study, we applied three exposure methods to calculate the daily average exposure to topsoil in the study area. The evaluation models included non-carcinogenic risk and carcinogenic risk models, the values for which were obtained using the following formulae:
A D D i n g = C × I n g R × E F × E D × C F B W × A T ,
A D D i n h = C × I n h R × E F × E D × C F P E F × B W × A T ,
A D D d e r m = C × S A × A F × A B F × E F × E D × C F B W × A T ,
H I = i = 1 n H Q = i = 1 n   A D D ( i n g e s t i o n ,       i n h a l a t i o n ,       d e r m a l ) i R f D i ,  
T C R = i = 1 m C R i = i = 1 m A D D i ( i n g e s t i o n ,     i n h a l a t i o n ,     d e r m a l ) × S F i ,
where C is the topsoil heavy metal content (mg kg−1); ADD is the average daily exposure (mg kg−1); RfD is the non-carcinogenic reference dose of the exposure route; HQ is the non-carcinogenic index of heavy metal i; and HI is the total non-carcinogenic hazard index of heavy metal at the sampling point. If HI < 1, the health risk is small or negligible, whereas when HI ≥ 1, there is a non-carcinogenic risk. SFi is the carcinogenic risk coefficient of heavy metal i; CR is the carcinogenic risk of heavy metal i; and TCR is the total carcinogenic risk of heavy metals As and Cd. A TCR value < 1 × 10⁻⁶ is indicative of no risk, TCR values from 10−6 to 10−4 indicate an acceptable risk, and a TCR value > 1 × 10⁻⁴ denotes a high risk [14,26,47,48,49,50,51]. The parameters of the three exposure models are shown in Table 1, and the risk slope coefficient and reference dose of each heavy metal health risk assessment are shown in Table 2.

3. Results and Discussion

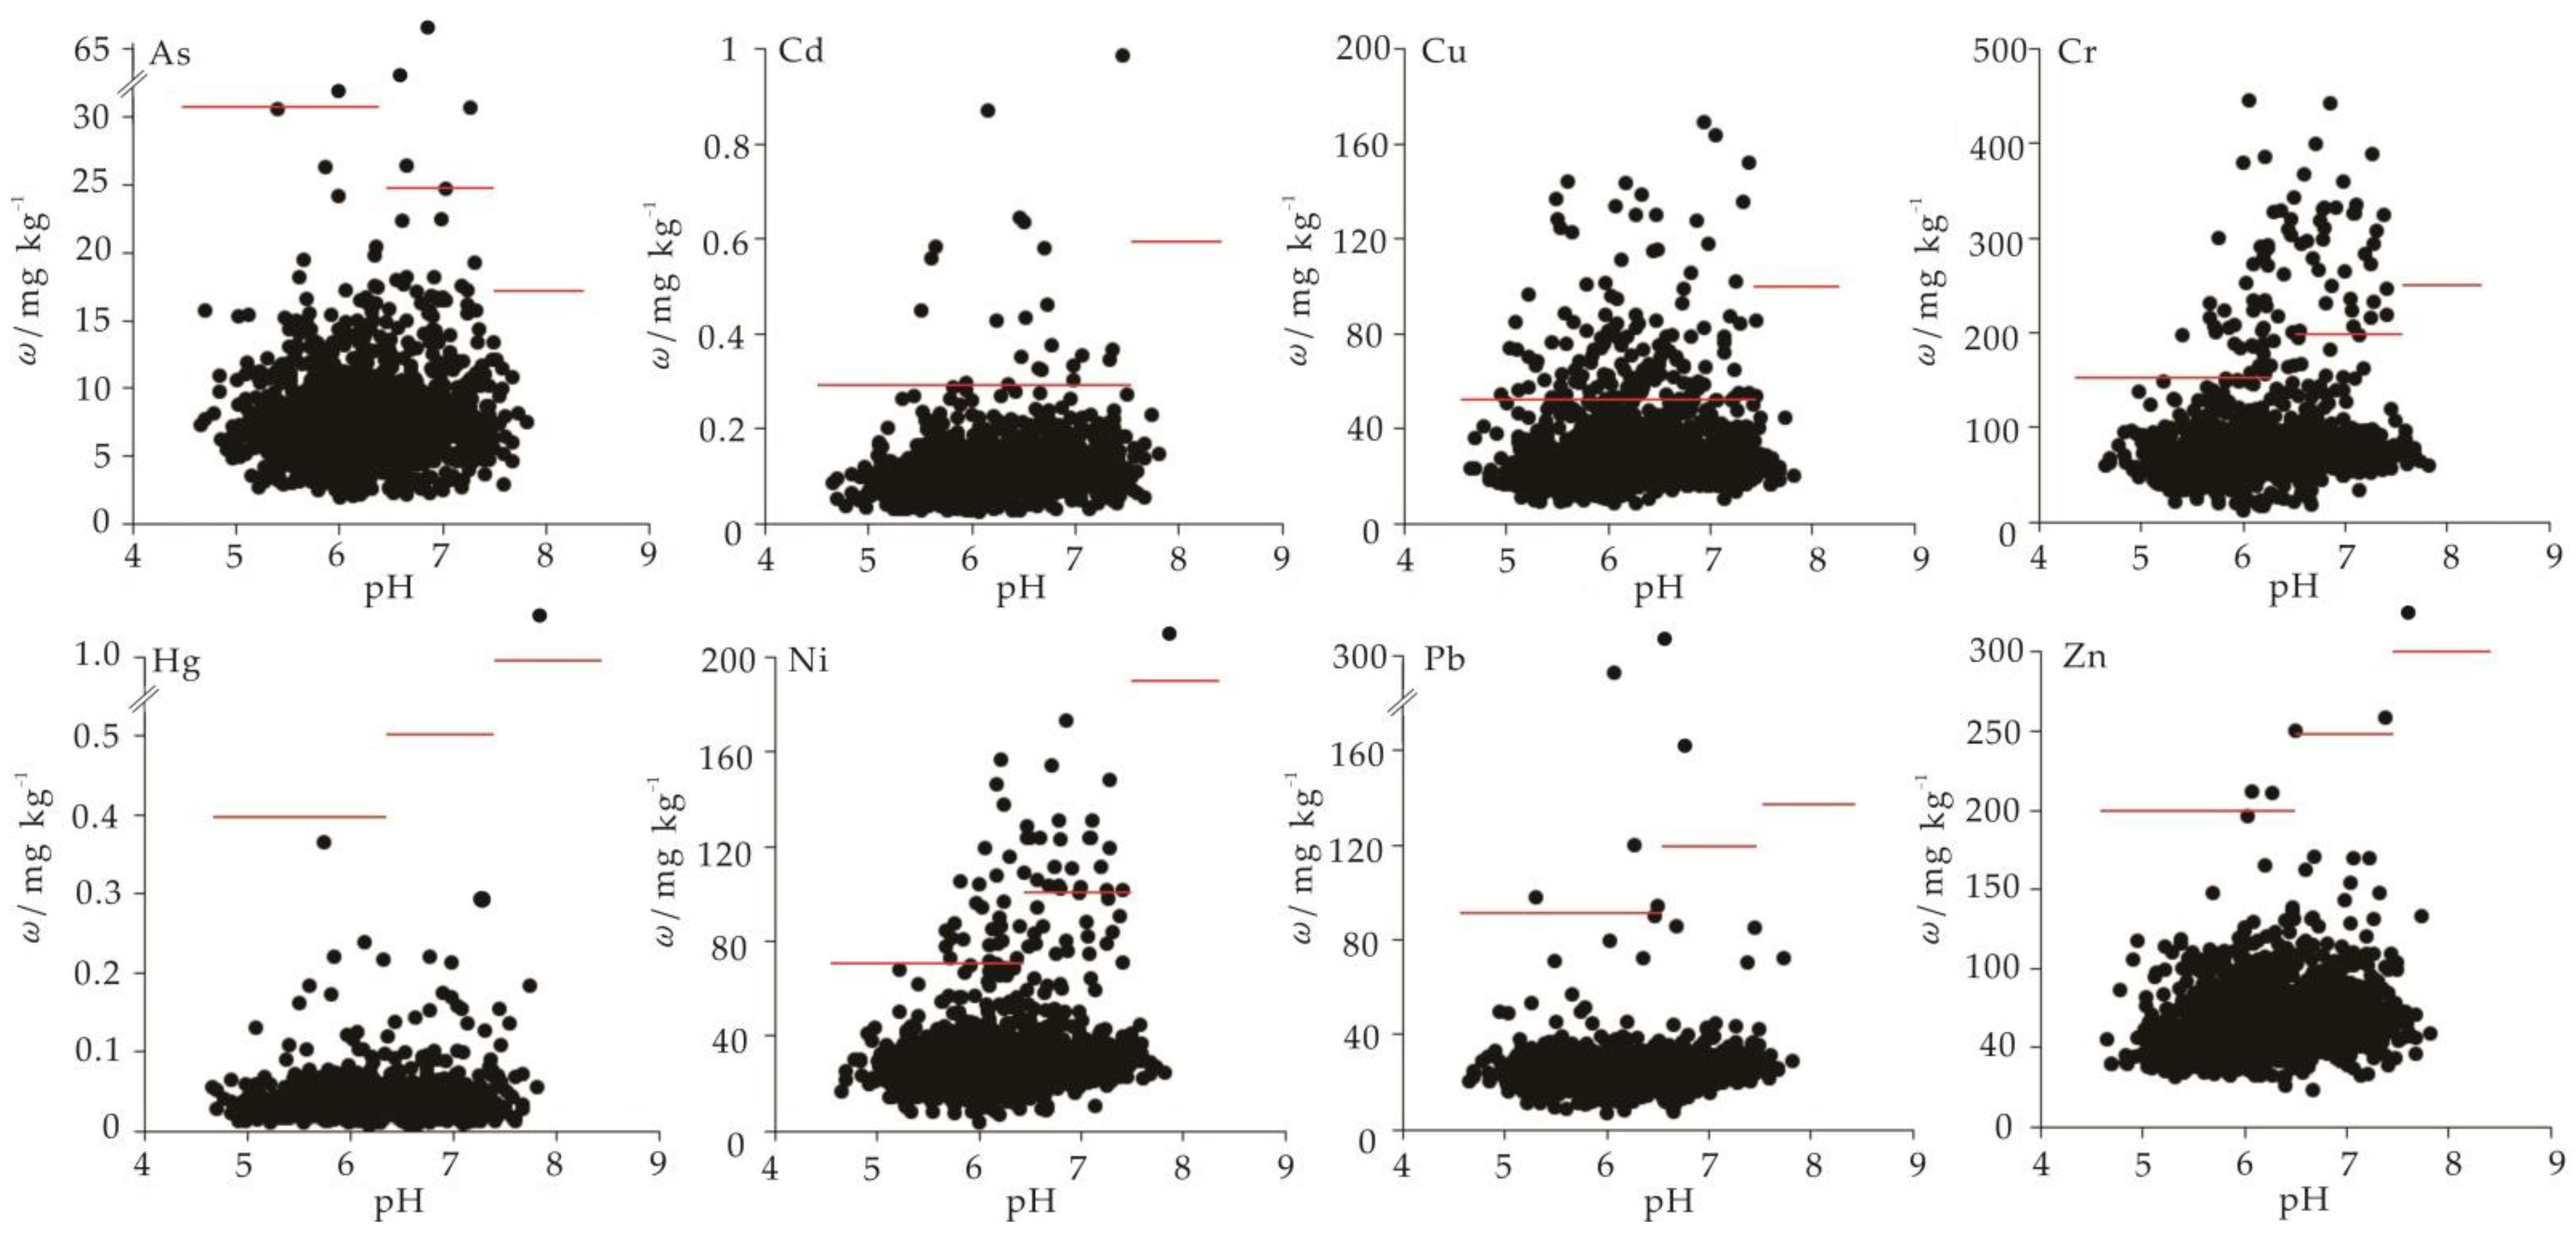
3.1. Heavy Metal Contents

The descriptive statistics (Table 3) indicate that the pH of the topsoils in the study area generally followed a normal distribution, with recorded values of between 4.66 and 7.82. The average value of pH was 6.23, and the standard deviation was 0.63. There were few data deviating from the mean. The contents of heavy metals ω(As), ω(Cd), ω(Cu), ω(Cr), ω(Hg), ω(Ni), ω(Pb), and ω(Zn) ranged from 1.9 to 66.6, 0.026 to 1.836, 8.4 to 251.7, 11.4 to 611.1, 0.006 to 0.79, 3.4 to 222.1, 6.3 to 327.2, and 263.4 to 345.3 mg kg−1, respectively. Compared with the geochemical background values of topsoils in Shandong Province [52], the average values of Cu, Cr, Hg, Ni, Pb, and Zn in the soil were significantly higher, and the proportions of sites at which levels exceeded the corresponding background values were 66.6%, 76.6%, 42.2%, 57.6%, 54.8% and 52.9%, respectively. Compared with the average values of the topsoil in China [11], the average values of Cu, Cr, and Ni in the soil were higher, and the proportion of sites at which levels exceeded the average values were 65.5%, 79.2%, and 57.8%, respectively. This indicated that the study area had a background of high contents of Cu, Cr, and Ni. Compared with the median values of the world topsoil [11], the average contents of As, Cu, and Cr were relatively high, and compared with the Agricultural Land Soil Pollution Risk Control Standards (GB 15618-2018), the number of sampling sites at which topsoil levels of As, Cd, Cu, Cr, Hg, Ni, Pb, and Zn exceeded the respective risk screening values were 5, 6, 24, 44, 1, 1, 3, and 1. In addition, it can be seen from Figure 2 that when the pH value was between 6.0 and 7.5, the contents of As, Cu, Cr, Pb, and Ni were the highest. Statistical analyses revealed the heavy metals As, Cd, Hg, and Pb to be strongly positively skewed, thereby indicating that there were a few samples with large values, which contributed to an extension of the right-hand side of the curve.
The coefficient of variation (CV) is a normalized measure of the degree of dispersion of a probability distribution, and generally, the greater the degree of dispersion, the greater the CV value. On the basis of the grading of the CV described previously [53,54,55], the CV of pH in this study was 10.1%, which indicated a low degree of variation, and the data dispersion was not large. With respect to the assessed heavy metals, we obtained CV values of 52.9%, 65.7%, 68%, 62.8%, 56.6%, and 37.1% for As, Cu, Cr, Ni, Pb, and Zn, respectively, indicating medium to high variation, whereas the CV values of 82.3% and 98.5% obtained for Cd and Hg, respectively, indicated high to extremely high variation. In general, the eight heavy metals were characterized by moderate and high variation, indicating that their data were discrete and that there were certain differences with respect to spatial distribution.

3.2. Correlation and Spatial Distribution of Heavy Metals

The results obtained from the statistical analysis of the 1135 samples revealed a sampling moderation value of 0.539 for the Kaiser–Meyer–Olkin (KMO) measure of sampling accuracy, indicating a partial correlation between variables [56]. Concurrently, we obtained a significant Bartlett spherical test value of 3376.389 (p < 0.001), indicating that the result of the PCA of variable sample data could reflect the relationships among chemical elements [57,58,59]. Based on the data validity test, the principal component analysis of eight heavy metals was carried out. According to previous research [60], it was proposed that the closer the load variable line, the stronger the correlation in the PCA component diagram. Therefore, in Figure 3, heavy metal elements in the study area are divided into two groups, namely, Ni and Cr comprising one group and Zn, Pb, Cr, Hg, As, and Cu clustered in the other. In addition, the correlation plot (Figure 4) in the study area was shown to be nearly consistent with the principal component plot (Figure 3). However, the cluster analysis diagram in Figure 4 shows some more detailed information. In addition to the strong correlation between Cr and Ni, there was also a certain correlation between Cu and Zn, while the correlation of the other four elements was much weaker. This could reflect the spatial distribution characteristics of the medium and high variation in element content in the study area.
pH is often regarded as the most important variable of soil [61,62], which reflects the acid–base environment of heavy metal elements and can contribute to determining the distribution of soil chemical elements [63]. On the basis of our analysis of the spatial distribution of pH in the study area, we established that soils to the north of the study area are acidic to weakly acidic (Figure 5), whereas those in the central area (in the vicinity of the building stone quarrying area) and southern (Laiyang County and its south) area tend to be neutral. To a large extent, the distribution characteristic of pH reflects the influence of the soil-forming parent material and human activities, whereas the spatial distribution characteristics of heavy metals in the study area (Figure 5) were found to reflect the distribution of soil pH. The study area is characterized by high natural background levels of Cu, Cr, and Ni. As shown in Figure 3, Cu and Cr and Ni show quite distinct patterns of spatial distribution, with some authors proposing that the strong correlation between Cr and Ni is associated with the parent material or processes of soil formation [12,64]. In contrast, the distributions of Hg, Cd, Pb, Cu, and Zn are generally considered to be more reflective of human activities [14,47,48,49,50,53,54,55]. Whereas we detected no obvious anomaly (any significant high value) in the distribution of Cu near urban areas, the distributions of Hg, Cd, and Pb have clearly been influenced to varying extents by the human activities in urban areas and the quarrying of building stone. This view is consistent with the conclusion of Khan N et al. [65] on heavy metals in soils along the Swat River Basin, Khyber Pakhtunkhwa, Pakistan. Specifically, in the granite-rich region to the north of the study area, we obtained notably low values for As and Pb, whereas Cd, Cr, Hg, and Ni showed mixed distribution patterns of low and medium-high abundance. In the region underlain by metamorphic rock, Cr, Cu, Ni, and Zn are characterized by a belt of middle to high values distributed in a northeasterly direction, whereas in soils formed above basic volcanic rocks in the east, there is a zone characterized by high Cr and Ni values oriented in a north–south direction. In the sandstone area in the east, we recorded mainly medium to high values for Cd, Cu, Pb, and Zn, whereas high values were obtained for As, Hg, Cu, and Pb in soil collected from the north–northeast continuous high-value points, which tends to be indicative of the geological structure of the study area. In the area underlain by Quaternary rocks, Cd, Hg, Pb, and pH showed high value distributions in Laiyang County and the area to the south.

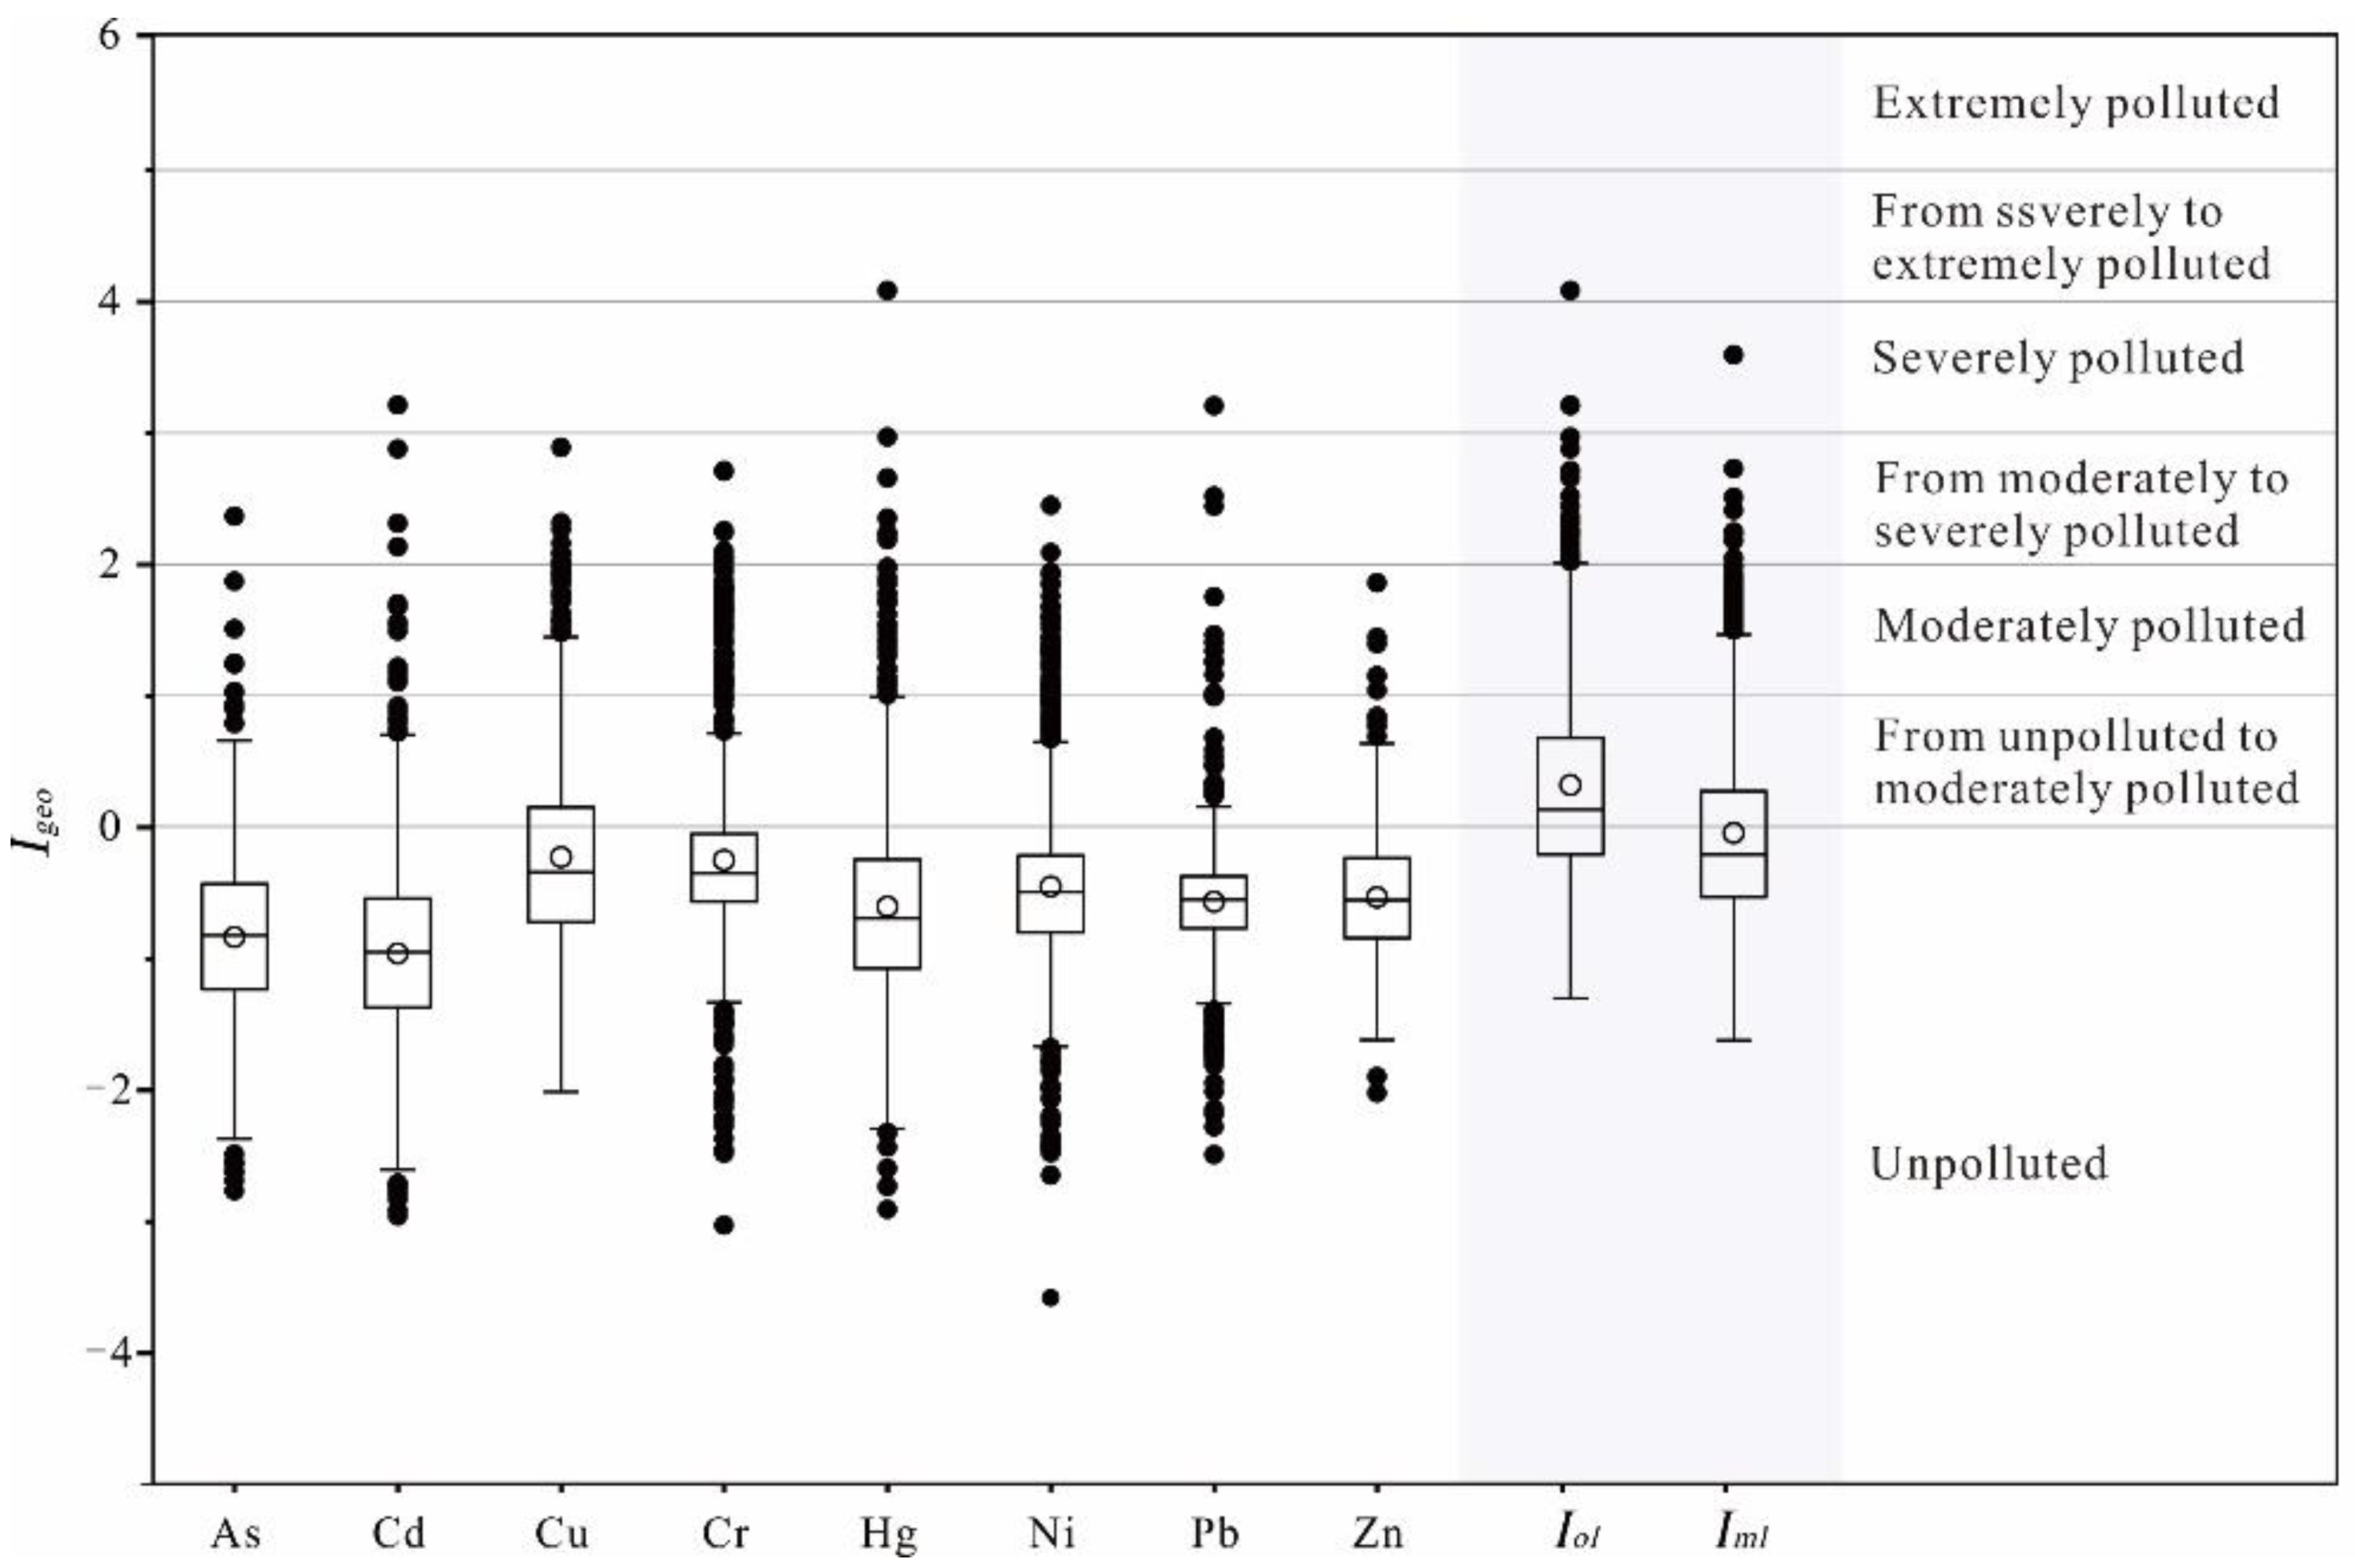
3.3. Levels of Heavy Metal Contamination

Taking the geochemical background values of surface soil in Shandong Province as reference values, we statistically analyzed the land accumulation indices of heavy metals in cultivated soil within the study area (Table 4). The Igeo of As, Cd, Cu, Cr, Hg, Ni, Pb, and Zn ranged from −2.76 to 2.37, −2.96 to 3.21, −2.01 to 2.89, −3.03 to 2.72, −2.91 to 4.09, −3.58 to 2.45, −2.49 to 3.21, and −2.02 to 1.86, respectively. The assessment results show that the pollution sites (Igeo ≥ 0) in the study area were primarily unpolluted to moderately polluted and moderately to severely polluted. Among them, Cd, Hg, and Pb each severely pollute one site. It can be seen from Table 4 that the average of Igeo was ordered as: Cu (−0.23) > Cr (−0.25) > Ni (−0.45) > Zn (−0.53) > Pb (−0.57) > Hg (−0.60) > As (−0.83) > Cd (−0.96). The order of the number of sites exceeding the background values was: Cu (359) > Cr (255) > Hg (189) > Ni (177) > Zn (142) > As (99) > Cd (84) > Pb (58). This finding thus indicated that cultivated soil in the study area was polluted to varying degrees by the eight heavy metals, among which, more than 10% of the monitored sites were found to be characterized by Cu, Cr, Hg, Ni, and Zn pollution. By comparing values obtained for the geoaccumulation index before and after performance improvement (Table 4 and Figure 6), we obtained average pre- (Iol) and post- (Iml) improvement values of 0.32 and −0.04, respectively, equating to unpolluted to moderately polluted and unpolluted sites, respectively. The corresponding Igeo > 0 sites prior to and after improvement were 677 and 421, respectively. Using the improved evaluation procedure, we found that there had been a significant reduction in the number of sites initially classified as polluted based on Iml indices, and those sites initially placed in the severely polluted were downgraded to moderately to severely polluted. As shown in Figure 7, polluted soils as determined based on Iol indices were adjudged to be widely distributed, and most sites surveyed in the study area were placed in the unpolluted to moderately polluted category. The sites characterized by moderate to severe pollution, both before and after index improvement, were found to be primarily concentrated around the Laiyang urban area, the sites of sandstone quarrying, and the southern region of the study area, which broadly correspond to the distribution of the sandstone parent material. From a comparison of Table 4 and Figure 7, it can be seen that the distribution of improved Iml data and pollution were more centralized and reasonable, and are likely to provide a more accurate reflection of the levels of heavy metal pollution in soils of the study area. This tends to be consistent with the findings of previous studies that have demonstrated that the scientific and reasonable assessment of heavy metal pollution requires not only an assessment of a combination of multiple indicators [13,22] but also certain algorithm corrections [38].

3.4. Risk Assessment of Heavy Metals

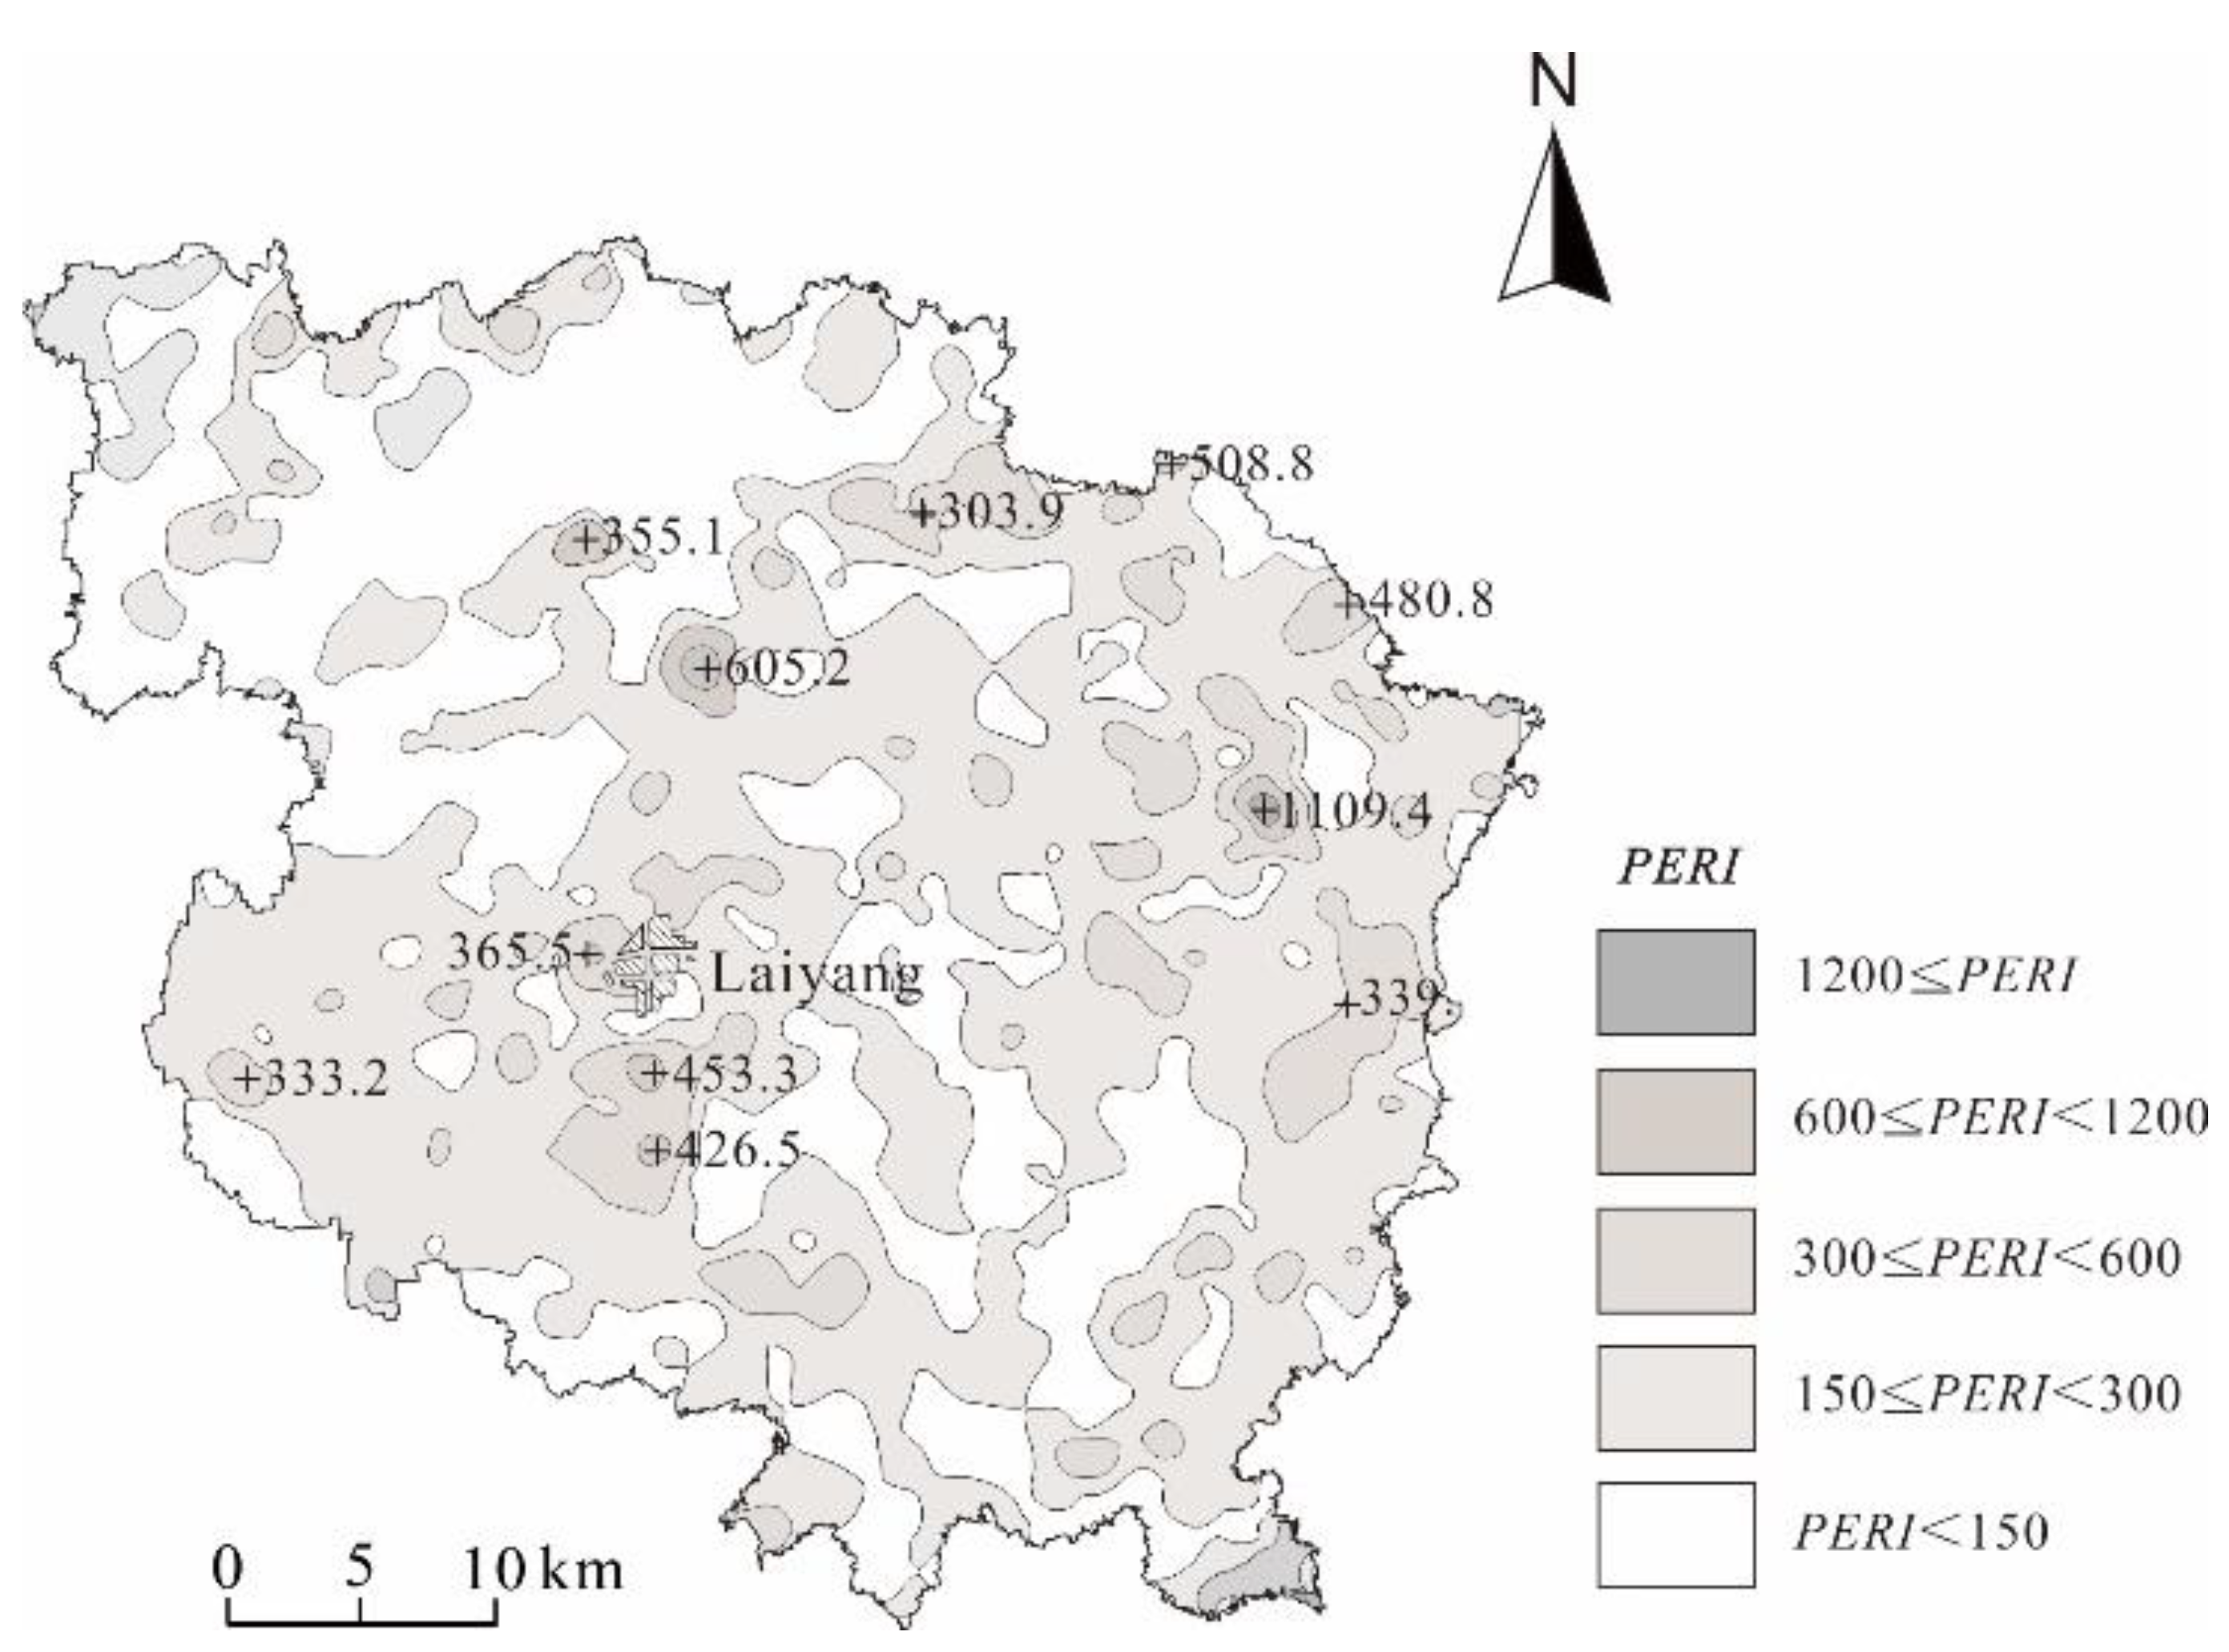
3.4.1. Potential Ecological Risk Assessment

Taking the geochemical background values of surface soil in Shandong Province as reference values, we statistically analyzed the potential ecological risk index of heavy metal elements in cultivated soil in the study area (Table 3), on the basis of which, we determined the proportional ecological risk of heavy metal elements in the study area (Figure 8). According to the calculation results (Table 5), the average Er values of the assessed metals could be arranged in the following descending order: Hg (47.2) > Cd (26.8) > As (9.3) > Cu (7.4) > Ni (6.2) > Pb (5.4) > Cr (2.9) > Zn (1.1). In general, Cr and Zn presented only a slight ecological hazard, whereas As, Cd, Cu, Hg, Ni, and Pb showed different degrees of ecological hazard, exceeding standard values at 3, 122, 1, 487, 1, and 3 sites, respectively, with corresponding rates of 0.3%, 10.7%, 0.1%, 42.9%, 0.1%, and 0.3%, respectively. The spectrum of potential ecological risks shown in Figure 8 indicates that the level of ecological risk of the assessed heavy metals could be ordered as follows: Hg > Cd > As > Cu > Ni > Pb > Cr > Zn. This is consistent with that reflected by the average Er values. This indicates that Hg and Cd were the key factors presenting an ecological risk in the study area. Table 5 shows that the percentage contribution rates of Hg and Cd to the potential ecological risk were 6.9–92.7% and 3.4–83.2%, respectively, with corresponding mean and median values of 42.1% and 25.5% and 40.9% and 24.3%, respectively. Moreover, the cumulative ecological risk contributed by Hg and Cd was estimated to be >65%, thereby indicating that Hg and Cd are the main heavy metals posing an ecological risk in the soil of the study area. The CV values obtained for Hg and Cd ecological risk were 29.3% and 38.9%, respectively, indicating a moderate variation and that the distribution of data was relatively consistent. Comparatively, the CV values obtained for Cu, Cr, and Ni, the three elements with high background levels, were greater than 50%, thereby indicating a medium-strong variance, which also implies differences in the ecological risks attributable to differences in geological background levels. PERI analysis revealed that soil at 1029 sampling points in the study area posed a slight ecological risk, whereas that at 106 sites, accounting for 9.3% of the total, posed a moderate to strong ecological risk. Patterns of the spatial distribution of PERI (Figure 9) revealed a concentration in the urban area and to the east and the north of Laiyang. This pattern corresponds to the spatial distribution and pollution levels of heavy metals, indicating that the content, pollution, and associated risk of heavy metals in the study area are interrelated variables, and also highlights the objectivity of the comprehensive evaluation indicators.

3.4.2. Health Risk Assessment

In order to assess the risk posed by heavy metal pollution in cultivated soils, it is necessary to gain an estimate of the level of exposure. Consequently, to estimate the risk of human exposure to contaminated soil via inhalation, ingestion, and skin contact, we used the total combined concentration of heavy metals to calculate the hazard quotient (HQ). The results of our non-carcinogenic health risk assessment revealed that the non-carcinogenic health risk index of the same element for the three different routes of exposure could be ordered as follows: HQing > HQdermal > HQinh. Furthermore, we found that for each of the assessed heavy metals, the average HQ value for adults and children was <1 (Table 6). The non-carcinogenic risks posed by the eight heavy metals to adults and children could be ordered as As > Pb > Ni > Cu > Cd > Zn > Hg > Cr and As > Pb > Ni > Cu > Zn > Hg > Cd > Cr, respectively. In general, we found that at none of the sampling sites in the study area was there a non-carcinogenic risk posed to human health by soil-borne heavy metals. The non-carcinogenic health risk index of adults (HIadults) was between 1.08×10² and 2.07×101, both of which are <1, indicating that there was no non-carcinogenic health risk to adults. Comparatively, the non-carcinogenic health risk index assessed for children (HIchildren) was between 1.31×101 and 3.01, among which 10 samples contained a single heavy metal with an HQ value > 1 (As in 9 samples and Pb in 1 sample), and 17 samples with an HI value > 1, accounting for 1.5% of the total. These findings accordingly indicated that the levels of soil heavy metals in the areas where these samples were collected posed a potential non-carcinogenic health risk to children. Furthermore, we found that the contents of As, Pb, Cr, Ni, and Cu in these sites exceed the corresponding risk screening values (GB15618–2018). We also estimated that the percentage contribution of As, Pb, Ni, and Cu to HI in adults and children was >95% (Table 6), and these four heavy metals were the main factors influencing the non-carcinogenic risk. It can be seen from Figure 10 that the sampling sites with HI > 1 are mainly distributed in the cultivated land at the downstream of the sandstone mining region in the east and the southeast of Laiyang County. This pattern could be explained by the high background levels associated with an area of volcanic rock in the east. Moreover, children are potentially more readily exposed to contaminated soil than are adults, owing to their particular diet and behavioral habits [66,67], which contribute to higher HI values. The increased non-cancer risk found in soil in the eastern part of the study area can be ascribed primarily to the contents of As, Pb, and Cr in natural sources. We found that the HQ and HI values obtained in the present study are significantly higher than those previously reported for this area by Zhuo et al. (2020) [14], Liu et al. (2021) [68], and Hua et al. (2022) [69], which we suspect could be attributed to our grid-intensive soil sampling across the entire region, rather than assessments based on sporadic soil sampling.
Given that As and Cd have high toxicity coefficients, they are often used to calculate carcinogenic risk [26,70]. The distributions of Cr and Ni tend to be closely correlated and have high background levels in the study area. Consequently, in the present study, we focused on the carcinogenic risks posed by As, Cd, Cr, and Ni. The results of our carcinogenic health risk assessment (presented in Table 7) show that the carcinogenic health risk indices (CR) for different routes of As and Cd exposure could be ordered as CRing > CRdermal > CRinh. Furthermore, we established that the carcinogenic risk of the assessed heavy metals to adults and children from high to low was As > Cr > Cd > Ni. It can be seen from Table 7 that the average total cancer risk (TCR) for adults and children was 8.08 × 10⁶ and 1.44 × 10⁵, respectively, both of which exceed 1 × 10⁻⁶, which is considered an acceptable level [9,47], and in the case of children, one of the TCR values was greater than 1 × 10⁻⁴, which is considered an extremely high risk level, [9,26,47]. These findings accordingly tend to indicate that both local adults and children are exposed to a potential risk of cancer. Notably, we found that the sampling site indicating a high carcinogenic risk to children coincides with that identified as posing a non-carcinogenic risk (Figure 8), thereby indicating that children living in the vicinity of this site are potentially exposed to double health risks. However, some scholars [26,27,46,70] have proposed that values of carcinogenic risk between 10−6 and 10−4 are acceptable, and thus if this standard were to be implemented, the carcinogenic risk in the study area would accordingly be deemed acceptable. However, it should be emphasized that the highest value of 1.44 × 10⁵ we obtained for carcinogenic risk to children exceeded 1 × 10⁻⁴, indicating that the local carcinogenic risk in the study area should not be ignored. Although there are many cases of human exposure to heavy metals, which may pose certain health risks, it should be noted that in our assessment, we considered only the intake of these elements via direct contact with soil. In general, humans are mainly exposed to heavy metals via less direct exposure routes, such as the consumption of contaminated food products (e.g., vegetables and meat) and water [14,26,46,51]. Consequently, in order to successfully identify common exposure pathways of potential concern, it is recommended to apply a multipath risk assessment analysis for the relevant environmental media [26,27,46].

4. Conclusions

In this study, a new combination of multiple statistical methods and the improved geoaccumulation index method was used to investigate the heavy metal pollution in topsoil in Laiyang County. Specifically, the ecological risk and health risk of heavy metals in topsoil were quantitatively evaluated and spatially analyzed. The results show the following: (1) The proportion of sites with Cu, Cr, and Ni levels exceeding the background value was more than 55%. Combined with their distribution and rock characteristics, it was considered that the study area is a typical geological high background area of the above three elements. The content of heavy metals (As, Cd, Cu, Cr, Hg, Ni, Pb, and Zn) in some sampling sites exceeded the risk screening value (GB15618-2018), indicating that those heavy metals were polluting. (2) The eight heavy metals in the study area had pollution points of different degrees, among which, the proportion of Cu, Cr, Hg, and Zn pollution points was more than 10%, being mainly unpolluted to moderately polluted and moderately polluted to severely polluted. The improved Igeo was used to generate statistics on the pollution. It was found that the average value of Iol was 0.32 (unpolluted to moderately polluted), and the average value of Iml was -0.04 (unpolluted). (3) Mercury and cadmium were identified as the main contributors to the ecological risk in the study area, with the cumulative ecological risk contribution percentage of >65%. The results of PERI showed that 9.3% of the sampling sites were considered to have moderate ecological risk. (4) The study found that As, Pb, Ni and Cu contributed more than 95% to the non-carcinogenic risk. The sampling sites with HIchildren > 1 were mainly distributed in the east of the study area; however, different routes of soil intake posed no non-carcinogenic risk to adults. Simultaneously, the risk of cancer in adults and children was acceptable. However, the location identified as posing high carcinogenic risk to children was consistent with the non-carcinogenic risk location identified by this study, which indicated that children in this location and the surrounding areas were more likely to face dual health risks.
It is worth noting that the assessment of Iml found that the distribution of contaminated soil is relatively centralized and reasonable, which can accurately reflect the pollution degree of the study area. This new exploration may help to objectively evaluate the spatial distribution of heavy metal pollution and support the risk management of heavy metals. In addition, the analysis of a typical agricultural county will also provide some reference for other cultivated soil investigations.

Author Contributions

Conceptualization, L.Y., W.L. and Z.S.; methodology, L.Y. and P.Q.; writing—original draft preparation, L.Y., W.L., J.Y., B.Z. and Z.C.; writing—review and editing, L.Y. and Z.S.; visualization, L.Y.; supervision, F.Z. and Y.Z.; project administration, W.L.; funding acquisition, H.L. All authors have read and agreed to the published version of the manuscript.

Funding

This research was funded by the Shandong Geological Exploration Project (grant nos. 2019(44) and 2020(58)) and the Science and Technology Innovation Project (grant no. KY202227) of Shandong Provincial Bureau of Geology & Mineral Resources.

Informed Consent Statement

Not applicable.

Data Availability Statement

The data presented in this study are available on request from the corresponding authors. The processed data are not publicly available as the data are also part of an ongoing study.

Acknowledgments

The authors would like to thank the editors and reviewers for their valuable comments and suggestions.

Conflicts of Interest

The authors declare no conflict of interest.

References

  1. Alexander, P.D.; Alloway, B.J.; Dourado, A.M. Genotypic variations in the accumulation of Cd, Cu, Pb and Zn exhibited by six commonly grown vegetables. Environ. Pollut. 2006, 144, 736–745. [Google Scholar] [CrossRef] [PubMed]
  2. Díaz, R.O.; Fonticiella, M.D.; Arado López, J.O.; Borrell Munoz, J.L.; D’Alessandro, R.K.; López, P.N. Spatial distribution and contamination assessment of heavy metals in urban topsoils from Las Tunas City, Cuba. Bull. Environ. Contam. Toxicol. 2013, 91, 29–35. [Google Scholar] [CrossRef] [PubMed]
  3. Balkhair, K.S.; Ashraf, M.A. Field accumulation risks of heavy metals in soil and vegetable crop irrigated with sewage water in western region of Saudi Arabia. Saudi J. Biol. Sci. 2016, 23, 32–44. [Google Scholar] [CrossRef]
  4. Zhang, D.; Huang, R.; Gao, X.S. Spatial Characteristics and Potentical Risk Factor of Heavy Metals in Cultivated Land in the Transition Zone of a Mountain Plain. Environ. Sci. 2022, 43, 946–956. [Google Scholar] [CrossRef]
  5. Ma, Q.H.; Zhang, G.H.; Geng, R. Present condition analysis of sloping farmland soil quality in the eastern water erosion zone of China. Sci. Soil Water Conserv. 2017, 15, 36–42. [Google Scholar] [CrossRef]
  6. Ministry of Environmental Protection of the PRC; Ministry of Land and Resources of the PRC. National Survey Bulletin on Soil Pollution; Ministry of Environmental Protection of the PRC: Beijing, China; Ministry of Land and Resources of the PRC: Beijing, China, 2014.
  7. Food and Agriculture Organization of the United Nations (FAO); United Nations Environment Programme (UNEP). Global Assessment of Soil Pollution: Report; Food and Agriculture Organization of the United Nations: Rome, Italy, 2021. [Google Scholar] [CrossRef]
  8. Zhao, D.J.; Wang, X.Q. Distribution, sources and potential ecological risk of heavy metals in the floodplain soils of the karst area of Yunnan, Guizhou, Guangxi. China Environ. Sci. 2020, 40, 1609–1619. [Google Scholar] [CrossRef]
  9. US EPA. Supplemental Guidance for Developing Soil Screening Levels for Superfund Sites; Office of Emergency and Remedial Response: Washington, DC, USA, 2002; pp. 4–24. [Google Scholar]
  10. Chai, L.; Wang, X.; Ma, L.; Cheng, Z.X.; Su, L.M.; Wang, Y.H. Sources appointment of heavy metals in cultivated soils of Lanzhou based on PMF models. China Environ. Sci. 2020, 40, 3919–3929. [Google Scholar] [CrossRef]
  11. Chi, Q.H.; Yan, M.C. Handbook of Elemental Abundance for Applied Geochemistry; Geological Press: Beijing, China, 2007. [Google Scholar]
  12. Zhang, F.G.; Peng, M.; Wang, H.Y.; Ma, H.H.; Cheng, H.X. Ecological risk assessment of heavy metals at township scale in the high background of heavy metals, Southwestern China. Environ. Sci. 2020, 41, 4197–4209. [Google Scholar] [CrossRef]
  13. Jia, Z.; Li, S.; Wang, L. Assessment of soil heavy metals for eco-environment and human health in a rapidly urbanization area of the upper Yangtze Basin. Sci. Rep. 2018, 8, 3256. [Google Scholar] [CrossRef] [Green Version]
  14. Ahmad, W.; Alharthy, R.D.; Zubair, M.; Ahmed, M.; Rafique, S. Toxic and heavy metals contamination assessment in soil and water to evaluate human health risk. Sci. Rep. 2021, 11, 17006. [Google Scholar] [CrossRef]
  15. Miao, R.Q.; Yan, Y.F.; Bai, Y.; Deng, A. Assessment of heavy metal contamination of soil in Kunming. Adv. Mater. Res. 2015, 1092, 774–779. [Google Scholar] [CrossRef]
  16. Chen, Z.; Xu, J.; Duan, R.; Lu, S.; Hou, Z.; Yang, F.; Peng, M.; Zong, Q.; Shi, Z.; Yu, L. Ecological Health Risk Assessment and Source Identification of Heavy Metals in Surface Soil Based on a High Geochemical Background: A Case Study in Southwest China. Toxics 2022, 10, 282. [Google Scholar] [CrossRef] [PubMed]
  17. Canpolat, Ö.; Varol, M.; Okan, Ö.Ö.; Eriş, K.K.; Çağlar, M. A comparison of trace element concentrations in surface and deep water of the Keban Dam Lake (Turkey) and associated health risk assessment. Environ. Res. 2020, 190, 110012. [Google Scholar] [CrossRef] [PubMed]
  18. Zhao, H.R.; Xia, B.C.; Fan, C.; Zhao, P.; Shen, S.L. Human health risk from soilheavy metal contamination under different land uses near Dabaoshan Mine, Southern China. Sci. Total Environ. 2012, 417–418, 45–54. [Google Scholar] [CrossRef]
  19. Rutigliano, F.A.; Marzaioli, R.; De Crescenzo, S.; Trifuoggi, M. Human health risk from consumption of two common crops grown in polluted soils. Sci. Total Environ. 2019, 691, 195–204. [Google Scholar] [CrossRef]
  20. Ekino, S.; Susa, M.; Ninomiya, T.; Imamura, K.; Kitamura, T. Minamata disease revisited: An update on the acute and chronic manifestations of methyl mercury poisoning. J. Neurol. Sci. 2007, 15, 131–144. [Google Scholar] [CrossRef]
  21. Hara, N.; Saito, H.; Takahashi, K.; Takeda, M. Lower urinary tract symptoms in patients with Niigata Minamata disease: A case-control study 50 years after methyl mercury pollution. Int. J. Urol. 2013, 20, 610–615. [Google Scholar] [CrossRef]
  22. Aziz, R.; Rafiq, M.T.; Li, T.; Liu, D.; He, Z.; Stoffella, P.J.; Sun, K.; Xiao, Y. Uptake of cadmium by rice grown on contaminated soils and its bioavailability/toxicity in human cell lines (Caco-2/HL-7702). J. Agric. Food Chem. 2015, 63, 3599–3608. [Google Scholar] [CrossRef]
  23. Pei, N.; Liang, X.F.; Qin, X.; Zhao, L.J.; Huang, Q.; Xu, Y.; Sun, Y.B. Remediation and persistent stability effects of sepiolite on cadmium-contaminated paddy soil. J. Agro-Environ. Sci. 2022, 41, 0277–0284. [Google Scholar] [CrossRef]
  24. Hu, Y.; He, K.; Sun, Z.; Chen, G.; Cheng, H. Quantitative source apportionment of heavy metal(loid)s in the agricultural soils of an industrializing region and associated model uncertainty. J. Hazard. Mater. 2020, 391, 122244. [Google Scholar] [CrossRef]
  25. Varol, M.; Gündüz, K.; Sünbül, M.R. Pollution status, potential sources and health risk assessment of arsenic and trace metals in agricultural soils: A case study in Malatya province, Turkey. Environ. Res. 2021, 202, 111806. [Google Scholar] [CrossRef] [PubMed]
  26. Liu, Y.; He, Z.H.; Niu, X.K.; Zhang, D.; Pan, B. Health Risk Assessment of Soil Heavy Metals in a Small Watershed of a Mining Area in Yunnan. Environ. Sci. 2022, 43, 936–945. [Google Scholar] [CrossRef]
  27. Wei, R.P.; Wang, X.; Tang, W.L.; Yang, Y.; Yang, L. Bioaccumulations and potential human health risks assessment of heavy metals in ppk-expressing transgenic rice. Sci. Total Environ. 2020, 710, 136496. [Google Scholar] [CrossRef]
  28. Yu, L.; Wan, F.; Fan, H.; Kang, G.; Liu, H.; Wang, D.; Xu, J. Spatial Distribution, Source Apportionment, and Ecological Risk Assessment of Soil Heavy Metals in Jianghugongmi Producing Area, Shandong Province. Environ. Sci. 2022, 43, 307–319. [Google Scholar] [CrossRef]
  29. Ju, T.N.; Lei, M. Geo-accumulation Index Method to Optimize the Evalution Method of Polymetallic Environment Quality: Taking Developed Agricultural Areas as an Example. Environ. Sci. 2022, 43, 957–964. [Google Scholar] [CrossRef]
  30. Guillén, M.T.; Delgado, J.; Albanese, S.; Nieto, J.M.; Lima, A.; Vivo, B.D. Heavy metals fractionation and multivariate statistical techniques to evaluate the environmental risk in soils of Huelva Township (SW Iberian Peninsula). J. Geochem. Explor. 2012, 119, 32–43. [Google Scholar] [CrossRef]
  31. Zhu, D.; Wei, Y.; Zhao, Y.; Wang, Q.; Han, J. Heavy metal pollution and ecological risk assessment of the agriculture soil in xunyang mining area, Shaanxi province, northwestern China. Bull. Environ. Contam. Toxicol. 2018, 101, 178–184. [Google Scholar] [CrossRef]
  32. Zhang, G.S.; Jia, X.M.; Xiao-Hang, M.; Qian, Z.; Shi, C.Y.; Zhang, D.F. The warning research of soil enzyme activities on heavy metal-contamination of brown earth in Shandong. Plant Nutr. Fertil. Sci. 2004, 10, 272–276. [Google Scholar] [CrossRef]
  33. Liu, P.; Zhao, H.J.; Wang, L.L. Analysis of Heavy Metal Sources for Vegetable Soils from Shandong Province, China. Agric. Sci. China 2011, 10, 11. [Google Scholar] [CrossRef]
  34. Zhang, F.; Chang, C.P.; Li, J.; Song, S.; Cai, W.J.; Zhao, G.S.; Li, F.D. Health risk assessment of heavy metals in groundwater in rural area of Jiaodong Peninsula:a case study in Laiyang City, Shandong Province. Environ. Sci. Technol. 2013, 36, 180–186. [Google Scholar]
  35. Muller, G. Index of geoaccumulation in sediments of the Rhine River. Geojournal 1969, 2, 108–118. [Google Scholar]
  36. Krzysztof, L.; Wiechuła, D.; Korus, I. Metal contamination of farming soils affected by industry. Environ. Int. 2004, 30, 159–165. [Google Scholar] [CrossRef]
  37. Zhuo, H.; Wang, X.; Liu, H.; Fu, S.; Ren, L. Source analysis and risk assessment of heavy metals in development zones: A case study in rizhao, china. Environ. Geochem. Health 2020, 42, 135–146. [Google Scholar] [CrossRef] [PubMed]
  38. Liu, Z.H.; Meng, R.H.; Dai, H.X.; Hong, Q.Y.; Yan, Q.H.; Liu, Y.T.; Wang, H.T.; Chen, T. Evaluation of heavy metals pollution in surface sediments using an improved geo-accumulation index method. J. Agro-Environ. Sci. 2019, 38, 2157–2164. [Google Scholar] [CrossRef]
  39. Nemerow, N. Scientific Stream Pollution Analysis; Scripta Book Co.: Washington, DC, USA, 1974. [Google Scholar]
  40. Hakanson, L. An ecological risk index for aquatic pollution control.a sedimentological approach. Water Res. 1980, 14, 975–1001. [Google Scholar] [CrossRef]
  41. Gong, Q.; Deng, J.; Xiang, Y.; Wang, Q.; Yang, L. Calculating pollution indices by heavy metals in ecological geochemistry assessment and a case study in parks of Beijing. J. Earth Sci. 2008, 19, 230–241. [Google Scholar] [CrossRef]
  42. Mungai, T.M.; Owino, A.A.; Makokha, V.A.; Gao, Y.; Yan, X.; Wang, J. Occurrences and toxicological risk assessment of eight heavy metals in agricultural soils from Kenya, Eastern Africa. Environ. Sci. Pollut. Res. Int. 2016, 23, 18533–18541. [Google Scholar] [CrossRef]
  43. Long, Z.J.; Huang, Y.; Zhang, W.; Shi, Z.L.; Yu, D.M.; Chen, Y.; Liu, C.; Wan, R. Effect of different industrial activities on soil heavy metal pollution, ecological risk, and health risk. Environ. Monit. Assess. 2021, 193, 20. [Google Scholar] [CrossRef]
  44. Zhang, L.; Liu, J. In situ relationships between spatial–temporal variations in potential ecological risk indexes for metals and the short-term effects on periphyton in a macrophyte-dominated lake: A comparison of structural and functional metrics. Ecotoxicology 2014, 23, 553–566. [Google Scholar] [CrossRef]
  45. Ferreira, B.L.; De Miguel, E. Geochemistry and risk assessment of street dust in Luanda, Angola: A tropical urban environment. Atmos. Environ. 2005, 39, 4501–4512. [Google Scholar] [CrossRef]
  46. Li, Y.W.; Wang, J.; Ju, T.Z.; Wang, L.N.; Zhang, S.N.; Zha, X.H. Heavy metal pollution characteristics and human health risk assessment in soils from different functional areas of Baiyin, Gansu, China. Chin. J. Ecol. 2017, 36, 1408–1418. [Google Scholar] [CrossRef]
  47. Ministry of Environmental Protection. Chinese Population Exposure Parameter Manual. Adult Volume; China Environmental Science Press: Beijing, China, 2013.
  48. US EPA. Risk Assessment Guidance for Superfund Volume Ⅰ Human Health Evaluation Manual (Part A); Office of Emergency and Remedial Response: Washington DC, USA, 1989.
  49. US EPA. Risk Assessment Guidance for Superfund Volume I: Human Health Evaluation Manual (Part E, Supplemental Guidance for Dermal Risk Assessment) Final; Office of Emergency and Remedial Response: Washington DC, USA, 2004.
  50. US EPA. Exposure Factors Handbook: 2011 Edition; Office of Health and Environmental Assessment: Washington, DC, USA, 2011; [EPA/600/R-09/052F].
  51. Duan, X.L. Exposure Factors Handbook of Chinese Population; China Environmental Science Press: Beijing, China, 2013. [Google Scholar]
  52. Yu, L.; Zhang, F.; Zang, K.; He, L.; Wan, F.; Liu, H.; Zhang, X.; Shi, Z. Potential Ecological Risk Assessment of Heavy Metals in Cultivated Land Based on Soil Geochemical Zoning: Yishui County, North China Case Study. Water 2021, 13, 3322. [Google Scholar] [CrossRef]
  53. Wilding, L.P. Spatial Variability: Its Documentation, Accommodation and Implication to Soil Surveys; PUDOC: Wageningen, The Netherlands, 1985; pp. 166–194. [Google Scholar]
  54. Ju, T.N.; Wu, X.; Shi, H.D.; Gao, F.J.; Li, X.Z.; Wang, Y.R.; Luan, T.; Fan, P. Heavy metal pollution and ecological risk assessment of arable land soil in Haigou small watershed. J. Environ. Eng. Technol. 2018, 8, 556–562. [Google Scholar] [CrossRef]
  55. Sun, G.J.; Li, W.H.; Zhu, C.G. Spatial variation analysis of topsoil bulk density in the Yili Valley, Xin jiang. Resour. Sci. 2016, 38, 1222–1228. [Google Scholar] [CrossRef]
  56. Barnett, V. Environmental Statistics: Methods and Applications; Wiley: Hoboken, NJ, USA, 2005. [Google Scholar]
  57. Li, Q.; Cao, Y.; He, L.S.; Wang, Y.F.; Gong, C.; He, S.H. Spatial distribution characteristics and source analysis of soil heavy metal at typical smelting industry sites. Environ. Sci. 2021, 42, 5930–5937. [Google Scholar] [CrossRef]
  58. Qu, M.K.; Li, W.D.; Zhang, C.R.; Wang, S.Q.; Yang, Y.; He, L.Y. Source apportionment of heavy metals in soils using multivariate statistics and geostatistics. Pedosphere 2013, 23, 437–444. [Google Scholar] [CrossRef]
  59. Ullah, R.; Khan, N.; Ali, K.; Khan, M.E.H.; Jones, D.A. Screening of Xanthium strumarium (IAPS) Growing on Abandoned Habitats in Khyber Pakhtunkhwa, Pakistan: Perspectives for Phytoremediation. Appl. Sci. 2021, 11, 11704. [Google Scholar] [CrossRef]
  60. Tian, H.Z.; Xue, Z.G.; Cheng, K.; Qu, Y.P.; Chai, F.H.; Hao, J.M. Trend and characteristics of atmospheric emissions of Hg, As and Se from coal combustion in China,1980–2007. Atmos. Chem. Phys. 2010, 10, 11905–11919. [Google Scholar] [CrossRef]
  61. Hsu, S.L.; Hung, J.; Wallace, A. Soil pH Variation Within a Soil. I. pH Variation in Soil Pores Observed in a Column-Leaching Method. Commun. Soil Sci. Plant Anal. 2004, 35, 319–329. [Google Scholar] [CrossRef]
  62. Müller, H.S.; Dechow, R.; Flessa, H. Inventory and assessment of pH in cropland and grassland soils in Germany. J. Plant Nutr. Soil Sci. 2022, 185, 145–158. [Google Scholar] [CrossRef]
  63. Chi, Q.H.; Ma, S.M. Comparison between chemical composition of bedrocks in the upper reaches and that of alluvial plain soils in the lower reaches of a drainage area. Geol. Bull. China 2008, 27, 188–195. [Google Scholar] [CrossRef]
  64. Nikos, N.; José Antonio, R.M. Multiscale analysis of heavy metal contents in soils: Spatial variability in the Duero River basin (Spain). Geoderma 2012, 189, 554–562. [Google Scholar] [CrossRef]
  65. Khan, N.; Khan, J.; Ullah, R.; Ali, K.; Jones, D.A.; Khan, M.E.H. Heavy Metals Contaminants in Watercress (Nasturtium officinale R.BR.): Toxicity and Risk Assessment for Humans along the Swat River Basin, Khyber Pakhtunkhwa, Pakistan. Sustainability 2022, 14, 4690. [Google Scholar] [CrossRef]
  66. Murgueytio, A.M.; Evans, R.G.; Sterling, D.A.; Clardy, S.A.; Shadel, B.N.; Clements, B.W. Relationship between lead miningand blood lead levels in children. Arch. Environ. Health 1998, 53, 414–423. [Google Scholar] [CrossRef] [PubMed]
  67. Yang, Q.Q.; Li, Z.Y.; Lu, X.N.; Lu, X.M.; Duan, Q.N.; Huang, L.; Bi, J. A review of soil heavy metal pollution from industrial and agricultural regions in China: Pollution and risk assessment. Sci. Total Environ. 2018, 642, 690–700. [Google Scholar] [CrossRef]
  68. Liu, H.; Zhang, Y.; Yang, J.; Wang, H.; Hu, W. Quantitative source apportionment, risk assessment and distribution of heavy metals in agricultural soils from southern Shandong Peninsula of China. Sci. Total Environ. 2021, 767, 144879. [Google Scholar] [CrossRef] [PubMed]
  69. Hua, C.; Zhuo, H.M.; Kang, A.L.; Fang, Z.T.; Zhu, M.Y.; Dong, M.X.; Wang, J.C.; Ren, L. Contamination, risk assessment and source apportionment of the heavy metals in the soils of apple orchard in Qixia City, Shandong Province, China. Stoch. Environ. Res. Risk Assess. 2022, 36, 2581–2595. [Google Scholar] [CrossRef]
  70. Yu, F.; Zhang, Y.W.; Yan, M.S.; Wang, R.; Zhang, F.L.; Zhong, K.Q.; Zhu, H.S.; Luo, K. Heavy metal pollution and human health risks assessment of soil and crops near the mercury ore in Chongqing. Environ. Chem. 2022, 41, 536–548. [Google Scholar] [CrossRef]
Figure 1. (a) Location and (b) geological map of the study area.
Agriculture 12 01565 g001
Figure 2. Relationships between soil heavy metal contents and pH. Note: The red line represents the risk screening value corresponding to different pH values.
Agriculture 12 01565 g002
Figure 3. Principal component analysis plot of eight heavy metals in the study area.
Agriculture 12 01565 g003
Figure 4. Correlation plot of eight heavy metals in the study area.
Agriculture 12 01565 g004
Figure 5. Spatial distributions of pH and eight heavy metals in soils of the study area.
Agriculture 12 01565 g005
Figure 6. A boxplot of geoaccumulation index (Igeo) distribution in the study area.
Agriculture 12 01565 g006
Figure 7. Spatial distribution of geoaccumulation index (Igeo) values. Note: + denotes the maximum of Igeo.
Agriculture 12 01565 g007
Figure 8. Accumulation rate of the ecological risk (Er) of heavy metals.
Agriculture 12 01565 g008
Figure 9. Spatial distributions of the potential ecological risk index (PERI). Note: + denotes the maximum PERI values.
Agriculture 12 01565 g009
Figure 10. Spatial distribution of HI, HQ, and total cancer risk (TCR) in the study area.
Agriculture 12 01565 g010
Table 1. Parameters for exposure models.
FactorsDescription UnitValues Source
AdultChild
CThe topsoil heavy metal contentmg kg−1 This study
IngRIngestion rate mg d−1100200[9,26]
InhRInhalation rate m3 d−17.515[9,26]
EFExposure frequencyd a−1350350[49,51]
EDExposure durationa246[9,26]
CFConversion factorkg mg−11 × 10−61 × 10−6[14,26]
SAExposed skin areacm257002800[9,26]
AFSkin adherence factormg cm−2 d−10.070.2[9,26]
ABSDermal absorption factorunitless0.010.01[14]
PEFParticle emission factorm3 kg−11.36 × 10−91.36 × 10−9[9,26]
BWAverage body weightkg62.516[26,49]
ATAverage timenon-carcinogensdED × 365[47,48]
carcinogens 70 × 365
Table 2. Reference doses (RfDs) for non-carcinogenic metals and slope factors (SFs) for carcinogenic metals (mg kg−1).
RfDSourceSFSource
IngestionDermalInhalationIngestionDermalInhalation
As3.00 × 10−41.23 × 10−43.00 × 10−4[26,50]1.501.504.30 × 10−3[46]
Cd1.00 × 10−41.00 × 10−51.00 × 10−4[14]6.106.101.80 × 10−3[46]
Cu4.00 × 10−21.20 × 10−24.02 × 10−2[14]
Cr3.00 × 10−36.00 × 10−52.86 × 10−5[26,50]42.00[46]
Hg3.00 × 10−42.10 × 10−53.00 × 10−4[14,26]
Ni2.00 × 10−25.40 × 10−32.06 × 10−2[26]8.40 × 10⁻¹[46]
Pb3.50 × 10−35.25 × 10−43.25 × 10−3[14]
Zn3.00 × 10−16.00 × 10−23.00 × 10−1[26]
Table 3. Heavy metal concentrations in surface soils (N = 1135) (mg kg−1).
pHAsCdCuCrHgNiPbZn
Minimum4.661.90.0268.411.40.0063.46.323.4
Maximum7.8266.61.836251.7611.10.79222.1327.2345.3
Mean6.238.010.11833.3389.260.03733.6325.3769.46
Median6.27.30.10326.873.10.02928.924.264.8
S.E.0.020.130.0030.651.80.0010.630.430.76
S.D.0.634.240.121.960.660.0421.1114.3625.75
CV (%)10.152.982.365.76898.562.856.637.1
Skewness0.114.29.113.153.5910.313.3212.142.71
Kurtosis−0.741.71129.315.9417.01180.0614.89212.218.04
Shandong topsoil (1)7.328.60.13222.6620.03127.123.663.3
China topsoil (2)11.20.09723610.065272674
World topsoil (3)60.3530700.06503590
SEQRCS (4)pH < 6.5300.3501500.57090200
6.5 < pH < 7.5250.31002000.6100120250
pH > 7.5200.61002501190170300
(1) Background values of soil geochemistry in Shandong Province, East China [52]. (2) China National Environmental Monitoring Centre (1990) and Wei F S (1991), N = 4095 [11]. (3) Median values of soil element content in different countries, F. Bowen (1979) [11]. (4) Soil environmental quality risk control standard for soil contamination of agricultural land, China. (GB15618-2018) (MEEC, 2018).
Table 4. Results obtained for evaluations using a heavy metal geoaccumulation index.
AsCdCuCrHgNiPbZnIolIml
Minimum−2.76−2.96−2.01−3.03−2.91−3.58−2.49−2.02−1.03−1.31
Maximum2.373.212.892.724.092.453.211.864.093.60
Mean−0.83−0.96−0.23−0.25−0.60−0.45−0.57−0.530.32−0.04
UnpollutedIgeo < 0103610517768809469581077993458714
Degree of pollution0 ≤ Igeo < 1927128517814812445136474314
1 ≤ Igeo < 2696569335110617198
2 ≤ Igeo < 313987220298
3 ≤ Igeo < 40100001021
4 ≤ Igeo < 50000100010
Igeo ≥ 50000000000
Proportion of polluted sites/%8.77.431.622.416.715.65.112.559.637.1
Table 5. Statistical table of the potential ecological risk index of soil heavy metals and the proportion of sites at which values exceeded standard values.
Er PERI
AsCdCuCrHgNiPbZn
Minimum 2.25.8 1.9 0.4 8.0 0.6 1.3 0.4 30.7
Maximum 77.4 417.3 55.7 19.7 1018.8 41.0 69.3 5.5 1099.1
Mean 9.3 26.8 7.4 2.9 47.2 6.2 5.4 1.1 106.2
S.D. 4.9 22.0 4.8 2.0 46.5 3.9 3.0 0.4 56.9
Exceeds the standard number of pointsEr < 401132101411341135648113411321135PERI < 1501029
40 ≤ Er < 80310810390130150 ≤ PERI < 30093
80 ≤ Er < 1600120072000300 ≤ PERI < 60012
160 ≤ Er < 320020022000PERI ≥ 6001
Er ≥ 32002003000
Contribution rate of Er/%Minimum1.1 3.4 1.0 0.2 6.9 0.7 0.6 0.1
Maximum31.7 83.2 32.1 15.5 92.7 29.5 41.0 3.8
Mean9.3 25.5 7.3 2.9 42.0 6.3 5.5 1.1
Median8.8 24.3 6.3 2.5 40.9 5.4 5.2 1.1
CV/%40.138.952.659.729.355.644.539.5
Table 6. HQ and HI assessments of health risks posed to adults and children by soil in the study area.
HQ-non-canc.AsCdCuCrHgNiPbZnHIProportion of HQ
AdultsMaximum1.34 × 10−11.41 × 10−21.14 × 10−26.78 × 10−46.61 × 10−32.04 × 10−21.89 × 10−12.21 × 10−32.07 × 10−1Agriculture 12 01565 i001
Minimum3.81 × 10−31.96 × 10−43.81 × 10−41.26 × 10−55.19 × 10−53.12 × 10−43.65 × 10−31.50 × 10−41.08 × 10−2
Mean + S.E.1.61 × 10−2
+7.489 × 10⁻⁶
9.06 × 10⁻⁴
+ 6.564 × 10⁻⁷
1.51 × 10⁻³
+ 8.106 × 10⁻⁷
9.90 × 10⁻⁵
+5.930 × 10⁻⁸
3.06 × 10⁻⁴
+ 2.661 × 10⁻⁷
3.09 × 10⁻³
+ 1.709 × 10⁻⁶
1.47 × 10⁻²
+ 7.322 × 10⁻⁶
4.44 × 10⁻⁴
+ 1.454 × 10⁻⁷
3.71 × 10⁻²
+ 1.181 × 10⁻⁵
S.D.8.50 × 10−37.45 × 10−49.92 × 10−46.73 × 10−53.02 × 10−41.94 × 10−38.31 × 10−31.65 × 10−41.34 × 10−2
Amount
(>1)
000000000
ChildrenMaximum2.842.52 × 10−28.60 × 10−23.14 × 10−34.61 × 10−21.53 × 10−11.171.64 × 10−23.01Agriculture 12 01565 i002
Minimum8.11 × 10−23.50 × 10−42.87 × 10−35.86 × 10−53.62 × 10−42.35 × 10−32.30 × 10−21.11 × 10−31.31 × 10−1
Mean + S.E.3.42 × 10−1
+1.595 × 10⁻⁴
1.62 × 10⁻³
+1.172 × 10⁻⁶
1.14 × 10⁻²
+ 6.590 × 10⁻⁶
4.59 × 10⁻⁴
+ 2.749 × 10⁻⁷
2.13 × 10⁻³
+ 1.850 × 10⁻⁶
2.32 × 10⁻²
+ 1.286 × 10⁻⁵
9.11 × 10⁻²
+ 4.511 × 10⁻⁵
3.30 × 10⁻³
+ 1.075 × 10⁻⁶
3.30 × 10⁻³
+ 3.736 × 10⁻⁴
S.D.1.81 × 10−11.33 × 10−37.48 × 10−33.12 × 10−42.10 × 10−31.46 × 10−25.12 × 10−21.22 × 10−31.99 × 10−1
Amount
(>1)
9000001017
Table 7. The carcinogenic health risk index (CR) of ingestion, dermal contact, and inhalation of soils for adults and children in the study area.
CR-canc.AsCdCRTCR
RfDingRfDdermalRfDinhRfDingRfDdermalRfDinhAsCdCr (RfDinh)Ni (RfDinh)
AdultsMaximum5.48 × 10−52.19 × 10−62.10 × 10−116.14 × 10−62.45 × 10−72.43 × 10−135.70 × 10−56.39 × 10−65.50 × 10−63.99 × 10−85.91 × 10⁻⁵
Minimum1.56 × 10−66.24 × 10−86.00 × 10−138.53 × 10−83.41 × 10−93.37 × 10−151.63 × 10−68.87 × 10−81.03 × 10−76.12 × 10−101.82 × 10⁻⁶
Mean + S.E.6.59 × 10−6
+ 3.075 × 10⁻⁹
2.63 × 10⁻⁷
+ 1.225 × 10⁻¹⁰
2.53 × 10⁻¹²
+ 1.181 × 10⁻¹⁵
3.95 × 10⁻⁷
+ 2.855 × 10⁻¹⁰
1.57 × 10⁻⁸
+ 1.137 × 10⁻¹¹
1.56 × 10⁻¹⁴
+ 1.128 × 10⁻¹⁷
6.86 × 10⁻⁶
+ 3.198 × 10⁻⁹
4.10 × 10⁻⁷
+ 2.969 × 10⁻¹⁰
8.03 × 10⁻⁷
+ 4.802 × 10⁻¹⁰
6.05 × 10⁻⁹
+ 3.348 × 10⁻¹²
8.08 × 10⁻⁶
+ 3.313 × 10⁻⁹
S.D.3.49 × 10−61.39 × 10−71.34 × 10−123.24 × 10−71.29 × 10−81.28 × 10−143.63 × 10−63.37 × 10−75.45 × 10−73.80 × 10−93.76 × 10⁻⁶
Amount
(>10−4)
00000000000
ChildrenMaximum1.03 × 10−42.87 × 10−69.41 × 10−126.14 × 10−62.45 × 10−72.43 × 10−131.06 × 10−41.23 × 10−56.16 × 10−67.46 × 10−81.08 × 10⁻⁴
Minimum2.93 × 10−68.20 × 10−82.68 × 10−138.53 × 10−83.41 × 10−93.37 × 10−153.01 × 10−61.71 × 10−71.15 × 10−71.14 × 10−93.30 × 10⁻⁶
Mean + S.E.1.24 × 10−5
+ 5.753 × 10⁻⁹
3.46 × 10⁻⁷
+ 1.612 × 10⁻¹⁰
1.13 × 10⁻¹²
+ 5.278 × 10⁻¹⁶
3.95 × 10⁻⁷
+ 2.855 × 10⁻¹⁰
1.57 × 10⁻⁸
+ 1.137 × 10⁻¹¹
1.56 × 10⁻¹⁴
+ 1.128 × 10⁻¹⁷
1.27 × 10⁻⁵
+ 5.912 × 10⁻⁹
7.92 × 10⁻⁷
+ 5.736 × 10⁻¹⁰
8.99 × 10⁻⁷
+ 5.383 × 10⁻¹⁰
1.13 × 10⁻⁸
+ 6.247 × 10⁻¹²
1.44 × 10⁻⁵
+ 6.088 × 10⁻⁹
S.D.6.53 × 10−61.83 × 10−75.99 × 10−133.24 × 10−71.29 × 10−81.28 × 10−146.71 × 10−66.51 × 10−76.11 × 10−77.09 × 10−96.91 × 10⁻⁶
Amount
(>10−4)
10000000001
Publisher’s Note: MDPI stays neutral with regard to jurisdictional claims in published maps and institutional affiliations.

