Article

Heat Stress, Varietal Difference, and Soil Amendment Influence on Maize Grain Mineral Concentrations †

by
Uchechukwu Paschal Chukwudi
1,2,*,
Sydney Mavengahama
1,
Funso Raphael Kutu
3 and
Lebogang Ezra Motsei
1
1
Food Security and Safety Niche Area, Faculty of Natural and Agricultural Sciences, North-West University, Mmabatho 2735, South Africa
2
Department of Crop Science, University of Nigeria, Nsukka 410001, Nigeria
3
School of Agricultural Sciences, University of Mpumalanga, Mbombela 1200, South Africa
*
Author to whom correspondence should be addressed.
This work is part of PhD thesis of Uchechukwu Paschal Chukwudi.
Agriculture 2022, 12(10), 1633; https://doi.org/10.3390/agriculture12101633
Submission received: 28 August 2022 / Revised: 25 September 2022 / Accepted: 27 September 2022 / Published: 7 October 2022
(This article belongs to the Section Crop Production)

Abstract

:
Improving the mineral concentrations of maize (Zea mays L.) will aid in the reduction of malnutrition in low-resource households that consume maize-based meals regularly. The study’s objective was to compare how different soil amendments and heat-stressed environments affect grain yield and mineral concentrations in maize. The study involved heat-stressed (HS) and non-heat-stressed (NHS) environments, three maize varieties (WE3128, WE5323, and ZM1523), and three soil amendments. The essential minerals analysis of the grain revealed a significant effect of variety, soil amendment, and heat stress on the grain yield and mineral contents. Among soil amendments, mineral fertilizer amendment (MF) gave the highest grain Zinc (Zn), 37.95 ± 15.3 µg/kg, while the highest grain iron (Fe) (136.9 ± 51.3 µg/kg) and yield were obtained with a combination of mineral fertilizer/poultry-manure amendment (MPM). The treatment interactions containing MPM in both the HS and NHS environments consistently produced positive results in the three maize varieties. When compared with the non-heat-stressed environment, the heat-stressed environment reduced grain weight (GWt) by 378% while increasing grain Fe and Zn concentrations by 43.6% and 15.8%, respectively. The HS was significantly higher than the NHS by 14.6%, 34.0%, 1.5%, 11.0%, 1.9%, and 89.2% for Ca, Cl, Mg, Na, P, and S, respectively. The highest macromineral concentrations were found in WE5323. All of the NHS treatments were grouped together, with the exception of NHS-4 and NHS-7, which produced the lowest means for the number of grain and GWt in the NHS, respectively. Although the variety was inconsistent in separating the treatment interactions, there was a good level of consistency in separating the treatment interactions along the heat stress factor and soil amendment factor. The correlation results revealed that a proportional relationship between Fe and Zn and grain yield tends to decrease the grain Fe or Zn concentrations. Therefore, selecting for high grain yield only may result in lower Fe and Zn concentrations in the grain. WE5323, amended with MPM, which produced the highest grain yield and stable mineral concentrations in non-heat-stressed and heat-stressed environments, should be considered in breeding programs aiming for high grain quantity and quality.

1. Introduction

The realization of a world without hunger is threatened by the increasingly negative impact of climate change on food production [1]. Climate change has progressed faster than expected, according to the United Nations [2], which warned that the world was experiencing the warmest decade in history. Temperatures in the last decade (2011–2020) have surpassed those of several previous centuries [3]. This rising temperature puts plants at risk of heat stress. Heat stress has been shown to reduce maize grain yield by reducing photosynthetic activities, root architecture, pollen sterility, and dry matter partitioning [4,5].
Besides the grain yield losses, heat stress also altered the protein and starch compositions of maize grain [6]. Studies in wheat showed that heat stress affected the baking qualities as well as the essential mineral concentrations [7,8]. Mineral deficiencies (especially Zn and Fe) were reported for low-resource households that are accustomed to monotonous cereal-based meals [9,10]. Though mineral deficiency is a global issue, it is more severe in developing regions such as Latin America, sub-Saharan Africa, and South Asia [9]. Maize is the most important staple food and the highest single source of calories in sub-Saharan Africa [11]. The low concentrations of essential minerals found in maize grain, on the other hand, put low-resource households that consume it on a regular basis at risk of mineral deficiencies.
Breeding strategies that prioritized yield quantity over quality have contributed to maize grain’s low mineral concentrations. Grain mineral concentrations in high grain-yielding maize varieties are said to be low [12]. Mineral concentrations in maize grain are influenced by genotypes, growth conditions, and genotype by growth conditions [10,13,14]. Grain mineral biofortification can be accomplished through genetic or agronomic enhancements or a combination of the two [12,15]. While genetic enhancement is desirable, the cost implications and skill requirements are high when compared with agronomic enhancement, which can be easily implemented by low-resource households. Optimal nutrient supply is one of the practices that agronomic enhancement entails. Optimized N fertilizer application improved the Zn and Fe concentrations in maize grain by 2.1% and 31.6%, respectively [16].
Grain mineral concentration in maize has been shown in studies [12,17] to be influenced by soil amendments under ambient conditions. However, the effect of soil amendment on grain mineral concentration in maize under heat stress needs to be investigated further. As the global temperature continues to rise, it is imperative to maintain or increase the essential mineral concentrations in stress-tolerant maize varieties in order to reduce hunger and malnutrition among low-resource households who eat maize-based meals on a regular basis. This study tested the hypothesis that stress-tolerant maize varieties grown with different soil amendments would respond differently when exposed to a heat-stressed environment. Understanding grain mineral accumulation is essential for the development of nutrient-dense maize varieties [12]. The objective of this study was to compare the grain yield and mineral concentrations of three maize varieties grown in heat-stressed and non-heat-stressed environments with various soil amendments.

2. Materials and Methods

2.1. Description of the Study Site

Repeated greenhouse and net house experiments were performed in the 2018/2019 and 2019/2020 summer planting seasons at the North-West University Experimental Farm (−25.7902166, 25.6187922 3.5 mi), North West Province, South Africa. The climate in the region is semiarid, with annual rainfall ranging from 300 to 600 mm and average daily minimum and maximum temperatures of 0.9 °C and 32 °C, respectively. The soil for the pot experiments was excavated at a depth of 0–20 cm from an uncultivated field on the experimental farm. The textural class was loamy sand, which was composed of 82% sand, 4% silt, and 14% clay. It had a pH (KCl) of 4.98, 11 mg P kg−1 (Bray1), 290 mg K kg−1, and Ca, Mg, and Na contents of 390 mg kg−1, 163 mg kg−1, and 5 mg kg−1, respectively, and 376 mg kg−1 total N and organic carbon content of 0.37%.

2.2. Treatments, Experimental Design, and Cultural Practices

This research used a factorial experiment with four replications laid out in a completely randomized design. Eighteen (2 × 3 × 3) treatment interactions were generated by combining three factors, namely, heat stress, maize variety, and soil amendment. Factor A, the heat stress (HS) effect, was achieved using two temperature-differentiated growth structures. The HS and non-heat-stressed (NHS) treatments were placed in a greenhouse and a net house, respectively. The two structures’ internal temperatures fluctuated along with the outside temperatures. For the duration of the experiment (December 2018 to June 2019 and October 2019 to February 2020), daily morning and midday temperatures in both growth structures were recorded. For the first and second season plantings (Figure S1), the weekly average temperature ranges in the HS environment were 16–41 °C and 20–44 °C, respectively, while the NHS environments had ranges of 15–34 °C and 16–33 °C. Temperatures above 35 °C have a detrimental heat stress effect on maize [18,19,20].
Factor B was maize variety. Maize seeds with a medium maturing period (117–120 days) were obtained from the Agricultural Research Council’s Grain-Crops Potchefstroom station, South Africa. The varieties included three-way Water Efficient Maize for Africa (WEMA) hybrids; WE3128, WE5323, and an open-pollinated variety, ZM1523. Factor C comprised three soil amendments, namely: sole poultry manure (PM), mineral fertilizers (MF), and complementary (50:50) poultry manure and mineral fertilizer applications (MPM). The NPK (13:7:10 (30) + 0.5% Zn + 5% S + 3% Ca) and lime ammonium nitrate (28% N) were used as mineral fertilizers, while the poultry manure (4.12% N, 1.45% P, 1.78% K, 8.18% Ca, 1.04% Mg, and 0.41% Na) was sourced from mature layer chickens. Each soil amendment was measured to supply 180 kg of N ha−1.
Each soil amendment was mixed separately with a sieved homogenized soil sample weighing 12 kg and placed in a perforated planting pot (30 cm top × 28 cm height × 21 cm base). Before sowing the maize seeds, the pots were irrigated to about 80% field capacity and allowed to stand for two weeks to allow the poultry manure to mineralize. Three maize seeds were sown per pot, but after two weeks, the seedlings were thinned to one per pot. Mineral fertilizer rates of 180 and 90 kg N ha−1 were applied in split dosage for MF and MPM, with 50% applied first at planting with NPK fertilizer and the remaining 50% supplied seven weeks after planting (WAP) with lime ammonium nitrate. The pots were well irrigated to avoid water stress.

2.3. Sample Preparation and Quantification of Minerals Concentrations through Inductively Coupled Plasma Mass Spectrometry (ICP–MS)

The cobs were harvested at 20 WAP when the plants had reached physiological maturity. The cobs were shade-dried until they had a moisture content of 12%. The cobs were then hand-shelled with a contaminant-free hand glove and placed in zipped plastic bags according to treatment. The grains were counted (NoG) using the Numigral seed counter, and the grain weight (GWt) was recorded in grams.
The procedure described by Hansen et al. [21] was used in sample preparation for analysis. After milling, 0.5 g of each sample was digested with concentrated nitric acid (Merck, Germany) in a microwave system (ETHOS UP, Magna Analytical). Three replicates of each mineral analysis were performed.
Inductively coupled plasma mass spectrometry (PerkinElmer, NexION 300 ICP–MS) was used to determine the concentrations of Ca, Cl, Mg, Na, P, S, Co, Cu, Fe, Mn, Mo, Zn, B, and Ni in the digested solutions. The concentrations of all minerals were computed in micrograms per kilogram (µg/kg).

2.4. Data Analysis

GenStat Software (VSN Int. Ltd., Hemel Hempstead, UK) was used to perform an analysis of variance (ANOVA) test on the collected data according to the procedure for factorial in a completely randomized design. Protected Fisher’s least significant difference was used as a post hoc test for mean separation at p ≤ 0.05. A Pearson correlation coefficient was performed on the yield attributes and mineral concentrations using SPSS Statistics, version 16.0 (SPSS Inc., Chicago, IL, USA). Microsoft Excel spreadsheet was used to generate the heat map for the correlation results. The correlation analyses were performed separately for each maize variety (n = 24), soil amendment (n = 24), growth environment (n = 36), and a combination of the three factors (n = 72). Note that the significance level for the correlation coefficient was depicted as * at the 0.05 level (2-tailed) and ** at the 0.01 level (2-tailed). The GGEBiplot software was used to plot the which-won-where, discriminatory vs. representativeness abilities, and mean vs. stability biplots.

3. Results

3.1. Analysis of Variance (ANOVA)

The significance levels for macro- and trace mineral concentrations are shown in Table 1. The Cu concentration in the grain was unaffected by the growth environment. Similarly, the main effects of growth environment, maize variety, and soil amendment had no significant effect on B concentration. There was no statistical difference in NoG and GWt due to maize variety. The remaining mineral concentrations and yield traits, on the other hand, were significantly influenced by the investigated factors and their interactions.

3.2. Heat Stress, Soil Amendment, and Varietal Effects on Maize Grain’s Macro- and Trace Minerals

The main effect of the growth environment revealed that the macromineral contents of the HS were significantly higher than those of the NHS by 14.6%, 34.0%, 1.5%, 11.0%, 1.9%, and 89.2% for Ca, Cl, Mg, Na, P, and S, respectively (Table 2). A comparison of trace mineral concentrations revealed that the HS had 43.6% higher Fe (136.75 ± 70.2 µg/kg) and 15.8% higher Zn (38.80 ± 13.3 µg/kg) concentrations than the NHS, while the NHS had higher Co, Mn, Mo, and Ni concentrations than the HS. The NoG and GWt were significantly reduced in the HS by 344.7% and 378%, respectively, compared with the NHS.
Except for low S concentration, WE5323 produced the highest macromineral concentrations that were significantly higher than WE3128 by 29.4%, 28.6%, 5.9%, and 6.7% for Ca, Cl, Mg, and P, respectively (Table 2). The highest concentrations of Co, Cu, Fe, and Mn were found in variety ZM1523, which was significantly higher than WE3128 by 33.3, 63.3, 68.4, and 8.6%, respectively. However, WE3128 produced the highest Zn concentration, which was significantly higher than WE5323 and ZM1523. WE5323 contained the highest concentrations of Mo and Ni, as well as the largest amounts of NoG and GWt. Its NoG and GWt did not differ significantly from WE3128 and ZM1523.
The macromineral concentrations in the soil amendments revealed that the MF amendment produced significantly higher Ca, Na, and S concentrations than the MPM and PM amendments. The Ca and S concentrations in MF were 8.8 and 118.9% higher than the concentrations in MPM. However, the MPM amendment had the highest Cl, Mg, and P concentrations that were significantly higher than the MF and PM amendments. The Cl, Mg, and P concentrations in MPM were 13.6, 19.6, and 22.7% higher than the concentrations in PM. In the trace mineral concentrations, the MF amendment gave the highest amounts of Cu, Mo, and Ni that were statistically different from MPM and PM. The MF was higher than the PM in Cu, Mo, Zn, and Ni by 98.4, 291.5, 15.3, and 128.9%, respectively. The concentrations of Co, Fe, and Mn in the MPM were significantly higher than those of MF and PM. The MPM produced the highest NoG and GWt, which was followed by the PM amendment. The MPM was significantly higher than the MF by 57.1 and 100.6% in NoG and GWt, respectively.

3.3. The Interactive Effect of Heat Stress, Variety, and Soil Amendment on Maize Grain’s Mineral Concentrations

The range for NoG in the HS environment was 20.6 to 125, while in the NHS environment, it ranged from 173.7 to 465 (Table S1). The GWt ranged from 6.14 to 37.78 g plant−1 in the HS environment and from 37.38 to 125.72 g plant−1 in the NHS environment.
The concentration ranges for Ca, Cl, Mg, Na, P, and S in the HS environment were 133.4–279.6 µg/kg, 6364–12,215 µg/kg, 322.5–644.4 µg/kg, 5.8–18.27 µg/kg, 261.1–511.4 µg/kg, and 6.54–23.74 µg/kg, respectively. The Ca, Cl, Mg, Na, P, and S concentrations were found to have ranges of 112.8–267.9 µg/kg, 3776–9543 µg/kg, 413.8–671.8 µg/kg, 5.66–15.07 µg/kg, 295.1–480.6 µg/kg, and 0.37–14.43 µg/kg, respectively, in the NHS environment.
The range of trace minerals was 0.04–0.18 µg/kg for Co, 3.18–17.54 µg/kg for Cu, 49.2–270.5 µg/kg for Fe, 13.17–30.04 µg/kg for Mn, 0.88–84.39 µg/kg for Mo, 20.24–67.96 µg/kg for Zn, 1.03–2.71 µg/kg for B, and 0.74–561 µg/kg for Ni in the HS environment (Table S2). For Co, Cu, Fe, Mn, Mo, Zn, B, and Ni, the range obtained in the NHS environment was 0.12–0.51 µg/kg, 5.28–20.66 µg/kg, 59.2–168.7 µg/kg, 18.84–36.18 µg/kg, 1.19–67.8 µg/kg, 26.11–39.89 µg/kg, 0.98–3.24 µg/kg, and 1.68–8.59 µg/kg, respectively.
There are six sectors in the which-won-where biplot (Figure 1). The NHS-8, HS-1, HS-9, HS-6, and NHS-3 treatments occupied the vertices in their respective sectors, while one sector was empty. Most of the non-heat-stress treatments (NHS-6, NHS-2, NHS-5, and NHS-9) were housed in the NHS-8 sector. This sector contained the GWt, NoG, Co, Mn, and B. On the other hand, the HS-9 sector had only S, while the remaining macro- and trace minerals were found in the HS-1 sector.
The NoG and GWt had the most discriminatory ability among the studied attributes because of their longest vectors from the biplot origin (Figure 2). The minerals with high discriminatory abilities are P, Cu, Mg, Mn, and Na because they have long vectors located within the outmost concentric circle. The representativeness of an attribute is measured by its angle size from the biplot origin. The smaller the angle, the more representative the attribute is, and vice versa; the larger the angle size, the less representative the attribute. From the biplot, Mg, Zn, and P are the most representative attributes because of their small angle sizes from the biplot origin, while S, NoG, and GWt are the least representative because of their large angle sizes from the biplot origin.
In Figure 3, the single red line represents the average tester axis (ATA), while the double arrow blue line is the ATA ordinate representing the population mean. The ATA and ATA ordinate divide the biplot into sections. The treatment interactions are ranked along the ATA while the ATA ordinate separates the good performers from the poor performers. The treatment interactions within the section with the small circle (the average tester) are good performers. The ranking of the treatment interactions based on their mean performance across attributes showed that HS-1 ranked first in the low section of the above-population-mean area of the biplot. It was followed by NHS-4, HS-4, HS-2, HS-5, and HS-8. In the top section of the above-population-mean area of the biplot, the ranking order was NHS-8, NHS-9, NHS-5, NHS-6, and NHS-2. The remaining treatment interactions are placed within the below-population-mean section of the biplot, indicating their low performance in the studied attributes.

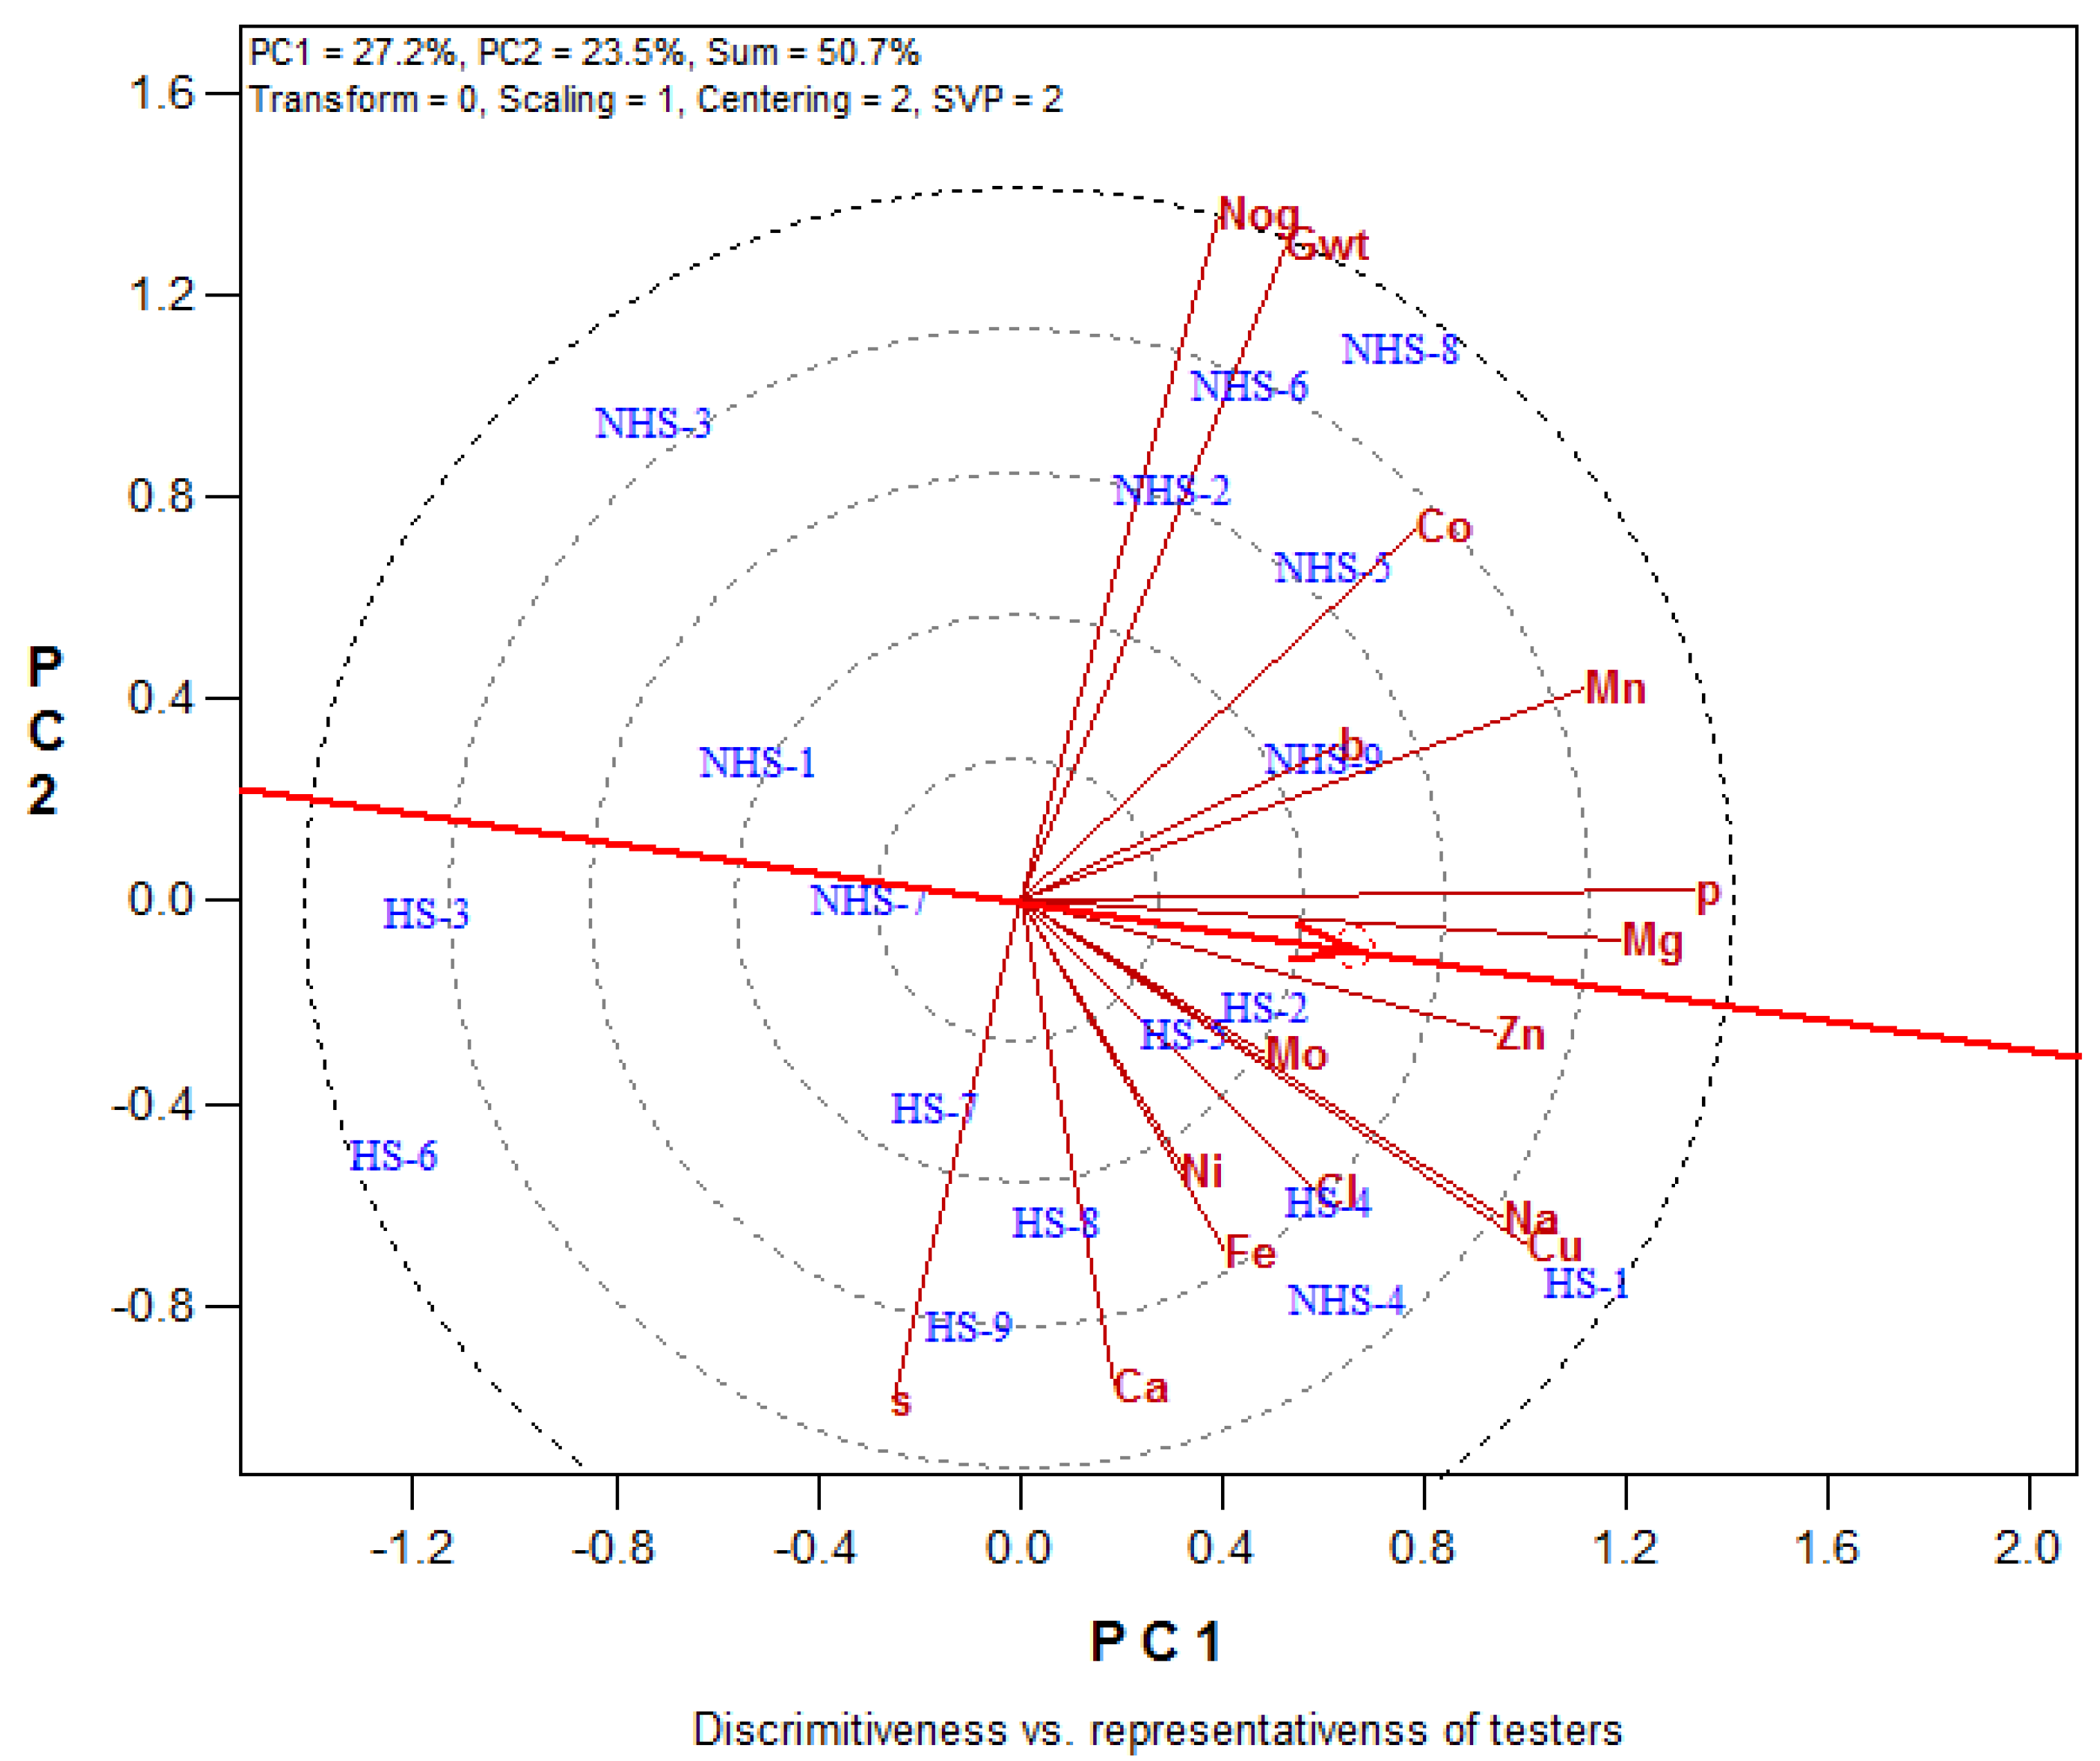
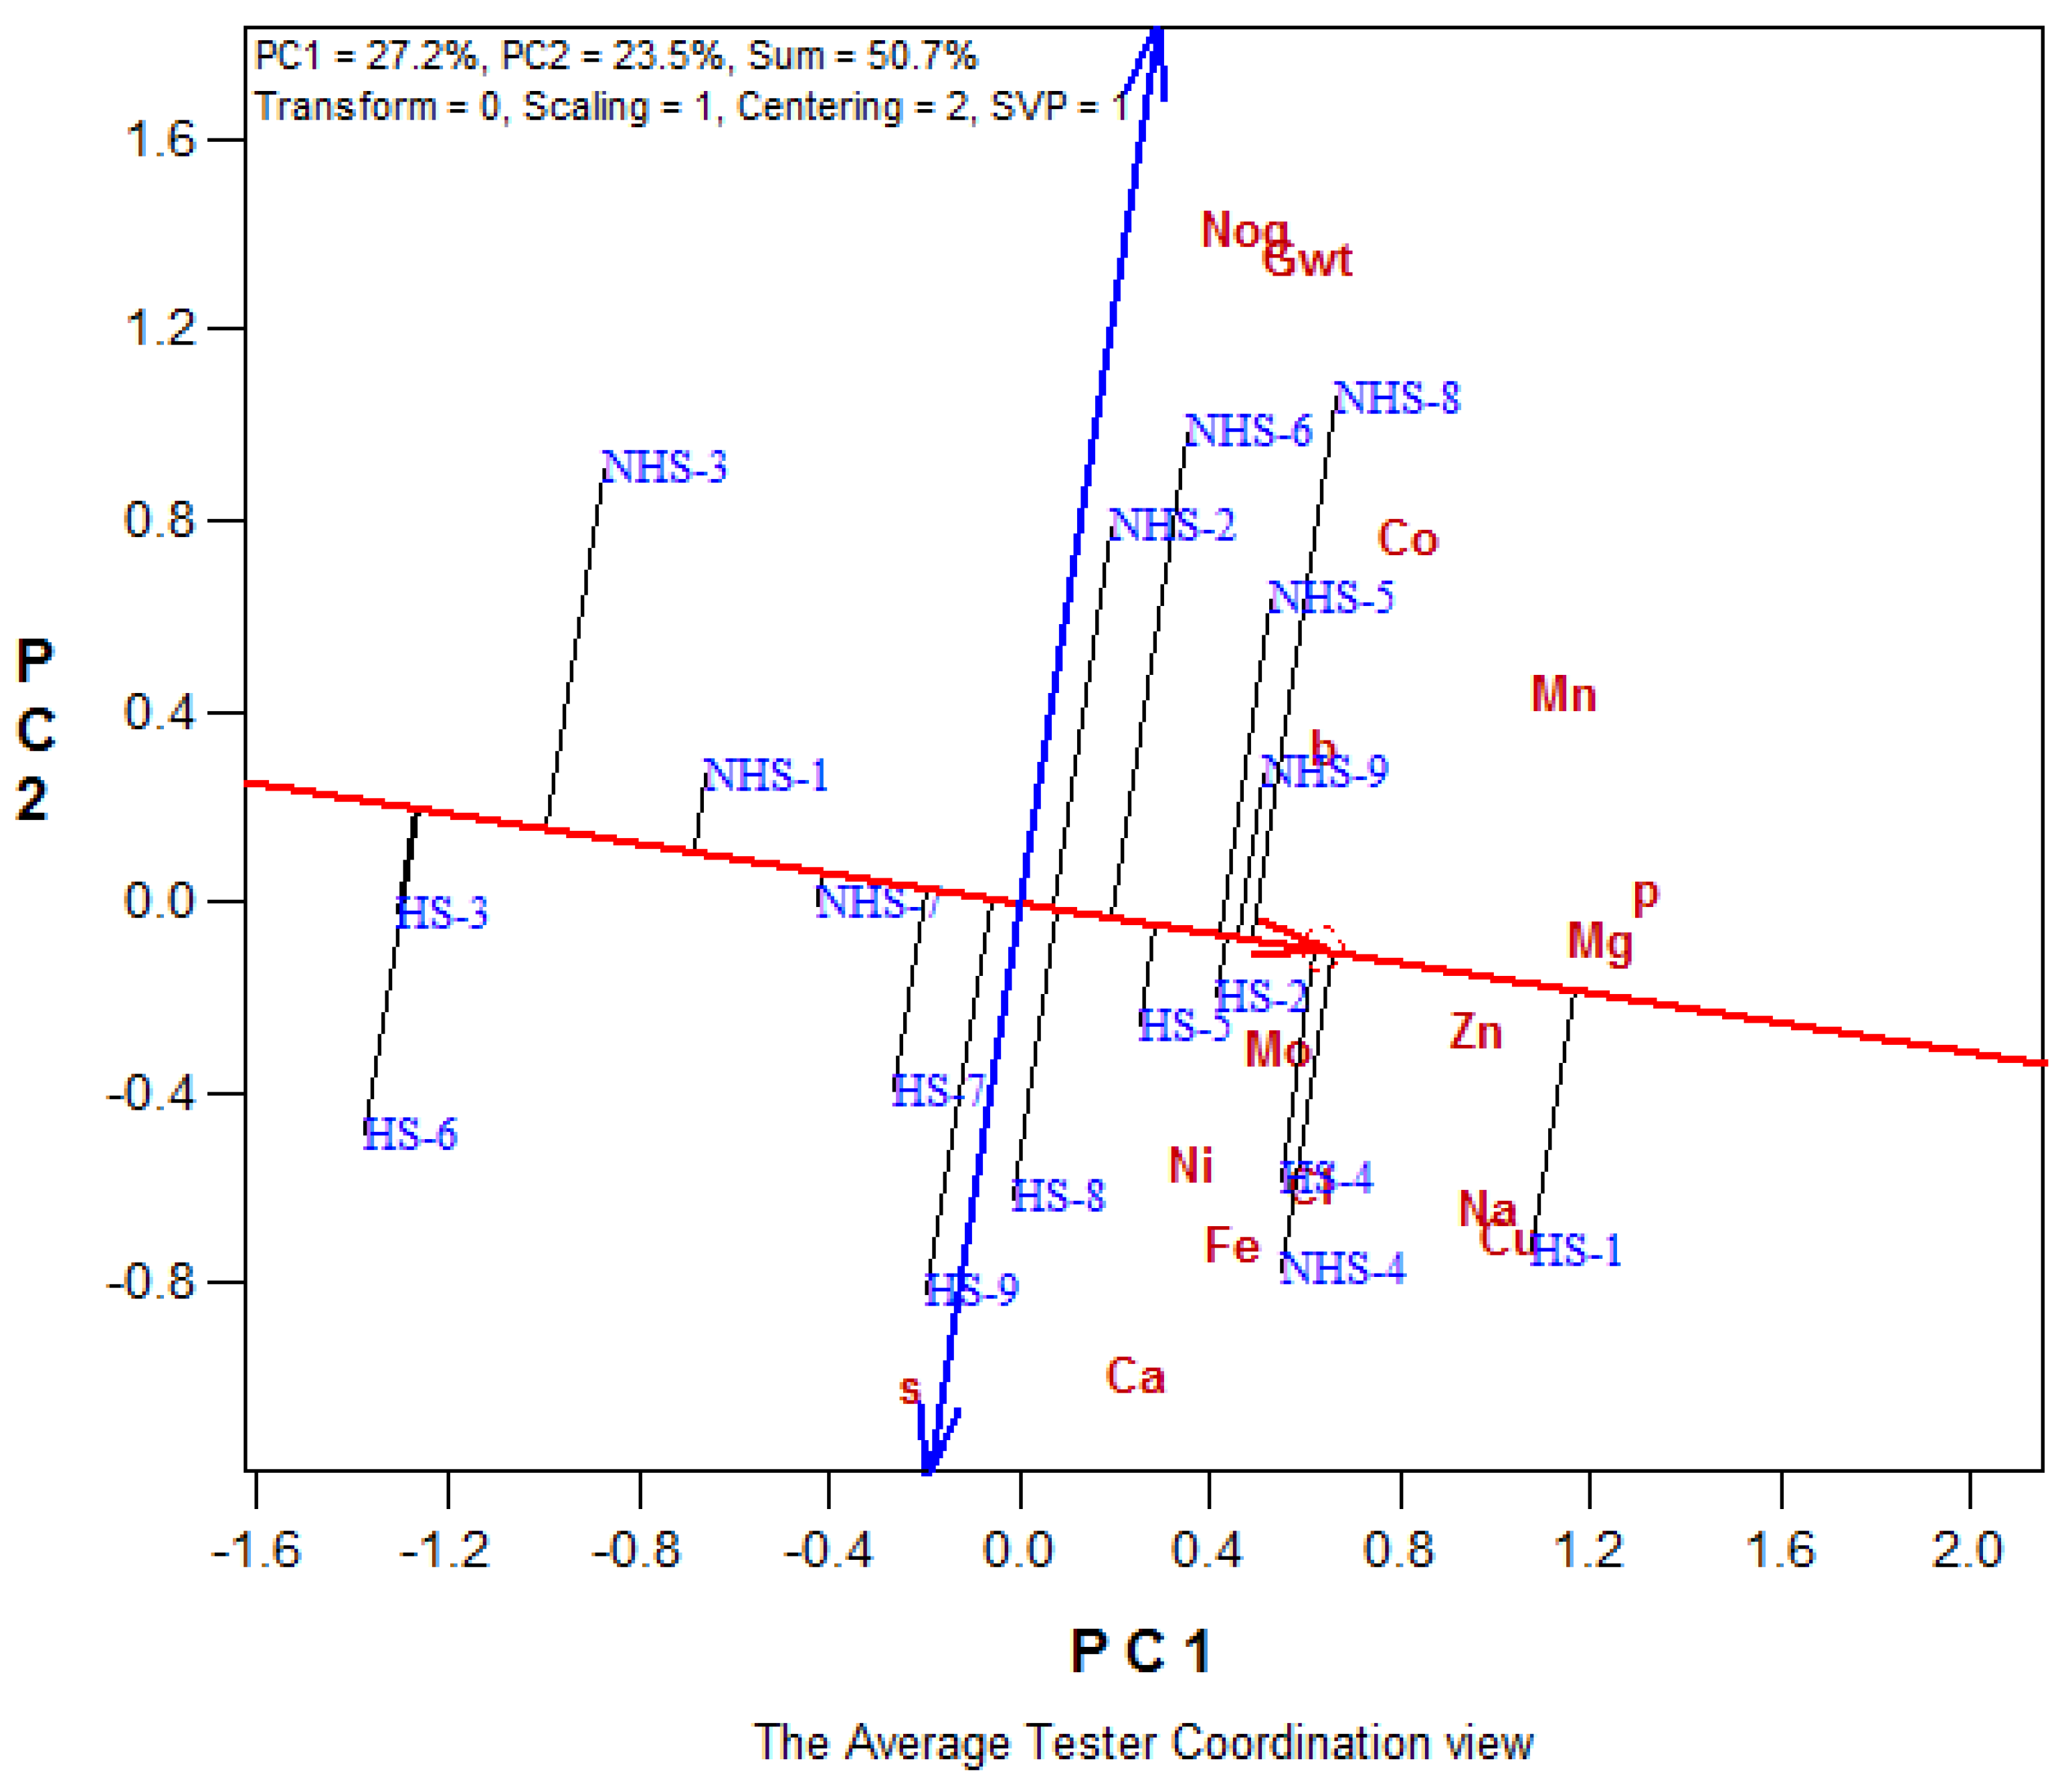
3.4. Correlation Coefficient Analysis

3.4.1. Maize Variety

With the exception of Co (0.449), Fe (0.415), Mn (0.129), and Ni (0.126), the NoG for variety WE3128 was negatively related to all the other minerals. Only Ca (−0.509 *) and Zn (−0.553 *) had a significant relationship with NoG for WE3128 (Figure 4). There was a significant positive relationship (0.706 **) between Co and NoG for variety WE5323, but a significant negative relationship between NoG and Cl (−0.563 *), S (−0.751 **), Cu (−0.663 **), and Fe (−0.854 **). The NoG from variety ZM1523 had a significant positive relationship with Co (0.617 **), Mn (0.855 **), and Zn (0.577 *), but a significant negative relationship with Ca (−0.578 *), Fe (−0.751 **) and Ni (−0.612 **).
For variety WE3128, the GWt had a negative significant relationship with Ca (−0.488 *) and Zn (−0.471 *) and a positive significant relationship with Co (0.615 **) and Fe (0.595 **). The GWt of variety WE5323 had a significant positive relationship with Co (0.597 *) but a significant negative relationship with Cl (−0.569 *), Na (−0.594 *), S (−0.730 **), Cu (−0.754 **), Fe (−0.845 **), Zn (−0.632 *), and Ni (−0.518 *). Variety ZM1523’s GWt had a negative significant relationship with Ca (−0.506 *), Fe (−0.632 **), and Ni (−0.783 **), but a positive significant relationship with P (0.590 *), Co (0.636 **), Mn (0.908 **), and Zn (0.745 **).

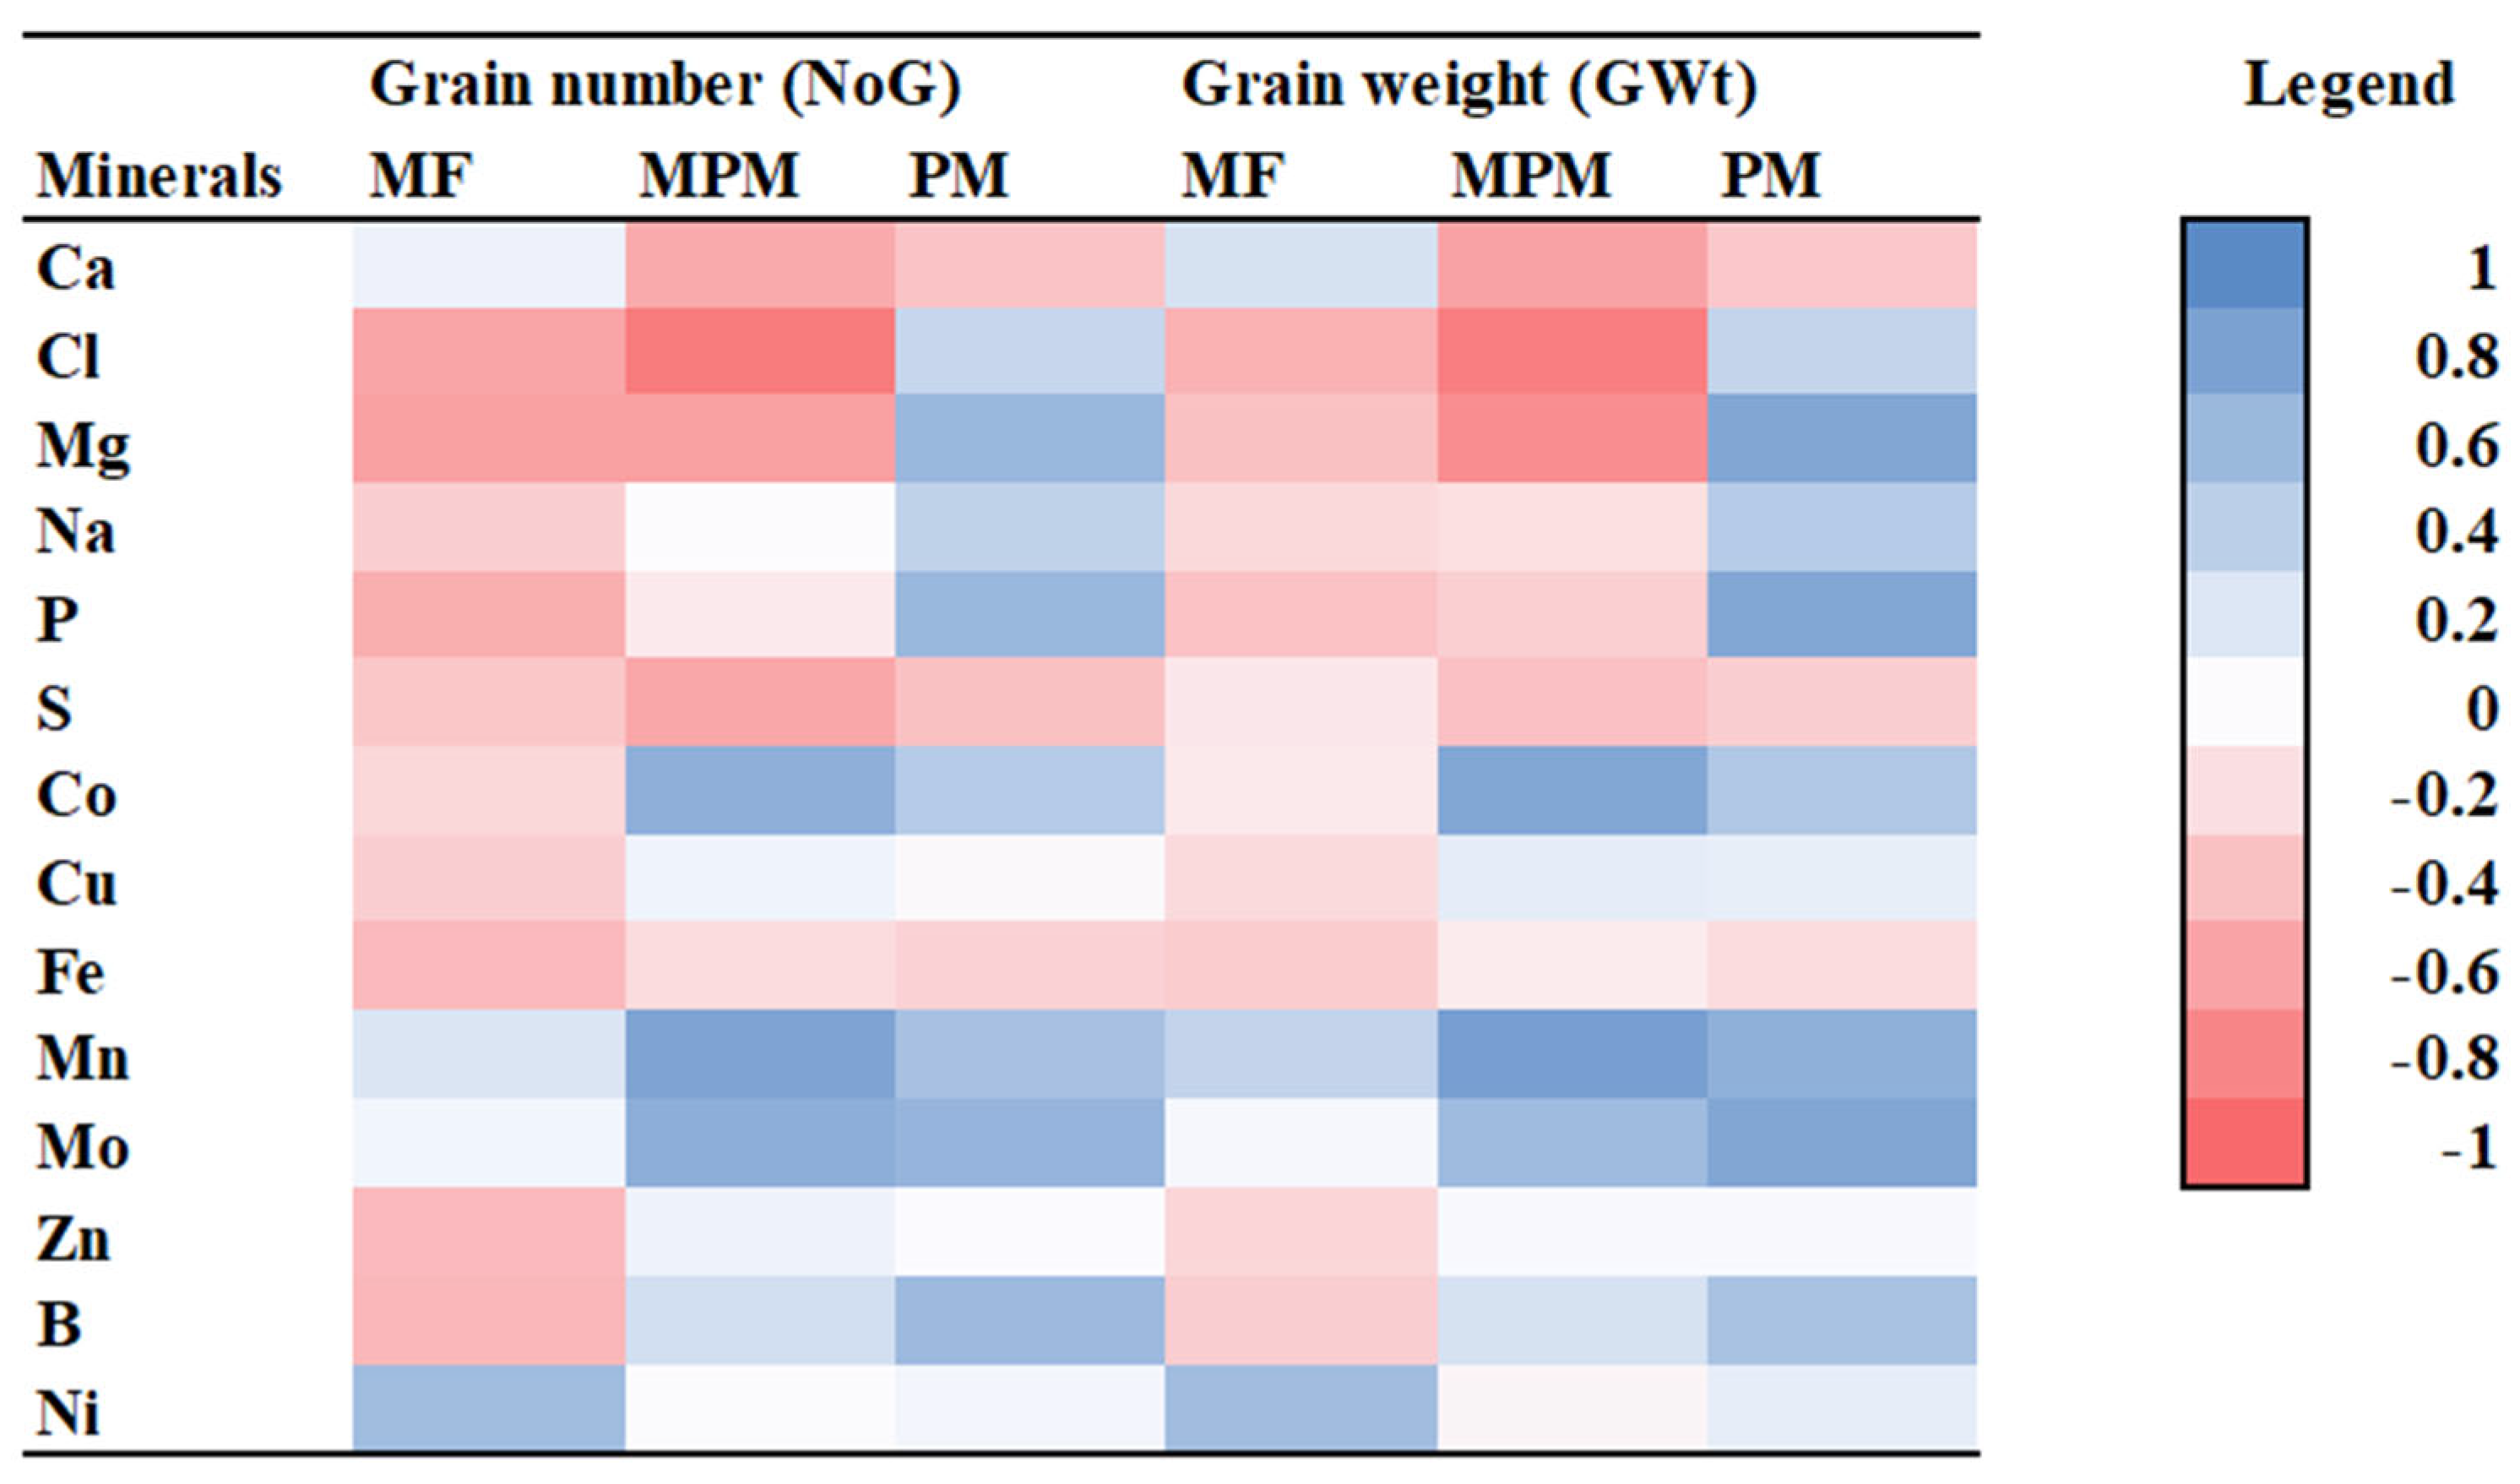
3.4.2. Soil Amendment

All the minerals under the MF amendment had a negative relationship with the NoG, with the exception of Mn (0.032) and Ni (0.472*), which had positive relationships (Figure 5). These negative relationships were only significant for Cl (−0.679 **), Mg (−0.705 **), P (−0.634 **), S (−0.502 *), Fe (−0.573 *), Zn (−0.567 *), and B (−0.583 *). The NoG had a significant negative relationship with Ca (−0.655 **), Cl (−0.902**), Mg (−0.709 **), and S (−0.671 **) under the MPM amendment but a significant positive relationship with Co (0.603 **), Mn (0.721 **), and Mo (0.616 **). The mineral concentrations under the PM amendment revealed that the NoG had a significant positive relationship with Mg (0.519 *), P (0.521 *), and Mo (0.545 *) but a significant negative relationship with Ca (−0.524 *) and S (−0.535 *).
The GWt had a negative significant relationship with Cl (−0.615**), Mg (−0.535 *), P (−0.526 *), Fe (−0.477 *), and B (−0.470 *) in the MF amendment. Under the MPM amendment, GWt had a significant negative correlation with Ca (−0.694 **), Cl (−0.884 **), Mg (−0.804 **), and S (−0.537 *), while it had a significant positive correlation with Co (0.696 **), Mn (0.776 **), and Mo (0.479 *). Under the PM amendment, the GWt had a significant positive relationship with Mg (0.702 **), P (0.696 **), Mn (0.602 *), and Mo (0.700 **).

3.4.3. Heat Stress

In the NHS environment, NoG had a positive and significant relationship with P (0.485 *), Co (0.414*), and B (0.517 **) but a negative relationship with S (−0.472 *) and Ni (Figure 6). There was no significant relationship between NoG and mineral concentrations in the HS environment. NoG had a positive and significant relationship with Co (0.450 **) and Mn (0.399 **) but a negative and significant relationship with Ca (−0.383 **), S (−0.519 **), Cu (−0.286 *), and Fe (−0.352 *) under the combined correlation analysis.
The GWt had a positive and significant relationship with Cl (0.469 *), Mg (0.454 *), P (0.641 **), Co (0.528 **), Zn (0.500**), and B (0.469 *) concentrations but a negative and significant relationship with Na (−0.388 *), Mo (−0.447 *), and Ni (−0.629 **) in the NHS environment. Except for Ca and Fe concentrations, all the minerals showed a positive relationship with GWt in the HS environment. In the combined analysis, GWt had a significant and positive relationship with Co (0.536 **) and Mn (0.496 **) but a significant and negative relationship with Ca (−0.365 **) and S (−0.471 **).

4. Discussion

4.1. Influence of Heat Stress on the Maize Grain Mineral Concentrations

Heat stress reduces maize grain yield [4,22] by reducing photosynthetic activity, root architecture, pollen sterility, and dry matter partitioning, among other things [5]. Grain quality and nutritional composition were found to be altered in cereal grains that had been exposed to heat stress [6,7,23]. In this study, the HS environment yielded lower NoG and GWt, as well as higher grain mineral concentrations, when compared with the NHS environment. These findings matched those of previous studies [7,8,24,25], which found higher mineral concentrations in cereal grains exposed to high temperatures.
Despite the fact that there was no significant correlation between the minerals and the NoG in the HS environment (Figure 6), the majority of the minerals decreased as the NoG increased. Guo et al. [12] reported a negative correlation between grain number and maize grain mineral concentrations. Increased concentrations of grain Fe and Zn have been reported in wheat [7,24,25] and maize [13] exposed to abiotic stress.
The observed differences in the patterns of relationships between minerals and grain yield in the HS and NHS environments could be attributed to differences in the assimilation and partitioning of grain minerals in the two contrasting environments. Genetic and environmental interactions, according to Mallikarjuna et al. [10], may influence the relationship between maize grain yield and mineral concentrations. A similar viewpoint, that the environment influences mineral concentrations in maize grain, was reported [12,14]. Higher mineral concentrations in the HS environment may have been influenced by its lower NoG and GWt. Enakiev et al. [26] found that grain mineral concentrations increased as grain mass decreased in maize, a phenomenon they attributed to the “concentration effect”.
The concentration effect is caused by reduced carbohydrate production/partitioning in the grain, combined with increased mineral assimilation from the soil solution and subsequent storage in the grain to compensate for the lower carbohydrate content. It was referred to as the reversed dilution effect by Gu et al. [13]. The dilution effect occurs when the mineral concentration in maize grain decreases as a result of more nonstructural carbohydrates being produced [8]. In a stress-free environment, more photosynthetic activities promote carbohydrate storage in grains. Environmental factors, nutrient availability, assimilation, and partitioning, as well as plant genotype, can all influence the dilution effect [7,8,12,26].

4.2. Varietal Effect on the Maize Grain Mineral Concentrations

Exploring the genetic diversity of maize grain minerals and grain yield is a critical step toward developing mineral-enriched genotypes. According to Oikeh et al. [27], stability in grain mineral concentrations across diverse environments is just as important as increasing mineral concentration. This stability is required because the mineral content of maize is affected by the growing environment and genotype [10,12,13].
The mineral concentrations in maize grain were found to be significantly influenced by the variety in this study. The positive correlation between Zn and Fe concentrations in varieties WE5323 and WE3128 (Table S1) was consistent with previous studies [10,28]. Similar to Prasanna et al. [29], a negative relationship between Zn and Fe concentrations was observed in ZM1523 and the combined correlation for the three varieties (Table S2). These differences revealed varietal influences on maize grain mineral concentrations. Jin et al. [30] discovered four QTLs on chromosomes 2, 5, and 10 for Zn content, whereas for Fe content, only one QTL on chromosome 5 was identified. The phenomenon of nutrient element QTL co-localization may be due to the tight linkage of distinct genes or pleiotropism and the physiological association of micronutrient accumulation [30].
Increased grain yield with lower mineral concentrations has been observed in cereal grains [8,26]. Mineral elements are more concentrated in the embryo and outer layers of grains (pericarp and aleurone layer) than in the endosperm. Zn and Fe concentrations in the endosperm were at least 20 times lower than in other parts of the embryo [31]. Therefore, the increase in yield brought on by the endosperm’s expansion may result in less mineral content in the grain. Since there was no statistically significant difference in grain yield between the three varieties, the observed significant differences in mineral concentrations may not be explained by the dilution/concentration effect. Rather, the genetic diversity of the varieties was responsible for the differences. WE5323, the variety with the highest NoG and GWt, yielded the highest concentrations of most macrominerals: Ca, Cl, Mg, Na, and P. This was the ranking order of these macrominerals in terms of variety: WE5323 > ZM1523 > WE3128. However, no consistent pattern was observed in the trace minerals, with ZM1523 having the highest concentrations of Co, Cu, Fe, and Mn. Wang et al. [32] identified high-yielding wheat varieties with high mineral concentrations and advocated genetic improvement of grain yield and nutritional quality at the same time. In the fight against malnutrition, Guo et al. [12] recommended high-yielding maize varieties with high mineral concentrations.
The environment and genotype influenced the basic quantitative trait loci of grain weight and nutrient concentrations [13]. Mallikarjuna et al. [10] evaluated fifty maize genotypes for grain yield and mineral concentrations across different agro-climatic zones in India and found that edaphic and environmental factors have a greater influence on grain yield stability than on grain mineral stability. Guo et al. [12] examined twenty-four maize cultivars that were released in China between 1930 and 2010 and found that cultivar development influenced mineral accumulation in maize grain.
WE3128 had the highest concentration of Zn in this study, followed by WE5323 (Table 2). The Zn concentration and GWt were inversely related in these two varieties (Figure 4). In the variety ZM1523, however, a proportional relationship was observed. Similarly, when variety ZM1523 produced the highest Fe concentration, followed by WE5323, an inverse relationship between Fe concentration and GWt was discovered, whereas WE3128 produced the lowest Fe concentration, which was proportionally related to GWt. Fe and Zn concentrations decreased among the three drought-tolerant maize varieties when there was a proportional relationship between Fe/Zn and GWt/NoG. Therefore, selecting only for high grain yield may result in grains with lower mineral content.
This observation was consistent with previous studies [12,16] that found lower Fe and Zn concentrations in high-yielding maize varieties. Fe and Zn deficiencies in high-yielding maize varieties may have been caused by the prioritization of grain yield over nutritional quality [10,12,13,16].

4.3. The Effect of Soil Amendments on Grain Mineral Concentrations

Mineral biofortification in maize grain can be achieved through genetic or agronomic enhancements or both [12,15,16,33]. When compared with genetic enhancement, agronomic enhancement through optimal nutrient supply is a quick approach that takes less time and money. The MPM amendment produced the highest GWt, NoG, and mineral concentrations (Cl, Mg, P, Co, Fe, and Mn) in this study, while its Zn concentration was comparable to that of the MF amendment. This observation aligned with the report of Xue et al. [16], who achieved increased grain yield and mineral concentrations (Zn, Fe, and Mn) after optimizing soil amendment. Excess soil amendment did not increase grain yield or mineral concentrations [16]. When the amount of organic soil amendment was increased, Dada and Kutu [34] found that maize grain mineral concentrations decreased. In this study, the highest application of organic amendment under the PM amendment resulted in a similarly reduced mineral concentration in maize grain.
The PM amendment had the lowest levels of Cl, Mg, Na, P, Co, Mn, Zn, and B. Under the PM amendment, the abovementioned minerals showed a proportional relationship with GWt and NoG, similar to what was observed among maize varieties. Organic soil amendments, such as poultry manure, are an excellent source of both essential and nonessential minerals for plant growth [17,35]. Therefore, the concentration of these minerals in soil solutions, on the other hand, may have an impact on their assimilation. Mineral uptake by plant roots is influenced by the quantity and interactions of the minerals [21]. Guo et al. [12] found that applying above-optimal N fertilizer reduced Mn, Fe, Zn, and K concentrations significantly. Pasley et al. [36] warned against the overuse of N fertilizer because of its negative impact on the soil–plant balance of P, K, S, Mn, and Cu. When compared with the MPM amendment, which received a smaller amount of poultry manure, the PM amendment’s high nutrient content may have diluted the concentrations of some macro- and trace minerals in the maize grain grown on it.

4.4. The Interactive Effect of Heat Stress, Variety, and Soil Amendment on Maize Grain’s Mineral Concentrations

The demand for a particular crop variety is determined by its quality, which is affected by the growth environment [37]. There were reported differences in yield and mineral concentrations in maize plants exposed to various growth environments and soil amendments [12,16]. The interaction of heat stress, maize variety, and soil amendment influenced GWt, NoG, and grain mineral concentrations in this study. The range of Na, Fe, Mo, Zn, and B concentrations in this study agreed with Wang et al. [14] but differed in Co, Cu, Mn, and Ni concentrations. In addition, the Cu, Fe, Mn, and Zn concentrations found in this study were consistent with previous reports on maize grain [12,13,38,39]. Wang et al. [14] observed a significant effect of the growth environment on the grain mineral concentrations in maize and speculated that the geographical origin of maize could be traced using their mineral fingerprints. Besides the climatic effect, genotype exerts a good influence on the mineral concentrations in maize [12].
The position of the treatment interactions and studied attributes on the which-won-where biplot is vital in interpreting the biplot output. For example, the location of NoG, GWt, Co, Mn, and B in the sector where non-heat-stress treatments such as NHS-8, NHS-6, NHS-2, NHS-5, and NHS-9 are housed indicated that these treatment interactions performed better in these attributes. Similarly, the position of NHS-3 opposite the NHS-8 sector implied that NHS-3 performed poorly in those attributes present in the NHS-8 sector. The presence of most minerals in the HS-1 sector, which contained heat-stress treatments HS-2, HS-5, HS-4, and a non-heat-stress treatment NHS-4, confirmed the higher concentration of minerals in the maize grains with low yield. The inclusion of NHS-4 into this sector corresponds to its highest mean for Cu, Mn, Ni, Ca, and Na while having a low mean for GWt and NoG in the non-heat-stressed environment. This phenomenon of high mineral concentration with low grain yield was reported in cereals [7,8,24,25].
The ranking of the treatment interactions showed that all the non-heat-stress treatments were placed in the top section of the biplot, except for NHS-4 and NHS-7, which gave the lowest mean for NoG and GWt, respectively, in the non-heat-stressed environment. The ranking revealed that treatment interactions containing MPM (HS-2, HS-5, HS-8, NHS-2, NHS-5, and NHS-8) consistently gave good results in the three maize varieties across the HS and NHS environments. Among the high-performing treatment interactions, WE5323 (NHS-5) and ZM1523 (NHS-8) amended with MPM ranked ahead of WE5323 (NHS-6) and ZM1523 (NHS-9) amended with PM, respectively, under the NHS environment. In the HS environment, WE3128 (HS-1) and WE5323 (HS-4) amended with MF ranked ahead of their counterparts amended with MPM (HS-2 and HS-5).
While there is a high level of consistency in aligning the treatments along the heat stress factor and soil amendment factor, the variety factor was not consistent in separating the treatment interactions. For example, variety WE3128 was ranked first (HS-1) and last (HS-3) in the heat-stressed environment. Studies have shown that a single maize variety can respond differently under various soil and climatic conditions [12,14,16]. The environment of growth, as well as the genotype by environmental interaction, should be considered when improving grain yield in relation to mineral concentrations. Variations in maize grain yield and mineral concentration have been reported as a result of genotype and environmental differences [4,12,13].

5. Conclusions

In the heat-stressed environment, there were fewer grains, which led to higher mineral concentrations. For Ca, Cl, Mg, Na, P, and S, the heat-stressed environment was markedly higher than the non-heat-stressed environment by 14.6, 34.0, 1.5, 11.0, 1.9, and 89.2%, respectively. The rankings of the maize varieties based on their levels of macrominerals were WE5323, ZM1523, and WE3128. The treatment interactions containing MPM in both the HS and NHS environments (HS-2, HS-5, HS-8, NHS-2, NHS-5, and NHS-8) consistently produced positive results in the three maize varieties. In terms of grain weight and the number of grains, the mixture of mineral fertilizer and poultry manure (MPM) was significantly higher than the sole application of mineral fertilizer by 57.1% and 100.6%, respectively. The treatment interactions were ranked, and all non-heat-stress treatments were placed in the top section of the biplot except for NHS-4 and NHS-7, which had the lowest mean for NoG and GWt, respectively, in the non-heat-stressed environment. Although the variety was inconsistent in separating the treatment interactions, there was a good level of consistency in separating the treatment interactions along the heat stress factor and soil amendment factor. Additionally, this study showed that lower maize grain Fe or Zn concentrations occurred when there was a proportional relationship between grain yield and Fe or Zn. As a result, choosing maize varieties solely for their ability to produce large amounts of grain may lead to lower Fe and Zn concentrations in the grain. This study suggests that breeding programs aiming for high grain quantity and quality should take into account WE5323, which provided the highest grain yield and stable mineral concentrations in both HS and NHS environments. Additionally, for better maize quality and quantity, this study encourages maize growers to use a combination of organic and inorganic soil amendments. This study also urges further investigations into the role of poultry manure in reducing abiotic stress and ensuring sustainable crop production in light of climate change.

Supplementary Materials

The following supporting information can be downloaded at: https://www.mdpi.com/article/10.3390/agriculture12101633/s1.

Author Contributions

Conceptualization, U.P.C., F.R.K. and S.M.; methodology, U.P.C., F.R.K., S.M. and L.E.M.; formal analysis, U.P.C.; investigation, U.P.C.; resources, L.E.M.; data curation, U.P.C.; writing—original draft preparation, U.P.C.; writing—review and editing, U.P.C., F.R.K., S.M. and L.E.M.; and supervision, F.R.K. and S.M. All authors have read and agreed to the published version of the manuscript.

Funding

This research received no external funding.

Institutional Review Board Statement

Not applicable.

Informed Consent Statement

Not applicable.

Data Availability Statement

The data presented in this study are available on request from the corresponding author.

Conflicts of Interest

The authors declare no conflict of interest.

References

  1. FAO. The State of Food Security and Nutrition in the World 2018: Building Climate Resilience for Food Security and Nutrition; Food & Agriculture Organization: Rome, Italy, 2018. [Google Scholar]
  2. UN. The Sustainable Development Goals Report; 9789210049603; UN: New York, NY, USA, 2020; p. 66. [Google Scholar]
  3. IPCC. Summary for Policymakers. In Climate Change 2021: The Physical Science Basis. Contribution of Working Group I to the Sixth Assessment Report of the Intergovernmental Panel on Climate Change; IPCC: Cambridge, UK, 2021; p. 41. [Google Scholar]
  4. Chukwudi, U.P.; Kutu, F.R.; Mavengahama, S. Heat stress effect on the grain yield of three drought-tolerant maize varieties under varying growth conditions. Plants 2021, 10, 1532. [Google Scholar] [CrossRef] [PubMed]
  5. Lizaso, J.I.; Ruiz-Ramos, M.; Rodríguez, L.; Gabaldon-Leal, C.; Oliveira, J.A.; Lorite, I.J.; Sánchez, D.; García, E.; Rodríguez, A. Impact of high temperatures in maize: Phenology and yield components. Field Crop. Res. 2018, 216, 129–140. [Google Scholar] [CrossRef] [Green Version]
  6. Janni, M.; Gullì, M.; Maestri, E.; Marmiroli, M.; Valliyodan, B.; Nguyen, H.T.; Marmiroli, N. Molecular and genetic bases of heat stress responses in crop plants and breeding for increased resilience and productivity. J. Exp. Bot. 2020, 71, 3780–3802. [Google Scholar] [CrossRef]
  7. Guzmán, C.; Autrique, J.E.; Mondal, S.; Singh, R.P.; Govindan, V.; Morales-Dorantes, A.; Posadas-Romano, G.; Crossa, J.; Ammar, K.; Peña, R.J. Response to drought and heat stress on wheat quality, with special emphasis on bread-making quality, in durum wheat. Field Crop. Res. 2016, 186, 157–165. [Google Scholar] [CrossRef]
  8. Wang, X.; Liu, F. Effects of elevated CO2 and heat on wheat grain quality. Plants 2021, 10, 1027. [Google Scholar] [CrossRef] [PubMed]
  9. Goredema-Matongera, N.; Ndhlela, T.; Magorokosho, C.; Kamutando, C.N.; van Biljon, A.; Labuschagne, M. Multinutrient biofortification of maize (Zea mays L.) in Africa: Current status, opportunities and limitations. Nutrients 2021, 13, 1039. [Google Scholar] [CrossRef]
  10. Mallikarjuna, M.; Thirunavukkarasu, N.; Hossain, F.; Bhat, J.; Jha, S.; Rathore, A.; Agrawal, P.; Pattanayak, A.; Reddy, S.; Gularia, S.; et al. Stability performance of inductively coupled plasma mass spectrometry-phenotyped kernel minerals concentration and grain yield in maize in different agro-climatic zones. PLoS ONE 2015, 10, e0139067. [Google Scholar] [CrossRef] [Green Version]
  11. OECD/FAO. Cereals. In Agricultural Outlook 2020–2029; OECD/FAO: Rome, Italy, 2020; p. 17. [Google Scholar]
  12. Guo, S.; Chen, Y.; Chen, X.; Chen, Y.; Yang, L.; Wang, L.; Qin, Y.; Li, M.; Chen, F.; Mi, G.; et al. Grain mineral accumulation changes in Chinese maize cultivars released in different decades and the responses to nitrogen fertilizer. Front. Plant Sci. 2020, 10, 1662. [Google Scholar] [CrossRef]
  13. Gu, R.; Chen, F.; Liu, B.; Wang, X.; Liu, J.; Li, P.; Pan, Q.; Pace, J.; Soomro, A.-A.; Lübberstedt, T.; et al. Comprehensive phenotypic analysis and quantitative trait locus identification for grain mineral concentration, content, and yield in maize (Zea mays L.). Theor. Appl. Genet. 2015, 128, 1777–1789. [Google Scholar] [CrossRef] [Green Version]
  14. Wang, F.; Zhao, H.; Yu, C.; Tang, J.; Wu, W.; Yang, Q. Determination of the geographical origin of maize (Zea mays L.) using mineral element fingerprints. J. Sci. Food Agric. 2020, 100, 1294–1300. [Google Scholar] [CrossRef]
  15. Bouis, H.E.; Saltzman, A. Improving nutrition through biofortification: A review of evidence from HarvestPlus, 2003 through 2016. Glob. Food Secur. 2017, 12, 49–58. [Google Scholar] [CrossRef] [PubMed]
  16. Xue, Y.; Yue, S.; Zhang, W.; Liu, D.; Cui, Z.; Chen, X.; Ye, Y.; Zou, C. Zinc, iron, manganese and copper uptake requirement in response to nitrogen supply and the increased grain yield of summer maize. PLoS ONE 2014, 9, e93895. [Google Scholar] [CrossRef] [PubMed]
  17. Adeyemo, A.J.; Akingbola, O.O.; Ojeniyi, S.O. Effects of poultry manure on soil infiltration, organic matter contents and maize performance on two contrasting degraded alfisols in southwestern Nigeria. Int. J. Recycl. Org. Waste Agric. 2019, 8, 73–80. [Google Scholar] [CrossRef] [Green Version]
  18. Noor, J.J.; Vinayan, M.T.; Umar, S.; Devi, P.; Iqbal, M.; Seetharam, K.; Zaidi, P.H. Morpho-physiological traits associated with heat stress tolerance in tropical maize (Zea mays L.) at reproductive stage. Aust. J. Crop Sci. 2019, 13, 536–545. [Google Scholar] [CrossRef]
  19. Rezaei, E.E.; Webber, H.; Gaiser, T.; Naab, J.; Ewert, F. Heat stress in cereals: Mechanisms and modelling. Eur. J. Agron. 2015, 64, 98–113. [Google Scholar] [CrossRef]
  20. Tesfaye, K.; Zaidi, P.; Gbegbelegbe, S.; Boeber, C.; Getaneh, F.; Seetharam, K.; Erenstein, O.; Stirling, C. Climate change impacts and potential benefits of heat-tolerant maize in South Asia. Theor. Appl. Climatol. 2017, 130, 959–970. [Google Scholar] [CrossRef] [Green Version]
  21. Hansen, T.; De Bang, T.; Laursen, K.; Pedas, P.; Husted, S.; Schjoerring, J. Multielement plant tissue analysis using ICP spectrometry. In Plant Mineral Nutrients; Maathuis, F.J.M., Ed.; Methods and Protocols, Methods in Molecular Biology; Springer: Totowa, NJ, USA, 2013; Volume 953, pp. 121–141. [Google Scholar]
  22. Prasanna, B.M.; Cairns, J.E.; Zaidi, P.H.; Beyene, Y.; Makumbi, D.; Gowda, M.; Magorokosho, C.; Zaman-Allah, M.; Olsen, M.; Das, A.; et al. Beat the stress: Breeding for climate resilience in maize for the tropical rainfed environments. Theor. Appl. Genet. 2021, 134, 1729–1752. [Google Scholar] [CrossRef]
  23. Chakraborty, S.; Newton, A.C. Climate change, plant diseases and food security: An overview. Plant Pathol. 2011, 60, 2–14. [Google Scholar] [CrossRef]
  24. Dias, A.S.; Lidon, F.C.; Ramalho, J.C. IV. Heat stress in Triticum: Kinetics of Fe and Mn accumulation. Braz. J. Plant Physiol. 2009, 21, 153–164. [Google Scholar] [CrossRef]
  25. Narendra, M.; Roy, C.; Kumar, S.; Virk, P.; De, N. Effect of terminal heat stress on physiological traits, grain zinc and iron content in wheat (Triticum aestivum L.). Czech J. Genet. Plant Breed. 2021, 57, 43–50. [Google Scholar] [CrossRef]
  26. Enakiev, Y.I.; Bahitova, A.R.; Lapushkin, V.M. Microelements (Cu, Mo, Zn, Mn, Fe) in corn grain according to their availability in the fallow sod-podzolic soil profile. Bulg. J. Agric. Sci. 2018, 24, 285–289. [Google Scholar]
  27. Oikeh, S.O.; Menkir, A.; Maziya-Dixon, B.; Welch, R.; Glahn, R.P. Assessment of concentrations of iron and zinc and bioavailable iron in grains of early-maturing tropical maize varieties. J. Agric. Food Chem. 2003, 51, 3688–3694. [Google Scholar] [CrossRef] [PubMed]
  28. Akinwale, R.O.; Adewopo, O.A. Grain iron and zinc concentrations and their relationship with selected agronomic traits in early and extra-early maize. J. Crop Improv. 2016, 30, 641–656. [Google Scholar] [CrossRef]
  29. Prasanna, B.; Mazumdar, S.; Chakraborti, M.; Hossain, F.; Manjaiah, K.; Agrawal, P.; Guleria, S.; Gupta, H. Genetic variability and genotype× environment interactions for kernel iron and zinc concentrations in maize (Zea mays) genotypes. Indian J. Agric. Sci. 2011, 81, 704–711. [Google Scholar]
  30. Jin, T.; Zhou, J.; Chen, J.; Zhu, L.; Zhao, Y.; Huang, Y. The genetic architecture of zinc and iron content in maize grains as revealed by QTL mapping and meta-analysis. Breed. Sci. 2013, 63, 317–324. [Google Scholar] [CrossRef] [PubMed] [Green Version]
  31. Cheah, Z.X.; Kopittke, P.M.; Harper, S.M.; O’Hare, T.J.; Wang, P.; Paterson, D.J.; de Jonge, M.D.; Bell, M.J. In situ analyses of inorganic nutrient distribution in sweetcorn and maize kernels using synchrotron-based X-ray fluorescence microscopy. Ann. Bot. 2018, 123, 543–556. [Google Scholar] [CrossRef]
  32. Wang, S.; Wang, Z.-H.; Li, S.-s.; Diao, C.-p.; Liu, L.; Hui, X.-L.; Huang, M.; Luo, L.-C.; He, G.; Cao, H.-b.; et al. Identification of high-yield and high-Zn wheat cultivars for overcoming “yield dilution” in dryland cultivation. Eur. J. Agron. 2018, 101, 57–62. [Google Scholar] [CrossRef]
  33. Gyori, Z. Essential mineral element status in wheat and maize grains. EC Nutr. 2018, 13, 1–3. [Google Scholar]
  34. Dada, O.A.; Kutu, F.R. Bioavailability and health risk assessment of potentially toxic elements in popcorn kernel from sandy loam Ferric Luvisol amended with municipal solid waste compost. Environ. Geochem. Health 2021, 43, 2389–2405. [Google Scholar] [CrossRef]
  35. Baiyeri, K.P.; Chukwudi, U.P.; Chizaram, C.A.; Aneke, N. Maximizing rice husk waste for Daucus carota production. Int. J. Recycl. Org. Waste Agric. 2019, 8, 399–406. [Google Scholar] [CrossRef] [Green Version]
  36. Pasley, H.R.; Cairns, J.E.; Camberato, J.J.; Vyn, T.J. Nitrogen fertilizer rate increases plant uptake and soil availability of essential nutrients in continuous maize production in Kenya and Zimbabwe. Nutr. Cycl. Agroecosyst. 2019, 115, 373–389. [Google Scholar] [CrossRef] [PubMed] [Green Version]
  37. Chukwudi, U.P.; Agbo, C.U.; Echezona, B.C.; Eze, E.I.; Kutu, F.R.; Mavengahama, S. Variability in morphological, yield and nutritional attributes of ginger (Zingiber officinale) germplasm in Nigeria. Res. Crop. 2020, 21, 634–642. [Google Scholar] [CrossRef]
  38. Behera, S.K.; Shukla, A.K.; Singh, M.V.; Wanjari, R.H.; Singh, P. Yield and zinc, copper, manganese and iron concentration in maize (Zea mays L.) grown on Vertisol as influenced by zinc application from various zinc fertilizers. J. Plant Nutr. 2015, 38, 1544–1557. [Google Scholar] [CrossRef]
  39. Imran, M.; Garbe-Schönberg, D.; Neumann, G.; Boelt, B.; Mühling, K.H. Zinc distribution and localization in primed maize seeds and its translocation during early seedling development. Environ. Exp. Bot. 2017, 143, 91–98. [Google Scholar] [CrossRef]
Figure 1. The which-won-where biplot view of the treatment interactions and the attributes. HS—heat-stressed environment, NHS—non-heat-stressed environment, 1—WE3128 with MF, 2—WE3128 with MPM, 3—WE3128 with PM, 4—WE5323 with MF, 5—WE5323 with MPM, 6—WE5323 with PM, 7—ZM1523 with MF, 8—ZM1523 with MPM, 9—ZM1523 with PM, GWt — grain weight, and NoG—number of grain.
Agriculture 12 01633 g001
Figure 2. The discriminatory and representative abilities of the attributes. HS—heat-stress environment, NHS—non-heat-stressed environment, 1—WE3128 with MF, 2—WE3128 with MPM, 3—WE3128 with PM, 4—WE5323 with MF, 5—WE5323 with MPM, 6—WE5323 with PM, 7—ZM1523 with MF, 8—ZM1523 with MPM, 9—ZM1523 with PM, GWt—grain weight, and NoG—number of grain.
Agriculture 12 01633 g002
Figure 3. The mean performance and stability view of the treatment interactions. HS—heat-stressed environment, NHS—non-heat-stressed environment, 1—WE3128 with MF, 2—WE3128 with MPM, 3—WE3128 with PM, 4—WE5323 with MF, 5—WE5323 with MPM, 6—WE5323 with PM, 7—ZM1523 with MF, 8—ZM1523 with MPM, 9—ZM1523 with PM, GWt—grain weight, and NoG—number of grain.
Agriculture 12 01633 g003
Figure 4. Grain mineral concentrations and grain yield correlation coefficient for maize varieties.
Agriculture 12 01633 g004
Figure 5. Correlation coefficients between grain mineral concentrations and grain yield for soil amendments. PM—poultry manure, MF—mineral fertilizers, and MPM—complementary (50:50) application of poultry manure and mineral fertilizer.
Agriculture 12 01633 g005
Figure 6. The correlation coefficients between grain mineral concentrations and yield for the growth environment and general treatment interactions. NHS—non-heat-stressed environment, HS—heat-stressed environment, and CAF—correlation based on environment, maize variety, and soil amendment.
Agriculture 12 01633 g006
Table 1. The levels of significance for the main and interaction effects of heat stress, maize variety, and soil amendment on grain yield and mineral concentrations.
Source of VariationCaClMgNaPSCoCuFeMnMoZnBNiNoGGWt
Env<0.001<0.001<0.001<0.001<0.001<0.001<0.0010.061<0.001<0.001<0.001<0.0010.639<0.001<0.001<0.001
Mva<0.001<0.001<0.001<0.001<0.001<0.001<0.001<0.001<0.001<0.001<0.001<0.0010.635<0.0010.660.912
Sam<0.001<0.001<0.001<0.001<0.001<0.001<0.001<0.001<0.001<0.001<0.001<0.0010.519<0.0010.021<0.001
Env.Mva<0.001<0.001<0.001<0.001<0.001<0.001<0.0010.006<0.001<0.001<0.001<0.001<0.001<0.0010.0290.04
Env.Sam<0.001<0.001<0.001<0.001<0.001<0.001<0.001<0.0010.026<0.001<0.001<0.001<0.001<0.0010.002<0.001
Mva.Sam<0.001<0.001<0.001<0.001<0.001<0.001<0.001<0.001<0.001<0.001<0.001<0.001<0.001<0.001<0.001<0.001
Env.Mva.Sam<0.001<0.001<0.001<0.001<0.001<0.001<0.001<0.001<0.001<0.001<0.001<0.001<0.001<0.001<0.001<0.001
Env—growth environment, Mva—maize variety, Sam—soil amendment, GWt—grain weight, and NoG—grain number.
Table 2. The main effects of growth environment, variety, and soil amendment on the maize grain yield and mineral concentrations (µg/kg).
MineralsEnvironmentMaize VarietySoil Amendment
HS NHS WE3128WE5323ZM1523MF MPM PM
MacroMean±SDMean ±SDMean ±SDMean ±SDMean ±SDMean ±SDMean ±SDMean ±SD
Ca175.3040.2 a152.9143.3 b138.3815.14 c179.0243.6 a174.9150.5 b170.3046.5 a156.5014.9 c165.5056.9 b
Cl9565.1477 a7138.2163 b7484.2739 c9628.1462 a7942.1681 b8111.2852 b9011.1152 a7933.2236 b
Mg520.90120.9 a513.2582.9 b501.55110.2 c531.06104.2 a518.6297.3 b511.9081.6 b566.1065.1 a473.20132 c
Na11.793.8 a10.623.1 b10.664.9 b12.602.5 a10.351.9 b13.892.7 a11.922.6 b7.801.7 c
P409.4189.1 a401.7664.9 b395.5488.6 c422.0880.6 a399.1461.7 b389.8085.5 b455.6033.5 a371.4077.6 c
S13.476.1 a7.124.9 b10.337.6 b8.616.6 c11.954.2 a13.535.8 a6.182.6 c11.197.4 b
Trace
Co0.130.05 b0.200.12 a0.150.06 b0.150.05 ab0.200.15 a0.140.03 b0.230.13 a0.120.06 c
Cu12.785.58 a12.114.9 a9.644.8 c11.976.3 b15.741.7 a16.153.7 a13.052.5 b8.145.5 c
Fe136.7570.2 a95.2134.2 b87.8540.7 c112.1735.1 b147.9276.6 a105.2036.6 b136.9051.3 a105.9077.6 b
Mn20.205.1 b28.155.6 a23.365.9 b23.807.4 b25.386.8 a25.396.4 b26.125.6 a21.027.1 c
Mo21.3827.6 b34.5522.2 a23.5829.4 b38.1919.4 a22.1325.5 b46.1630.1 a11.7916.1 c25.9416.1 b
Zn38.8013.3 a33.514.9 b40.8414.4 a34.867.6 b32.775.3 c37.9515.3 a37.64.8 a32.927.5 b
B1.630.63 a1.580.76 a1.540.65 a1.670.85 a1.600.6 a1.570.7 a1.690.5 a1.550.8 a
Ni3.101.4 b3.832.3 a2.531.9 c4.182.4 a3.680.7 b5.152.1 a2.990.9 b2.251.0 c
NoG76.066.6 b338.0139 a205.0183 a223.0171 a194.0159 a163.082.9 c256.0198. a203.0199 b
GWt18.216.8 b87.040 a50.944 a53.946 a53.049 a34.514.9 b69.252.7 a54.155 ab
a–c—letters in superscript are used for mean separation, Means with the same superscript letter(s) across a row within the same factor are not significantly different at p ≤ 0.05. NoG—grain number, GWt—grain weight (g plant−1), SD—standard deviation, HS—heat-stressed environment, NHS—non-heat-stressed environment, PM—poultry manure, MF—mineral fertilizers, and MPM—complementary (50:50) application of poultry manure and mineral fertilizer.
Publisher’s Note: MDPI stays neutral with regard to jurisdictional claims in published maps and institutional affiliations.

