Article

Drivers of Postharvest Loss among Citrus Farmers in Eastern Cape Province of South Africa: A Zero-Inflated Poisson (ZIP) Regression Model Analysis

by
Siphiw’okuhle Nohamba
1,
Joseph P. Musara
1,*,
Yonas T. Bahta
1 and
Abiodun A. Ogundeji
2
1
Department of Agricultural Economics, University of the Free State, P.O. Box 339, Bloemfontein 9300, South Africa
2
Disaster Management Training and Education Centre for Africa (DiMTEC), P.O. Box 339, Bloemfontein 9300, South Africa
*
Author to whom correspondence should be addressed.
Agriculture 2022, 12(10), 1651; https://doi.org/10.3390/agriculture12101651
Submission received: 23 August 2022 / Revised: 23 September 2022 / Accepted: 30 September 2022 / Published: 9 October 2022
(This article belongs to the Special Issue Crop Productivity in Arid Regions and under Climate Change)

Abstract

:
Reducing postharvest losses (PHLs) in the South African citrus industry is fundamental in ensuring food, income, and nutrition security. However, there is limited knowledge on the extent of postharvest losses, their diversity, and the associated inhibiting factors. These factors compromise postharvest loss management strategies and how they can be scaled up across production zones in South Africa. The study adopted a pragmatic philosophy to assess the magnitude and diversity of PHLs for citrus crops and assess the determining factors. A standardized questionnaire was administered to 137 citrus producers from the Eastern Cape Province’s three production zones. Multistage sampling which combined purposive and stratified proportionate sampling was utilized to select the province, production zones, and farmers. The study employed the embedded research approach with a zero-inflated Poisson (ZIP) model. The countfit and Vuong tests were used in Stata 15 to ascertain and correct for overdispersion and inflated zeros while isolating the model which best fitted the data. The ZIP regression model indicated that social (e.g., marital status, education, age), economic (e.g., yield), institutional (e.g., markets, extension, credit), and cross-cutting (e.g., pruning, cultivar) factors determined the magnitude of PHL exposure. Targeted and tailored capacity building on good agricultural practices in citrus production might help to reduce postharvest losses through the extension pillar. The production of Nova and Navel citrus cultivars may be promoted when these cultivars are easily accessible and available to farmers while researching other traits to reduce PHL incidences. Investment programs to support the use of water-efficient drip irrigation systems need to be initiated to reduce the chances of incurring considerable postharvest losses. Likewise, pest and disease control in citrus production should be intensified and targeted. Subsidized support for the maintenance of citrus plantations should be provided by the government and other stakeholders, such as citrus production associations.

1. Introduction

In developing countries, a significant volume of citrus products is lost in operations before, during, and after harvesting due to a lack of production knowledge, inadequate technology for harvesting, inappropriate transporting technology, and poor processing infrastructure. On the contrary, in developed countries, the loss of citrus products in the middle stages of supply chains is comparatively low, mainly due to the accessibility of advanced technologies and more efficient production, handling, and storage techniques [1]. The citrus industry is strategic in South Africa and is the third largest horticultural industry after deciduous fruits and vegetables in terms of gross value. The country is the second largest citrus exporter in the world and accounts for 10% of global exports. Worryingly, PHLs are estimated to represent approximately 7.9% of export revenue per annum in South Africa, and therefore, it is essential to explore the causes of these PHLs [2].
According to Hussein et al. [3], differences in cultivars, production systems and scale, disease and pest management, investments in irrigation infrastructure, and handling techniques present unique PHL exposure for smallholder citrus farmers. In response, various actions were initiated by the government and private sector to reduce the vulnerability of citrus producers to PHLs in South Africa [4]. These include PHL management training programs, government subsidies for PHL infrastructure, research, and development of cultivars, as well as innovative pests and diseases management. Experiences from other countries, including Kenya [5], Tanzania [6], and Ethiopia [7], show that these efforts can be ineffective if not well integrated. Lessons from the USA also show the benefits of a transdisciplinary research-based approach to managing PHLs [8]. However, Mashau et al. [2] reported that the utilization of these pathways has not been possible in South Africa since not much information on the extent, diversity, and causes of citrus PHLs is documented.
To add to the PHL debate, isolated studies were conducted by Stathers et al. [9], who examined the effects of fruit bruises on PHL without acknowledging the impact of other root causes in climatic conditions, harvesting, transporting, and storage in sub-Saharan Africa and South Asia. Mukarumbwa et al. [10] assessed the angle of PHL management by looking at the technological implications of adopting various strategies in Zimbabwe. Their analysis missed the need to critically analyse the driving causes of the PHLs since this is important for designing loss management strategies. Kaminski and Christiaensen [11] also explored the PHLs in fruit markets in sub-Saharan Africa using a descriptive analysis without directly measuring the extent of PHLs and the causality across the diverse driving factors. Dodd et al. [12] reviewed PHLs management for fruits in South Africa while skipping the need for empirical evidence from recent developments in environmental factors and markets, which now place quality at the centre of purchasing decisions. Kikulwe et al. [13] also analysed PHLs along the banana value chain in Uganda and recommended ICT investments in PHL management programs. A cross-cutting technical and economic study on Turkey’s citrus industry noted that the currently used “one size fits all” approach for managing causes of PHLs was inappropriate, hence the need for sector-specific analysis [14]. These conflicting findings and lessons motivated this study to understand the driving factors of PHLs in the South African citrus industry.
Another critical and currently missing aspect in PHL research is accounting for weather and climate change factors. Going forward, it is essential to acknowledge that citrus PHLs are also directly influenced by preharvest factors such as climatic conditions, light, temperature, humidity, mineral nutrition, and plant growth regulators [15]. Based on a study in Ethiopia, these climate-change-related factors have been reported to influence the overall fruit quality and suitability for storage interactively, thus increasing the PHLs [7]. Although citrus production, harvesting, and PH handling in South Africa depend on climatic conditions, these have been manipulated using irrigation and Good Agricultural Practices (GAP) [16]. Since the edaphic factors in the study area are assumed to be uniform, the study uses the irrigation, curling factors, pests, and diseases as variables to account for the acknowledgment that climate change and weather conditions need to be managed to reduce PHLs.
Notably, in the wake of the intertwined climate change factors of temperature, humidity, and precipitation, pests and diseases have become prevalent in the Eastern Cape province of South Africa. This has weighed in as an additional threat to citrus fruit quality and increased PHLs. Ahra et al. [17] further asserted that another related cause of PHLs in the citrus industry was the costs of investments in climate change induced PHL management technologies. To push the “appropriate and low-cost solutions” agenda in managing PHLs, extension support services have also been targeting access to climate change information as an entry point [18]. Regardless of all these efforts, PHLs due to social-economic, climatic, institutional, and farm level factors continue to affect South African citrus fruits marketability in high-value export markets [
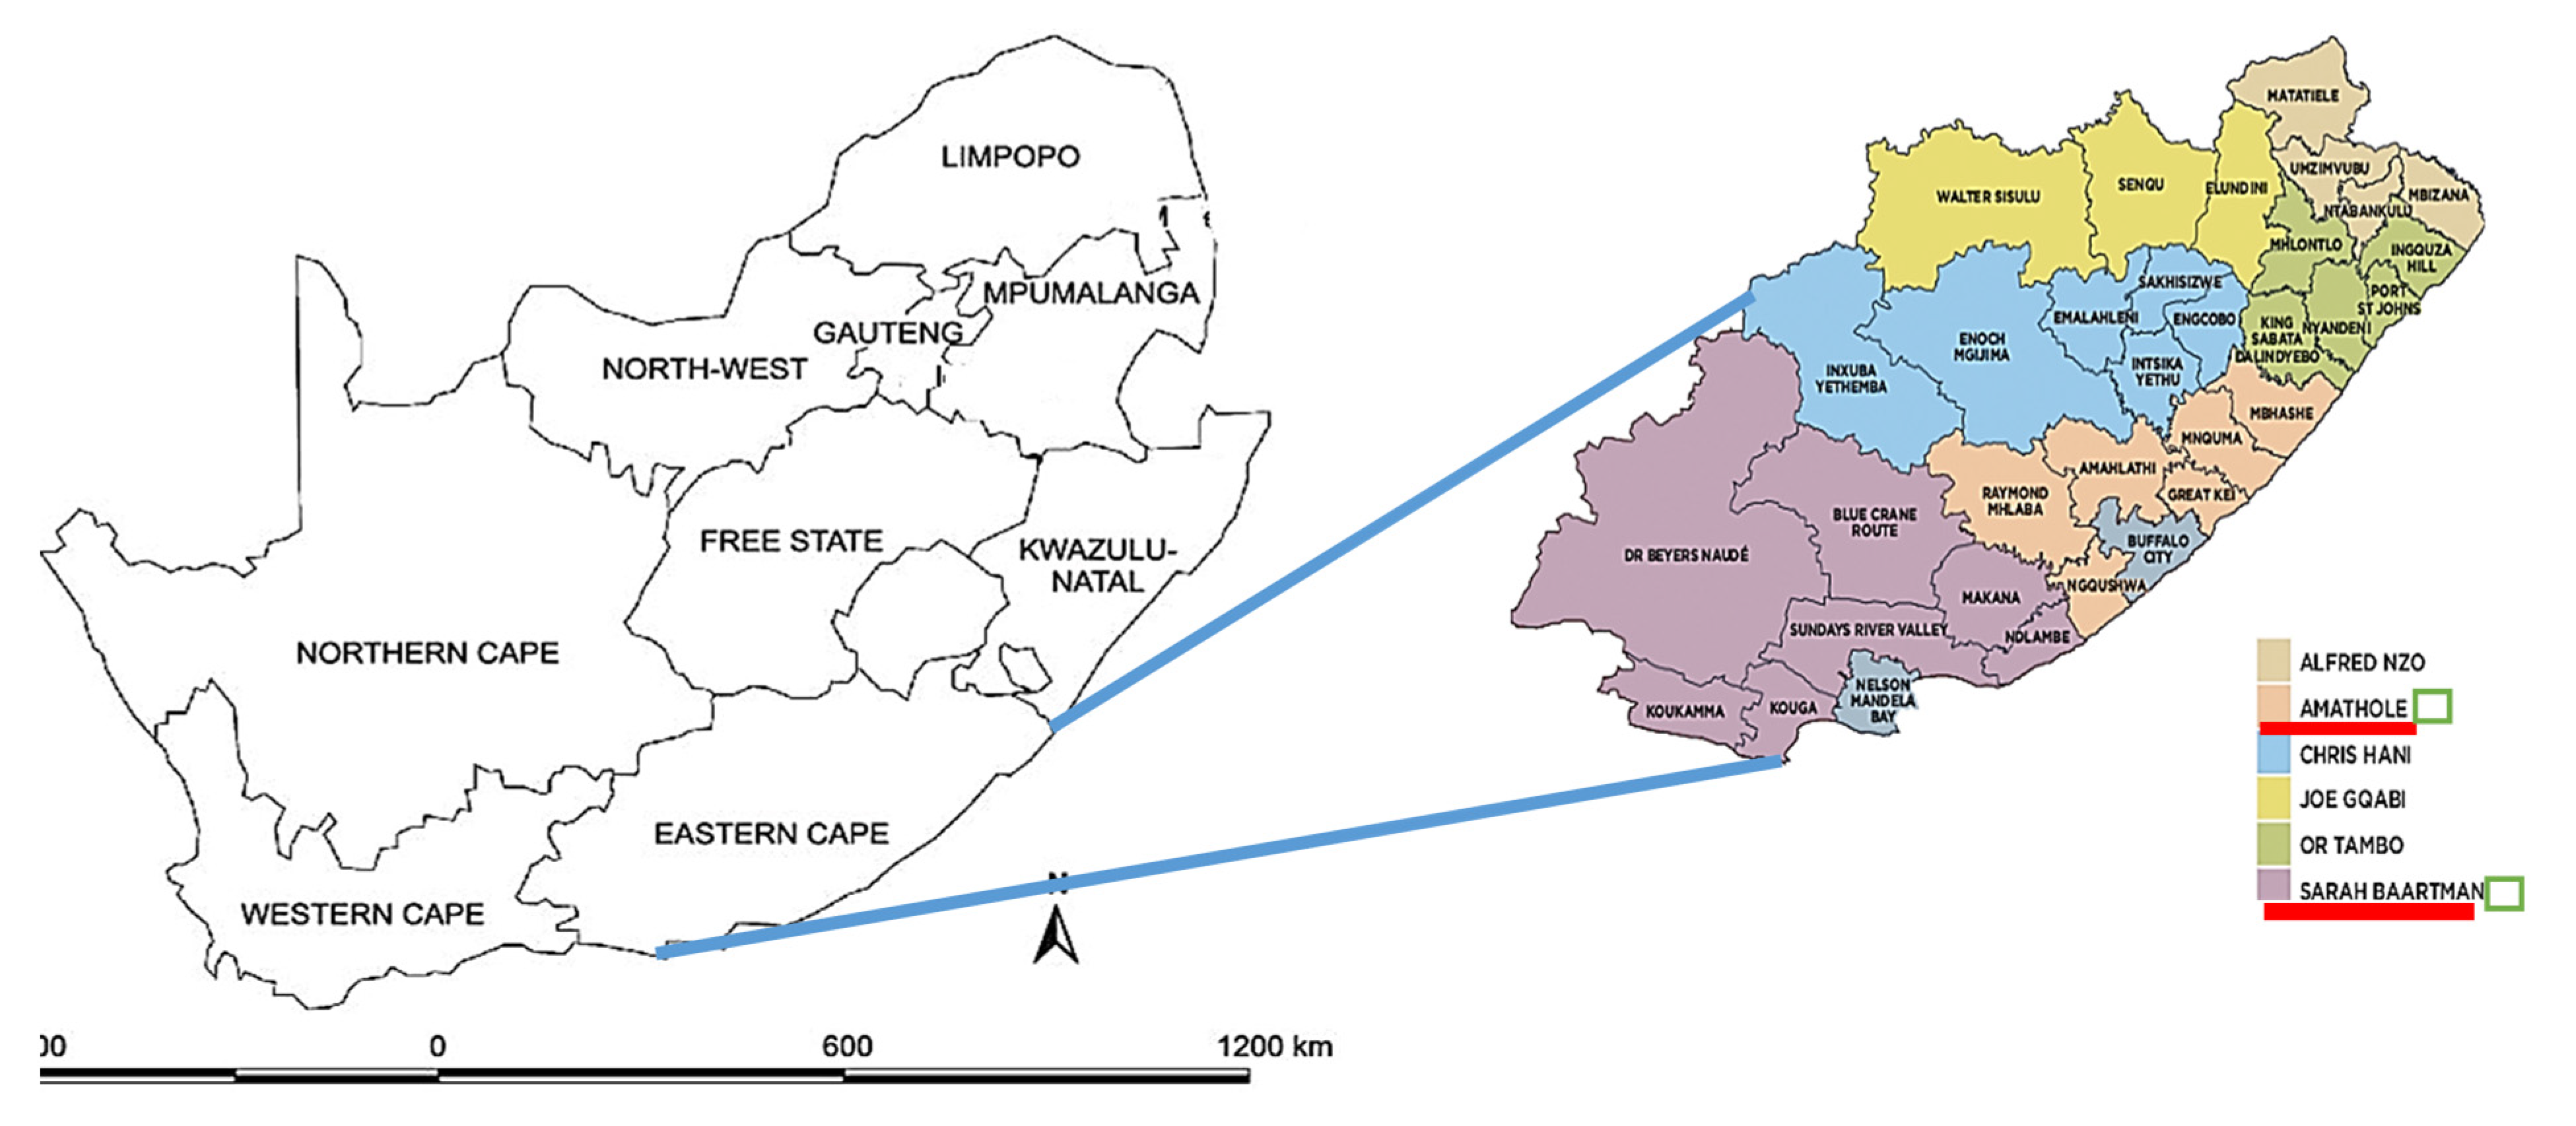
1]. Because of the above observations, this study was undertaken to understand how these factors affect PHLs using provincial-level survey data in the Eastern Cape province of South Africa. The findings will aid policymakers in formulating appropriate interventions to support citrus farmers in managing PHLs that continue to threaten business viability.

2. Conceptual Framework

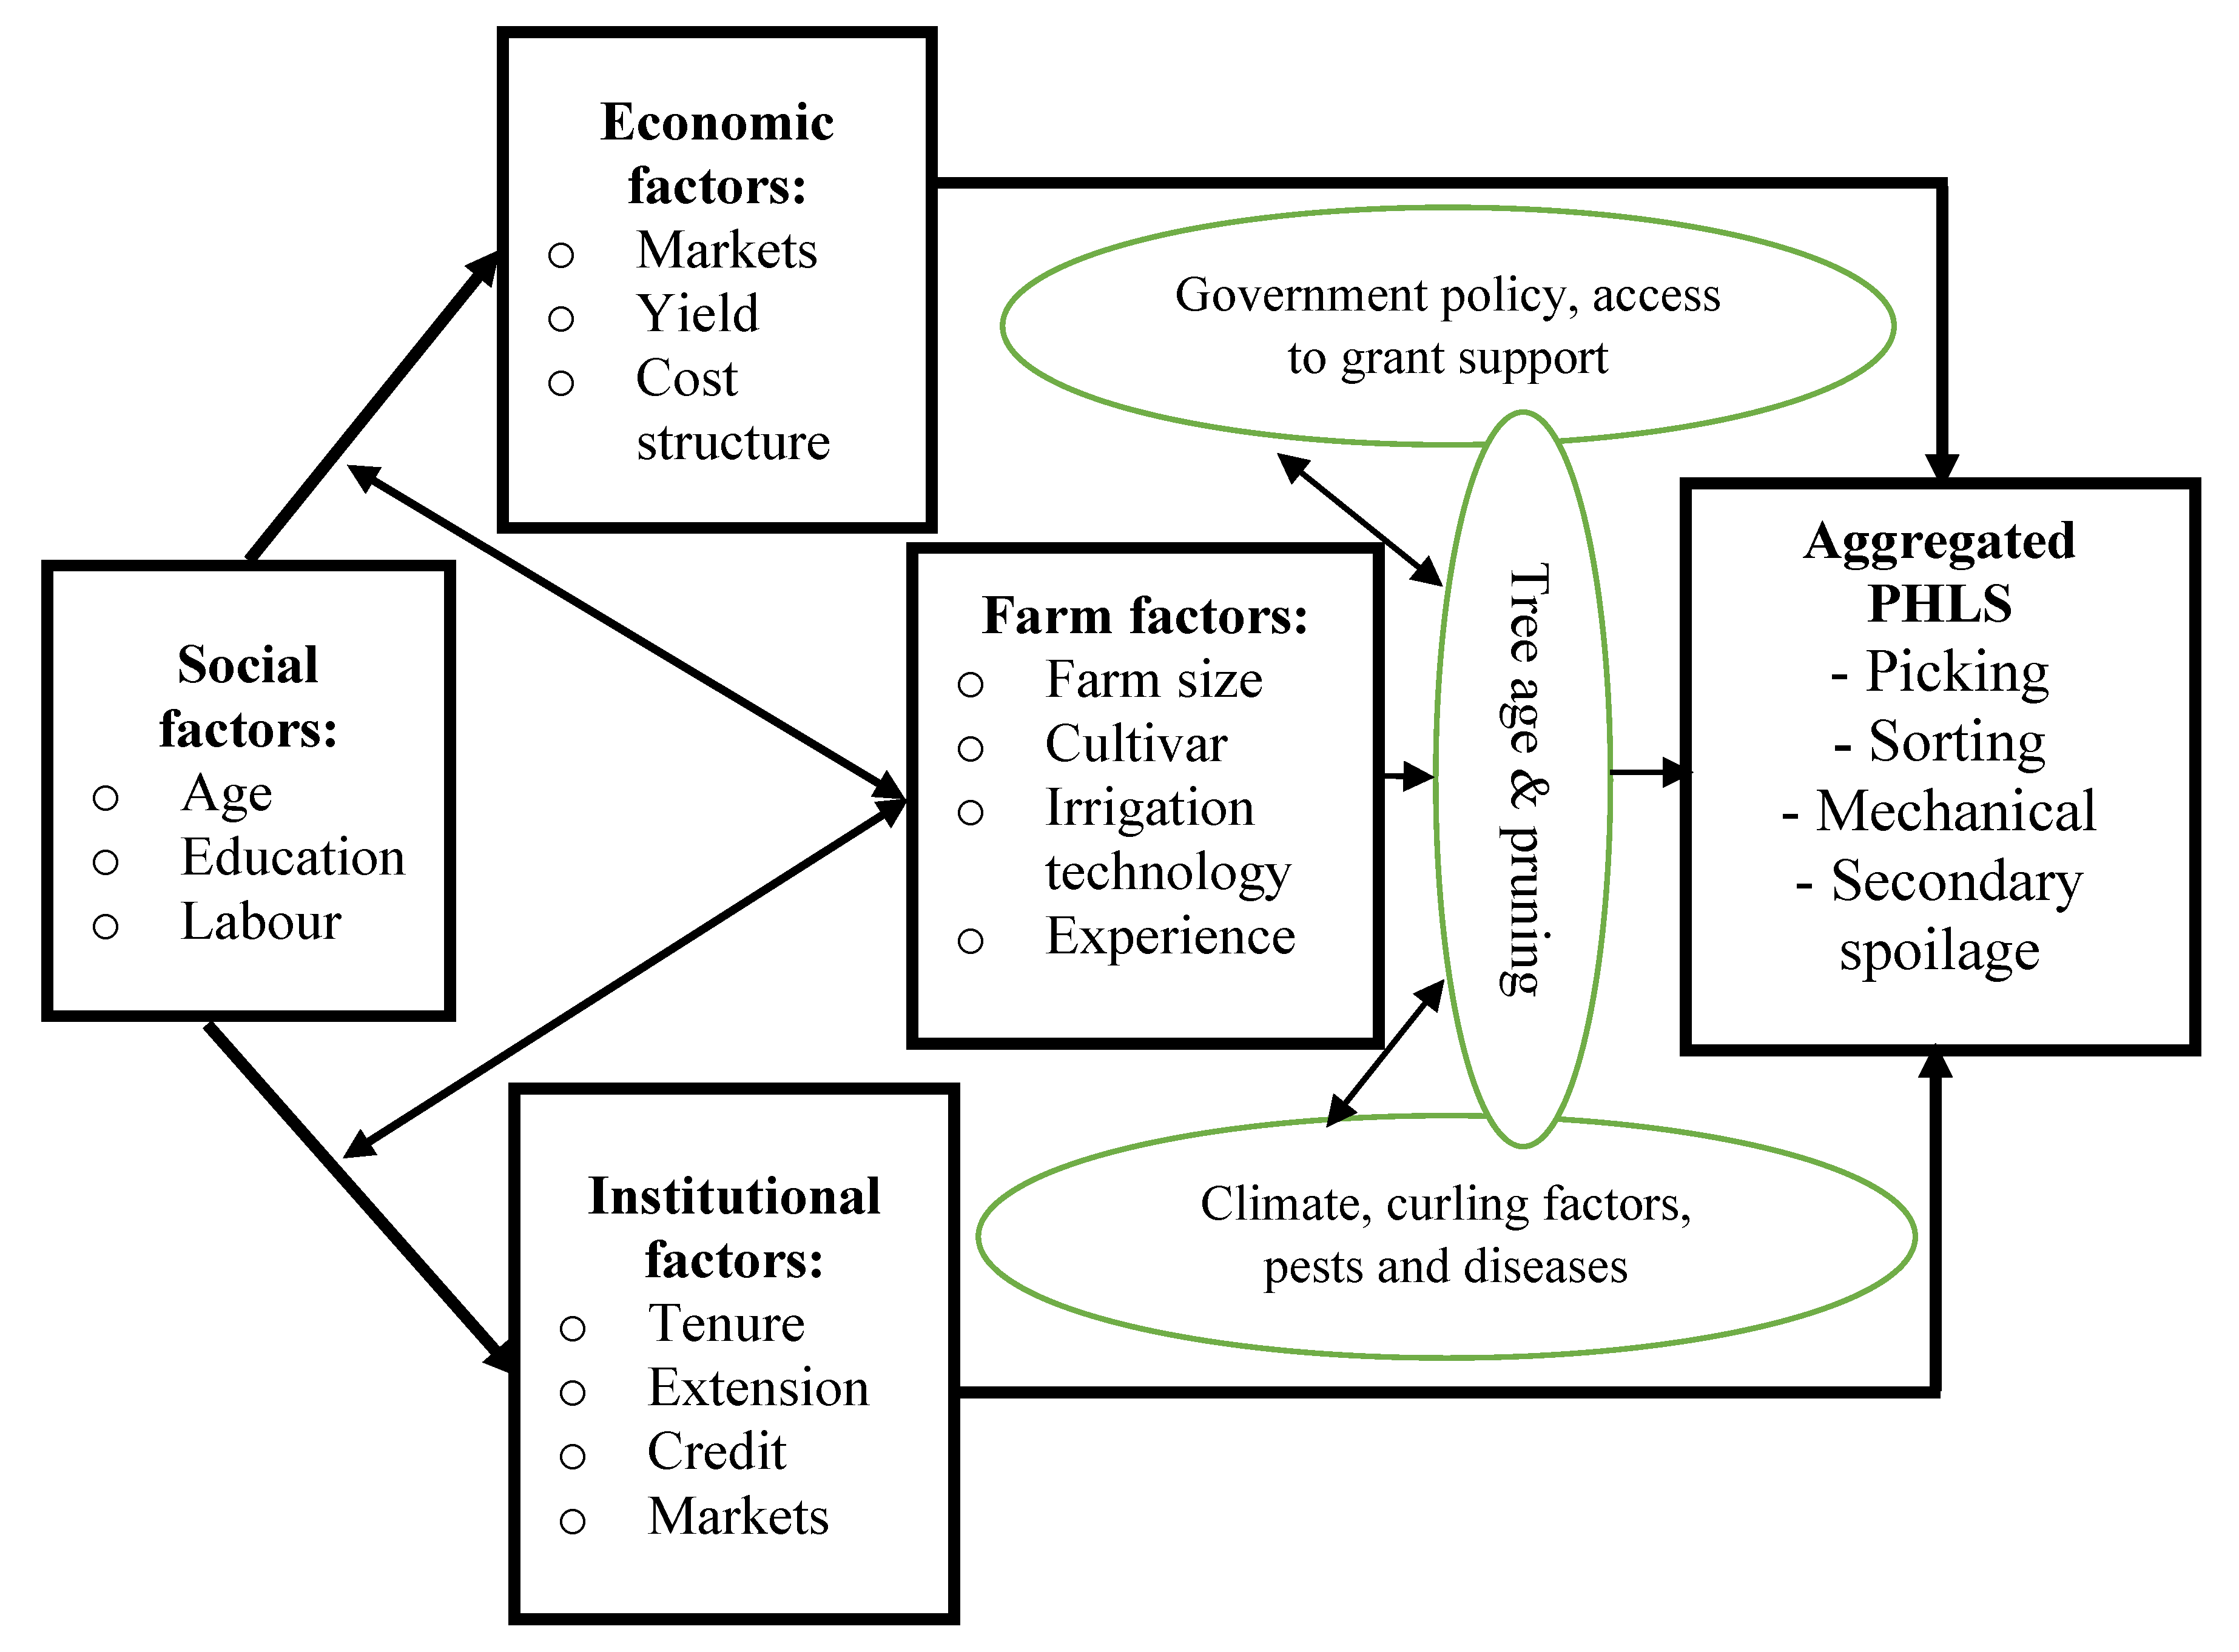
This study used a framework developed by the authors (Figure 1). Numerous variations of PHL conceptual frameworks are reported in the literature. The commonality of these frameworks is that PHLs are affected by farm-specific (internal) and external factors. Guided by these frameworks, the PHLs experienced by the citrus farmer, a count, was used as the outcome variable. Socio-economic factors (e.g., age, labour, education, yield), institutional arrangements (e.g., access to credit, access to extension, access to markets), and farm factors (e.g., farm size, cultivar used, irrigation system used) were used in the modelling. External factors (e.g., tree age, government support, climate, pests and diseases, and curling factors) were additional determinants [2,3]. The conceptual framework in Figure 1 shows the relationships among these variables.
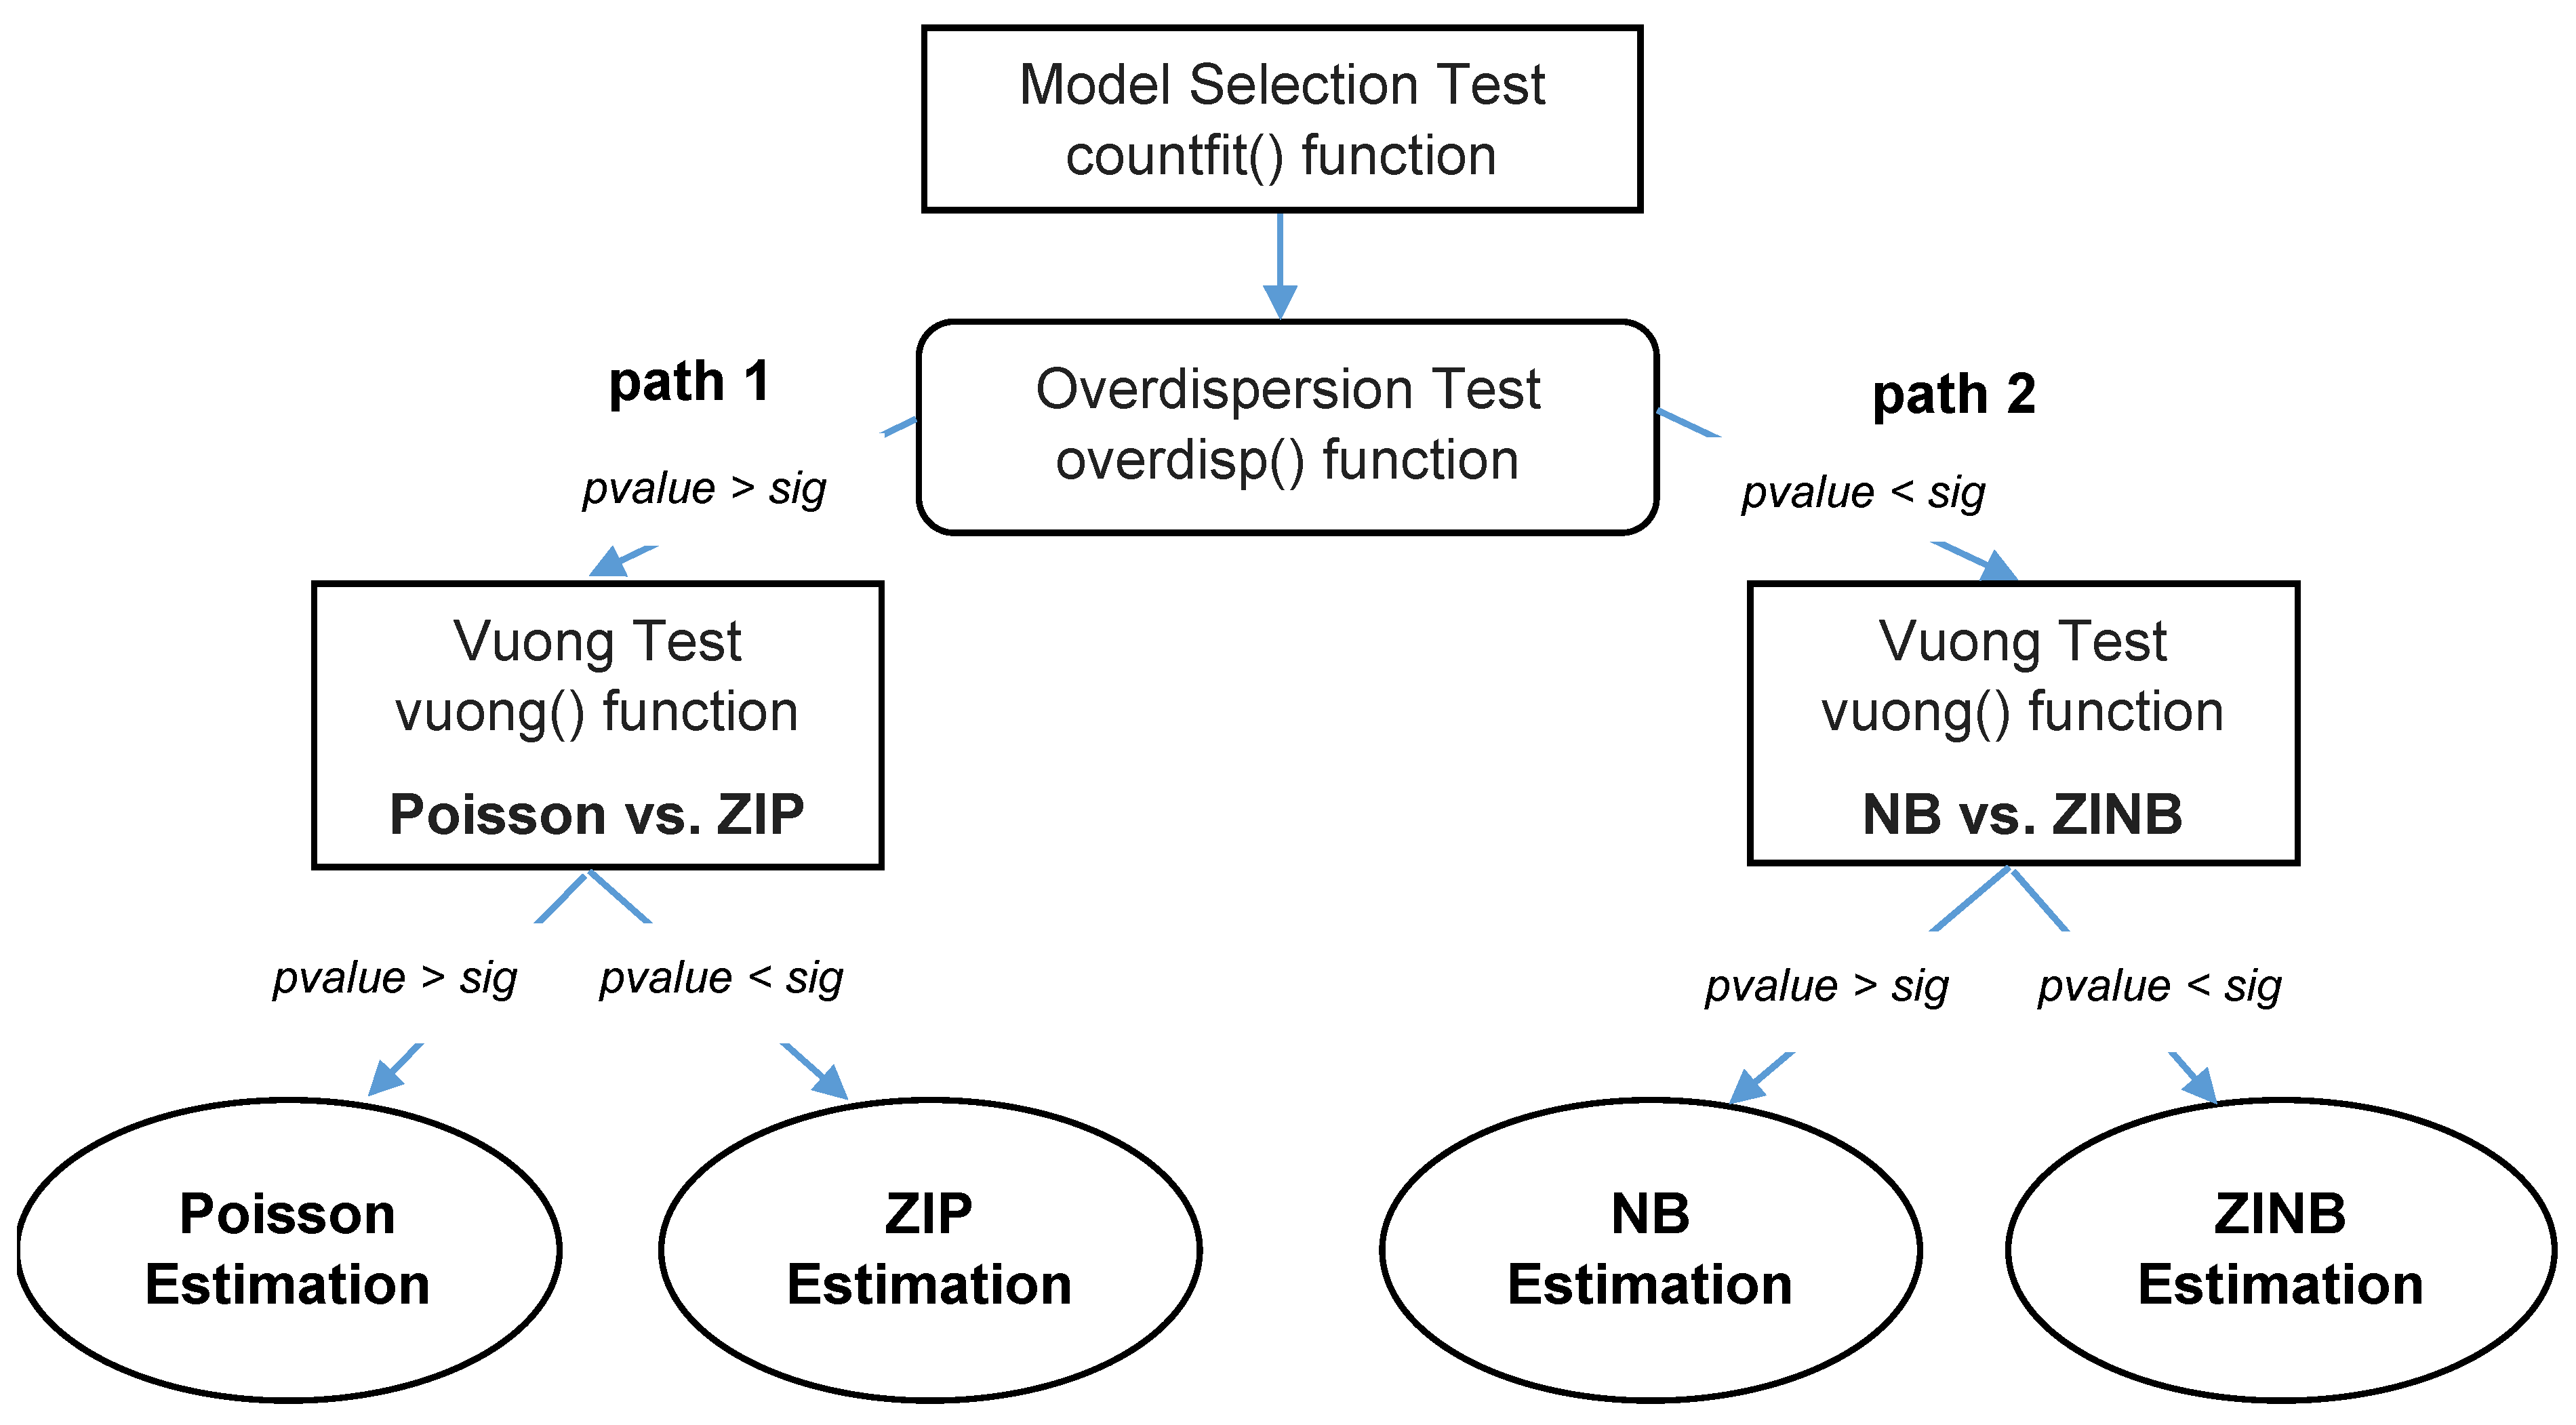
The Stata package version 15 was used to run the ZIP model, where both models were specified in the sequence of running the count model and then running the model that predicts the certain zeros. The study isolated several factors based on the available literature on PHLs in the citrus industry and other related industries [3,7,11,14]. Farm-specific factors such as the increase in the cost of production affect the severity of PHLs in the citrus industry. Added food safety requirements in markets and the burden of administration costs for fruit traceability have made the majority of smaller farming units unsustainable [19]. Rising input costs for pests and diseases management and capital costs for investment in storage and climate change management infrastructure using irrigation may increase PHLs. Socio-economic factors such as extension support are provided by the Citrus Growers Association (CGA) and Citrus Research International (CRI), which identifies research priorities aimed at reducing PHLs [1]. The adequacy of the extension remains questionable and hence the persistent high PHLs.
Additionally, increased years of education are significantly associated with reduced chances of incurring PHLs due to the ability to source and process information on managing PHLs [20]. Institutional and technical factors are also causes of PHLs. Another citrus industry challenges are legislative requirements such as environmental laws, labour, water, and skills developments. Noncompliance with these institutional requirements may lead to PHLs on fruit quality and quantity.
Access to government grants and credit enhances farmers’ capacity to adopt PHL management technologies, leading to lower incidences of PHLs. Access to credit facilities also supports climate change management practices as well as disease and pest management due to access to resources. Likewise, increased years of experience in fruit production is associated with methods of Good Agricultural Practices (GAP) and hence less PHLs are likely to be incurred [5,21]. However, an increased farmer age and a progressively higher use of seasonal labour are hypothesized to increase the probability of incurring more PHLSs [22]. Citrus PHLs are also influenced by external preharvest factors such as climatic conditions (wet and windy weather), natural climates such as hailing, high wind velocity, heavy rainfall, fruit morphology, and chemical composition. These are difficult to manage regardless of age, experience, and access to labour [10].
A detailed description of the variables used to explore the determinants of PHLs incurred by farmers is provided in Table 1 below, where five categories of essential variables were included in the model. These variables include a farmer’s socio-economic and technical characteristics, farm-specific, institutional, and external climate change, and weather-related factors.

3. Materials and Methods

3.1. Study Area

The study occurred in the Eastern Cape Province of South Africa, a prime citrus-producing area. The Eastern Cape province is located at 32.2968° S, 26.4194° E, and occupies 168,966 km2 of land, accounting for 13.8% of South Africa’s total land area. The province is situated at an altitude of between 600 and 1600 m as demarcated by the escarpment and thus experiences a mild climate that is suitable for citrus production [23]. Figure 2 shows the study area location.
Rainfall in the province varies between 400 and 1200 mm, with extremes of high precipitation in the mountainous area and subhumid to semiarid conditions in the basin. Agriculture significantly contributes to GDP (17%), food security, and employment [24]. The dominant farming activities include citrus, beef, horticulture, and dairy. This diversity of livelihood options offers a resilience scope for the farmers in the province. Large-scale and complex citrus production is concentrated in Patensie, Eastern Cape Midlands (ECM), and Sundays River Valley (SVR) areas. These produce various citrus fruits and are, therefore, areas of interest to investigate the multiple aspects of citrus PHLs.

3.2. Sampling Procedure

As informed by Roopa and Rani [25], the embedded research approach, with a bias towards quantitative methods, was utilized using the multistage sampling technique. This approach allows for the dissection of information from both the quantitative and qualitative pillars, thus offering in-depth insights into the PHL challenges in the citrus industry. Purposive sampling was initially adopted to select the Eastern Cape Province because the area has a larger scale of citrus fruit production in South Africa and higher incidences of PHLs. This made it a suitable case study for PHL hurdles and the design of possible strategies to address this menace. As supported by the proposition posed by Sanscartier [26], the purposive technique was appropriate since it is more targeted and borrows from the ideology of prior knowledge to identify respondents accurately and quickly. This was based on their ability to adequately respond to the questions of interest, given working experience, contexts, and situations. Stratified random proportionate sampling was then utilized to select the sampling frame of representative citrus farmers from the three regions, namely Patensie, ECM, and SVR. This was appropriate since the areas have different citrus farmers’ compositions, and as Debebe [7] suggested, it was necessary to extract representative proportions from these regions. Randomising the last stage of sampling was essential in selecting the required number of farmers from each area to increase the chances of including any of the citrus farmers from the population in the sample. This probability-based technique is widely used in research due to its easiness of use and its ability to reduce challenges such as researcher bias and self-selection bias which are common challenges that affect the usability of research conclusions and recommendations [25]. The random number generation method was used to identify the respondents.
According to Sikuka and Caldwell [1], the population of registered citrus growers in the Eastern Cape Province is 270. The sample size formula was employed to yield 137 citrus farmers who were then included in the study. Table 2 shows the farmer composition by region and the proportions selected for the sample.
The questionnaire was the main data collection instrument used to get deeper insights into the PHLs, triggering factors, and management practices adopted by the farmers in 2021. The research instrument was divided into four sections: farm-specific characteristics, socio-economic, climate, and institutional factors. The instrument collected data on farm characteristics such as the farm size, the age of the trees, the farmer’s socio-economic attributes, including the age of the farm owner, and the number of years spent in formal education. These data elements were critical in explaining the variations in the PHLs incurred by the farmers [10,12,13]. Additional institutional data, such as access to extension services, markets, and credit facilities, were also collected from the farmers to reinforce the earlier mentioned clusters of factors. The questionnaire and the yield variable also captured the different dimensions of PHLs, including the actual amount lost, PHL management practices, e.g., pruning, and the number of PHL causes experienced by the farmers. To ensure that the questionnaire was valid and reliable, it was pretested on farmers who were not part of the final sample. Primary data from citrus farmers were captured in the STATA 15 program, cleaned, coded, and analysed. The University of the Free State granted ethical clearance.

3.3. Data Analysis

3.3.1. Estimating PHLs

The study focused on farm-level citrus producing units since they form the core of most decision-making processes around allocating resources, income generation potential, and losses along the value chain cycle. This process made individual farms the most appropriate level of analysis for PHLs and the associated drivers.
This study identified and scored the PHL dimensions as reported by the farmers to get insights into how farmers’ contexts affected the extent of the PHLs. The PHL for the citrus crop was computed as a summation of the sorting, picking, mechanical, and secondary spoilage dimensions to generate a PHL score (PHLS) as the dependent variable. The study also computed several PHL indicators, which further provided a picture of the status among farmers. The Simpson’s diversity index (SDI) was estimated using Equation (2). Alternative measures such as the Shannon diversity index in Equation (3) have been used. The computation of the Shannon index was compromised by the dominance of zeros in the dataset and not done in the study. The TPHL (as a continuous measure in %), is the total PHL which was computed as Equation (4) and is closely related to the PHLS depicted as N in Equation (2). A weighted postharvest loss index (WPHLI) presented in Equation (5) illustrates the relationship between the yield and the PHLs encountered by the farmers. Table 3 shows a summary of equations and indicators.
A zero-inflated Poisson (ZIP) empirical model was used to identify factors affecting the exposure to different PHL dimensions among citrus farmers in the Eastern Cape Province of South Africa. Several authors have successfully used this method in various contexts, such as Cheung [27] and Fávero et al. [28]. Since this is a variant of the generic Poisson model, the response variable is also a count variable, and the subjects were observed over the same period. However, the assumption that the variance of the response variable is relatively close to the mean of the response variable does not necessarily hold. Table 4 summarizes the mean and variance for the total sample and the subsample of nonzero values.
The mean (0.3577) was different from the variance (0.793), and there was possible overdispersion in the data. The procedure was repeated with the nonzero values, and the mean (0.614) was not significantly different from the variance (0.719). The study then plotted a conditional histogram in Figure 3, separated by PHLS to show the distribution. As a starting point, we examined the histogram to try to gauge if the number of zeroes was adequately excessive. The number of zeroes was disproportionate, as shown in Figure 3, where PHLS indicated an extremely right-skewed distribution with a spike at zero.
It is evident that the number of zeroes was highly inflated, and the number of farmers with “0” PHLS could not be adequately explained in the same manner as the number of farmers with more than “0” PHLS. As such, the standard Poisson model would not distinguish between the two processes causing an excessive number of zeroes. Payne et al. [29] reported that alternative models included the ordered probit or logit models, which were usable after transforming the outcome variable (PHLS) into a categorical variable. Alternatively, an OLS regression could have been utilized, but the count data were highly nonnormal and were not well estimated by an OLS regression. Abate and Addis [30] also reported that count outcome variables were sometimes log-transformed and analysed using an OLS regression. A fundamental challenge is encountered if this is done, especially the loss of data due to undefined values generated by taking the log of zero (which is undefined) [31].
Additionally, the results also showed high incidences of biased estimates. Hurdle models have also been widely used. Their major flaw is an assumption that there is only one process by which a zero can be produced, as opposed to zero-inflated models, which assume that two distinctive processes can produce a zero.
A ZIP model was more appropriate since it allowed for and accounted for the complication of excessive zeros. Zero-inflated models were preferred over zero-altered models since we assumed zeroes were produced both from the zero-inflation process and the count process. The number of PHL dimensions (PHLS) experienced by the farmer, which is a count, was used as the outcome. Socio-economic factors (e.g., age, experience, education) and institutional arrangements (e.g., access to credit and extension) were used. Technical characteristics (e.g., cultivar used, irrigation system used) and external factors (e.g., tree age, government support, climate-induced curling factors, pests, and diseases) were included as the determinants [16,21].

3.3.2. Empirical Modelling

Since the study was interested in explaining the likelihood that the farmer will be exposed to more PHL dimensions, the ZIP model was used. The dependent variable of the model, Y, is the count number of PHL dimensions experienced by the citrus farmers. Guided by Cameron and Trivedi [32], the study used robust standard errors for the parameter estimates to control for a mild violation of the distribution assumption (or equidispersion assumption) that the variance equals the mean. According to Hardin and Hilbe [33], the generic regression model applied to count data may be described through Equation (6):
ln   Y ^ i   = ln   λ i   = β 0   +   β 1 X 1 i   +   β 2 X 2 i   +   β 3 X 3 i   +     +   β k X k i )   j = 1 , 2 , 3    
where λ i represents the expected number of occurrences (or the incidence rate ratio—IRR) of the phenomenon under study for a given exposure (i.e., a fixed interval of time in which a particular number of events is registered), β 0 is the intercept, the coefficients estimated for each predictor variable X j   are represented by β j , and i represents each observation in the sample.
The Poisson regression model assumes that the expected value (mean) of the Poisson distribution should be equal to its variance. This captures nonnegative data’s inherent heteroscedasticity and skewed distribution [34]. The process of selecting the ZIP model is outlined in Figure 4 below.
Thus, a goodness-of-fit test was conducted to test whether the Poisson regression model fit the data well [32]. Based on this goodness-of-fit test, it was noted the chi-square values for both the deviance and Pearson’s statistic were above 0.05; hence, it was appropriate to make statistical inferences based on the Poisson regression model. As a result, there was no justification for running the negative binomial regression model. Concurrently, the Wald chi-squared value was insignificant, showing the overall insignificance of the Poisson regression model. The zero-inflated Poisson (ZIP) model was therefore estimated using the maximum likelihood estimation (MLE) procedure since it is a nonlinear model. In this study, the coefficients of marginal effects were interpreted to show the proportionate change in the conditional mean if the kth explanatory variable changes by one unit. Guided by Figure 4, the study followed path 1 of the flowchart since the data did not detect overdispersion (see Table 4). A detailed procedure is outlined below.
Based on the plot in Figure 3 and the procedure results above, there may be a zero-inflation issue for these count outcomes. The study used the Poisson regression model in Equation (7) as the starting model to formally test if it was indeed the case.
y i | x i ~ Poisson μ i ,   μ i = exp   β 0 + β 1 X 1 i + β 2 X 2 i + β 3 X 3 i + + β k X k i
To achieve this, the study considered an independent sample x i ,   y i ,   i = 1   ,   ,   n where y i   is a count response (PHLS), x i   is a vector of explanatory variables (see Table 1), and μ i is the error term. Under a Poisson log-linear regression model, the study assumed that the logarithm of the mean response was a linear combination of the covariates as presented in Equation (8):
y i x i ~     i . d .   Poisson μ i ,   log μ i = x i β
The study acknowledged that the ZIP regression was formally used to address violations such as overdispersion and biased inference [29]. The ZIP model shown in Equation (9) was utilized:
y i x i ~     i . d .   ZIP ρ i , μ i , logit ρ i = u i β u ,   log μ i = v i β v        
More specifically, the model was expressed in detail as in Equation (10). We opted for the standard logit since this generated a better fit and was convenient when calculating the odds ratios (OR):
Y i ~ ZIP ρ i ,   μ i ,   probit ρ i = β 0 + β 1 Age i + β 2 Gender + β 3 Education +   β 4 Marital   status   + β 5 Experience +   β 6 Farm   size +   β 7 Extension +   β 8 Cultivar +   β 9 Tree   age +   β 10 Governement support +   β 11 Credit +   β 12 Culling +   β 13 Challenge +   β 14 Pruning +   β 15 Yield +   β 16 Irrigation   + β 17 Tenure +   β 18 Labour + μ i
When selecting the explanatory variables for the two models, the study was guided by Hall and Zhang [35], who recognized that the covariates in the two components may be different but can also have overlaps. As such, some of the covariates in the first (count) model were excluded from the second (logit) model. The study then used the “countif()” command in Stata 15 to test across all possible count models, and the ZIP model was the preferred model since it fitted the data better. Vuong test was also used to test the benefits of using ZIP over the generic Poisson model by letting f 1 ( y i | θ 1 )   and   f 2 ( y i | θ 2 ) denote the probability distribution functions of the two models. The test compared the likelihood functions, at the maximum likelihood estimator (MLE), between the two models, as shown in Equation (11):
i = 1 n [ log ( f 1 ( y i | θ 1 * ) )     log ( f 2 ( y i | θ 2 * ) ) ]   = i = 1 n log f 1 ( y i | θ 1 * ) f 2 ( y i | θ 2 * )  
The Vuong test proposed by Shi [36] was then used to compare f 1 and   f 2 as defined by the following statistic and associated asymptotic standard normal distribution in Equation (12).
V = n g ¯ s g   ~   AN 0 , 1          
The study noted that, because of the symmetry of the two competing models, the test was nondirectional. The Vuong test of ZIP vs. standard Poisson results showed p < 0.05 (Vuong test of ZIP vs. standard Poisson: z = 3.15 Pr > z = 0.0008), which was interpreted to mean that the ZIP model was preferable to the generic Poisson model. The Akaike’s information criterion (AIC) and Bayesian information criterion (BIC) were also used to validate this conclusion, and the results are shown in Table 5 below.
The ZIP model had smaller AIC and BIC values; thus, the study concluded that it fitted the data better than the standard Poisson model. After finishing the model selection, the study estimated the incidence risk ratio (IRR) for count model and the odds ratio (OR) for the logit model. This study generated and interpreted these as an attempt to measure the magnitude by which an independent variable affected the movement from low PHLS (0) to high PHLS (4). The IRR is defined as the total number of events divided by the risk of the event happening one time [34]. In most instances, the OR represents the comparison of the odds that an outcome will occur given a particular exposure with the odds that an outcome will occur without the same exposure [33]. If the IRR and OR are larger than 1, it implies that the event has a higher probability of happening than the control group; otherwise, the event is less likely to occur than the control group when IRR and OR are smaller than 1. However, the study’s goal was to reduce or mitigate PHLS. As such, the findings from this study will help to understand the factors influencing the likelihood of incurring high PHLs and then infer what can be done to reduce and mitigate the PHLs in citrus production.

4. Results

4.1. Socio-Economic Characteristics

Results from the empirical data analysis’ descriptive statistics such as means (and standard deviations) or frequencies (and percentages) for the variables are presented in Table 6. Socio-economic factors and farm-specific characteristics showed that, on average, farmers had 16 years of experience in citrus production, and citrus trees were 52 years of age. On average, the citrus farmers incurred PHLs of about 4.1% from an average yield of 51 (tonnes) on 63 hectares of land.
Most of the interviewed farmers were from male-headed households (84%) with at least secondary education (64%). Results also showed that most farmers (93%) experienced at least one type of PHLs such as sorting, picking, mechanical, and secondary losses. Furthermore, on other socio-economic characteristics, 75% of farmers employed mostly non-permanent labour and grew mainly Nova cultivar (45%) primarily using their land (53%), particularly utilizing sprinkler irrigation type (47%) with access to credit (54%). A significantly large proportion of the farmers (37%) were single, and (40%) had moderate access to extension services, while most (74%) practiced pruning at their farms. Table 7 shows the interaction of PHL curling factors, the cultivar, and Simpson’s index clusters.
The study obtained the three-way table with cultivar, PHL diversity, and postharvest curling factors. The curling factors were closely related to the study area’s weather and climate change conditions. Results showed that the Cara Cara cultivar generally had low (0.74–1.46) representation in the low PHL diversity cluster, followed by the Navel cultivar, and lemons then the Nova cultivar, which had a diverse distribution across the three groups of PHL diversity among the citrus farming households.

4.2. ZIP Regression Results

The variables which influenced the number and types of PHLs experienced by the citrus farmers are summarized in Table 8 below. A two-step analysis approach was used to trim the variables for inclusion in the final model; climate change and weather-related variables such as challenges (pests and diseases) and the curling factors were eliminated during the first step and were excluded from further analysis. The study estimated the incidence rate ratios (IRRs) and OR for the independent variables and incorporated the coefficients into the interpretations. The ZIP regression results showed that the average number of PHLs for married farmers was 0.185 times that of the single farmers. Since the value was less than one, married farmers had a lower chance of encountering higher PHLs than the reference group of single farmers. This observation can be attributed to the possibility of networking among married farmers within well-established social structures. It was also noted that an array of factors, including the position of these value chain actors along the perishable supply chain, product seasonality, and technology affordability, also positively influenced the adoption decision.
Based on the IRR analysis, the results from the ZIP model showed that the farmers who leased land were more exposed to PHLs by a factor of 5.666 relative to those who owned land. The results showed that the exposure to PHLs also increased 5.371 times for those farmers who used sprinkler irrigation compared to the more innovative drip irrigation users. The principal causing agent could be the nature of irrigating with drip irrigation which is more efficient and reduces water contact with the crop’s fruits, stems, and leaves. Results further showed that access to credit reduced the chances of PHL 0.119 times while practicing best practices such as pruning reduced PHL incidences by a factor of 4.322. The type of labour used had a bearing on the magnitude of PHL dimensions, with farmers using seasonal and causal labour encountering higher PHLs in the extent of 3.562 and 4.784 times as opposed to those who used permanent labour, respectively. The same pattern was observed for those farmers who always utilized extension moderately and were exposed to higher incidences of PHLs by factors of 0.317 and 0.021, respectively.
Interestingly, the chances of encountering higher PHLs in farmers with lower education levels (secondary and primary education) compared to those with tertiary education increased by 0.181 and 0.148, respectively. Results from Table 2 show that the market use patterns affected the chances of experiencing PHLs, with citrus producers who accessed reliable markets “frequently” and ”always” being less exposed to PHLs by magnitudes of 2.639 and 8.914 more than those who had no access to reliable markets. Relative to the common Nova cultivar, lemon producers were more exposed to PHLs by 4.759 times. This meant that farmers growing these preferred and well-supported cultivars were less likely to incur high percentages of PHLs in citrus production than their counterparts. The OR values reported from the logit model for yield, extension, age, and experience were lower. For this cluster of variables, farmers from the test groups were less likely to encounter higher PHLs than those in the reference groups. The reported OR values were relatively higher in the case of limited access to credit, cultivar, and tree age. This implied that for these variables, farmers from the test groups were more likely to encounter higher PHL dimensions than their counterparts in the reference groups.

5. Discussion

Based on the results presented in Table 7, climate change and weather conditions can affect the PHLs. Notable drivers are creasing, red scale, wind damage, long stem, thrip damage, and minor injuries. Citrus fruit creasing (cracking) is a preharvest physiological disorder that causes significant economic losses. It is caused not only by genetic factors but also by environmental factors (light, temperature, humidity, mineral nutrition, and plant growth regulators). Reddy et al. [15] reported that citrus fruit creasing was affected by the highest and lowest temperatures but not by the average temperature. Sudden changes in the relative humidity during the fruit colouring period will also result in fruit creasing [3]. Therefore, proper water management could effectively reduce the fruit creasing rate by not allowing trees to suffer severe water stress.
The red scale also affects PHLs prevalence. Therefore, the timing of fruit treatments that coincide with crawler production can be beneficial during the colder months in the cool production regions. Wind stress can also reduce the growth rate and yield, visible in fewer or no fruit on the side of the tree exposed to wind [12]. Later in the season, young fruit is most prone to wind damage, and transverse and diagonal greyish scars become visible across the skin. If the wind is frequent and intense, a large percentage of the citrus harvest may be qualitatively downgraded or rejected. Specifically, dry winds can damage trees through leaf fall, windburn, and scorch, inevitably resulting in leaves dying and fruit scarring [11]. Pruning is also a critical preharvest practice with effects on PHLs. Therefore, regular pruning of trees is essential as this improves airflow in the canopy, which ultimately reduces the duration of wetness and PHLs [14].
From Table 8, the effect of land tenure can be attributed to how property rights motivate investments in PHL management innovations at the farm. This shows that PHLs can be reduced if policies that clearly define property rights are implemented. Policy formulation approaches will have to go beyond the formalized channels and acknowledge the role of social bonds, structures, and the role of indigenous knowledge practices in land reallocation decisions. Kehinde et al. [37] concurred and also suggested that targeted policy interventions must be designed to enhance access to land by clearly redefining land ownership rights and improving investment and research in PH technologies to reduce losses.
The irrigation systems are also reported as necessary in supporting the adoption of PHL-reducing innovations while focusing on best agricultural practices such as well-timed irrigation schedules and pruning. Mukarumbwa et al. [10] reported that investment in innovative irrigation systems needed to be supported by incentives for using low-cost technology to reduce PHLs. This should also be hinged on a policy direction supporting start-up agribusinesses involved in irrigation systems design to provide low-cost and appropriate technologies. The catalytic effects of the type of labour used at the farm emanate from the observation that the reliability of labour remains a critical PHL determining factor in the citrus industry, given the nature of the supply chain cycles, which are sensitive to labour shortages. Given that labour orientations have not widely been explored in the realm of PHL, especially in the citrus industry, this study makes significant contributions to this body of knowledge. Reddy et al. [15] alluded that labour-related PHLs were listed as a main challenge in citrus plantations and suggested the need for innovative technologies which reduce labour intensity and increase labour productivity.
The findings also showed that the current extension models in South Africa’s Eastern Cape province did not adequately accommodate labour-sensitive PHL management. Closely related to these interactions, it can also be derived from the study findings that farmers with the highest level of education were most likely to have been trained on specific techniques to reduce PHLs, as opposed to what was reported with the extension variable. A similar pattern was observed by Ngowi and Selejio [6], who also noted the need for tailor-made functional and technical capacity-building programs along the citrus value chain activities as a possible strategy to support the relevance of training initiatives. Education becomes an immediate catalyst for adopting innovative approaches to managing PHLs. As such, there is a need for a policy that accommodates citrus production in the curriculum from the primary level.
The influence of market access shows that pre- and postharvest management practices are essential for citrus fruits to be supplied to the market in compliance with quality standards. Since markets are centralized in the study area, this makes it difficult for farmers to access them while at the same time managing transaction costs. Dodd et al. [12] reported that there were high PHLs of citrus fruits mainly due to a lack of market access and market information among primary producers who largely depend on small producers’ associations in their localities. From a policy and operational perspective, this has pushed other individual stakeholders out of the mainstream citrus fruits supply chain functions due to perceived low long-term returns. The cultivar differences and their influence were also reported by Mashau et al. [2]. They noted that a high PHL loss in the citrus systems due to cultivar selection left farmers with fewer options to deal with risks of increasingly high PH management costs associated with the common cultivars such as Navel.
The OR value differentials for access to credit, cultivar, and tree age implied that the major drawback was the PHLs which accounted for over 60% of the losses. These losses were triggered by different social (cultivar selection), agroecological (climate), institutional (credit), and economic (yield) constraints, which eroded the farms’ endowment and adaption to the cultivation of citrus fruits. Climatic conditions and recent changes have also negatively affected the appropriateness of cultivars such as Navels in traditionally productive areas [11]. With limited capacity to regenerate the plantations, the farmers remain locked in the traditional cultivars, albeit increasing their exposure to PHLs. Kantaroğlu and Demirbaş [14] also noted that the citrus production business had lost momentum through limited support from governmental and nongovernmental organizations. This has occurred mainly in secondary supply chain functions such as credit for investing in PHL management infrastructure such as irrigation and storage facilities [38]. To cushion against these inherent risks in the citrus fruits industry, producers must design mechanisms that embrace a blend of practices anchored on self-sustaining credit schemes and an appropriate selection of cultivars.

6. Conclusions

The ZIP regression model indicated that social (e.g., education, age), economic (e.g., yield), institutional (e.g., access to markets, credit, extension) and farm specific (e.g., pruning, cultivar, irrigation) factors determined the magnitude of exposure to PHLs. In this context, it is recommended to reconfigure policies and raise the capacity to reduce the impacts of PHLs on the local and national economy. To achieve this, a tailored capacity building on good agricultural practices in citrus production, harvesting, and postharvest handling can help to reduce PHLs through the extension pillar. The production of Nova and Navel cultivars should be promoted by making these cultivars accessible and affordable for small-scale citrus farmers. Given that irrigation plays a role in PHLs, investment programs to support water-efficient drip irrigation systems need to be initiated to reduce the chances of incurring high levels of weather-related and climate-change-induced PHLs. The study’s limitations can be reduced by using a large sample size across different production regions and carrying out a comparative analysis of PHL driving factors that directly measure weather and climate change variables. This approach can also be done using panel data to support generalization and applicability over regions and time. Further comparative research may be conducted using other areas with different climatic conditions to determine whether factors causing PHLs vary across these locations.

Author Contributions

All authors significantly contributed to the present manuscript preparation. S.N. was involved in data collection; J.P.M. executed the analysis and wrote the first draft; Y.T.B. and A.A.O. were the first author’s supervisors and aided in the study design and conceptualization, review, and writing the final draft. All authors have read and agreed to the published version of the manuscript.

Funding

This research received no external funding.

Institutional Review Board Statement

The study was conducted in accordance with the University of the Free State Research Ethics Committee policy requirements and a clearance certificate with reference number UFS-HSD2020/0378/0409 was granted.

Data Availability Statement

Data will be available on request from the corresponding author (J.P.M.).

Acknowledgments

The authors acknowledge and thank the anonymous reviewers for their valuable comments and suggestions.

Conflicts of Interest

The authors declare no conflict of interest.

Abbreviations

AICThe Akaike’s information criterion
BICBayesian information criterion
CGACitrus Growers Association
CRICitrus Research International
ECMEastern Cape Midlands
GAPGood Agricultural Practices
GDPGross domestic product
GAINGlobal Agricultural Information Network
IRRIncidence risk ratio
MLEMaximum likelihood estimation
OLSOrdinary least squares
OROdds ratio
PHLPostharvest loss
PHLSPostharvest loss score
SDISimpson’s diversity index
SRVSundays River Valley
SSIShannon index
TPHLTotal postharvest loss
USDAUnited States Department of Agriculture
WPHLIWeighted postharvest loss index
ZIPZero-inflated Poisson

References

  1. Sikuka, W.; Caldwell, A. Citrus Annual. United States Department of Agriculture (USDA) and Global Agricultural Information Network (GAIN). Available online: https://apps.fas.usda.gov/newgainapi/api/Report/DownloadReportByFileName?fileName=Citrus%20Annual_Pretoria_South%20Africa%20-%20Republic%20of_12-15-2021.pdf (accessed on 19 April 2022).
  2. Mashau, M.E.; Moyane, J.N.; Jideani, I.A. Assessment of postharvest losses of fruits at Tshakhuma fruit market in Limpopo Province, South Africa. Afr. J. Agric. Res. 2012, 7, 4145–4150. [Google Scholar] [CrossRef]
  3. Hussein, Z.; Fawole, O.A.; Opara, U.L. Harvest and postharvest factors affecting bruise damage of fresh fruits. Hortic. Plant J. 2019, 6, 1–13. [Google Scholar] [CrossRef]
  4. Affognon, H.; Mutungi, C.; Sanginga, P.; Borgemeister, C. Unpacking postharvest losses in sub-Saharan Africa: A meta-analysis. World Dev. 2015, 66, 49–68. [Google Scholar] [CrossRef] [Green Version]
  5. Ndaka, D.; Macharia, I.; Mutungi, C.; Affognon, H. Postharvest Losses in Africa-Analytical Review and Synthesis: The Case of Kenya; Technical Report; International Centre of Insect Physiology and Ecology (ICIPE): Nairobi, Kenya, 2012. [Google Scholar]
  6. Ngowi, E.R.; Selejio, O. Postharvest loss and adoption of improved postharvest storage technologies by smallholder maize farmers in Tanzania. Afr. J. Econ. Rev. 2019, 7, 249–267. [Google Scholar]
  7. Debebe, S. Postharvest losses of crops and its determinants in Ethiopia: Tobit model analysis. Agric. Food Secur. 2022, 11, 13. [Google Scholar] [CrossRef]
  8. Baker, G.A.; Gray, L.C.; Harwood, M.J.; Osland, T.J.; Tooley, J.B.C. On-farm food loss in northern and central California: Results of field survey measurements. Resour. Conserv. Recycl. 2019, 149, 541–549. [Google Scholar] [CrossRef]
  9. Stathers, T.; Holcroft, D.; Kitinoja, L.; Mvumi, B.M.; English, A.; Omotilewa, O.; Kocher, M.; Ault, J.; Torero, M. A scoping review of interventions for crop postharvest loss reduction in sub-Saharan Africa and South Asia. Nat. Sustain. 2020, 3, 821–835. [Google Scholar] [CrossRef]
  10. Mukarumbwa, P.; Mushunje, A.; Taruvinga, A.; Akinyemi, B.; Ngarava, S. Factors influencing number of post-harvest practices adopted by smallholder vegetable farmers in Mashonaland East Province of Zimbabwe. Int. J. Sustain. 2017, 6, 1774–1790. [Google Scholar]
  11. Kaminski, J.; Christiaensen, L. Post-harvest loss in sub-Saharan Africa. What do farmers say? Glob. Food Secur. 2014, 3, 149–158. [Google Scholar] [CrossRef] [Green Version]
  12. Dodd, M.; Cronje, P.; Taylor, M.; Huysamer, M.; Kruger, F.; Lotz, E.; van der Merwe, K. A review of the postharvest handling of fruits in South Africa over the past twenty-five years. S. Afr. J. Plant Soil 2010, 27, 97–116. [Google Scholar] [CrossRef] [Green Version]
  13. Kikulwe, E.M.; Okurut, S.; Ajambo, S.; Nowakunda, K.; Stoian, D.; Naziri, D. Postharvest losses, and their determinants: A challenge to creating a sustainable cooking Banana value chain in Uganda. Sustainability 2018, 10, 2381. [Google Scholar] [CrossRef] [Green Version]
  14. Kantaroğlu, M.; Demirbaş, N. Technical and economic factors affecting losses in sweet cherry production: A case study from Turkey. Int. J. Fruit Sci. 2020, 20 (Suppl. 3), 1994–2004. [Google Scholar] [CrossRef]
  15. Reddy, V.B.; Madhavi, G.B.; Reddy, V.C.; Reddy, K.G.; Reddy, M.C. Postharvest fungal spoilage in sweet orange (citrus sinensis) and acid lime (citrus aurentifolia swingla) at different stages of marketing. Agric. Sci. Dig. 2018, 28, 265–267. [Google Scholar]
  16. Bundi, A.; Mburu, J.; Mbogoh, S.G.; Ambuko, J.L. Factors influencing the adoption of pre-harvest practices among mango farmers in Embu and Machakos counties, Kenya. Int. J. Postharvest Technol. Innov. 2020, 7, 56–72. [Google Scholar] [CrossRef]
  17. Arah, I.K.; Harrison, A.; Kumah, E.K.; Ofori, H. Preharvest and postharvest factors affecting quality and shelf life of harvested tomatoes: A mini review. Int. J. Agron. 2015, 2015, 478041. [Google Scholar] [CrossRef] [Green Version]
  18. Kahramanoglu, I. Trends in pomegranate sector: Production, postharvest handling, and marketing. Int. J. Agric. For. Life Sci. 2019, 3, 239–246. [Google Scholar]
  19. Shee, A.; Mayanja, S.; Simba, E.; Stathers, T.; Bechoff, A.; Bennett, B. Determinants of postharvest losses along smallholder producers’ maize and Sweetpotato value chains: An ordered Probit analysis. Food Secur. 2019, 11, 1101–1120. [Google Scholar] [CrossRef] [Green Version]
  20. Gitonga, Z.; De Groote, H.; Tefera, T. Metal silo grain storage technology and household food security in Kenya. J. Dev. Agric. Econ. 2015, 7, 222–230. [Google Scholar]
  21. Ali, D.A.; Deininger, K.; Duponchel, M. Credit constraints and agricultural productivity: Evidence from rural Rwanda. J. Dev. Stud. 2014, 50, 649–665. [Google Scholar] [CrossRef] [Green Version]
  22. Sawicka, B. Post-harvest losses of agricultural produce. Sustain. Dev. 2019, 1, 1–16. [Google Scholar]
  23. Statistics South Africa (Stats SA). Provincial Profile: Eastern Cape Community Survey 2016; Report 03-01-08; Statistics South Africa: Pretoria, South Africa, 2018. Available online: https://cs2016.statssa.gov.za/wp-content/uploads/2018/07/EasternCape.pdf (accessed on 16 April 2022).
  24. Statistics South Africa (Stats SA). The Extent of Food Security in South Africa; Statistics South Africa: Pretoria, South Africa, 2019. Available online: http://www.statssa.gov.za/ (accessed on 20 May 2022).
  25. Roopa, S.; Rani, M.S. Questionnaire designing for a survey. J. Indian Orthod. Soc. 2012, 46, 37–41. [Google Scholar] [CrossRef]
  26. Sanscartier, M.D. The craft attitude: Navigating mess in mixed methods research. J. Mix. Methods Res. 2020, 14, 47–62. [Google Scholar] [CrossRef]
  27. Cheung, Y.B. Zero-inflated models for regression analysis of count data: A study of growth and development. Stat. Med. 2002, 21, 1461–1469. [Google Scholar] [CrossRef] [PubMed]
  28. Fávero, L.P.L.; Belfiore, P.; Dos Santos, M.A.; Souza, R.F. Overdisp: A Stata (and Mata) package for direct detection of overdispersion in Poisson and Negative Binomial Regression Models. Stat. Optim. Inf. Comput. 2020, 8, 773–789. [Google Scholar] [CrossRef]
  29. Payne, E.H.; Gebregziabher, M.; Hardin, J.W.; Ramakrishnan, V.; Egede, L.E. An empirical approach to determine a threshold for assessing overdispersion in Poisson and negative binomial models for count data. Commun. Stat. Simul. Comput. 2018, 47, 1722–1738. [Google Scholar] [CrossRef]
  30. Abate, D.; Addis, Y. Factors affecting the intensity of market participation of smallholder sheep producers in northern Ethiopia: Poisson regression approach. Cogent Food Agric. 2021, 7, 1874154. [Google Scholar] [CrossRef]
  31. Lambert, D. Zero-inflated Poisson regression, with an application to defects in manufacturing. Technometrics 1998, 34, 1–14. [Google Scholar] [CrossRef]
  32. Cameron, C.; Trivedi, P. Micro-Econometrics: Methods and Application; Cambridge University Press: New York, NY, USA, 2005; pp. 9–11. [Google Scholar]
  33. Hardin, J.W.; Hilbe, J.M. Regression models for count data from truncated distributions. Stata J. 2015, 15, 226–246. [Google Scholar] [CrossRef] [Green Version]
  34. Desmarais, B.A.; Harden, J.J. Testing for zero inflation in count models: Bias correction for the Vuong test. Stata J. 2013, 13, 810–835. [Google Scholar] [CrossRef] [Green Version]
  35. Hall, D.B.; Zhang, Z. Marginal models for zero inflated clustered data. STAT Model 2004, 4, 161–180. [Google Scholar] [CrossRef] [Green Version]
  36. Shi, X. A nondegenerate Vuong test. Quant. Econ. 2015, 6, 85–121. [Google Scholar] [CrossRef] [Green Version]
  37. Kehinde, M.O.; Shittu, A.M.; Adewuyi, S.A.; Osunsina, I.O.O.; Adeyonu, A.G. Land tenure and property rights, and household food security among rice farmers in Northern Nigeria. Heliyon 2021, 7, e06110. [Google Scholar] [CrossRef] [PubMed]
  38. Rachoń, L.; Bobryk-Mamczarz, A.; Szumiło, G. Mycotoxin contamination of grain of selected winter wheat genotypes. Pol. J. Agron. 2016, 25, 13–18. [Google Scholar]
Figure 1. A conceptual model of citrus PHL exposure in South Africa. Source: authors’ compilation.
Agriculture 12 01651 g001
Figure 2. Map showing Eastern Cape Province and the sampled municipalities. Source: Stats SA [23], The map was developed by the authors with the help of GIS experts.
Agriculture 12 01651 g002
Figure 3. Frequency plot of the response variable PHL. Source: authors’ compilation.
Agriculture 12 01651 g003
Figure 4. Count regression model selection flowchart. Source: authors’ compilation.
Agriculture 12 01651 g004
Table 1. Description of variables included in the model.
VariableVariable Description
Dependent
PHLSA summed measure of PHLs (calculated in Equation (5)).
Independent
AgeA continuous variable representing the age of the farmer.
FarmEA continuous variable showing the experience of the farmer in citrus production in years
FarmSA continuous variable showing the farm size in hectares
Tree ageA continuous variable representing the age of a tree in years
YieldA continuous variable showing the average yield for the farm in tonnes
GenderGender of the respondent is a categorical variable representing sex of the farmer (0 = Female, Male = 1)
EducationA categorical variable showing the level of education attained by the respondent (1 = Tertiary, 2 = Secondary, 3 = Primary, 4 = No education)
MaritalA categorical variable representing the marital status of the respondent (1 = Single, 2 = Married, 3 = Widow, 4 = Other)
ExtensionA categorical variable showing access to extension services agents (0 = None, 1 = Seldom, 2 = Moderate, 4 = Always)
CultivarA categorical variable showing the citrus tree cultivar grown by the farmer (1 = Novas, 2 = Navels, 3 = Cara Cara, 4 = Lemons)
GovernmentA dummy variable showing access to government support (0 = No, 1 = Yes)
CreditA dummy variable showing access to credit (0 = No, 1 = Yes)
CurlingA categorical variable showing the major postharvest curling factors related to weather and climate change as experienced at the farm (1 = Minor injury, 2 = Wind damage, 3 = Long stem, 4 = Red scale, 5 = Creasing, 6 = Thrip damage)
ChallengeA categorical variable showing the major constraining factors faced by the farmer (1 = High costs, 2 = Pests and diseases, 3 = Lack of reliable markets)
PruningA categorical variable showing whether the farmer practices pruning (0 = No, 1 = Yes)
IrrigationA categorical variable showing the type of irrigation system used at the farm for managing weather induced losses (1 = Drip, 2 = Sprinkler, 3 = Flood)
TenureA categorical variable showing the type of land tenure (1 = Own, 2 = Lease, 3 = Communal, 4 = Other)
LabourA categorical variable showing the type of labour available at the farm (1 = Permanent, 2 = Seasonal, 3 = Casual)
Source: authors’ compilation.
Table 2. Farmer composition by region.
Farmers LocationNo. of FarmersShare of Farmers (%)No. in Sample
ECM401522
Patensie903345
SRV1405270
Total270100137
Source: authors’ compilation.
Table 3. Summary of equations for indicators used in the analysis.
EquationNarration and Sources
SDI = 1     i = 1 n n i n i     1 N N     1     1 Simpson’s diversity index (SDI): n i   is the contribution of each PHL dimension; N is the total postharvest loss for the farmer. Simpson’s index was used to estimate the diversity of the PHL dimensions in the sampled farming communities. The value of the index determines the extent of prevalence for different PHL dimensions in the farming community and how evenly distributed the population of each dimension is.
SI = i = 1 n P i ln P i     2 Shannon index (SI): n is the number of PHL dimensions and P i is the occurrence of each of the PHL dimensions. The Shannon diversity index determines the extent of PHL dimensions diversity in the farming community. The index is closely related to the number of PHL dimensions and the evenness of their occurrence.
TPHL = i = 1 n P i   +   G i   +   H i   +   S i   3 Total postharvest loss (TPHL): this is a continuous variable where   P i ,   G i , H i , and S i are the PHLs (as percentages) due to picking, grading, handling, and secondary spoilage, respectively.
  PHLS   ( 4 ) These were the four dimensions of PHLs experienced by farmers, equal to sorting loss + picking loss + mechanical loss. Thus, 0 means no PHLs were encountered, while 1, 2, 3, and 4 indicate a farmer experienced 1, 2, 3, and 4 types of these PHLs, respectively. This was used as the count variable in the regression models.
WPHLI = TPHL TH     5 TPHL is the total PHLs and TH is the total harvest. WTPHLI is a measure of the total loss due to postharvest management practices relative to the total yield at the farm. It shows the magnitude of the PHLs and how they compromise the net marketable yield.
Source: authors’ compilation.
Table 4. A summary of mean and variance for PHLS.
VariableMeanVarianceDifference Factor
PHLStotal0.35770.79391%
PHLSnon-zeros0.6140.71914.6%
Source: authors’ compilation.
Table 5. AIC and BIC results for ZIP and Poisson models.
Modelll (Null)ll (Model)dfAICBIC
Poisson−114.8647−87.975528231.951313.711
ZIP−106.1129−76.1284534220.257294.536
Source: authors’ compilation.
Table 6. Descriptive statistics for independent and dependent variables (n = 137).
Continuous Variables
VariableMeanSDMinMax
Experience16.1027.059534
Age51.9718.8952965
Tree age17.8916.588531
Yield51.33617.0371374
Land size62.99042.18110.09215.78
Loss total4.1431.191060
Categorical variables
VariableFrequencyPercentage
PHLS
010576.64
12216.06
264.38
310.73
432.19
Gender
Male11583.94
Female2216.06
Marital status
Single5036.50
Married2518.25
Widow2719.71
Other3525.55
Land tenure
Own7252.55
Lease3626.28
Communal2014.60
Other96.57
Irrigation
Drip5842.34
Sprinkler6446.72
Flood1510.95
Labour
Permanent3424.82
Seasonal5540.15
Casual4835.04
Extension
None2316.79
Seldom3122.63
Moderate5540.15
Always2820.44
Market access
Seldom3324.09
Frequent9770.80
Always75.11
Education
Tertiary5439.42
Secondary3424.82
Primary2518.25
None2417.52
Credit access
Yes7454.01
No6345.99
Pruning
Yes10173.72
No3626.28
Cultivar
Novas 6245.26
Navels3021.90
Cara Cara85.84
Lemons3727.01
Curling
Minor injury3122.62
Wind damage3324.09
Long stem139.49
Red scale2820.44
Creasing1712.41
Thrip damage1510.95
Challenge
High costs 6144.53
Pests and diseases4532.85
Lack of reliable markets3122.63
Source: authors’ compilation.
Table 7. PHL dimensions (%) in the four cultivars according to Simpson’s index.
CultivarCurling FactorsSimpson’s Index ClusterNovasNavelsCara CaraLemons
Postharvest curling factors * Postharvest loss diversity clusterMinor injury10.73---
22.190.73-0.73
33.651.461.464.38
Wind damage12.92---
22.191.46-5.84
36.576.571.462.19
Long stem1----
25.111.46-0.73
32.921.460.730.73
Red scale10.73---
2---1.46
32.921.46-4.38
Creasing11.46---
23.650.73--
32.9230.735.11
Thrip damage1----
22.190.73-0.73
35.113.651.460.73
Note: The PHL diversity index key: high (above 0.6) = 1, medium (0.2 to 0.6) = 2, low (below 0.2) = 3. Source: authors’ compilation.
Table 8. ZIP model results.
ZIP ModelIRR/OR
VariableCoef.Robust
(Std. Err.)
Coef.Std. Err.
Count component
Gender_male−0.0150.6340.9850.625
Marital_married−1.685 **0.8590.185 **0.159
Marital_widow0.4770.5591.6110.902
Marital_other−0.9690.6050.3790.229
Tenure_lease1.734 *1.0475.666 *5.933
Tenure_communal2.0271.2727.5899.652
Tenure_other0.4600.8791.5841.392
Irrigation_sprinkler1.681 ***0.5545.371 ***2.977
Irrigation_flood0.3741.3411.4531.949
Labour_seasonal1.270 **0.5223.562 **1.858
Labour_casual1.566 ***0.4884.784 ***2.333
Extension_seldom−1.4331.1320.2380.269
Extension_moderate−1.9851.2070.137 *0.166
Extension_always−3.866 ***1.3560.021 ***0.028
Market_frequent0.9700.4322.6391.139
Market_always2.188 ***0.8418.914 ***7.494
Education_secondary−1.707 ***0.6360.181 ***0.115
Education_primary−1.9100.8870.1480.131
Education_none−0.7350.6150.4790.295
Credit_none−2.128 *1.2360.119 *0.147
Prunning_none1.464 ***0.4304.322 ***1.859
Cultivar_Navels0.8110.6552.2511.475
Cultivar_Caracara−1.0410.7690.3530.271
Cultivar_lemons1.560 ***0.3894.759 ***1.853
Constant−0.7791.9430.4590.892
Logit component
Yield−0.236 ***0.0720.789 *0.429
Credit_none−3.249 *1.8791.037 **0.520
Extension_seldom−4.7571.6462.3480.099
Extension_moderate−5.0211.6551.945 **1.058
Extension_always−9.901 *5.3220.8860.524
Tree_age−0.277 *0.1211.323 **0.663
Cultivar_Navels6.9312.1431.3890.704
Cultivar_Caracara4.571 **1.4000.009 **0.021
Cultivar_lemons6.339 ***1.8622.348 *0.949
Experience−0.2990.1250.8890.427
Age0.172 *0.0980.789 **0.376
Constant13.464 ***3.9274.036 ***1.297
Note: Count model has a relationship between covariates and count mean and zero-inflation model has a relationship between covariates and the probability of zeros. ZIP = zero-inflated Poisson model. Significance levels: *** = 0.01, ** = 0.05, * = 0.1. Source: authors’ compilation.
Publisher’s Note: MDPI stays neutral with regard to jurisdictional claims in published maps and institutional affiliations.

