Abstract
The aim of the study was to evaluate the effect of various fertilization treatments, including nitrogen, potassium and phosphorus fertilization, in long-term experiments for selected UAV (unmanned aerial vehicle)-derived spectral vegetation indices (NDVI—Normalized Difference Vegetation Index, NDRE—Normalized Difference Red Edge Index, VARI—Visible Atmospherically Resistant Index, TGI—Triangular Greenness Index, SIPI2—Structure Insensitive Pigment Index 2, LCI—Leaf Chlorophyll Index, BNDVI—Blue Normalized Difference Vegetation Index, GNDVI—Green Normalized Difference Vegetation Index, MCARI—Modified Chlorophyll Absorption in Reflective Index) based on multispectral (bands in the range of visible light and near infra-red) images of winter rye. The strongest effect on the studied vegetation indices was nitrogen fertilization, which discriminated values of most of the vegetation indices. The effect of phosphorus and potassium fertilization on the studied vegetation indices was much weaker. The treatments with nitrogen fertilization had significantly higher values of most vegetation indices in comparison to treatments without nitrogen. This was confirmed by principal component analysis (PCA), in which treatments without nitrogen fertilization were very different in comparison to all other treatments where nitrogen fertilization was applied. The effect of phosphorus and potassium fertilization on most of vegetation indices was relatively weak and not significant in most experiments. Only for rye cultivated in monoculture was the effect of phosphorus fertilization significant for most of vegetation indices in early growth stages. In later growth stages (heading and flowering) the effect of phosphorus fertilization was significant in rye monoculture for the SIPI2 vegetation index. Mean SIPI2 was higher for the fertilization treatment CaNPK in comparison to CaKN (without P fertilization). The effect of potassium fertilization on the studied vegetation indices was very weak, and in most cases not significant. The effect of nitrogen fertilization on vegetation indices was much stronger than effect of both potassium and phosphorus fertilization.
1. Introduction
The evaluation of fertilizer demand for crops is usually performed using chemical analysis of the soil in which the content of available nutrients is evaluated [1,2,3,4]. The most important nutrients for crops are nitrogen (N), phosphorus (P) and potassium (K), which are used for mineral fertilization [5,6,7]. Moreover, one of the most important soil chemical properties is soil pH, which affects the availability of nutrients for plants [8].
The limitations of chemical analyses are the time and costs required. Furthermore, because of the high spatial soil variability, the results of chemical analyses are true for the sampling points and may not be representative for the total area of the crop fields [9]. Site-specific crop management, applied in precision agriculture, assumes adjusting fertilizers rates to the variability of soil physico-chemical properties and expected yields [10,11]. The evaluation of within-field variability in soil or crop condition, and adjusting the rates of fertilizers for crop can be conducted using remote sensing methods [12,13].
Remote sensing methods are mainly used to assess the nutritional status of the crop and adjust nitrogen variable rate fertilization [14,15]. Detecting the nutritional status of crops or the content of available potassium and phosphorus in soil is more difficult, as the condition of crops is not strongly related to the deficiency of these nutrients. Nevertheless, there are studies in which remote sensing methods are tested to assess potassium or phosphorus deficiency [16,17,18,19,20]. Evaluation of the within-field variability of crop fertilizer requirements is possible using remote sensing data acquired by ground-based sensors, unmanned aerial vehicles (UAV) or satellite-derived data [21,22,23].
Crop status is usually evaluated using various spectral vegetation indices which are usually based on the reflectance of electromagnetic radiation in the range of visible light and near infra-red light [24,25]. Most of the vegetation indices are based on the ratio of two or more bands of electromagnetic radiation reflectance or are based on ratio where differences or sums of two or more bands are used [26]. One of the most common vegetation indices is NDVI (normalized difference vegetation index), which is based on red and near infra-red reflectance. Values of vegetation indices are usually strongly correlated with crop status, crop biomass and color of the plants (e.g., chlorophyll content) [27,28].
In a study conducted at a village level in the south-central India, moderate correlations between various satellite derived indices and the content of exchangeable potassium in soil were found [29]. Multivariate models where several spectral indices were applied increased R2 to about 0.5–0.6 for the prediction of exchangeable potassium. In this study, satellite images at various spatial resolution, from 2 to 30 m, were used. Another study conducted in India, showed significant but relatively weak positive correlations between potassium concentrations in wheat and spectral vegetation indices derived by a handheld hyperspectral sensor [16]. In the same study, correlations between the spectral indices and the phosphorus concentration in wheat were not significant. A similar study, which assessed the relationship between the spectral vegetation indices based on the data from handheld sensor with the content of potassium and phosphorus in wheat, was conducted by Pimstein et al. [17]. Strong significant positive correlations were observed for potassium but only for one of the four subsets, while for phosphorus the correlations were much weaker, but some of them were significant.
Many recent studies have focused on detecting potassium deficiency in crops using UAV multispectral images. One of them is focused on the differentiation of potassium-deficient canola plants from potassium-sufficient plants using multispectral reflectance data [30]. It was possible to differentiate plants with and without potassium deficiency with high accuracy. In a study by Lu et al. [31] strong nonlinear relationships were demonstrated between the UAV-derived spectral vegetation indices and the accumulation of potassium in plants. The highest coefficients of determination (R2 = 0.72) were observed for RDVI (renormalized difference vegetation index) and OSAVI (optimized soil adjusted vegetation index) as predictors of plant potassium accumulation. In a study by Furlanetto et al. [32] strong linear relationships were proven between UAV-derived vegetation indices and the foliar potassium content in maize. The strongest correlation (R2 = 0.79) was observed for GRVI (ratio between infrared and green reflectance) at the V12 growth stage of maize (about two weeks before silking). In a study by Peng et al. [33] relationships between various spectral vegetation indices based on the UAV multispectral camera and leaf nitrogen, potassium and phosphorus contents in grapes were evaluated. Strong positive correlations were found for all nutrients, especially in the later growth stages of plants. Multivariate models where several vegetation indices were the predictors give the highest coefficients of determination (about 0.8).
The evaluation of potassium and phosphorus deficiency in crops, based on UAV-derived remote sensing data, is very important in crop management because it allows one to optimize fertilization with these nutrients. This is a novel study because most of the studies focus only on nitrogen fertilization. In this study we evaluated the differences of various UAV-derived spectral vegetation indices for winter rye in various fertilization treatments in long-term experiments. The main focus of the study was the comparison of selected vegetation indices between treatments with potassium and phosphorus fertilization and without such fertilization.
2. Materials and Methods
2.1. Location of the Study and Experimental Design
The research was carried out in the fields of long-term fertilization experiments on stagnic luvisols located at the Experimental Station of the Institute of Agriculture of Warsaw University of Life Sciences in Skierniewice, in the center of Poland (51°58′ N, 20°10′ E) (Figure 1). The beginning of these experiments dates back to 1923. They were set up according to the randomized block design in three or in five repetitions. The size of the experimental plots for harvesting was 36 m2. In the study, three types of fields were used (N—nitrogen, P—phosphorus, K—potassium, Ca—calcium, lime):
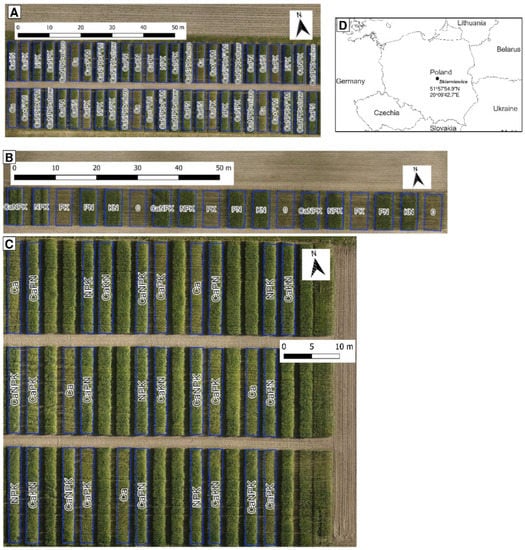
Figure 1.
Design of the studied field experiments in the Experimental Station in Skierniewice (borders of the plots, information about the fertilization and RGB ortophotomap from 3 June 2022). (A)—field experiment 2; (B)—field experiment 1; (C)—field experiment 3; (D)—map presenting location of the Experimental Station. Abbreviations: Ca—calcium, N—nitrogen, P—phosphorus, K—potassium, FYM—farmyard manure, micro—micronutrients.
Field experiment 1—without manure, with crop rotation without legumes, with 4 fertilization schemes: CaNPK—calcium, nitrogen, phosphorus, potassium—NPK, PN, NK;
Field experiment 2—rye monoculture with 4 fertilization schemes: CaNPK, NPK, CaPN, CaNK;
Field experiment 3—with manure, field with potatoes, spring barley, red clover, winter wheat and rye crop rotation with 4 fertilization schemes: CaNPK, NPK, CaPN, CaNK.
Mineral fertilizer has been applied every year since 1974 in the following doses: N—90 kg ha−1 in the form of ammonium nitrate, P—26 kg ha−1 in the form of superphosphate and K—91 kg ha−1 in the form of high-percentage potassium salt. Lime (CaO) is used every 4 years in a dose of 1.6 t ha−1 (fields 1 and 2) or every 5 years in the amount of 2 t ha−1 (field 3). The application of lime every 4 years in such a dose maintains the soil pH at the level of 5.8–6.4. Manure is applied at a dose of 30 t ha−1 every 5 years. Mean grain yield and contents of available phosphorus, potassium (based on Egnera-Riehm method) and soil pH (in 1 M KCl solution) for the past 20 years are presented in Table 1.

Table 1.
Mean grain yield and content of available phosphorus, potassium (based on Egnera-Riehm method) and soil pH (in 1 M KCl solution) for recent 20 years.
In season 2021/2022, winter rye was cultivated in all three experiments. The sowing date was at 4 October 2021, the date of the plants’ emergence was 15 October 2021 and the harvest date was 24 August 2022. Weather conditions in the season of the study are presented in Table 2.
Table 2.
Weather conditions from period of winter rye sowing to the end of vegetation.
2.2. Acquasition of UAV Imagery and Generation of Ortophotos with Vegetation Idices
A Phantom 4 Multispectral (SZ DJI Technology Co., Ltd., Shenzhen, China) was used in the study. Each flight was planned at 40 m above ground level with front and side overlaps of 70% and the ground pixel size of 2 cm. A six-sensor camera with resolution 2.1 Mpx equipped with one RGB sensor and five monochrome sensors: blue (B): 450 nm ± 16 nm; green (G): 560 nm ± 16 nm; red (R): 650 nm ± 16 nm; red edge (RE): 730 nm ± 16 nm; near-infrared (NIR): 840 nm ± 26 nm, was used. The images were taken on the following four dates: 5 September 2022 (end of booting), 26 May 2022 (heading), 3 June 2022 (flowering) and 13 June 2022 (beginning of development of grains). Pix4Dfields software (Pix4D S.A. Prilly, Switzerland) [34] was used to generate multispectral ortophotos and 9 vegetation indices for the analyses (Table 3, Figure 2). The vegetation indices were chosen because they are commonly used, reliable parameters to assess the condition of crops by remote sensing methods.
Table 3.
Vegetation indices used in the study.
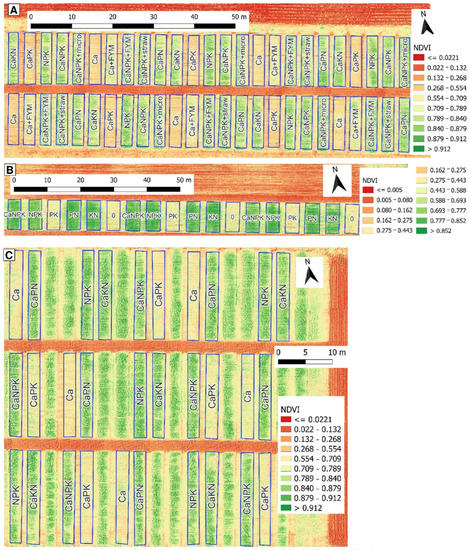
Figure 2.
NDVI based on the multispectral images acquired by UAV on 3 June 2022, for the studied field experiments at the Experimental Station in Skierniewice. (A)—field experiment 2; (B)—field experiment 1; (C)—field experiment 3. Abbreviations: Ca—calcium, N—nitrogen, P—phosphorus, K—potassium, FYM—farmyard manure, micro—micronutrients, NDVI—Normalized Difference Vegetation Index.
The calculations of the average value of the vegetation indices were performed using zonal statistics in QGIS 3.24 software (Open Source Geospatial Foundation, Chicago, IL, USA) [35]. To avoid a border effect of the plots, 30 cm of buffer was removed from each plot on each side to calculate the vegetation indices.
2.3. Statistical Analysis
The average values of vegetation indices for individual plots were used for statistical analysis. Comparisons of the mean vegetation indices were performed using a one-way analysis of variance (ANOVA) and a multiple comparisons based on the Tukey’s HSD 0.05 probability level. This allowed us to distinguish between homogenous groups of means and evaluate the effect of fertilization treatments for each vegetation index. Principal component analysis (PCA) was used for the multivariate evaluation of the relationships between vegetation indices for all dates together and the evaluation of multivariate differences between fertilization treatments. For PCA, only the selected vegetation indices were used (NDVI, VARI, TGI, SIPI2); because of very strong correlations with NDVI, other vegetation indices were excluded. The PCA was conducted for all four terms together. The statistical analyses were performed using Statistica 13 software (TIBCO, Palo Alto, CA, USA) [36].
3. Results
3.1. Comparison of Vegetation Indices between Treatments
The means of vegetation indices for different treatments in three experiments are presented in Table 4, Table 5 and Table 6 and the NDVI maps in Figure 2. In these tables, the results of multiple comparisons are presented, i.e., homogenous groups of means distinguished based on Tukey’s HSD procedure. Higher values of the vegetation indices usually indicate a better crop condition, i.e., more intensive vegetation, which is associated with a higher grain yield. The highest values of the most vegetation indices in all experiments and dates were observed for the treatments where nitrogen fertilization was applied. The effect of the application of other nutrients, i.e., potassium and phosphorus, on the studied vegetation indices was very weak, and in most cases did not cause significant changes. In the first field experiment, in which only mineral fertilization was applied, the highest values of the majority of the vegetation indices were observed for the treatments where phosphorus and nitrogen (PN) were applied. For example, NDVI, which is the most common vegetation index, was the highest for PN treatment for three terms, i.e., 5 September 2022 (NDVI = 0.822), 26 May 2022 (0.779) and 3 June 2022 (0.779). On the last date, 13 June 2022, the value of NDVI was slightly lower for PK treatments in comparison to other fertilizations. The highest value of NDVI in the last term was observed for the KN treatment, i.e., where fertilization with potassium and nitrogen was applied, but without phosphorus. The differences between the means of vegetation indices were not significant in almost all treatments where nitrogen was applied, regardless of phosphorus or potassium fertilization. The effect of nitrogen fertilization on most of the vegetation indices was very strong. Treatments where only potassium and phosphorus were applied had very low values of most vegetation indices, including NDVI. The differences between the means of vegetation indices were not significant for the PK treatment in comparison to the control (0—without mineral fertilization). As the main aim of the study was to compare the effect of phosphorus and potassium fertilization on various spectral indices, comparisons between treatments with and without phosphorus or potassium were conducted. The results are presented as p-values in Table 6. In the first experiment, significant differences (p-value < 0.05) were proved for TGI in the first term (9 May 2022). TGI was higher for the treatment without phosphorus fertilization (KN) in comparison to complete fertilization (NPK). The difference for TGI was observed only in the first term; the remaining vegetation indices were not influenced by phosphorus fertilization in the first experiment. The effect of potassium fertilization in the first experiment on the studied spectral indices was demonstrated only for MCARI in the first term (9 May 2022) and for SIPI2 in the second term (26 May 2022). In both cases, higher means of these vegetation indices were observed for the treatment without potassium fertilization (PN) in comparison to treatments with complete fertilization (NPK).
Table 4.
Means of vegetation indices in field experiment 1 (crop rotation without legumes and only mineral fertilization) and comparisons of means based on Tukey’s HSD.
Table 5.
Means of vegetation indices in field experiment 2 (monoculture of rye) and comparisons of means based on Tukey’s HSD.
Table 6.
Means of vegetation indices in field experiment 3 (with manure application and crop rotation) and comparisons of means based on Tukey’s HSD.
In Experiment 2, where only winter rye was cultivated (rye monoculture) in various fertilization treatment with mineral and manure fertilization (FYM), the lowest values of most vegetation indices were observed for treatments without nitrogen fertilization, i.e., Ca (where only lime was applied) and CaPK (where lime, phosphorus and potassium were applied) (Table 5). The treatments where nitrogen fertilization was applied had the highest values for almost all vegetation indices in all terms. The lack of phosphorus or potassium fertilization did not significantly affect the values of most vegetation indices. The highest values of vegetation indices in most cases were observed for the treatment CaNPK + FYM (complete mineral fertilization together with manure), but the differences in comparison to treatments without potassium or without phosphorus were small. A significant effect of phosphorus fertilization (treatment CaNPK vs. CaKN) was proven for almost all the studied spectral indices in the first term (9 May 2022). Higher means of the spectral indices were observed for CaNPK than for CaKN. The differences in subsequent terms were only proven for BNDVI and SIPI2 in the second term (26 May 2022), for GNDVI and SIPI2 for the third term (3 June 2022) and for BNDVI in the fourth term (13 June 2022). In the same experiment, there were no significant differences between the treatments CaNPK vs. CaPN, which means that no significant effect of potassium fertilization were observed in the monoculture of rye.
The results obtained in Experiment 3 (Table 7) were very similar to those obtained in Experiment 1. Two treatments in which nitrogen fertilization was not applied (Ca—without NPK mineral fertilization and CaPK—with phosphorus and potassium mineral fertlization) had the lowest means of most of the vegetation indices for all terms. The comparison of CaNPK vs. CaKN treatments, which is an evaluation of the effect of phosphorus fertilization, showed significant differences (p-value < 0.05) for VARI in the first and in the second term (9 May 2022 and 26 May 2022) and significant differences for MCARI in the second and in the fourth term (26 May 2022 and 13 June 2022) (Table 7). Higher values of these vegetation indices were observed for the CaNPK treatment in comparison to the CaNK treatment. The comparison of CaNPK vs. CaPN treatments did not show any significant differences, which means that potassium fertilization had no significant effect on the studied vegetation indices.
Table 7.
p-values based on the t-test for comparisons of vegetation indices between treatments with complete fertilization (NPK) and with deficiency of phosphorus (KN) or potassium (PN). p-values which indicate significant differences are marked in red.
3.2. Multivariate Differences between Treatments and Relationships between Vegetation Indices
PCA was performed using selected vegetation indices, i.e., TGI, NDVI, VARI and SIPI2, as well grain yield (mean for recent 20 years). These indices for all four terms were used as input variables in one PCA for each experiment. The remaining vegetation indices were excluded from the analysis because of a very strong correlation (correlation coefficient near to one) between them. The results of the PCA are presented in Figure 3, Figure 4 and Figure 5. All the results present a similar pattern, i.e., treatments without nitrogen fertilization are very different in comparison to all other treatments where nitrogen fertilization was applied. In Experiment 1, the PN treatment (fertilization with nitrogen and phosphorus, without potassium) was slightly different because of higher values of SIPI2, however, the difference was mainly along PC2, which explains only 4% of the total variability. In Experiment 2, the effect of phosphorus fertilization was observed, and it was manifested by lower values of SIPI2. In Experiment 3, the effects of phosphorus and potassium fertilization were very small, and only nitrogen fertilization strongly affected the values of vegetation indices. Most of the vegetation indices were very strongly positively correlated between each other and strongly positively correlated with the grain yield of winter rye. Weaker correlations were observed between SIPI2 with all other vegetation indices in Experiments 1 and 2. In the case of Experiment 3, weaker correlations were observed between TGI and all other vegetation indices in the first and second terms. The total variability explained by PC1 and PC2 was very high in all three experiments (about 97–98%), which means that multivariate differences presented in the Figure 3, Figure 4 and Figure 5 characterize well the multivariate variability of the studied treatments.
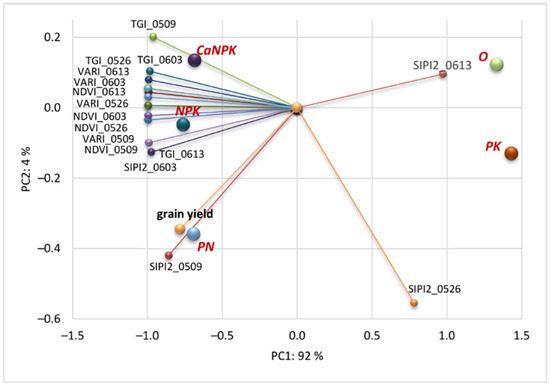
Figure 3.
The results of PCA presenting multivariate differences between treatments and relationships between selected vegetation indices in various terms (e.g., 0509 indicates 5 May) and grain yield in Experiment 1 (crop rotation without legumes and only mineral fertilization). Abbreviations: NDVI—Normalized Difference Vegetation Index, VARI—Visible Atmospherically Resistant Index, TGI—Triangular Greenness Index, SIPI2—Structure Insensitive Pigment Index 2, Ca—calcium, N—nitrogen, P—phosphorus, K—potassium.
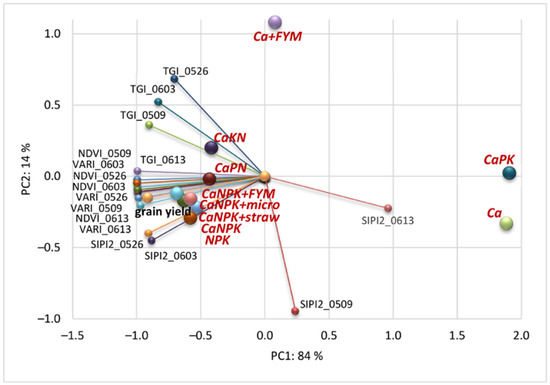
Figure 4.
The results of PCA presenting multivariate differences between treatments and relationships between selected vegetation indices in various terms (e.g., 0509 indicates 5 May) and grain yield in Experiment 2 (monoculture of rye).Abbreviations: NDVI—Normalized Difference Vegetation Index, VARI—Visible Atmospherically Resistant Index, TGI—Triangular Greenness Index, SIPI2—Structure Insensitive Pigment Index 2, Ca—calcium, N—nitrogen, P—phosphorus, K—potassium, FYM—farmyard manure, micro—micronutrients.
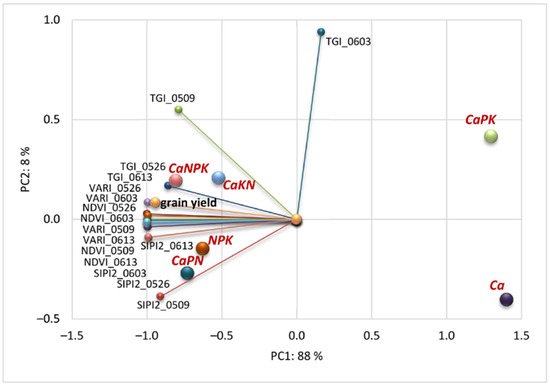
Figure 5.
The results of PCA presenting multivariate differences between treatments and relationships between selected vegetation indices in various terms (e.g., 0509 indicates 5 May) and grain yield in Experiment 3 (with manure application and crop rotation). Abbreviations: NDVI—Normalized Difference Vegetation Index, VARI—Visible Atmospherically Resistant Index, TGI—Triangular Greenness Index, SIPI2—Structure Insensitive Pigment Index 2, Ca—calcium, N—nitrogen, P—phosphorus, K—potassium.
4. Discussion
4.1. Effect of Fertlization Treatments on Vegetation Indices
The results obtained in the study proved a very small effect of phosphorus and potassium fertilization on vegetation indices. A very strong effect on vegetation indices was caused by nitrogen fertilization. The effect of potassium and phosphorus fertilization was observed only for selected vegetation indices in selected terms. The effect of phosphorus fertilization was slightly stronger than of potassium fertilization. Especially in rye monoculture, where phosphorus deficiency in soil was the strongest, the effect of phosphorus fertilization was more visible in earlier growth stages. In three out of four terms, a significant effect of phosphorus fertilization on SIPI2 was observed, which was lower for the CaKN in comparison to the CaNPK treatment. Other similar studies on rye or other cereals, in which relationships between nutritional status and spectral indices were evaluated, confirming that nitrogen fertilization has the most important effect [37,38]. In our study, the effect of nitrogen fertilization was proven by the results of multivariate analysis, i.e., PCA, where treatments without nitrogen fertilization and where phosphorus or potassium have been applied were very different (distant in the biplot) to the treatments with nitrogen fertilization. Such results were obtained in all three studied long-term experiments. It confirms a very strong multivariate effect of nitrogen fertilization and a much lower effect of potassium and phosphorus fertilization on all studied vegetation indices across all studied growth stages as well the effect on grain yield. Two treatments where nitrogen was not applied (without PK fertilization and with PK fertilization) were very similar according to all studied vegetation indices and were characterized by a very low grain yield.
4.2. Relationships between Vegetation Indices, Soil and Crop Conditions
Various spectral vegetation indices (including e.g., NDVI, NDRE and MCARI) are used to evaluate the nitrogen nutritional status of cereals and adjust nitrogen fertilization rates [38,39]. Most of them are based on visible light and near-infrared bands. Higher values of vegetation indices are usually correlated with a better nitrogen nutritional status, higher biomass and grain yield [40,41]. It was confirmed in our study that most of the vegetation indices are strongly correlated positively with the grain yield of winter rye. The similar correlations were observed for all studied growth stages, from the end of booting to the beginning of development of grains. The strongest relationships with grain yield were observed for SIPI2 (in two of the three experiments). Almost all of the vegetation indices were very strongly positively correlated and only SIPI2 was moderately correlated with other vegetation indices. It confirms that crop status can be evaluated by various vegetation indices, because they give similar information about the growth of winter rye. The relationships between the values of vegetation indices and the potassium or phosphorus content in soil or in plants are usually weak, and strong correlations were only observed with nitrogen fertilization. In a study by Wang et al. [42] a strong correlation was found between various three-band vegetation indices (TBVI) and foliar phosphorus content in Carex cinerascens. In a study by Rivero et al. [43] strong relationships were found between the content of phosphorus in the soil of subtropical wetland and satellite-derived NDVI. A study by Qiao et al. [28] proved that for maize, canopy bands were significantly different between various phosphorus levels in soil: 763 nm, 815 nm, and 900–1000 nm (i.e., in red and near infra-red spectra). It means that vegetation indices based on these bands can be used to assess phosphorus deficiency in maize. In a study by Kawamura et al. [44], soil phosphorus and potassium fertility status was evaluated using various spectral indices in legume-based pastures. Both phosphorus and potassium contents were strongly related to the photochemical reflectance index (PRI). In a study by Lu et al. [31] strong relationships between potassium content in the leaves of rice and various vegetation indices were found. The relationships between nutrient content and vegetation indices vary with soil and crop conditions. In a study on wheat by Pimstein et al. [17] the results were inconsistent. There were significant and insignificant correlations between selected vegetation indices and the content of potassium and phosphorus in wheat. These relationships were quite different for various locations, which may mean that factors other than phosphorus and potassium concentration have a significant effect on these relationships. A study by Furlanetto et al. [32] proved the usefulness of various UAV-derived vegetation indices for the evaluation of potassium foliar deficiency in maize. In various studies, different sources of remote sensing data were used, ranging from ground-based sensors or UAV sensors to satellite-derived imagery. The most promising methods for site-specific fertilization, including potassium and phosphorus, are hyperspectral images from UAV or satellite platforms. The relationships were quite different in different studies, which means that various factors, e.g., crop and soil conditions, can influence spectral vegetation indices used to assess the condition of crops.
4.3. Final Remarks and Possible Practical Application of the Results
In this study, phosphorus deficiency was mainly discriminated by the LCI and SIPI2 indices, but only in the rye monoculture. This is due to the fact that the availability of phosphorus in the soil depends not only on chemical properties (soil reaction), but also on the influence of plants on the availability of this nutrient, in which plants participate through root secretions and microorganisms living in the plant rhizosphere. For several dozen years, the unilateral influence of rye in monoculture allows for phosphorus uptake, from hardly accessible forms to a lesser extent than in the case of crop rotation, where one crop species leaves a part of the released phosphorus for the succeeding crop. It follows that the deficiency of phosphorus in winter rye plants is visible only when there is an extreme deficiency of the available forms of this nutrient in the soil. Lower values of the vegetation indices in the monoculture of rye on the combination of Ca with manure than on the mineral fertilization with CaNPK only indicate a nitrogen deficiency on the organic fertilization without mineral fertilization. The dose of nitrogen in the form of manure is comparable to the dose of nitrogen in the form of ammonium nitrate. However, in order for plants to be able to take nitrogen from manure, it must be mineralized (to the NH4 + form). The mineralization is carried out by soil microorganisms and the activity of this process depends on temperature and humidity. These results confirm other studies’ findings that the availability of nitrogen from manure is much lower than from mineral fertilizers [45,46].
The results of the study are moderately optimistic because they prove the possibility of the detection of phosphorus deficiency in early growth stages of rye using vegetation indices such as SIPI2. It can be used for precision agriculture, especially for variable rate fertilization of phosphorus, which is important for optimized fertilization because of economic and environmental constraints. The study in the future should be extended for other crops of high importance, e.g., winter wheat or rapeseed.
5. Conclusions
The strongest effect on almost all vegetation indices of winter rye, in different terms and in all three field experiments, was nitrogen fertilization. The effect of nitrogen fertilization was much stronger than the effect of both phosphorus and potassium fertilization. The treatments with nitrogen fertilization, regardless of whether they were fertilized with other nutrients, had much higher values of most vegetation indices in comparison to treatments without nitrogen. The effect of phosphorus and potassium fertilization on most of vegetation indices was not significant. Only in Experiment 2, where rye was cultivated in monoculture, was the effect of phosphorus fertilization significant for most of vegetation indices in early growth stages. In the future, it is recommended to evaluate various vegetation indices in the early stages of rye development, where the phosphorus deficiency may be more visible. Potassium fertilization has a weaker effect on the studied vegetation indices in comparison to phosphorus fertilization. The main limitation of the study is the limited number of growth stages in which the vegetation indices were studied. In further studies, more attention should be paid to the early growth stages when nutrient deficiency can be better detectable. Moreover, similar studies should be conducted for other crops in which potassium and phosphorus deficiency can be more visible. Winter rye, because of its relatively low fertilization requirements, is a crop which is quite resistant for nutrients shortage in soil in comparison to crops such as winter wheat or rapeseed, which have much higher fertilization requirements.
Author Contributions
Conceptualization, E.W.-G. and D.G.; methodology, E.W.-G., D.G. and W.S.; validation, E.W.-G., D.G. and W.S.; formal analysis, E.W.-G.; investigation, E.W.-G. and D.G.; data curation, E.W.-G. and D.G.; writing—original draft preparation, E.W.-G. and D.G.; writing—review and editing, E.W.-G. and W.S.; visualization, E.W.-G. and D.G.; supervision, E.W.-G.; project administration, E.W.-G.; funding acquisition, E.W.-G. All authors have read and agreed to the published version of the manuscript.
Funding
The APC was funded by Warsaw University of Life Sciences within the System of Financial Support for Scientists and Research Teams No. 853-2-80-45-700500-S22004.
Institutional Review Board Statement
Not applicable.
Data Availability Statement
Data available on request from corresponding author.
Conflicts of Interest
The authors declare no conflict of interest.
References
- Jordan-Meille, L.; Rubaek, G.H.; Ehlert, P.A.I.; Genot, V.; Hofman, G.; Goulding, K.; Recknagel, J.; Provolo, G.; Barraclough, P. An Overview of Fertilizer-P Recommendations in Europe: Soil Testing, Calibration and Fertilizer Recommendations. Soil Use Manag. 2012, 28, 419–435. [Google Scholar] [CrossRef]
- Marschner, P.; Rengel, Z. Nutrient Availability in Soils. In Marschner’s Mineral Nutrition of Higher Plants; Elsevier: Amsterdam, The Netherlands, 2012; pp. 315–330. ISBN 978-0-12-384905-2. [Google Scholar]
- Geisseler, D.; Miyao, G. Soil Testing for P and K Has Value in Nutrient Management for Annual Crops. Calif. Agric. 2016, 70, 152–159. [Google Scholar] [CrossRef]
- Hornec, D.A.; Sullivan, D.M.; Owen, J.S.; Hart, J.M. Soil Test Interpretation Guide; Oregon State University: Corvallis, OR, USA, 2011. [Google Scholar]
- Griffin, T.S. Nitrogen Availability. In Agronomy Monographs; Schepers, J.S., Raun, W.R., Eds.; American Society of Agronomy; Crop Science Society of America; Soil Science Society of America: Madison, WI, USA, 2015; pp. 613–646. ISBN 978-0-89118-191-0. [Google Scholar]
- Römheld, V.; Kirkby, E.A. Research on Potassium in Agriculture: Needs and Prospects. Plant Soil 2010, 335, 155–180. [Google Scholar] [CrossRef]
- Johnston, A.E.; Poulton, P.R. Phosphorus in Agriculture: A Review of Results from 175 Years of Research at Rothamsted, UK. J. Environ. Qual. 2019, 48, 1133–1144. [Google Scholar] [CrossRef]
- Neina, D. The Role of Soil PH in Plant Nutrition and Soil Remediation. Appl. Environ. Soil Sci. 2019, 2019, 5794869. [Google Scholar] [CrossRef]
- Mulla, D.; McBratney, A. Soil Spatial Variability. In Soil Physics Companion; CRC Press: Boca Raton, FL, USA, 2002; pp. 343–373. [Google Scholar]
- Diacono, M.; Rubino, P.; Montemurro, F. Precision Nitrogen Management of Wheat. A Review. Agron. Sustain. Dev. 2013, 33, 219–241. [Google Scholar] [CrossRef]
- Nawar, S.; Corstanje, R.; Halcro, G.; Mulla, D.; Mouazen, A.M. Delineation of Soil Management Zones for Variable-Rate Fertilization. In Advances in Agronomy; Elsevier: Amsterdam, The Netherlands, 2017; Volume 143, pp. 175–245. ISBN 978-0-12-812421-5. [Google Scholar]
- Sishodia, R.P.; Ray, R.L.; Singh, S.K. Applications of Remote Sensing in Precision Agriculture: A Review. Remote Sens. 2020, 12, 3136. [Google Scholar] [CrossRef]
- Ge, Y.; Thomasson, J.A.; Sui, R. Remote Sensing of Soil Properties in Precision Agriculture: A Review. Front. Earth Sci. 2011, 5, 229–238. [Google Scholar] [CrossRef]
- Bagheri, N.; Ahmadi, H.; Alavipanah, S.K.; Omid, M. Multispectral Remote Sensing for Site-Specific Nitrogen Fertilizer Management. Pesq. Agropec. Bras. 2013, 48, 1394–1401. [Google Scholar] [CrossRef]
- Basso, B.; Fiorentino, C.; Cammarano, D.; Schulthess, U. Variable Rate Nitrogen Fertilizer Response in Wheat Using Remote Sensing. Precis. Agric. 2016, 17, 168–182. [Google Scholar] [CrossRef]
- Mahajan, G.R.; Sahoo, R.N.; Pandey, R.N.; Gupta, V.K.; Kumar, D. Using Hyperspectral Remote Sensing Techniques to Monitor Nitrogen, Phosphorus, Sulphur and Potassium in Wheat (Triticum aestivum L.). Precis. Agric. 2014, 15, 499–522. [Google Scholar] [CrossRef]
- Pimstein, A.; Karnieli, A.; Bansal, S.K.; Bonfil, D.J. Exploring Remotely Sensed Technologies for Monitoring Wheat Potassium and Phosphorus Using Field Spectroscopy. Field Crops Res. 2011, 121, 125–135. [Google Scholar] [CrossRef]
- Mahajan, G.R.; Pandey, R.N.; Sahoo, R.N.; Gupta, V.K.; Datta, S.C.; Kumar, D. Monitoring Nitrogen, Phosphorus and Sulphur in Hybrid Rice (Oryza sativa L.) Using Hyperspectral Remote Sensing. Precis. Agric. 2017, 18, 736–761. [Google Scholar] [CrossRef]
- Lu, J.; Eitel, J.U.H.; Jennewein, J.S.; Zhu, J.; Zheng, H.; Yao, X.; Cheng, T.; Zhu, Y.; Cao, W.; Tian, Y. Combining Remote Sensing and Meteorological Data for Improved Rice Plant Potassium Content Estimation. Remote Sens. 2021, 13, 3502. [Google Scholar] [CrossRef]
- Siqueira, R.; Longchamps, L.; Dahal, S.; Khosla, R. Use of Fluorescence Sensing to Detect Nitrogen and Potassium Variability in Maize. Remote Sens. 2020, 12, 1752. [Google Scholar] [CrossRef]
- Maes, W.H.; Steppe, K. Perspectives for Remote Sensing with Unmanned Aerial Vehicles in Precision Agriculture. Trends Plant Sci. 2019, 24, 152–164. [Google Scholar] [CrossRef]
- Weiss, M.; Jacob, F.; Duveiller, G. Remote Sensing for Agricultural Applications: A Meta-Review. Remote Sens. Environ. 2020, 236, 111402. [Google Scholar] [CrossRef]
- Mulla, D.J. Twenty Five Years of Remote Sensing in Precision Agriculture: Key Advances and Remaining Knowledge Gaps. Biosyst. Eng. 2013, 114, 358–371. [Google Scholar] [CrossRef]
- Ferguson, R.; Rundquist, D. Remote Sensing for Site-Specific Crop Management. In ASA, CSSA, and SSSA Books; Kent Shannon, D., Clay, D.E., Kitchen, N.R., Eds.; American Society of Agronomy and Soil Science Society of America: Madison, WI, USA, 2018; pp. 103–117. ISBN 978-0-89118-367-9. [Google Scholar]
- Mezera, J.; Lukas, V.; Horniaček, I.; Smutný, V.; Elbl, J. Comparison of Proximal and Remote Sensing for the Diagnosis of Crop Status in Site-Specific Crop Management. Sensors 2021, 22, 19. [Google Scholar] [CrossRef] [PubMed]
- Bannari, A.; Morin, D.; Bonn, F.; Huete, A.R. A Review of Vegetation Indices. Remote Sens. Rev. 1995, 13, 95–120. [Google Scholar] [CrossRef]
- Mutanga, O.; Skidmore, A.K. Narrow Band Vegetation Indices Overcome the Saturation Problem in Biomass Estimation. Int. J. Remote Sens. 2004, 25, 3999–4014. [Google Scholar] [CrossRef]
- Qiao, B.; He, X.; Liu, Y.; Zhang, H.; Zhang, L.; Liu, L.; Reineke, A.-J.; Liu, W.; Müller, J. Maize Characteristics Estimation and Classification by Spectral Data under Two Soil Phosphorus Levels. Remote Sens. 2022, 14, 493. [Google Scholar] [CrossRef]
- Xu, Y.; Smith, S.E.; Grunwald, S.; Abd-Elrahman, A.; Wani, S.P. Evaluating the Effect of Remote Sensing Image Spatial Resolution on Soil Exchangeable Potassium Prediction Models in Smallholder Farm Settings. J. Environ. Manag. 2017, 200, 423–433. [Google Scholar] [CrossRef]
- Severtson, D.; Callow, N.; Flower, K.; Neuhaus, A.; Olejnik, M.; Nansen, C. Unmanned Aerial Vehicle Canopy Reflectance Data Detects Potassium Deficiency and Green Peach Aphid Susceptibility in Canola. Precis. Agric. 2016, 17, 659–677. [Google Scholar] [CrossRef]
- Lu, J.; Eitel, J.U.H.; Engels, M.; Zhu, J.; Ma, Y.; Liao, F.; Zheng, H.; Wang, X.; Yao, X.; Cheng, T.; et al. Improving Unmanned Aerial Vehicle (UAV) Remote Sensing of Rice Plant Potassium Accumulation by Fusing Spectral and Textural Information. Int. J. Appl. Earth Obs. Geoinf. 2021, 104, 102592. [Google Scholar] [CrossRef]
- Furlanetto, R.H.; Rafael Nanni, M.; Guilherme Teixeira Crusiol, L.; Silva, G.F.C.; de Oliveira, A., Jr.; Sibaldelli, R.N.R. Identification and Quantification of Potassium (K+) Deficiency in Maize Plants Using an Unmanned Aerial Vehicle and Visible/near-Infrared Semi-Professional Digital Camera. Int. J. Remote Sens. 2021, 42, 8783–8804. [Google Scholar] [CrossRef]
- Peng, X.; Chen, D.; Zhou, Z.; Zhang, Z.; Xu, C.; Zha, Q.; Wang, F.; Hu, X. Prediction of the Nitrogen, Phosphorus and Potassium Contents in Grape Leaves at Different Growth Stages Based on UAV Multispectral Remote Sensing. Remote Sens. 2022, 14, 2659. [Google Scholar] [CrossRef]
- Pix4D SA Pix4Dfields (1.7)-Advanced Agriculture Mapping Software for Aerial Crop Analysis and Digital Farming. 2021. Available online: https://www.Pix4d.com/ (accessed on 15 July 2022).
- QGIS.org. QGIS Geographic Information System. QGIS Association. 2022. Available online: http://www.qgis.org (accessed on 15 July 2022).
- TIBCO Software Inc. Statistica (Data Analysis Software System), Version 13; TIBCO Software: Palo Alto, CA, USA, 2017; Available online: http://statistica.io (accessed on 15 July 2022).
- Hunt, E.R.; Daughtry, C.S.T.; Mirsky, S.B.; Hively, W.D. Remote Sensing With Simulated Unmanned Aircraft Imagery for Precision Agriculture Applications. IEEE J. Sel. Top. Appl. Earth Obs. Remote Sens. 2014, 7, 4566–4571. [Google Scholar] [CrossRef]
- Fu, Y.; Yang, G.; Pu, R.; Li, Z.; Li, H.; Xu, X.; Song, X.; Yang, X.; Zhao, C. An Overview of Crop Nitrogen Status Assessment Using Hyperspectral Remote Sensing: Current Status and Perspectives. Eur. J. Agron. 2021, 124, 126241. [Google Scholar] [CrossRef]
- Argento, F.; Anken, T.; Abt, F.; Vogelsanger, E.; Walter, A.; Liebisch, F. Site-Specific Nitrogen Management in Winter Wheat Supported by Low-Altitude Remote Sensing and Soil Data. Precis. Agric. 2021, 22, 364–386. [Google Scholar] [CrossRef]
- Hassan, M.A.; Yang, M.; Rasheed, A.; Yang, G.; Reynolds, M.; Xia, X.; Xiao, Y.; He, Z. A Rapid Monitoring of NDVI across the Wheat Growth Cycle for Grain Yield Prediction Using a Multi-Spectral UAV Platform. Plant Sci. 2019, 282, 95–103. [Google Scholar] [CrossRef] [PubMed]
- Guan, S.; Fukami, K.; Matsunaka, H.; Okami, M.; Tanaka, R.; Nakano, H.; Sakai, T.; Nakano, K.; Ohdan, H.; Takahashi, K. Assessing Correlation of High-Resolution NDVI with Fertilizer Application Level and Yield of Rice and Wheat Crops Using Small UAVs. Remote Sens. 2019, 11, 112. [Google Scholar] [CrossRef]
- Wang, J.; Shi, T.; Liu, H.; Wu, G. Successive Projections Algorithm-Based Three-Band Vegetation Index for Foliar Phosphorus Estimation. Ecol. Indic. 2016, 67, 12–20. [Google Scholar] [CrossRef]
- Rivero, R.G.; Grunwald, S.; Binford, M.W.; Osborne, T.Z. Integrating Spectral Indices into Prediction Models of Soil Phosphorus in a Subtropical Wetland. Remote Sens. Environ. 2009, 113, 2389–2402. [Google Scholar] [CrossRef]
- Kawamura, K.; Mackay, A.D.; Tuohy, M.P.; Betteridge, K.; Sanches, I.D.; Inoue, Y. Potential for Spectral Indices to Remotely Sense Phosphorus and Potassium Content of Legume-Based Pasture as a Means of Assessing Soil Phosphorus and Potassium Fertility Status. Int. J. Remote Sens. 2011, 32, 103–124. [Google Scholar] [CrossRef]
- He, Z.; Pagliari, P.H.; Waldrip, H.M. Applied and Environmental Chemistry of Animal Manure: A Review. Pedosphere 2016, 26, 779–816. [Google Scholar] [CrossRef]
- Antoniadis, V.; Koutroubas, S.D.; Fotiadis, S. Nitrogen, Phosphorus, and Potassium Availability in Manure- and Sewage Sludge–Applied Soil. Commun. Soil Sci. Plant Anal. 2015, 46, 393–404. [Google Scholar] [CrossRef]


Publisher’s Note: MDPI stays neutral with regard to jurisdictional claims in published maps and institutional affiliations. |
© 2022 by the authors. Licensee MDPI, Basel, Switzerland. This article is an open access article distributed under the terms and conditions of the Creative Commons Attribution (CC BY) license (https://creativecommons.org/licenses/by/4.0/).