Article

Rye as an Energy Cover Crop: Management, Forage Quality, and Revenue Opportunities for Feed and Bioenergy

1
Department of Agricultural and Biological Engineering, Penn State University, University Park, PA 16802, USA
2
Department of Economics, Iowa State University, Ames, IA 50011, USA
3
Department of Statistics, Iowa State University, Ames, IA 50011, USA
4
USDA-ARS National Laboratory for Agriculture and the Environment, Ames, IA 50011, USA
5
USDA-ARS (Retired) National Laboratory for Agriculture and the Environment, Ames, IA 50011, USA
6
DLKarlen Consulting LLC, 487 Ashland Ave., St. Paul, MN 55102, USA
*
Author to whom correspondence should be addressed.
Agriculture 2022, 12(10), 1691; https://doi.org/10.3390/agriculture12101691
Submission received: 14 September 2022 / Revised: 4 October 2022 / Accepted: 10 October 2022 / Published: 14 October 2022
(This article belongs to the Special Issue Efficient Utilization of Biomass Resources in Agriculture)

Abstract

:
Harvesting a winter rye energy cover crop (Secale cereale L.) could help sustain growing food and energy demand, provide new revenue streams, and enhance ecosystem services without inducing land-use change. A two-year field experiment with three planting methods and three N fertilization rates (0, 60, and 120 kg N ha−1) that produced >5.0 Mg ha−1 yr−1 of biomass was evaluated for (1) fresh and anaerobically digested rye forage quality; (2) revenue potential from renewable bioenergy, carbon markets, and digestate feed protein; and (3) potential greenhouse gas (GHG) offsets. We showed that rye can be harvested as forage for animals or anaerobically digested to produce renewable natural gas (RNG), with the residue after digestion (digestate) still available as a feed protein concentrate. Anaerobically digesting rye improved forage quality indicators. Digestion significantly decreased acid- and neutral-detergent fiber (ADF and NDF) by 5.2% and 17.8%, respectively, while significantly increasing crude protein (CP) (33.6%), total digestible nutrients (TDN) (2.0%), relative feed value (RFV) (23.6%), net energy for lactation (8.3%), maintenance (7.5%), and gain (20.0%). Using market prices for RNG, high protein feed, and GHG mitigation, potential on-farm revenue ranged from USD 307 Mg−1 and USD 502 Mg−1 dry matter with an average of USD 402 Mg−1. However, there are substantial costs associated with RNG and the revenue potential does not represent the profitability of this system. Evaluation of the integrated system showed GHG emissions associated with rye fertilization were more than offset by the benefits of increasing yield in the 60 kg N ha−1 treatment. The overall carbon footprint of the integrated system was strongly carbon negative, confirming the potential of this strategy to sustainably intensify land use in the Midwestern United States.

1. Introduction

Agriculture faces a global challenge to balance food and energy production to sustain a growing population within the safe operating space of planetary boundaries and constraints [1]. Sustainably intensifying agriculture can help address this challenge; by increasing crop production without converting additional land or escalating adverse impacts and continuing to feed people while addressing other needs like climate change mitigation [2,3,4,5]. Harvesting cover crops or double-cropping—producing two crops instead of one crop in a single year—is one sustainable intensification method to increase yields per land area to feed a growing population, provide biomass for forage and bioenergy feedstock supplies, and generate environmental benefits. When double crops are used as energy crops for biogas production (energy cover crops), they can still provide ecosystem services as multifunctional crops [6].
Winter rye (Secale cereale L.) is one winter-hardy grain that farmers can double-crop. Harvested at the boot stage before flowering, rye is an animal feed that is comparable to corn silage [7]. Alternatively, rye can be used in bioenergy systems to co-produce energy as well as byproducts that may have value as animal feed [8,9]. Rye can also provide environmental benefits on the farm [10,11] by improving soil [12,13] and water quality [14]; rye can also generate agronomic benefits, including by increasing shading in spring and thus reducing weed competition for subsequent crops [15,16]. Compared with similar small grain cover crops, rye is more cold-tolerant [17], is higher-yielding [18], and may be more efficient at nitrogen uptake [19].
Cover crops like rye are growing in popularity in the U.S., with over six million hectares of otherwise seasonally fallow cropland currently planted with cover crops, up from over four million hectares in 2012 [20]. However, the amount of land where producers are double-cropping with cover crops is small compared with the potential, even though it may be a strategy to address farmers’ interest in making cover crops profitable [21]. Feyereisen et al. [22] estimated that the potential land suitable for double-cropping rye in the U.S. is almost 40 million hectares in corn or corn-soybean rotations and could yield approximately 150 million Mg (dry basis) of rye biomass. U.S. producers planted rye on only 1.5 million hectares in 2019 and, of that, harvested only 250,000 hectares [23]. While harvesting rye cover crops for forage, effectively creating a double-cropping system, has been profitable in regions with extensive animal agriculture, such as the dairy industry in the northeastern United States, much of the potential land suitable for double-cropping rye is in regions dominated by row-crop agriculture. For regions where the demand for animal forage is limited, bioenergy could serve as an alternative market to encourage double-cropping rye for both economic and environmental benefits. Using double-cropped rye crops as feedstock for bioenergy systems could potentially compete with its use as forages for the livestock industry or be complementary and synergistic if double crops can be used to produce both energy and animal feed.
Incentives for renewable biofuels can vary depending on what biomass was used to make the fuel, often with stronger incentives for cellulosic feedstocks than for “first-generation” biofuels made from starch or oilseeds. In either forage or bioenergy applications, farmers manage rye to minimize interference with the main summer crop by harvesting it in the spring before the grain fully matures. Harvesting the aboveground biomass of double-cropped rye before grain maturity classifies this herbaceous biomass as a cellulosic feedstock, making it eligible for stronger incentives through programs such as the United States Renewable Fuel Standard (RFS2) [24]. Because of the RFS, renewable natural gas (RNG) from cellulosic feedstocks like rye can be traded as D3 renewable identification numbers (RINs) [25], a commodity that represents an equivalent of a gallon of fuel ethanol. Winter rye is used in commercial digesters in Europe [26], and there is growing interest and a growing market for RNG from crop biomass in the United States [25,27].
Compared with first-generation biofuels based on grain crops, bioenergy systems that use cellulosic biomass can provide positive benefits like biodiversity, pollination, soil carbon accumulation [28], stronger greenhouse gas (GHG) mitigation [28,29], and potentially net-negative carbon emissions [30]. Potential benefits vary based on the energy system and environmental conditions where the crop is grown [6]. As an annual cellulosic feedstock that does not displace the main summer crops, the upfront investment in rye and the opportunity cost is less than for perennial cellulosic bioenergy feedstocks like switchgrass, which are more expensive to establish, require several years to reach their yield potential, and displace summer annual crops [31,32,33].
Among the many considerations in adopting a rye double-crop system, producers must understand crop management needs that can impact economic and environmental performance; however, studies addressing the impacts of double-crop rye management on forage and bioenergy systems are limited [34]. Earlier planting times and incorporating seeds may establish better stands [19] than broadcasting but could impact crop maturity, forage quality, and suitability for bioenergy. Fertilizing rye with nitrogen to increase biomass yields for bioenergy could also increase protein concentration for forage markets [35,36]. However, fertilizing rye increases overall system costs, and producers manage costs cautiously. Balkcom et al. [33] evaluated four N rates (0, 34, 67, and 101 kg ha−1); they found the highest rate produced the highest biomass, but noted this was also the most expensive treatment, and they suggested future analysis should consider revenue and forage quality before specifying fertilizer recommendations.
Fertilizing a rye double-crop may also affect N fluxes impacting both air and water quality. Malone et al. [14] reported that harvesting and fertilizing rye reduced simulated nitrogen loss in tile drainage by almost 20% compared with unharvested and unfertilized winter rye. However, fertilizing rye, especially in the fall, may increase nitrous oxide (N2O) and ammonia emissions [11].
Coupling fertilized rye double-crops with a bioenergy system that can offset GHGs emitted during the production and use of nitrogen fertilizer may be necessary for an intensification system to be sustainable. Similarly, rye’s high N recovery efficiency [37] means recycling the digestate as either livestock feed or a N-rich soil amendment could reduce overall nitrogen fertilizer requirements.
Few studies have investigated the use of rye as a feedstock for bioenergy or of the fermentation coproduct as livestock feed. Shao et al. [8] investigated the effect of rye maturity on yield, biomass, and revenue when used for ethanol and feed protein. However, they did not examine forage quality or other energy systems like RNG or carbon and renewable energy markets like RINs under the Renewable Fuel Standard.
This study investigated how differences in planting methods and N fertilizer rates reported by Malone et al. [37] impact forage quality for freshly harvested winter rye (fresh rye) grown in Central Iowa. We also investigated forage quality and potential revenue in a system where winter rye is anaerobically digested for RNG production, the digestate coproduct is sold as feed protein, and revenue is also generated from renewable energy and soil carbon credits. The digestate coproduct can be sold as feed protein because the digester system only accepts crop biomass and does not co-digest with manure, thus eliminating pathogen concerns. We also estimated the potential GHG emission offsets from fertilized rye in a bioenergy system.

2. Materials and Methods

2.1. Field Experiment

A split-plot randomized complete block design field experiment with nine treatments, each with six replications, was conducted in 2017–2018 and 2018–2019 in Iowa (42°00′ N, 93°47′ W). The main plot treatments included three rye (‘Elbon’) planting methods during the corn phase of a corn-soybean rotation, with subplots (3.8 × 9.1 m, n = 54) managed for three fertilizer N rates (0, 60, and 120 kg N ha−1) of surface-applied urea each April. Two sets of plots (east and west) were managed under a two-year rotation, with one year in corn and the other year in rye-soybean. In 2018, the west field was in corn, and the east field was in rye-soybean. In 2019, the crops were reversed (i.e., the east field in corn). The corn and soybean were managed as a typical Central Iowa no-till system. The rye was planted in the fall during the corn phase. At planting time, rye was drilled after corn harvest at row width = 19 cm (7.5 in) and depth = 2.5 cm (1.0 in) (drilled), broadcast and incorporated with a rolling stalk chopper after corn harvest (incorporated), or broadcast over corn with a spinner spreader mounted on a high-boy tractor at the R6 growth stage (overseeded). Rye seeding rates were 247, 371, and 309 Pure Live Seed (PLS) m−2; or 55, 69, and 82 kg total seeds ha−1 using 51,809 total seeds kg−1 and 85% germination for the drilled, overseeded, and incorporated planting methods, respectively. Rye biomass samples were hand clipped from the soil surface and up within one 0.38 m2 quadrat for each subplot at the flowering stage. Additional field method details are in Malone et al. [37].

2.2. Forage Analysis of Fresh Rye

Fresh rye subsamples from each subplot were dried at 60 °C, ground, and analyzed for forage quality indicators, including N content (N results in [37]), crude protein (CP), available protein, acid detergent fiber (ADF), neutral detergent fiber (NDF), lignin, total digestible nutrients (TDN), rumen degradable protein (RDP), rumen undegradable protein, relative feed value (RFV), net energy for lactation (NEL), net energy for gain (NEG), and net energy for maintenance (NEM). CP was analyzed by combustion using a CN628 Carbon/Nitrogen Determinator [38]; total N content was multiplied by 6.25, assuming the average N content of proteins is 16% [35]. The bacteria in an animal’s digestion system need adequate CP to digest forage. Subsamples were analyzed at the Dairy One Forage laboratory for ADF, NDF, and lignin by Near-Infrared Reflectance Spectroscopy (NIR) using the Foss NIRSystems Models XDS (Foss North America, Eden Praire, MN, USA.) and 6500 with ISIScan v.4.6.1 following AOAC 991.01 for moisture in forages and AOAC 989.03 for fiber and protein in forages using calibration curves developed for winter rye [38]. See Van Soest et al. [39] for the traditional wet chemistry methods for forage analysis used to develop these NIR calibrations. NDF measures all the plant fiber in a biomass sample, the hemicellulose, cellulose, and lignin, whereas ADF is only cellulose and lignin. NDF is an indicator of how much forage an animal will consume and ADF is an indicator of how digestible the forage is. Acid Detergent Insoluble Crude Protein (ADICP) was determined by analyzing the ADF residues using a Leco TruMac N Macro Determinator (Leco Corporation, St. Joseph, MI, USA) [38]. We subtracted ADICP from CP to determine how much protein may be available to ruminants (available protein). Rumen degradable protein (RDP) was analyzed following Cornell Streptomyces griseus (SGP) enzymatic digestion [38]. Residues containing undegradable protein were analyzed using Leco TruMac N Macro Determinator [38]. Rumen degradable protein (RDP) plus rumen undegradable protein (RUP) equaled 100%. RDP is easily degraded and used by microbes in the rumen, whereas RUP is not easily degraded by rumen microbes and is used for animal growth. TDN was calculated by summing crude protein, digestible crude fat x 2.25, NDF, and non-structural carbohydrates [38] following [40,41]. TDN indicates the energy value of forage. Non-structural carbohydrates were determined following [38,42]. Net energy for lactation (NEL), gain (NEG), and maintenance (NEM) were also calculated at Dairy One [43,44]. NEL, NEG, and NEM indicate the energy content of the forage when used for maintaining the animal’s weight, lactation, and increasing body weight. RFV is a relative forage quality indicator that compares forages with full-bloom alfalfa (RFV = 100); RFV was calculated by multiplying digestible dry matter (88.9 – (0.779 × %ADF)) by dry matter intake (120/%NDF) and dividing by 1.29 or the expected digestible dry matter intake for alfalfa [38].
We separated data by growing seasons for all analyses because of differences in weather conditions and field plot locations. All statistical analyses were performed using PROC MIXED in SAS (version 9.4, SAS Institute, Cary, NC, USA) according to a split-plot design. We analyzed rye forage quality with planting method, fertilizer rate, and their interaction as fixed effects. Replication (blocking factor) and the interaction between replication and planting method (whole-plot factor) were set as random effects. Pairwise comparisons were conducted with the Tukey–Kramer post hoc test when the main effects were significant at the α = 0.05 level.

2.3. Forage Quality of Digested Winter Rye and Revenue from Bioenergy and Feed Protein

We also estimated forage quality and revenue potential for an anaerobic digestion system producing RNG plus a digestate residue byproduct. In this system, rye is harvested and anaerobically digested to produce biogas which is upgraded to RNG by removing water, carbon dioxide, and various trace contaminants. The digestate solid residue is rich in soluble protein and may be recoverable for feed protein, as is now established for distillers grains and solubles from corn ethanol, another plant-based bioenergy fermentation [45].
For digested rye, we estimated the total revenue by summing the potential revenue from (1) RNG production, which we calculate as the sum of the fossil natural gas price plus the price of cellulosic biofuel credits for RNG, specifically the US EPA’s D3 RINs, (2) selling the digestate for feed protein, and (3) receiving payment from a soil carbon sequestration credit for planting a cover crop. We calculated the RNG production and mass losses in digestion based on Valli et al.’s [26] farm-scale anaerobic digestion study, which found a biogas yield of 0.315 m3 CH4 kg−1 volatile solids for triticale silage containing 94% volatile solids, with 78% of the volatile solids degraded during digestion. For example, a 5 Mg ha−1 rye yield with 94% volatile solids would yield 1480.5 m3 CH4 ha−1 or 11.3 GJ Mg−1.
We validated the farm-scale results in a bench-scale anaerobic digestion experiment with rye harvested between boot and milk stage (12 June 2013) in Rock Springs, PA, in a separate field study conducted at Penn State University from 2012 to 2013. Rye yields averaged 8.7 Mg ha−1 to 9.4 Mg ha−1. Rye was anaerobically digested at 37 °C for twenty-one days in five replicated sealed glass OxiTop vessels (WTW, Weilheim, Germany), each with 100 mL working volume. OxiTop vessels were inoculated with digestate material from an acclimated crop biomass (switchgrass) digester. Composite samples from days 0 and 21 of digestion were analyzed for volatile solids using elemental CHNO-S to determine carbon, hydrogen, nitrogen, oxygen, and sulfur. Composite samples of fresh (day 0) and digested (day 21) winter rye from this bench-scale experiment were also analyzed for CP, ADF, NDF, TDN, NEL, NEM, NEG, RFV, and lignin following the same methods described for the fresh rye samples to quantify the percent change in forage quality with digestion.
We estimated revenue potential from RNG using the range of actual commodity natural gas prices between January 2019 and June 2021, USD 0.06 m−3 to USD 0.19 m−3 CH4 (USD 1.60 to USD 5.40 MMBtu−1 CH4) [46,47] and the range of actual D3 RINs prices from December 2020 through May 2021, USD 0.80 m−3 CH4 to USD 1.28 m−3 CH4 (on average USD 1.03 m−3 CH4 or USD 29 MMBtu−1) [48]. See Supplemental Information Table S1 for additional information. The range is reported as “low” and “high” in the results section and tables. Since market values were not available for digestate as a livestock feed, we used hedonic pricing [49] to assign economic value to leftover digestate as a high protein coproduct by means of a multiple linear regression model. The regression was based on actual forage quality characteristics and published feed prices near the study region. See Supplemental Information for more details. We valued digestate feed using the multiple linear regression model based on forage quality parameters (CP, NEL, and ADF) measured on the fresh rye before digestion, and the percent change in forage quality measured after digestion in our bench-scale experiments. Other tools have been used to estimate the economic value of feeds or compare feed value based on nutritional composition [50,51]. We modeled the relationships between prices for alfalfa hay, wheat straw, soybean meal, and corn gluten feed sold in Iowa and St. Louis, Missouri (reported in USDA AMS [52]) and the average forage quality of the feed type (CP, NEL, and ADF) in field samples reported for that same region [53]. Income for carbon credits associated with planting rye cover-crops was based on a recent cover-crop carbon credit price of USD 16.50 Mg−1 (USD 15 ton−1) of carbon dioxide equivalents (CO2-e) [54]. We assumed that 0.055 Mg ha−1 carbon sequestration annually based on a carbon benefit of 55 kg C ha−1 (204 kg CO2-e ha−1) for fertilized rye compared with winter fallow reported by Ramcharan and Richard [11], which is USD 3.37 ha−1 at the recent cover-crop carbon credit price.

2.4. GHG Emissions Associated with Integrated Rye Bioenergy System

We also evaluated the GHG emissions associated with an integrated fertilized rye bioenergy system. GHG emissions were modeled in the Farm Energy Analysis Tool (FEAT) [55] as reported in Malone et al. [37] and were separated into fertilizer N2O emissions and other emissions associated with rye production. We estimated the RNG production based on rye yields reported in Malone et al. [37] and assumed 94% volatile solids and 0.315 Nm3 CH4 per kg volatile solids [26]. We assumed 55.8 kg CO2 is emitted per GJ when burning natural gas [56]. We estimated carbon in digestate, assuming 26.7% of the initial rye dry matter ended up as digestate [26] and applying the percent carbon measured in digestate in bench-scale experiments. Because digestate may be used as livestock feed, livestock bedding, a soil amendment, biochar, pelletized for fuel, or other alternatives, we did not attempt to consider the balance of carbon sequestration, offsets, or emissions related to downstream digestate use. Net emissions were calculated as the sum of GHG emissions, offsets, and carbon storage.

3. Results and Discussion

3.1. Growing Conditions and Growth Stages

During the study period, annual precipitation was above average, but spring and summer 2018 experienced higher rainfall than 2019, with June to August 2018 receiving 314 mm more rainfall than those same months in 2019. Growing degree days were above the average (1247 °C d) during rye’s September to May growing season in 2017–2018 (1332 °C d) and below average in 2018–2019 (1119 °C d), with October 2017 and May 2018 having the largest monthly growing degree day differences between the two growing seasons. Rye growth was at Feekes stages 4.5 to 5.5 on 4 May 2018, contrasting with the more mature Feekes stages 7 to 9 on 2 May 2019. Given these observations, rye was harvested just before the boot stage in 2018 and after the boot stage in 2019. Rye forage quality often declines quickly with maturity as the plant cell wall matures, lignin accumulates, and ADF and NDF increase; therefore, it is recommended to harvest at or before the boot stage [57].

3.2. Forage Quality of Fresh Rye

Fertilizing rye improved multiple indicators of forage quality. The effect of N rate was significant at α = 0.05 for crude protein (2018 and 2019), available protein (2018 and 2019), RDP (2018; p = 0.07 in 2019), RUP (2018; p = 0.07 in 2019), ADF (2018 and 2019), NDF (2018; p = 0.07 in 2019), lignin (2018), RFV (2018 and 2019), TDN (2018), NEL (2018), NEG (2018), and NEM (2018) (Table 1).
We observed significantly higher crude and available protein with increasing fertilization in 2018 and 2019 (Figure 1 and Table 1), similar to Cazzato et al. [58], who observed higher protein in triticale fertilized with 100 kg N ha−1 compared with unfertilized triticale. In the current study, crude and available protein were significantly higher in 2018 and 2019 at 60 and 120 kg ha−1 N rates than unfertilized treatment (Table 1). Our findings also agree with several other studies that showed N application increases crude protein concentration in switchgrass and other forage grasses [59,60,61,62,63]. In one of the few studies investigating rye forage quality with different fertilizer treatments, Landry et al. [64] reported a spring N application to rye of 50 kg N ha−1 increased crude protein by 24 g kg−1. Further, Binder et al. [65] reported that injected liquid dairy manure increased winter rye biomass protein content and forage quality compared to broadcast manure application, likely because of increased N available for plant uptake.
In contrast to [58], we did not observe a significant decrease in lignin with increasing fertilization and crude protein in 2019. Lignin can increase with plant maturity [67], and both increase [68] and decrease [58] with nitrogen fertilization in triticale. Lestingi et al. [68] found that fertilizing at 50 kg N ha−1 significantly increased lignin compared with no fertilizer but found no significant differences between unfertilized triticale and triticale fertilized with 100 kg N ha−1. We detected no significant differences in lignin concentration for the N fertilizer treatments studied here in 2019. In 2018, fertilizing at 120 kg N ha−1 significantly decreased lignin compared with no fertilizer. The lignin content was on average 5.19 ± 0.49% to 5.70 ± 0.39% across all three N treatments (Table 1), which is higher than lignin reported for triticale in [68] (1.39% for their 50 kg N ha−1 treatment).
ADF in the unfertilized rye treatment was significantly lower than 60 and 120 kg N ha−1 in 2019 but significantly higher than 120 kg N ha−1 in 2018; no significant differences were found between 0 and 60 kg N ha−1 in 2018 or between 60 and 120 kg N ha−1 (Table 1). ADF is a measure of cellulose and lignin, and while cellulose is digestible, the lignin inhibits digestion, so lower ADF values are desired for forage quality. ADF has been shown to increase with plant maturity [67] and be the lowest in unfertilized triticale systems compared with triticale treated with 50 and 100 kg N ha−1 [68]. ADF for unfertilized and fertilized rye treatments studied here ranged from 41.9% to 45.7%. ADF normally ranges from 28% to 41% for small grains [69] and is typically 25% to 31% for rye [70].
NDF, which includes cellulose, hemicellulose, and lignin, was significantly improved (reduced) in 2018 with fertilization at the 120 kg N ha−1 treatment compared with 0 kg N ha−1 (Table 1). NDF was near the high end of the typical range reported by Miller, Bertram, and Hoffman [70] for rye. NDF in rye has been shown to increase with plant maturity [67,71] and has been reported to both increase and decrease with fertilization [72]. We found that in 2018 fertilizing at 120 kg N ha−1 significantly reduced NDF over 0 kg N ha−1 and therefore improved RFV and forage quality at higher N fertilization rates. However, no significant difference was found between the three fertilizer treatments in 2019. In 2018, RFV significantly improved with the 120 kg N ha−1 treatment compared with no fertilizer, likely due to the reduction in NDF, but no significant difference was found between 0 and 60 kg N ha−1, suggesting higher fertilization rates may benefit forage quality. NEL, NEG, and NEM were also significantly improved with 60 kg N ha−1 fertilization (Table 1) in 2018, but no significant differences were found between 60 and 120 kg N ha−1, suggesting rates beyond 60 kg N ha−1 are not needed.
Further study of the impact of N application rates on forage quality is recommended, including alternative post-harvest management such as ensilage, which is a common storage strategy for rye that improves forage quality, converting some of the hemicellulose to highly digestible carboxylic acids [73] that also preserve the forage. Year-to-year and spatial variability due to confounding factors like weather and soil characteristics could be addressed with additional years of research and multiple site locations. However, our results provide evidence that some fertilization can improve rye forage quality, especially crude protein. Interestingly, improving forage quality with nitrogen fertilization may also have beneficial implications for water quality, as Malone et al. [14] reported that fertilizing and harvesting rye reduced simulated drainage nitrogen loss compared with unfertilized and unharvested rye.
Future studies with ensiled material are also recommended. We worked with dry biomass, similar to hay, but alternative methods of preservation may have improved forage quality, and there is strong evidence that the digestion process would be enhanced by ensiling the material [74].
There was no significant difference in forage quality between planting methods for RDP (2019), RUP (2019), ADF (2018 and 2019), NDF (2018), lignin (2018), RFV (2018), TDN (2018), NEL (2018), NEG (2018), and NEM (2018) (See in Supplemental Information Table S3), suggesting the planting method did not impact these forage outcomes in respective years.

3.3. Forage Quality of Digested Winter Rye and Revenue from Bioenergy and Feed Protein

The forage quality of the digestate was measured on the solid residue remaining after anaerobic digestion of rye in bench-scale reactors. While bench-scale anaerobic digestion experiments can be important in process optimization and product characterization, the potential for measurement error in a multi-component system with three active phases (solid, gas, and liquid) and differences between lab experiments and commercial facilities make a comparison with values from full-scale operations advisable. Although we found no prior studies characterizing the forage quality of digestate residues from rye or similar small grains, we did find a study [26] that included a mass balance on farm-scale anaerobic digestion with triticale, a hybrid of wheat (Triticum) and rye (Secale). We used this mass balance to calculate mass conversion rates and checked the results against the changes in concentration of nitrogen in our system, as described below. We selected nitrogen for this comparison because it is the third most prevalent element in the rye (after carbon and oxygen) and is largely conserved in the digestate. In contrast, in a well-functioning digester, much of the carbon and oxygen in the feedstock are converted to biogas, a mixture of methane and carbon dioxide.
Valli et al. [26] observed 78% conversion of the volatile solids of a triticale silage feedstock composed of 94% volatile solids, resulting in 73.3% of the total dry matter being converted to biogas and 26.7% remaining as digestate. Applying this dry matter conversion rate to the average nitrogen composition of our fresh rye feedstock collected in Iowa, we calculated that the residue following digestion should have had an average nitrogen content of 5.31%. This calculated nitrogen content was consistent with the average nitrogen content of 5.63% measured in the digestate residue from our batch Oxitop reactors following a 21-day digestion. Alternatively, assuming zero to minimal nitrogen loss during anaerobic digestion, as expected for a lignocellulosic feedstock operated at our conditions of 37oC and neutral pH [75,76], we calculated an average total dry matter conversion to biogas of 74.8% compared with 73.3% calculated from [26]. Observing that our digestate nitrogen concentration change and final composition were consistent with these farm-scale results, for the purposes of the economic analysis, we used Valli et al.’s [26] result and projected that in a full-scale system, 26.7% of the initial rye dry matter would be available following digestion. We then used the percent change measured in bench-scale experiments in PA to estimate the digestate value of samples harvesting in IA as a feed protein supplement.
The composition measurements of rye digestate in PA indicated ADF and NDF decreased with digestion (decreased by 5.2% and 17.8%, respectively), while there were increases in the concentrations of crude protein (33.6% increase), total digestible nutrients (2.0% increase), net energy for lactation (8.3% increase), relative feed value (23.6% increase), net energy for maintenance (7.5% increase), and net energy for gain (20.0% increase). Forage quality data of digested rye on day 0 and day 21 is in Supplemental Information Table S6. While the direction of the changes in all the constituents listed above indicates improved forage value, the one variable that did not improve is lignin, which increased from 17.2% to 24.2%. This higher lignin concentration may reduce the availability of some of the structural carbohydrates, cellulose, and hemicellulose, thus reducing the improvements in net energy. Crude protein, whose increase represents a major part of the improved feed value of the digestate, differed significantly between 2018 and 2019.
Lignin measured on day 0 and day 21 in the bench-scale experiment was considerably higher (17.2% and 24.2%) than lignin measured in IA fresh rye samples (on average, 5.5% in 2019 and 5.4% in 2018) because these batch digester experiments were inoculated with digestate from an acclimated switchgrass digester fed with mature lignocellulosic switchgrass. Future studies should conduct longer-term continuous flow experiments with fertilized and unfertilized rye, and use in vitro dry matter digestibility assay on the digestate to further characterize the forage quality of the digestate.
The revenue potential for the integrated system that digests rye to produce RNG, sells the digestate for feed protein, and participates in carbon and renewable energy markets was significantly improved with increasing fertilization in 2019 (Table 2). These results suggest that some fertilizer may be necessary to achieve revenue goals. However, higher N rates would also be associated with higher N2O GHG emissions during crop production, reducing the negative emissions potential of the bioenergy system and the farm’s climate mitigation potential.
We estimated that double-cropping rye offers an opportunity for producers to earn between USD 307 Mg−1 and USD 502 Mg−1 in revenue (Table 2) when producers capitalize on the four revenue streams assessed: (1) soil carbon credit programs for planting rye, (2) anaerobically digesting the harvested rye to produce RNG, (3) D3 RINs credits, and (4) producing a feed protein coproduct from the digestate residue that remains after digestion. The digestate yield was estimated to range from 0.6 to 2.5 Mg ha−1, and this feed protein coproduct was estimated to range from USD 183 ha−1 to USD 1046 ha−1 (Figure 2). The soil carbon credit represents less than 1% of the total revenue potential on a land unit basis. The amount of material for feed protein coproducts following digestion is less than the amount of fresh rye material because over 70% of the volatile solids are degraded during digestion. However, since the mass of nitrogen remains approximately the same before and after digestion, the remaining digestate represents a more concentrated nitrogen supplement.
Our revenue estimates for anaerobic digestion are higher than Shao et al. [8], who found values between 150 Mg−1 and USD 300 Mg−1 when rye is harvested for ethanol and feed protein. However, they did not consider revenue from D3 RINs as an incentive for biofuels, using the market price for commodity ethanol instead. Relative to current market prices for wholesale natural gas, the current D3 RINs incentives for cellulosic RNG are over ten times greater than that wholesale price. Receiving cellulosic RNG incentives from anaerobic digestion requires considerable additional costs, not only of investing in an anaerobic digester but also the costs and ability to connect to a commercial natural gas network to receive the D3 RIN revenue stream. These additional costs for producing RNG and the digestate coproduct (e.g., separation of biogas, drying and transport of digestate) would need to be added to the average breakeven prices for rye production reported in Malone et al. [37] (USD 104 Mg−1 and USD 117 Mg−1) to understand potential profitability. Farmers may be able to access state and federal financing options to help cover costs, such as the U.S. Department of Agriculture’s Rural Energy for America Program, PennVest, and the Commonwealth Financing Authority (CFA) [77]. Farmers who do not finance and operate an individual on-farm digester but instead sell rye biomass to a centralized digester system might also receive revenue for their rye. Based on the breakeven prices in Malone et al. [37], the farmer would need to receive 22% to 36% of the energy value of their feedstock generated from the digester system for the sale of winter rye to a commercial digester to be profitable. Averaged across 2018 and 2019, the percentages for high- and low-end estimates that the farmer would need to receive to break even were not significantly different between 0 and 120 kg N ha−1 (p > 0.3) or 60 and 120 kg N ha−1 (p > 0.5) but were significantly higher for unfertilized rye compared with 60 kg N ha−1 (p < 0.05). These results suggest that some fertilizer is needed, but higher fertilizer rates may be unnecessary to achieve revenue goals.
As previously noted in the discussion of fresh rye forage quality results, the planting method is likely not a factor in revenue potential for the digested rye system. Revenue was significantly higher when drilled or incorporated compared with overseeded in 2019, but revenue was not significantly different between drilled and overseeded or drilled and incorporated in 2018 (Supplemental Information Table S4).

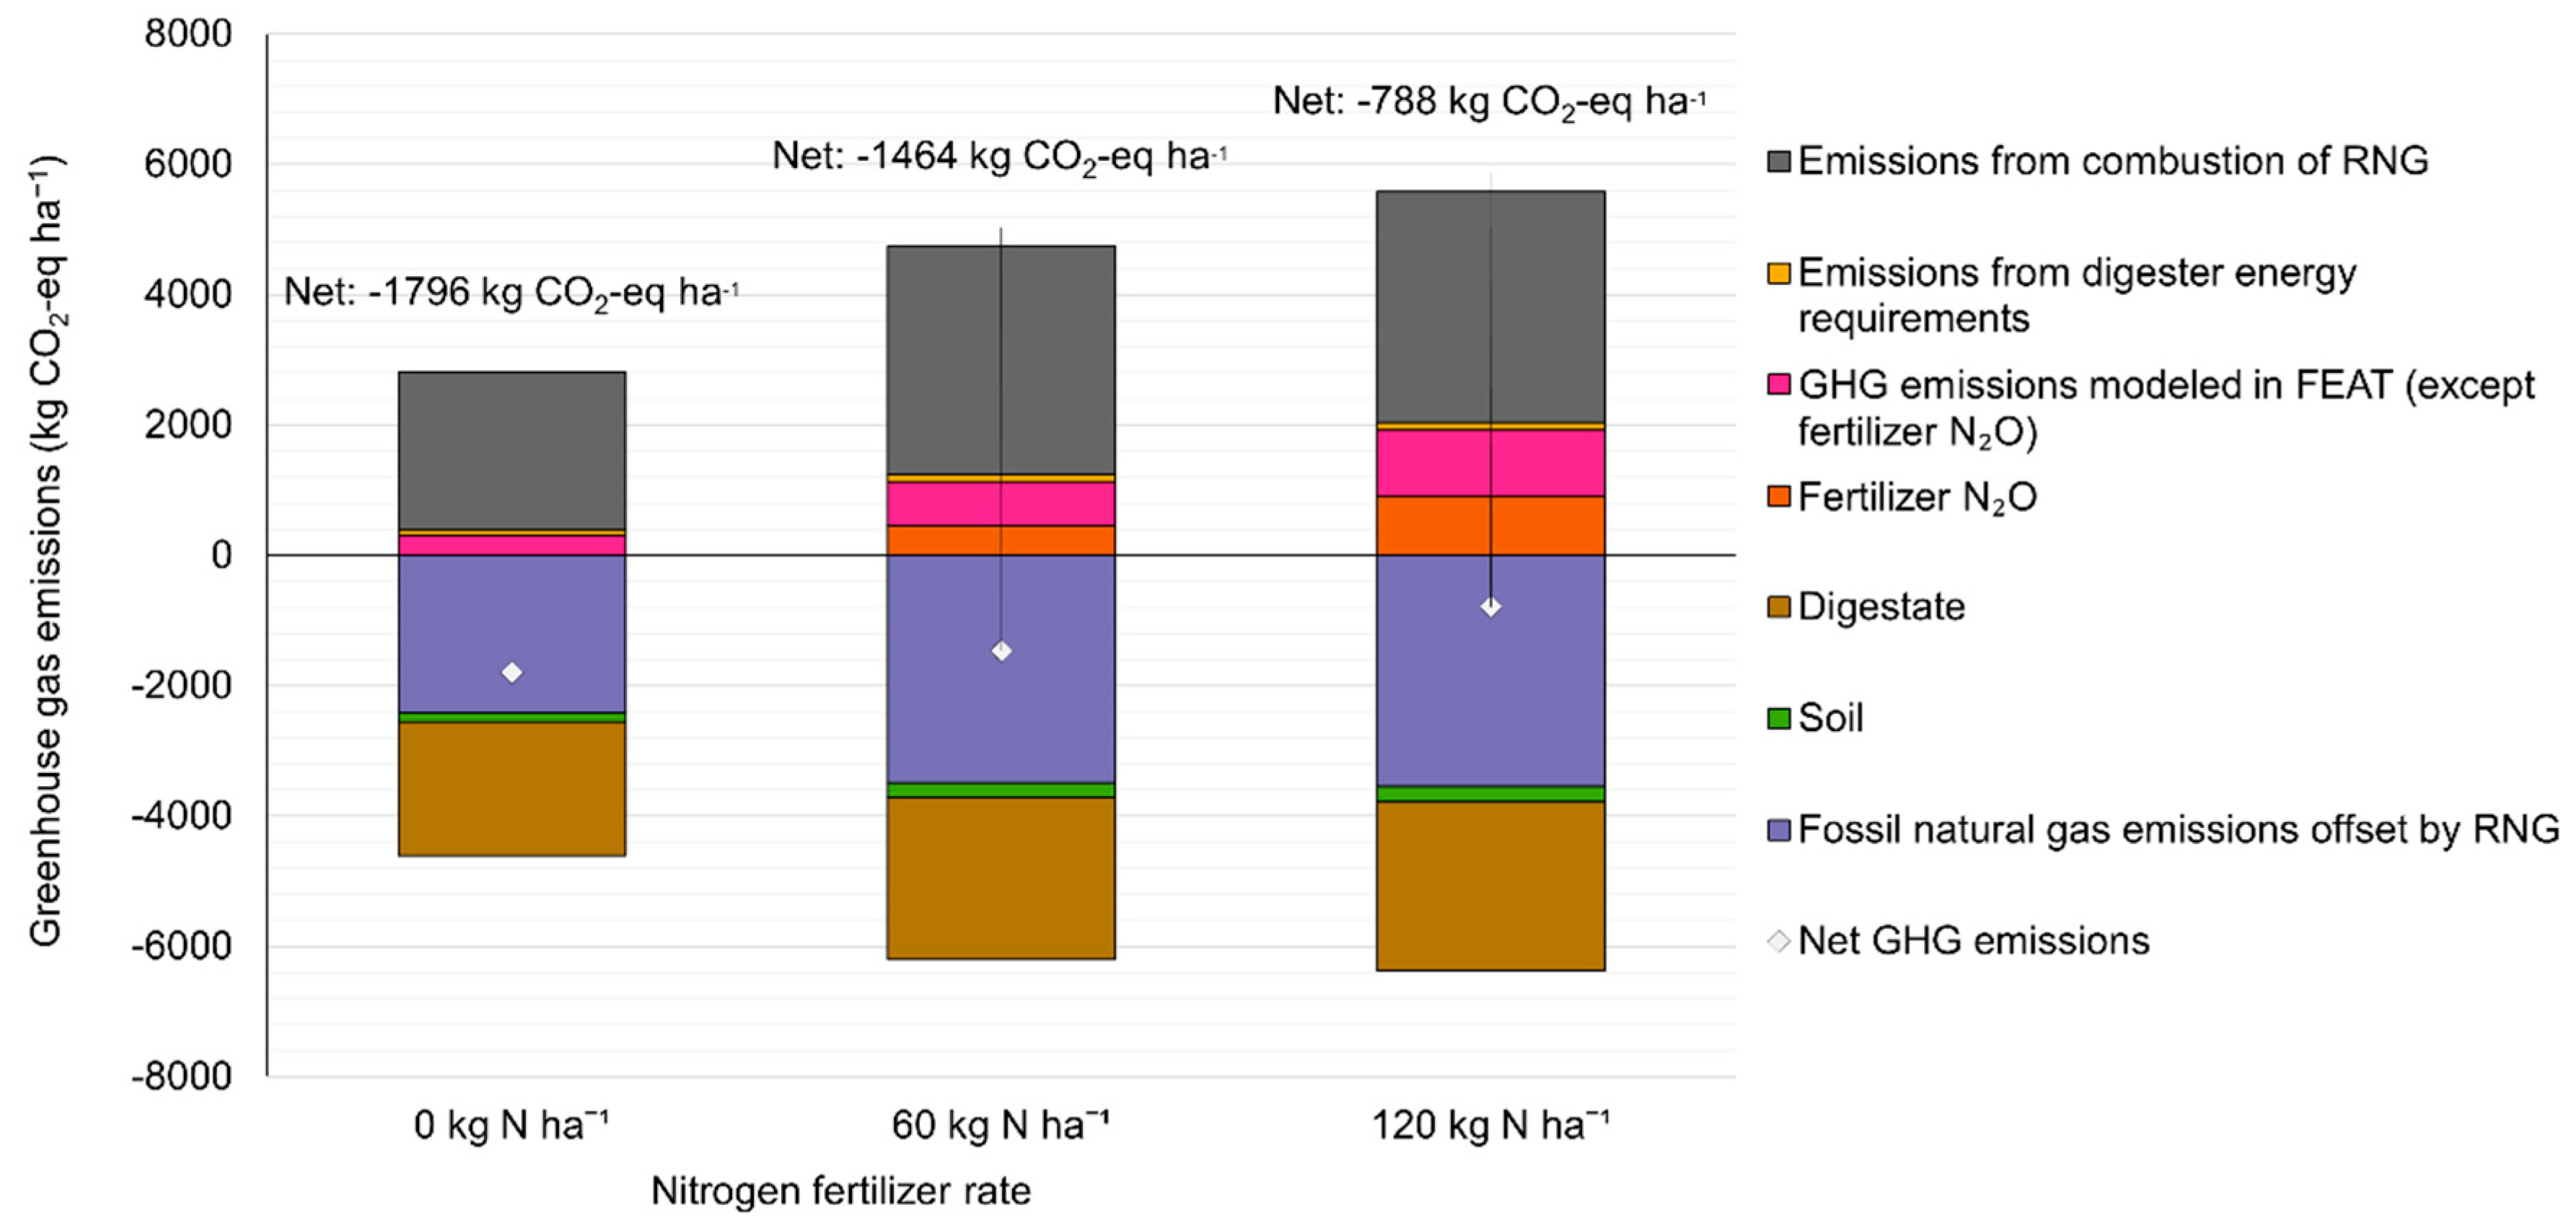
3.4. GHG Mitigation Potential

Our results suggest that fertilizing rye as a double-crop in a forage and bioenergy system may benefit forage quality, renewable energy, and revenue goals. However, the GHGs emitted during rye production, nitrogen fertilizer production, transportation of fertilizer and other inputs, and biogeochemical processes in the field are part of the system, and should be considered when designing sustainable bioenergy systems and evaluating their carbon footprint.
N2O emissions increase with increased nitrogen fertilizer rates [78]. Malone et al. [37] estimated that fertilizing with 60 and 120 kg ha−1 nitrogen incurs a carbon tradeoff, generating more biomass for downstream use but increasing rye’s in-field GHG emissions footprint by on average 1134 kg CO2-e ha−1 yr−1 and 1922 kg CO2-e ha−1 yr−1, respectively [37]. During crop production, direct N2O emissions from fertilizer application were the largest source of GHG emissions.
Feeding that fertilized rye into a methane digester that is well managed and does not leak CH4 could offset some of those GHG emissions associated with nitrogen fertilizer (Figure 3). At the average yields measured and reported in [37] (Supplemental Information Table S2), rye could produce RNG with an energy content of 62,762 MJ ha−1, based on 94% volatile solids and 0.315 Nm3 CH4 per kg volatile solids [26]. Assuming 55.8 kg CO2 is emitted per GJ when burning natural gas [56], using rye for RNG would have offset carbon emissions when we included the carbon sequestered in soil (Figure 3). When we subtract the carbon emission incurred with nitrogen fertilizer from these offsets, in 2018 and 2019 under both 60 and 120 kg ha−1 nitrogen fertilizer treatments, there is still a net carbon benefit before considering the carbon emissions incurred during bioenergy production (Figure 3). This net carbon benefit from the bioenergy system is in a similar range to the carbon benefit of traditional unfertilized and unharvested rye cover crops, which is in the range of 1 Mg CO2--eq ha−1 [11]. That residue could be used as a livestock feed, soil amendment, or pelletized and combusted. Depending on how that residue is used, there could be net carbon benefits in terms of emissions compared to other livestock feed production.
The energy requirements to run and heat a 1200 m3 digester are estimated to be 9349 MJ day−1 [79]. Assuming 0.315 m3 CH4 kg−1 volatile solids and 94% volatile solids [26], on a per-unit basis, the energy requirement is 0.29 kWh m−3 methane produced or 0.1 MJ energy invested per MJ−1 produced. The energy requirement could come from the digester methane directly, which would reduce the marketable RNG or an external energy source that may or may not have a carbon footprint. Assuming the average carbon emission footprint of electricity in the U.S. is 0.42 kg CO2 kWh−1 [80], using external energy would emit about 0.002 kg CO2 MJ−1 (0.06 kg CO2 m−3 CH4) to heat and operate a digester from an alternative energy source. Under this scenario, fewer GHGs would be emitted to the atmosphere than are offset under average yields across 2018 and 2019 for the 60 and 120 kg ha−1 scenarios (Figure 3). If the energy requirement came from the digester itself, marketable RNG would be reduced by <3% of total production. In this scenario, though marketable methane is reduced, both the 60 and 120 kg ha−1 fertilizer treatment emitted fewer GHGs to the atmosphere than the offset and emitted less than if an alternative energy source was used to heat and run the digester (Figure 3).
However, it is important to emphasize how quickly these benefits are lost if there are fugitive methane emissions from the digester system. As an example, if the digester leaks just 2% of the methane production, the carbon benefit of digested fertilized rye can disappear. These potential fugitive methane emissions were calculated by multiplying RNG use (Figure 3) by percent leakage and then by the 20-year global warming potential for methane of 84. Typical losses reportedly range from 0.2% to 2%, though >10% has also been reported when upgrading biogas [81]. This reinforces the need for a well-managed digester that does not leak. This analysis does not consider the potential carbon benefit of downstream carbon capture and storage processes such as bioenergy carbon capture and storage in underground geologic formations for permanent storage. Roughly 40% of the biogas carbon is CO2, and when upgrading biogas to RNG, that CO2 is currently typically emitted to the atmosphere. Capturing and storing this concentrated CO2 can greatly enhance the GHG mitigation potential of anaerobically digesting rye.

4. Conclusions

Double-cropping winter rye offers an opportunity to sustainability intensify global agriculture and provide new revenue streams. Agronomic management can change the composition of rye, affecting its value for livestock forage or renewable bioenergy. Fertilizing rye improved fresh rye forage quality. Anaerobic digestion further improved forage quality, but the palatability and nutritional benefits of rye digestate need further evaluation in livestock trials. Additionally, more research is needed to understand the forage quality and field-based N2O emissions effects of nitrogen rates between 60 and 120 kg ha−1.
The revenue for rye in an integrated biogas system ranged from USD 307 Mg−1 and USD 502 with an average of USD 402 Mg−1 based on an increase in crude protein and accounting for degradation of dry matter during digestion, as well as payments of RNG earning revenue from D3 RINs. However, these D3 RINs drive the economics of this process, as their value is over ten times the value of wholesale natural gas and over 50 times the value of the soil carbon credit for planting a cover or double-crop. With revenue from the soil carbon credit less than 1% of the overall revenue, these additional revenues from bioenergy and/or livestock feed may be a major incentive.
However, there are substantial costs associated with financing and operating a digester and connecting to a commercial natural gas network for rye, so the revenue potential does not represent the profitability of this system. An individual farmer selling to a centralized digester system would need to receive 22% to 36% of the energy value that their feedstock generated in the digester system for the opportunity to be profitable. Future research should consider the costs of biogas and digestate separation, upgrading and transport, ideally with actual cost data from commercial-scale operations.
Many on-farm digester systems are new entrepreneurial units that are allowing the next generation of farm owners to grow the farm business and portfolio of revenue streams. They offer an alternative market for farmers interested in profiting from cover crops in regions where current markets do not exist or are limited, and a synergistic opportunity for bioenergy alongside livestock production. Revenue was significantly improved with fertilization, again suggesting fertilization may be beneficial in double-crop rye systems. Rye and potentially other small grain double crops should be considered in efforts to sustainably intensify agriculture, especially if the GHG footprint of nitrogen fertilizer and N2O emissions can be reduced by climate-smart manufacturing and farm management, and the remaining emissions offset by a well-managed bioenergy system.

Supplementary Materials

The following supporting information can be downloaded at: https://www.mdpi.com/article/10.3390/agriculture12101691/s1, Table S1: Renewable natural gas (RNG) market price data; Table S2: Aboveground biomass reported by rye planting method (drilled after corn harvest, broadcast and overseeded into R6 corn, and broadcast and incorporated after corn harvest) and by fertilizer nitrogen application rate (N rate) (0, 60, 120 kg N ha−1) reported in [37]; Table S3: Mean values (with standard deviation) for rye crude protein (CP), available protein (CP minus acid detergent insoluble crude protein), rumen degradable protein (RDP), rumen undegradable protein (RUP), acid detergent fiber (ADF), neutral detergent fiber (NDF), lignin, relative feed value (RFV), total digestible nutrients (TDN), net energy for lactation (NEL), net energy for gain (NEG) and net energy for maintenance (NEM) for the two growing seasons, 2018 and 2019; Table S4: Mean values (with standard deviation) for rye revenue potential for the two growing seasons, 2018 and 2019; Figure S5: Equations used to calculate net greenhouse gas emissions (GHG) in Figure 3 for fertilized and unfertilized rye in a renewable natural gas (RNG) bioenergy system; Table S6: Forage quality indicators of composite winter rye samples before (day 0) and after (day 21) twenty-one days of digestion in bench-scale experiments from winter rye harvested in PA, including crude protein (CP) (%), acid detergent fiber (ADF) (%), neutral detergent fiber (NDF) (%), total digestible nutrients (TDN) (%), net energy for lactation (NEL) (%), net energy for maintenance (NEM) (%), net energy for grain (NEG) (%), relative feed value (RFV) (%), and lignin (%); Figure S7: Actual feed price compared to price predicted by regression; Figure S8: Actual and predicted feed prices ($ Mg-1) for feeds (alfalfa hay, wheat straw soybean meal, and corn gluten feed) modeled by regression, and average estimated price for winter rye digestate for each planting method and nitrogen fertilizer application rate; Figure S9: Regression residuals by predicted plot, studentized residuals with 95% simultaneous limits (shown in red) and individual limits (shown in green), and model parameter estimates and their significance. Supplemental material references [82,83,84,85,86,87,88,89].

Author Contributions

S.H. wrote the original draft manuscript. T.L.R., T.C.K., D.L.K. and R.W.M. conceptualized the project, designed the field experiment, and provided project administration. S.H. and T.L.R. designed the forage, bioenergy, and GHG experiment and analyses. S.H.L. conceptualized the regression analysis. S.H. and H.W. formally analyzed the data. S.H. and T.L.R. visualized data. R.W.M. and K.K. carried out the field experiment and managed the field plots. R.W.M., K.K. and S.H. collected field data. T.L.R. and R.W.M. acquired funding. T.L.R., S.H.L., H.W., P.L.O., B.D.E., T.C.K., D.L.K. and R.W.M., reviewed and edited the manuscript. All authors have read and agreed to the published version of the manuscript.

Funding

This research was supported by the U.S. Department of Energy under the Bioenergy Technologies Office, award number EE0007088, and by Sustainable Agricultural Systems grant number 2020-68012-31824 from the United States Department of Agriculture National Institute of Food and Agriculture. The USDA is an equal opportunity provider and employer. Mention of trade names or commercial products in this article is solely for the purpose of providing specific information and does not imply recommendation or endorsement by the USDA.

Institutional Review Board Statement

Not applicable.

Data Availability Statement

Study data are available upon request from the corresponding author.

Acknowledgments

The authors appreciate the essential assistance of A. Radke, B. Knutson, O. Smith, D. Carney, A. Morrow, H. Stauffer, and numerous student workers for site establishment, collecting data, sample analysis, and managing the field plots, Antony, A. and DiMarco, K. for sample analysis of bench-scale rye experiments, and A. Radke for regression analysis.

Conflicts of Interest

The authors declare no conflict of interest.

References

  1. Rockström, J.; Steffen, W.; Noone, K.; Persson, Å.; Chapin, F.S.; Lambin, E.; Lenton, T.M.; Scheffer, M.; Folke, C.; Schellnhuber, H.J.; et al. Planetary boundaries: Exploring the safe operating space for humanity. Ecol. Soc. 2009, 14, 1–32. [Google Scholar] [CrossRef]
  2. Rockström, J.; Williams, J.; Daily, G.; Noble, A.; Matthews, N.; Gordon, L.; Wetterstrand, H.; DeClerck, F.; Shah, M.; Steduto, P.; et al. Sustainable intensification of agriculture for human prosperity and global sustainability. Ambio 2017, 46, 4–17. [Google Scholar] [CrossRef] [PubMed] [Green Version]
  3. Baulcombe, D.; Crute, I.; Davies, B.; Dunwell, J.; Gale, M.; Jones, J.; Pretty, J.; Sutherland, W.; Toulmin, C. Reaping the Benefits: Science and the Sustainable Intensification of Global Agriculture; The Royal Society: London, UK, 2009. [Google Scholar]
  4. Project Drawdown Sustainable Intensification for Smallholders. Available online: https://drawdown.org/solutions/sustainable-intensification-for-smallholders (accessed on 12 September 2021).
  5. FAO. Sustainable Crop Production Intensification in FAO. Available online: http://www.fao.org/agriculture/crops/thematic-sitemap/theme/spi/scpi-home/framework/sustainable-intensification-in-fao/en/ (accessed on 12 September 2021).
  6. Launay, C.; Houot, S.; Frédéric, S.; Girault, R.; Levavasseur, F.; Marsac, S.; Constantin, J. Incorporating energy cover crops for biogas production into agricultural systems: Benefits and environmental impacts. A review. Agron. Sustain. Dev. 2022, 42, 1–24. [Google Scholar] [CrossRef]
  7. Osborne, R. Cereal Rye Cover Crop Can Stretch Your Spring Feed Supply; Michigan State University Extension: East Lansing, MI, USA, 2011. [Google Scholar]
  8. Shao, X.; Dimarco, K.; Richard, T.L.; Lynd, L.R. Winter rye as a bioenergy feedstock: Impact of crop maturity on composition, biological solubilization and potential revenue. Biotechnol. Biofuels 2015, 8, 1–10. [Google Scholar] [CrossRef] [PubMed] [Green Version]
  9. Heggenstaller, A.H.; Anex, R.P.; Liebman, M.; Sundberg, D.N.; Gibson, L.R. Productivity and nutrient dynamics in bioenergy double-cropping systems. Agron. J. 2008, 100, 1740–1748. [Google Scholar] [CrossRef]
  10. Krueger, E.S.; Ochsner, T.E.; Baker, J.M.; Porter, P.M.; Reicosky, D.C. Rye-corn silage double-cropping reduces corn yield but improves environmental impacts. Agron. J. 2012, 104, 888–896. [Google Scholar] [CrossRef] [Green Version]
  11. Ramcharan, A.M.; Richard, T.L. Carbon and nitrogen environmental trade-offs of winter rye cellulosic biomass in the Chesapeake Watershed. Agric. Syst. 2017, 156, 85–94. [Google Scholar] [CrossRef]
  12. Blanco-Canqui, H.; Sindelar, M.; Wortmann, C.S.; Kreikemeier, G. Aerial interseeded cover crop and corn residue harvest: Soil and crop impacts. Agron. J. 2017, 109, 1344–1351. [Google Scholar] [CrossRef]
  13. Moore, E.B.; Wiedenhoeft, M.H.; Kaspar, T.C.; Cambardella, C.A. Rye Cover Crop Effects on Soil Quality in No-Till Corn Silage-Soybean Cropping Systems. Soil Sci. Soc. Am. J. 2014, 78, 968–976. [Google Scholar] [CrossRef]
  14. Malone, R.W.; Obrycki, J.F.; Karlen, D.L.; Ma, L.; Kaspar, T.C.; Jaynes, D.B.; Parkin, T.B.; Lence, S.H.; Feyereisen, G.W.; Fang, Q.X.; et al. Harvesting fertilized rye cover crop: Simulated revenue, net energy, and drainage nitrogen loss. Agric. Environ. Lett. 2018, 3, 170041. [Google Scholar] [CrossRef]
  15. Liebert, J.A.; DiTommaso, A.; Ryan, M.R. Rolled mixtures of barley and cereal rye for weed suppression in cover crop-based organic no-till planted soybean. Weed Sci. 2017, 65, 426–439. [Google Scholar] [CrossRef]
  16. Barnes, J.P.; Putnam, A.R. Rye residues contribute weed suppression in no-tillage cropping systems. J. Chem. Ecol. 1983, 9, 1045–1057. [Google Scholar] [CrossRef]
  17. Willick, I.R.; Tanino, K.K.; Gusta, L.V. The impact of global climate change on the freezing tolerance of winter cereals in Western Canada. J. Agron. Crop Sci. 2021, 207, 88–99. [Google Scholar] [CrossRef]
  18. Haramoto, E.R. Species, seeding rate, and planting method influence cover crop services prior to soybean. Agron. J. 2019, 111, 1068–1078. [Google Scholar] [CrossRef]
  19. Fisher, K.A.; Momen, B.; Kratochvil, R.J. Is broadcasting seed an effective winter cover crop planting method? Agron. J. 2011, 103, 472–478. [Google Scholar] [CrossRef]
  20. USDA. 2017 Census of Agriculture; United States Department of Agriculture National Agricultural Statistics Service: Washington, DC, USA, 2019; Volume 1. [Google Scholar]
  21. Wicks, N. Cover Crops as Cash Crops: Farmers Angle to Profit off the Practice; Agri-Pulse Communications, Inc.: Washington, DC, USA, 2021. [Google Scholar]
  22. Feyereisen, G.W.; Camargo, G.G.T.; Baxter, R.E.; Baker, J.M.; Richard, T.L. Cellulosic biofuel potential of a winter rye double crop across the U.S. corn-soybean belt. Agron. J. 2013, 105, 631–642. [Google Scholar] [CrossRef] [Green Version]
  23. USDA; NASS. National Agricultural Statistics Service. Available online: https://data.nal.usda.gov/dataset/nass-quick-stats (accessed on 12 September 2021).
  24. 110th Congress. Energy Independence and Security Act of 2007; United States Public Law 110–140; United States Congress: Washington, DC, USA, 2007. Available online: https://www.congress.gov/bill/110th-congress/house-bill/6 (accessed on 12 September 2021).
  25. Pleima, B. Biogas to RNG Projects: What, Why and How; Biocycle: Emmaus, PA, USA, 2019; Volume 60, p. 38. Available online: https://www.biocycle.net/2019/03/11/biogas-rng-projects/ (accessed on 12 September 2021).
  26. Valli, L.; Rossi, L.; Fabbri, C.; Sibilla, F.; Gattoni, P.; Dale, B.; Kim, S.; Ong, R.; Bozzetto, S. Greenhouse gas emissions of electricity and biomethane produced using the BiogasdonerightTM system: Four case studies from Italy. Biofuels Bioprod. Biorefining 2017, 11, 847–860. [Google Scholar] [CrossRef]
  27. VERBIO VERBIO Nevada Biorefinery. Available online: https://www.verbio.us/project/verbio-nevada-biorefinery/ (accessed on 2 February 2022).
  28. Robertson, G.P.; Hamilton, S.K.; Barham, B.L.; Dale, B.E.; Izaurralde, R.C.; Jackson, R.D.; Landis, D.A.; Swinton, S.M.; Thelen, K.D.; Tiedje, J.M. Cellulosic biofuel contributions to a sustainable energy future: Choices and outcomes. Science 2017, 356, eaal2324. [Google Scholar] [CrossRef] [Green Version]
  29. Lark, T.J.; Hendricks, N.P.; Smith, A.; Pates, N.; Spawn-Lee, S.A.; Bougie, M.; Booth, E.G.; Kucharik, C.J.; Gibbs, H.K. Environmental Outcomes of the U.S. Renewable Fuel Standard. Proc. Natl. Acad. Sci. USA 2022, 119, e2101084119. [Google Scholar] [CrossRef]
  30. Field, J.L.; Richard, T.L.; Smithwick, E.A.H.; Cai, H.; Laser, M.S.; LeBauer, D.S.; Long, S.P.; Paustian, K.; Qin, Z.; Sheehan, J.J.; et al. Robust paths to net greenhouse gas mitigation and negative emissions via advanced biofuels. Proc. Natl. Acad. Sci. USA 2020, 117, 201920877. [Google Scholar] [CrossRef] [PubMed]
  31. Jacobson, M.; Helsel, Z. NEWBio Switchgrass Budget for Biomass Production. Penn State Ext. 2014, 1–4. Available online: https://extension.psu.edu/newbio-switchgrass-budget-for-biomass-production (accessed on 12 September 2021).
  32. Roley, S.S.; Tank, J.L.; Tyndall, J.C.; Witter, J.D. How cost-effective are cover crops, wetlands, and two-stage ditches for nitrogen removal in the Mississippi River Basin? Water Resour. Econ. 2016, 15, 43–56. [Google Scholar] [CrossRef] [Green Version]
  33. Balkcom, K.S.; Duzy, L.M.; Arriaga, F.J.; Delaney, D.P.; Watts, D.B. Fertilizer management for a rye cover crop to enhance biomass production. Agron. J. 2018, 110, 1233–1242. [Google Scholar] [CrossRef]
  34. Blanco-Canqui, H.; Ruis, S.J.; Proctor, C.A.; Creech, C.F.; Drewnoski, M.E.; Redfearn, D.D. Harvesting cover crops for biofuel and livestock production: Another ecosystem service? Agron. J. 2020, 112, 2373–2400. [Google Scholar] [CrossRef]
  35. Jones, B. Factors for converting percentages of nitrogen in foods and feeds into percentages of proteins. U. S. Dep. Agric. 1941, 183, 22. [Google Scholar]
  36. Ball, D.; Hoveland, C.; Lacefield, G. Southern Forages; Potash & Phosphate Institute, Foundation for Agronomic Research: Atlanta, GA, USA, 1991. [Google Scholar]
  37. Malone, R.; O’Brien, P.; Herbstritt, S.; Emmett, B.; Karlen, D.; Kaspar, T.; Kohler, K.; Radke, A.; Lence, S.; Wu, H.; et al. Rye-Soybean Double Crop: Planting Method and N Fertilization Effects in the north central U.S. Renew. Agric. Food Syst. 2022, 37, 445–456. [Google Scholar] [CrossRef]
  38. Dairy One Forage Lab. Equi-Analytical, Zooquarius Analytical Procedures; Dairy One: Ithaca, NY, USA, 2019; pp. 1–10. Available online: https://dairyone.com/download/forage-forage-lab-analytical-procedures/ (accessed on 12 September 2021).
  39. Van-Soest, P.J.; Robertson, J.B.; Lewis, B.A. Methods for Dietary Fiber, Neutral Detergent Fiber, and Nonstarch Polysaccharides in Relation to Animal Nutrition. J. Dairy Sci. 1991, 74, 3583–3597. [Google Scholar] [CrossRef]
  40. Weiss, W.P.; Conrad, H.R.; St. Pierre, N.R. A theoretically-based model for predicting total digestible nutrient values of forages and concentrates. Anim. Feed Sci. Tech 1992, 39, 95–110. [Google Scholar] [CrossRef]
  41. Weiss, W.P. Theoretical models for estimating available energy concentrations in ruminant feeds. Cons. Des Prod. Anim. Du Que. 1995, 76, 1802–1811. [Google Scholar]
  42. Hall, M.B.; Hoover, W.H.; Jennings, J.P.; Miller, T.K. Webster Method for partitioning neutral detergent soluble carbohydrates. J. Sci. Food Agric. 1999, 79, 2081. [Google Scholar] [CrossRef]
  43. Van-Soest, P.J.; Fox, D.G. Discounts for net energy and protein-fifth revision. Proc. Cornell Nutr. Conf. Feed. Manuf. 1992, 54, 40–68. [Google Scholar]
  44. National Research Council. Nutrient Requirements of Dairy Cattle: Seventh Revised Edition; The National Academies Press: Washington, DC, USA, 2001. [Google Scholar] [CrossRef] [Green Version]
  45. Klopfenstein, T.J.; Erickson, G.E.; Bremer, V.R. Board invited review: Use of distillers by-products in the beef cattle feeding industry. J. Anim. Sci. 2008, 86, 1223–1231. [Google Scholar] [CrossRef] [PubMed]
  46. CME Group Henry Hub Natural Gas Futures Quotes. Available online: https://www.cmegroup.com/trading/energy/natural-gas/natural-gas.html (accessed on 12 September 2021).
  47. U.S. Energy Information Administration Henry Hub Natural Gas Spot Price. Available online: https://www.eia.gov/dnav/ng/hist/rngwhhdm.htm (accessed on 10 July 2021).
  48. US EPA RIN Trades and Price Information. Available online: https://www.epa.gov/fuels-registration-reporting-and-compliance-help/rin-trades-and-price-information (accessed on 14 July 2021).
  49. Gilbert, F.; Marcotte, P.; Savard, G. Mixed-logit network pricing. Comput. Optim. Appl. 2013, 57, 105–127. [Google Scholar] [CrossRef]
  50. Cabrera, V.E.; Armentano, L.; Shaver, R.D. University of Madison-Wisconsin FeedVal v6.0. Available online: https://dairymgt.info/tools/feedval_12_v2/index.php (accessed on 10 September 2021).
  51. North Dakota State University Combined Feed Value and Protein and Energy Calculator. Available online: https://www.ndsu.edu/agriculture/ag-hub/ag-topics/crop-production/tools/combined-feed-value-and-protein-and-energy-calculator (accessed on 10 September 2021).
  52. USDA; AMS. National Weekly Feedstuff Wholesale Prices September 2021. United States Department of Agriculture Market News. 2021. Available online: https://www.ams.usda.gov/mnreports/ms_gr852.txt (accessed on 14 September 2021).
  53. Dairy One Feed Composition Library 2021. Available online: https://dairyone.com/services/forage-laboratory-services/feed-composition-library/ (accessed on 14 September 2021).
  54. Indigo Ag Enrich your soil, Improve Your Profit. Available online: https://www.indigoag.com/for-growers/indigo-carbon (accessed on 14 September 2021).
  55. Camargo, G.G.T.; Ryan, M.R.; Richard, T.L. Energy Use and Greenhouse Gas Emissions from Crop Production Using the Farm Energy Analysis Tool. Bioscience 2013, 63, 263–273. [Google Scholar] [CrossRef] [Green Version]
  56. U.S. EIA Carbon Dioxide Emissions Coefficients. Available online: https://www.eia.gov/environment/emissions/co2_vol_mass.php (accessed on 14 September 2021).
  57. Olson, R.A.; Frey, K.J. Nutritional Quality of Cereal Grains: Genetic and Agronomic Improvement; American Society of Agronomy: Madison, WI, USA, 1987; p. 0923. ISBN 089118. [Google Scholar]
  58. Cazzato, E.; Laudadio, V.; Tufarelli, V. Effects of harvest period, nitrogen fertilization and mycorrhizal fungus inoculation on triticale (×Triticosecale Wittmack) forage yield and quality. Renew. Agric. Food Syst. 2012, 27, 278–286. [Google Scholar] [CrossRef]
  59. Waramit, N.; Moore, K.J.; Fales, S.L. Forage quality of native warm-season grasses in response to nitrogen fertilization and harvest date. Anim. Feed Sci. Technol. 2012, 174, 46–59. [Google Scholar] [CrossRef]
  60. Richner, J.M.; Kallenbach, R.L.; Roberts, C.A. Dual use switchgrass: Managing switchgrass for biomass production and summer forage. Agron. J. 2014, 106, 1438–1444. [Google Scholar] [CrossRef]
  61. Kering, M.K.; Guretzky, J.A.; Interrante, S.M.; Butler, T.J.; Biermacher, J.T.; Mosali, J. Harvest timing affects switchgrass production, forage nutritive value, and nutrient removal. Crop Sci. 2013, 53, 1809–1817. [Google Scholar] [CrossRef] [Green Version]
  62. Guretzky, J.A.; Biermacher, J.T.; Cook, B.J.; Kering, M.K.; Mosali, J. Switchgrass for forage and bioenergy: Harvest and nitrogen rate effects on biomass yields and nutrient composition. Plant Soil 2011, 339, 69–81. [Google Scholar] [CrossRef] [Green Version]
  63. Obour, A.K.; Harmoney, K.; Holman, J.D. Nitrogen fertilizer application effects on switchgrass herbage mass, nutritive value and nutrient removal. Crop Sci. 2017, 57, 1754–1763. [Google Scholar] [CrossRef]
  64. Landry, E.; Janovicek, K.; Lee, E.A.; Deen, W. Winter Cereal Cover Crops for Spring Forage in Temperate Climates. Agron. J. 2019, 111, 217–223. [Google Scholar] [CrossRef] [Green Version]
  65. Binder, J.; Karsten, H.; Beegle, D.; Dell, C. Manure injection and rye double cropping increase nutrient recovery and forage production. Agron. J. 2020, 112, 2968–2977. [Google Scholar] [CrossRef]
  66. McGill, R.; Tukey, J.W.; Larsen, W.A. Variations of box plots. Am. Stat. 1978, 32, 12–16. [Google Scholar]
  67. Helsel, Z.R.; Thomas, J.W. Small Grains for Forage. J. Dairy Sci. 1987, 70, 2330–2338. [Google Scholar] [CrossRef]
  68. Lestingi, A.; Bovera, F.; De Giorgio, D.; Ventrella, D.; Tateo, A. Effects of tillage and nitrogen fertilisation on triticale grain yield, chemical composition and nutritive value. J. Sci. Food Agric. 2010, 90, 2440–2446. [Google Scholar] [CrossRef]
  69. Dairy One Small Grain Forage, Accumulated Crop Years: 5/1/2004–4/30/2020. Available online: https://dairyone.com/services/forage-laboratory-services/feed-composition-library/interactive-feed-composition-libraries/ (accessed on 10 September 2021).
  70. Miller, Z.; Bertram, M.; Hoffman, P. Fall forage rye for dairy heifers and dry cows. Univ. Wis. Ext. 2010, 12, 1–2. [Google Scholar]
  71. Kanter, M.; Sheaffer, C.; Porter, P.; Krueger, E.; Ochsner, T. Growth Stage Influences Forage Yield and Quality of Winter Rye. Forage Grazinglands 2011, 9, 1–7. [Google Scholar] [CrossRef] [Green Version]
  72. Coblentz, W.K.; Akins, M.S.; Cavadini, J.S.; Jokela, W.E. Net effects of nitrogen fertilization on the nutritive value and digestibility of oat forages. J. Dairy Sci. 2017, 100, 1739–1750. [Google Scholar] [CrossRef] [Green Version]
  73. Sträuber, H.; Bühligen, F.; Kleinsteuber, S.; Dittrich-Zechendorf, M. Carboxylic acid production from ensiled crops in anaerobic solid-state fermentation—Trace elements as pH controlling agents support microbial chain elongation with lactic acid. Eng. Life Sci. 2018, 18, 447–458. [Google Scholar] [CrossRef] [Green Version]
  74. Zhao, X.; Liu, J.; Liu, J.; Yang, F.; Zhu, W.; Yuan, X.; Hu, Y.; Cui, Z.; Wang, X. Effect of ensiling and silage additives on biogas production and microbial community dynamics during anaerobic digestion of switchgrass. Bioresour. Technol. 2017, 241, 349–359. [Google Scholar] [CrossRef]
  75. Field, J.A.; Caldwell, J.S.; Jeyanayagam, S.; Reneau, R.B.; Kroontje, W.; Collins, E.R. Fertilizer recovery from anaerobic digesters. Trans. Am. Soc. Agric. Eng. 1984, 27, 1871–1876. [Google Scholar] [CrossRef]
  76. Topper, P.; Graves, R.; Richard, T. The fate of nutrients and pathogens during anaerobic digestion of dairy manure. Coll. Agric. Sci. Coop. Ext. 2006. [Google Scholar]
  77. Goldstein, N. Farm digester progress in Pennsylvania. Biocycle 2013, 54, 26. [Google Scholar]
  78. Shcherbak, I.; Millar, N.; Robertson, P. Global Metaanalysis of the Nonlinear Response of Soil Nitrous Oxide (N2O) Emissions to Fertilizer Nitrogen. Proc. Natl. Acad. Sci. USA 2014, 111, 9199–9204. [Google Scholar] [CrossRef] [Green Version]
  79. May, A.J. Cotreatment Enhanced Anaerobic Digestion of Lignocellulosic Biomass; Penn State University: University Park, PA, USA, 2020. [Google Scholar]
  80. Energy Information Administration How Much Carbon Dioxide Is Produced Per Kilowatthour of U.S. Electricity Generation. Available online: https://www.eia.gov/tools/faqs (accessed on 12 September 2021).
  81. Börjesson, P.; Berglund, M. Environmental systems analysis of biogas systems-Part II: The environmental impact of replacing various reference systems. Biomass Bioenergy 2007, 31, 326–344. [Google Scholar] [CrossRef]
  82. Mirsky, S.B.; Ryan, M.R.; Teasdale, J.R.; Curran, W.S.; Reberg-Horton, C.S.; Spargo, J.T.; Wells, M.S.; Keene, C.L.; Moyer, J.W. Overcoming Weed Management Challenges in Cover Crop–Based Organic Rotational No-Till Soybean Production in the Eastern United States. Weed Technol. 2013, 27, 193–203. [Google Scholar] [CrossRef]
  83. Koehler-Cole, K.; Elmore, R.W.; Blanco-Canqui, H.; Francis, C.A.; Shapiro, C.A.; Proctor, C.A.; Ruis, S.J.; Heeren, D.M.; Irmak, S.; Ferguson, R.B. Cover Crop Productivity and Subsequent Soybean Yield in the Western Corn Belt. Agronomy 2020, 112, 2649–2663. [Google Scholar] [CrossRef]
  84. Koehler-Cole, K.; Elmore, R.W. Seeding rates and productivity of broadcast interseeded cover crops. Agronomy 2020, 10, 1723. [Google Scholar] [CrossRef]
  85. Supple, D. Units & Conversions Fact Sheet. Available online: http://web.mit.edu/mit_energy (accessed on 12 September 2021).
  86. Engle, C.; Anderson, V. Combined Feed Value and Protein and Energy Calculator. Available online: https://www.ag.ndsu.edu/carringtonrec/news/combined-feed-value-and-protein-and-energy-calculator (accessed on 12 September 2021).
  87. Gessner, H. Feed Value Calculator. Available online: https://extension.sdstate.edu/feed-nutrient-calculator (accessed on 12 September 2021).
  88. Jones, C. Feed Value Calculator Spreadsheet. Available online: https://extension.psu.edu/feed-value-calculator-spreadsheet (accessed on 12 September 2021).
  89. Halfman, B.; Akins, M.; Sterry, R. Feedstuff Nutrient Cost Calculator. Available online: https://fyi.extension.wisc.edu/wbic/files/2018/11/UW-feed-cost-tool-10-30-18.xlsx (accessed on 12 September 2021).
Figure 1. Fresh rye crude protein (% dry matter) for 2019, reported by fertilizer rate (0 kg N ha−1, 60 kg N ha−1, 120 kg N ha−1). The lower and upper hinges in the box plot correspond to the first and third quartiles (the 25th and 75th percentiles). The upper and lower whiskers extend from the hinge to 1.5 times the interquartile range (IQR), and outliers are plotted as black dots as in [66].
Agriculture 12 01691 g001
Figure 2. Revenue (USD ha−1) from renewable natural gas (RNG), calculated as the sum of the commodity fossil natural gas price and D3 RINs (from Supplemental Information Table S1), leftover digestate sold as a feed protein coproduct (feed protein) (from Supplemental Information Figure S7), and carbon credit for planting a cover crop. The nutrient composition of fresh rye is reported in Table 1, and the increase in crude protein measured with digestion (used to estimate feed protein value) is reported in Supplemental Information Table S6). Yields are reported in Malone et al. [37]. Revenue results are grouped by fertilizer rate (0 kg N ha−1, 60 kg N ha−1, and 120 kg N ha−1).
Agriculture 12 01691 g002
Figure 3. Greenhouse gas (GHG) emissions and carbon storage (kg CO2-eq ha−1) for a winter rye bioenergy system when external energy is used to heat and power the digester. Data are reported by fertilizer rate (0 kg ha−1, 60 kg ha−1, and 120 kg ha−1). They include emissions from the combustion of renewable natural gas (emissions from combustion of RNG), emissions from heating and running the digester (emissions from digester energy requirements), GHG emissions associated with farm inputs and operations modeled in the Farm Energy Analysis Tool (FEAT) (except fertilizer N2O), fertilizer N2O emissions, carbon stored in digestate (digestate), carbon stored in soil (soil), and fossil natural gas emissions offset by RNG. Net GHG emissions (shown as white diamonds) are the sum of all categories (emissions and carbon stored). GHG emissions modeled in FEAT are reported in Malone et al. (2022). See Supplemental Information Figure S5) for detailed equations.
Agriculture 12 01691 g003
Table 1. Mean values (with standard deviation) for rye crude protein (CP), available protein (CP minus acid detergent insoluble crude protein), rumen degradable protein (RDP), rumen undegradable protein (RUP), acid detergent fiber (ADF), neutral detergent fiber (NDF), lignin, relative feed value (RFV), total digestible nutrients (TDN), net energy for lactation (NEL), net energy for gain (NEG) and net energy for maintenance (NEM) for the two growing seasons, 2018 and 2019 (n = 54 in 2018 and n = 54 in 2019, n = 18 per treatment). Data are reported here by rye fertilizer nitrogen application rate (N rate) (0, 60, and 120 kg N ha−1) and by interaction between planting method (drilled after corn harvest, broadcast and overseeded into R6 corn, and broadcast and incorporated after corn harvest) and N rate. Data reported by planting method can be found in Supplemental Information Table S3.
Forage Quality Constituent20182019
0 kg N ha−160 kg N ha−1120 kg N ha−1pPlanting Method × N Rate0 kg N ha−160 kg N ha−1120 kg N ha−1pPlanting Method × N Rate
CP (%)9.31 (1.06) a11.29 (0.60) b11.91 (0.59) c*****8.29 (0.54) a10.57 (1.23) b12.36 (1.12) c***ns
Available P (%)8.91 (1.03) a10.88 (0.53) b11.41 (0.63) c*****7.94 (0.57) a10.13 (1.15) b11.76 (1.05) c***ns
RDP (%)78.11 (2.35) b76.78 (3.57) ab74.94 (3.06) a**ns74.89 (2.63)74.56 (1.89)75.94 (2.24)nsns
RUP (%)21.89 (2.35) a23.22 (3.57) ab25.06 (3.06) b**ns25.11 (2.63)25.44 (1.89)24.06 (2.24)nsns
ADF (%)42.93 (1.52) b42.19 (1.03) ab41.88 (1.11) a**ns43.47 (1.09) a45.51 (1.41) b45.74 (1.52) b***ns
NDF (%)65.82 (2.09) b64.71 (1.41) b63.43 (1.77) a***ns68.42 (1.51)69.12 (2.21)67.83 (1.65)nsns
Lignin (%)5.70 (0.39) b5.57 (0.65) ab5.19 (0.49) a*ns5.21 (0.30)5.41 (0.82)5.61 (0.51)nsns
RFV (%)78.56 (4.10) a80.67 (2.77) ab82.67 (3.63) b***ns74.89 (2.78) b72.17 (3.71) a73.06 (3.00) ab*ns
TDN (%)57.06 (1.51) a58.17 (1.15) b58.72 (0.96) b***ns55.72 (1.13)55.06 (1.59)55.11 (1.37)nsns
NEL (%)4.39 (0.26) a4.55 (0.15) b4.68 (0.16) b***ns4.08 (0.19)3.98 (0.30)4.10 (0.20)nsns
NEG (%)2.27 (0.22) a2.42 (0.15) b2.49 (0.12) b**ns2.06 (0.16)2.00 (0.23)2.01 (0.19)nsns
NEM (%)4.60 (0.24) a4.76 (0.17) b4.84 (0.13) b**ns4.37 (0.17)4.31 (0.25)4.32 (0.21)nsns
* p < 0.05; ** p < 0.01; *** p < 0.001; ns: not significant. Different letters indicate significant differences for a constituent within a specific year identified by the Tukey–Kramer post hoc test at α = 0.05 level.
Table 2. Mean values (with standard deviation) for digested rye revenue potential for the two growing seasons, 2018 and 2019. Data are reported for a system producing both RNG, a carbon credit, and a high protein feed coproduct (RNG system) for a range of RNG prices (low estimate to high estimate). Data are reported here by rye fertilizer nitrogen application rate (N rate) (0, 60, and 120 kg N ha−1). Data reported by planting method can be found in Supplemental Information Table S4.
FactorLevel20182019
RNG System
(Low Estimate)
RNG System
(High Estimate)
RNG System
(Low Estimate)
RNG System
(High Estimate)
USD Mg−1USD Mg−1USD Mg−1USD Mg−1
N Rate0 kg N ha−1306.78 (4.67)487.4 (4.67)307.93 (3.58) a488.55 (3.58) a
60 kg N ha−1306.99 (3.89)487.61 (3.89)317.91 (4.29) b498.53 (4.29) b
120 kg N ha−1306.94 (4.30)487.56 (4.30)321.22 (4.71) b501.84 (4.71) b
pnsns******
Planting Method × N Ratensnsnsns
*** p < 0.001; ns: not significant. Different letters indicate significant differences within column identified by the Tukey–Kramer post hoc test at α = 0.05 level.
Publisher’s Note: MDPI stays neutral with regard to jurisdictional claims in published maps and institutional affiliations.

