Article

Effects of Straw Mulching Thickness on the Soil Health in a Temperate Organic Vineyard

1
State Key Laboratory of Vegetation and Environmental Change, Institute of Botany, The Chinese Academy of Sciences, Beijing 100093, China
2
College of Resources and Environment, University of Chinese Academy of Sciences, Beijing 100049, China
3
College of Agriculture, Xinjiang Agricultural University, Urumqi 830052, China
4
Henan Zhongyuan Organic Agriculture Research Institute Co., Ltd., Zhengzhou 450000, China
*
Author to whom correspondence should be addressed.
Agriculture 2022, 12(11), 1751; https://doi.org/10.3390/agriculture12111751
Submission received: 20 September 2022 / Revised: 13 October 2022 / Accepted: 17 October 2022 / Published: 23 October 2022
(This article belongs to the Section Agricultural Soils)

Abstract

:
Soil mulching is one of the common measures applied in organic agricultural production which could replace plastic films and protect the environment. In order to fully evaluate the effects of different straw mulching thicknesses on soil health, maize straw was mulched with the thicknesses of 0 cm (CK), 2 cm, 4 cm and 6 cm on soil surface to assess the effects on soil temperature (ST) and moisture (SM), soil pH, soil organic carbon (SOC), total nitrogen (TN), C/N, soil aggregates and soil bulk density (SBD) in a temperate organic vineyard. We found that straw mulching had a significant regulating effect, with soil moisture being elevated with increasing mulching thickness by 5.8%, 9.0% and 11.1% compared with CK. The soil SOC content increased by 3.0%, 2.4% and 2.3%. Although soil pH and C/N significantly (p < 0.05) increased, they fluctuated with increasing mulch thickness. Straw mulching also increased the content of >2 mm soil particle size and elevated the mean weight diameter (MWD) and geometric mean diameter (GMD). The increasing mulching thickness prolonged the effect on the stability of soil aggregates. The 4 cm maize straw mulching thickness has the best effect for ecologically and environmentally managing warm-temperate organic vineyards so it may have a great application prospect on a global scale.

1. Introduction

Grapes are widely planted as horticultural plants which are intensively produced globally. However, such an intensive production model does not take its negative impact on soil health into account, which decreases the sustainability of vineyard development [1]. Organic farming is believed to be environmentally friendly and has a number of ecological functions, such as improving soil quality, increasing biodiversity, reducing greenhouse gas emissions, saving energy, preventing eutrophication of water, and ensuring the safety of agricultural products [2,3,4]. In 2019, some 468,000 hectares of organic grapes were planted around the world, 85% of which were located in Europe and only 14,000 hectares in China, accounting for 3% of the world’s organic grape area and 0.19% of China’s grape area [5,6]. The development of the organic model in China has been facing various problems in terms of policy, higher labor input, marketing and production technology. Therefore, technical research needs to be strengthened to solve these problems [7,8].
China uses more than 340 billion m3 of water per year for agricultural irrigation [9]. Due to simple irrigation techniques, low irrigation efficiency and water scarcity, agricultural plants in China consume a large amount of water resources, leading to ecological and environmental problems and increasing the cost of agricultural input [10]. For instance, the core grape production area of Helan Mountain plants is 29,653 hectares and needs 1.59 billion tons of water, which is heavily dependent on the transit water resources of the Yellow River [11]. Although Shandong Province is located in the warm-temperate monsoon zone, it still faces the risk of time dimension between the water requirement and the precipitation because of the larger grape plant area and the lower matching degree of precipitation spatial and temporal distribution [5,12,13]. To avoid such kinds of shortness, farmers generally use plastic film mulching to maintain moisture and temperature, however this has led to serious plastic pollution. In addition, the production and management model of farmers is influenced by various factors, such as literacy, specialization, years of cultivation, gender and vineyard characteristics. These factors also affect famers’ behavior on the application of fertilizers, pesticides and plastic film, which can cause serious soil pollution [14,15,16]. Therefore, a safer, healthier and more sustainable grape production model is urgently needed for modern viticulture [17,18].
Soil mulching is one of the common measures in agricultural production. It is an important component of integrated organic farming management and includes grass mulching, plastic mulching and agricultural waste mulching [19,20]. The grass mulching method involves planting legumes or local herbs in the vineyard by regular mowing or no mowing [4,21,22]. Although plastic mulching is low cost and easy to use, it is difficult to be naturally depredated, which can cause microplastic pollution [23,24]. Using agricultural waste instead of plastic films not only improves the physical properties of the soil but also increases the soil nutrients. Our previous investigation revealed that the total amount of agricultural waste is abundant and contains a higher total nitrogen content, with crop straw accounting for 22.9% [25]. Agricultural waste mulching such as maize straw, oat straw, wheat straw, etc. has the function of heat preservation and water retention which could reduce environmental pollution, make full use of biomass, improve soil physical and chemical properties and the structure of soil aggregates, and increase the added value of agricultural products [19,26,27,28,29]. The rational use of straw is of great significance both in reducing environmental pollution and achieving the goal of carbon reduction and carbon neutrality [30]. Therefore, China has proposed the implementation of straw comprehensive utilization, with the goal of reaching an 86% straw comprehensive utilization rate nationwide in 2025 [31], as straw mulching is an effective way in achieving the abovementioned goals.
Straw mulching on the soil surface has been proven to have the function of improving the physical structure, chemical properties and biological properties of soil [32], and is a specific practice to adapt to future climate change and sustainability [33]. It is also an effective way of using agricultural waste for disposal [34]. The selection of mulch materials must consider local climatic conditions and integrate their impacts on agroecosystem functions and soil health [1,35]. The sustainability of production systems in viticulture is involved in economic, social and environmental aspects [8], and researchers found that financial benefit can rise from saving production costs and yield improvements [18]. In addition, the vineyard management is one of the production inputs, and the cost increases as the amount straw mulching increases [27,36]. So, there is a need to find a balance between the cost and the efficiency of the thickness of straw mulch [37]. To what extent the thickness of straw mulching can be used to obtain suitable and stable soil temperatures and moisture in vineyards, improve soil structure and health, and eliminate environmental pollution and agricultural waste pollution is the focus of this paper.
To analyze the effects of straw mulching on the physical and chemical properties of vineyards, solve the dilemma of soil pollution in the conventional model and comprehensively using straw waste, and provide a solution for global organic vineyard management, we have carried out research on the effects of different mulching thicknesses on soil health, then explored technical support for a comprehensive and correct evaluation of the effects of different soil mulching. Finally, we summarized the key indexes to provide a theoretical basis and technical support for the sustainable management of table grapes.

2. Materials and Methods

2.1. Study Area

The experiment was carried out in Jiangjiazhuang, Pingyi County, Linyi City, Shandong Province (35°26′23.13″ N, 117°49′51.58″ E) from 2019 to 2020. Large interannual differences in precipitation and temperature were observed in the study area. The highest monthly mean temperatures during the experiment were 27.6 °C in July 2019 and 27.1 °C in August 2020. The highest monthly rainfall was in August, at 509.9 mm and 442.6 mm, in 2019 and 2020, respectively. The interannual precipitation at the trial site varied considerably, with concentrated rainfall in 2019 and dispersed rainfall in 2020 (Figure 1).

2.2. Experimental Design

A gradient of thickness of 2 cm (7.06 t ha−1 y−1), 4 cm (14.13 t ha−1 y−1), and 6 cm (21.19 t ha−1 y−1) maize straw mulching treatments were set up in the vineyard under organic conditions, with the treatment without maize straw as the control (CK, 0 cm or 0 t ha−1 y−1). The maize straw was mulched on the soil surface in the budbreak stage [38]. The study was conducted using completely randomized treatments with three replicates for each treatment. The main characteristics of the sampled soil were as follows: pH 5.28, total nitrogen (TN) 0.99 mg g−1, and soil organic carbon (SOC) 6.41 mg g−1 in the 0–20 cm soil layer and pH 4.94, TN 0.58 mg g−1, SOC 3.12 mg g−1 in the 20–40 cm soil layer.

2.3. Soil Sampling and Measurements

2.3.1. Soil Properties

Soil temperature and soil moisture were measured by TR-6D (Shunkeda Ltd., Dongwan, China). The measurement period is adjusted from Sun et al. (2018) [39], whereby the measurement period in this study was five consecutive days (except rainy) in three different stages in 2019 and 2020, respectively. All the measurements were carried out at the depth of 7 cm under the soil surface.
Soil samples were taken from each of the 4 treatments in each main growing season (May–September) in 2019 and 2020 to measure the soil pH, TN and SOC at depths of 0–20 cm and 20–40 cm. The soil pH was measured by PB-10 (Sartorius, Germany), the TN was measured by the Kjeldahl method [38], and SOC was measured by the K2Cr2O7–H2SO4 digestion method [29].

2.3.2. Soil Aggregate

Soil aggregates were determined after harvest, and 0–20 cm soil samples were divided into >2 mm, 1–2 mm, 0.5–1 mm, 0.25–0.5 mm, 0.053–0.25 mm and <0.053 mm by the wet sieving method. The mean weight diameter (MWD) and geometric mean diameter (GMD) were calculated as described by Ren et al. (2022) [40].

2.3.3. Soil Bulk Density

Soil bulk density (SBD) was determined by the cutting ring method [40]. It was assessed at the end of the experiment, the 0–40 cm soil layer was divided into 8 layers. The volume of the stainless steel ring used in each plot was 100 cm3.

2.4. Statistical Analyses

Data were analyzed using EXCEL, SPSS 22.0 and OriginPro 2020 for different treatments in the same year using one-way analysis of variance (ANOVA) for significance (p < 0.05) and independent samples t-test for significance (p < 0.05) for different years in the same treatment. OriginPro 2020 was used to make the graphs.

3. Results

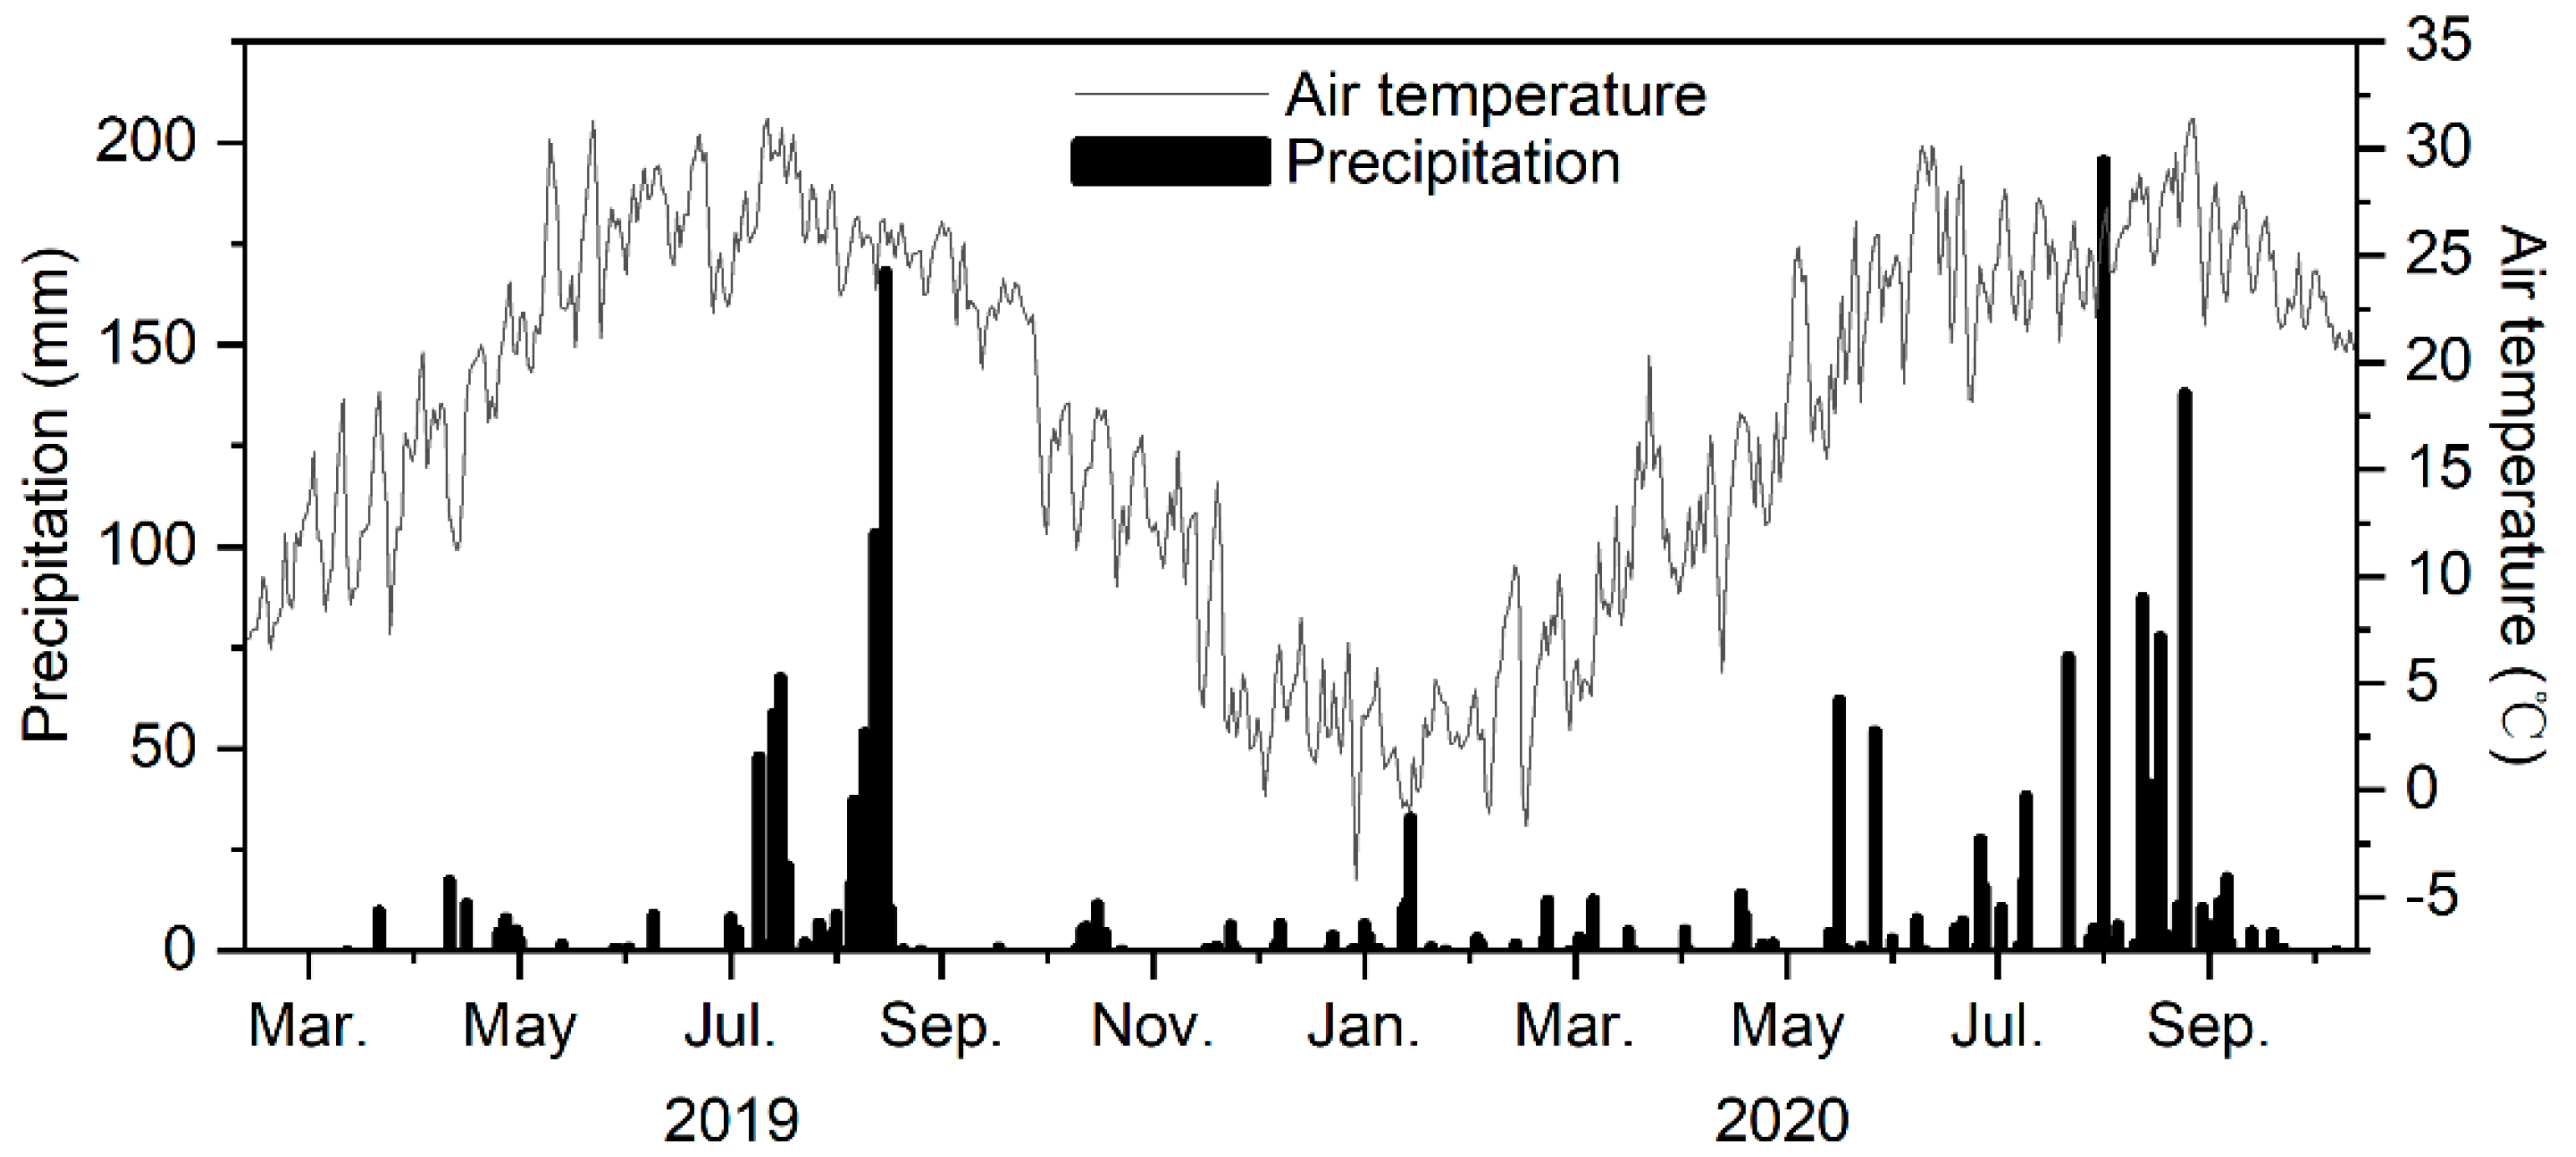
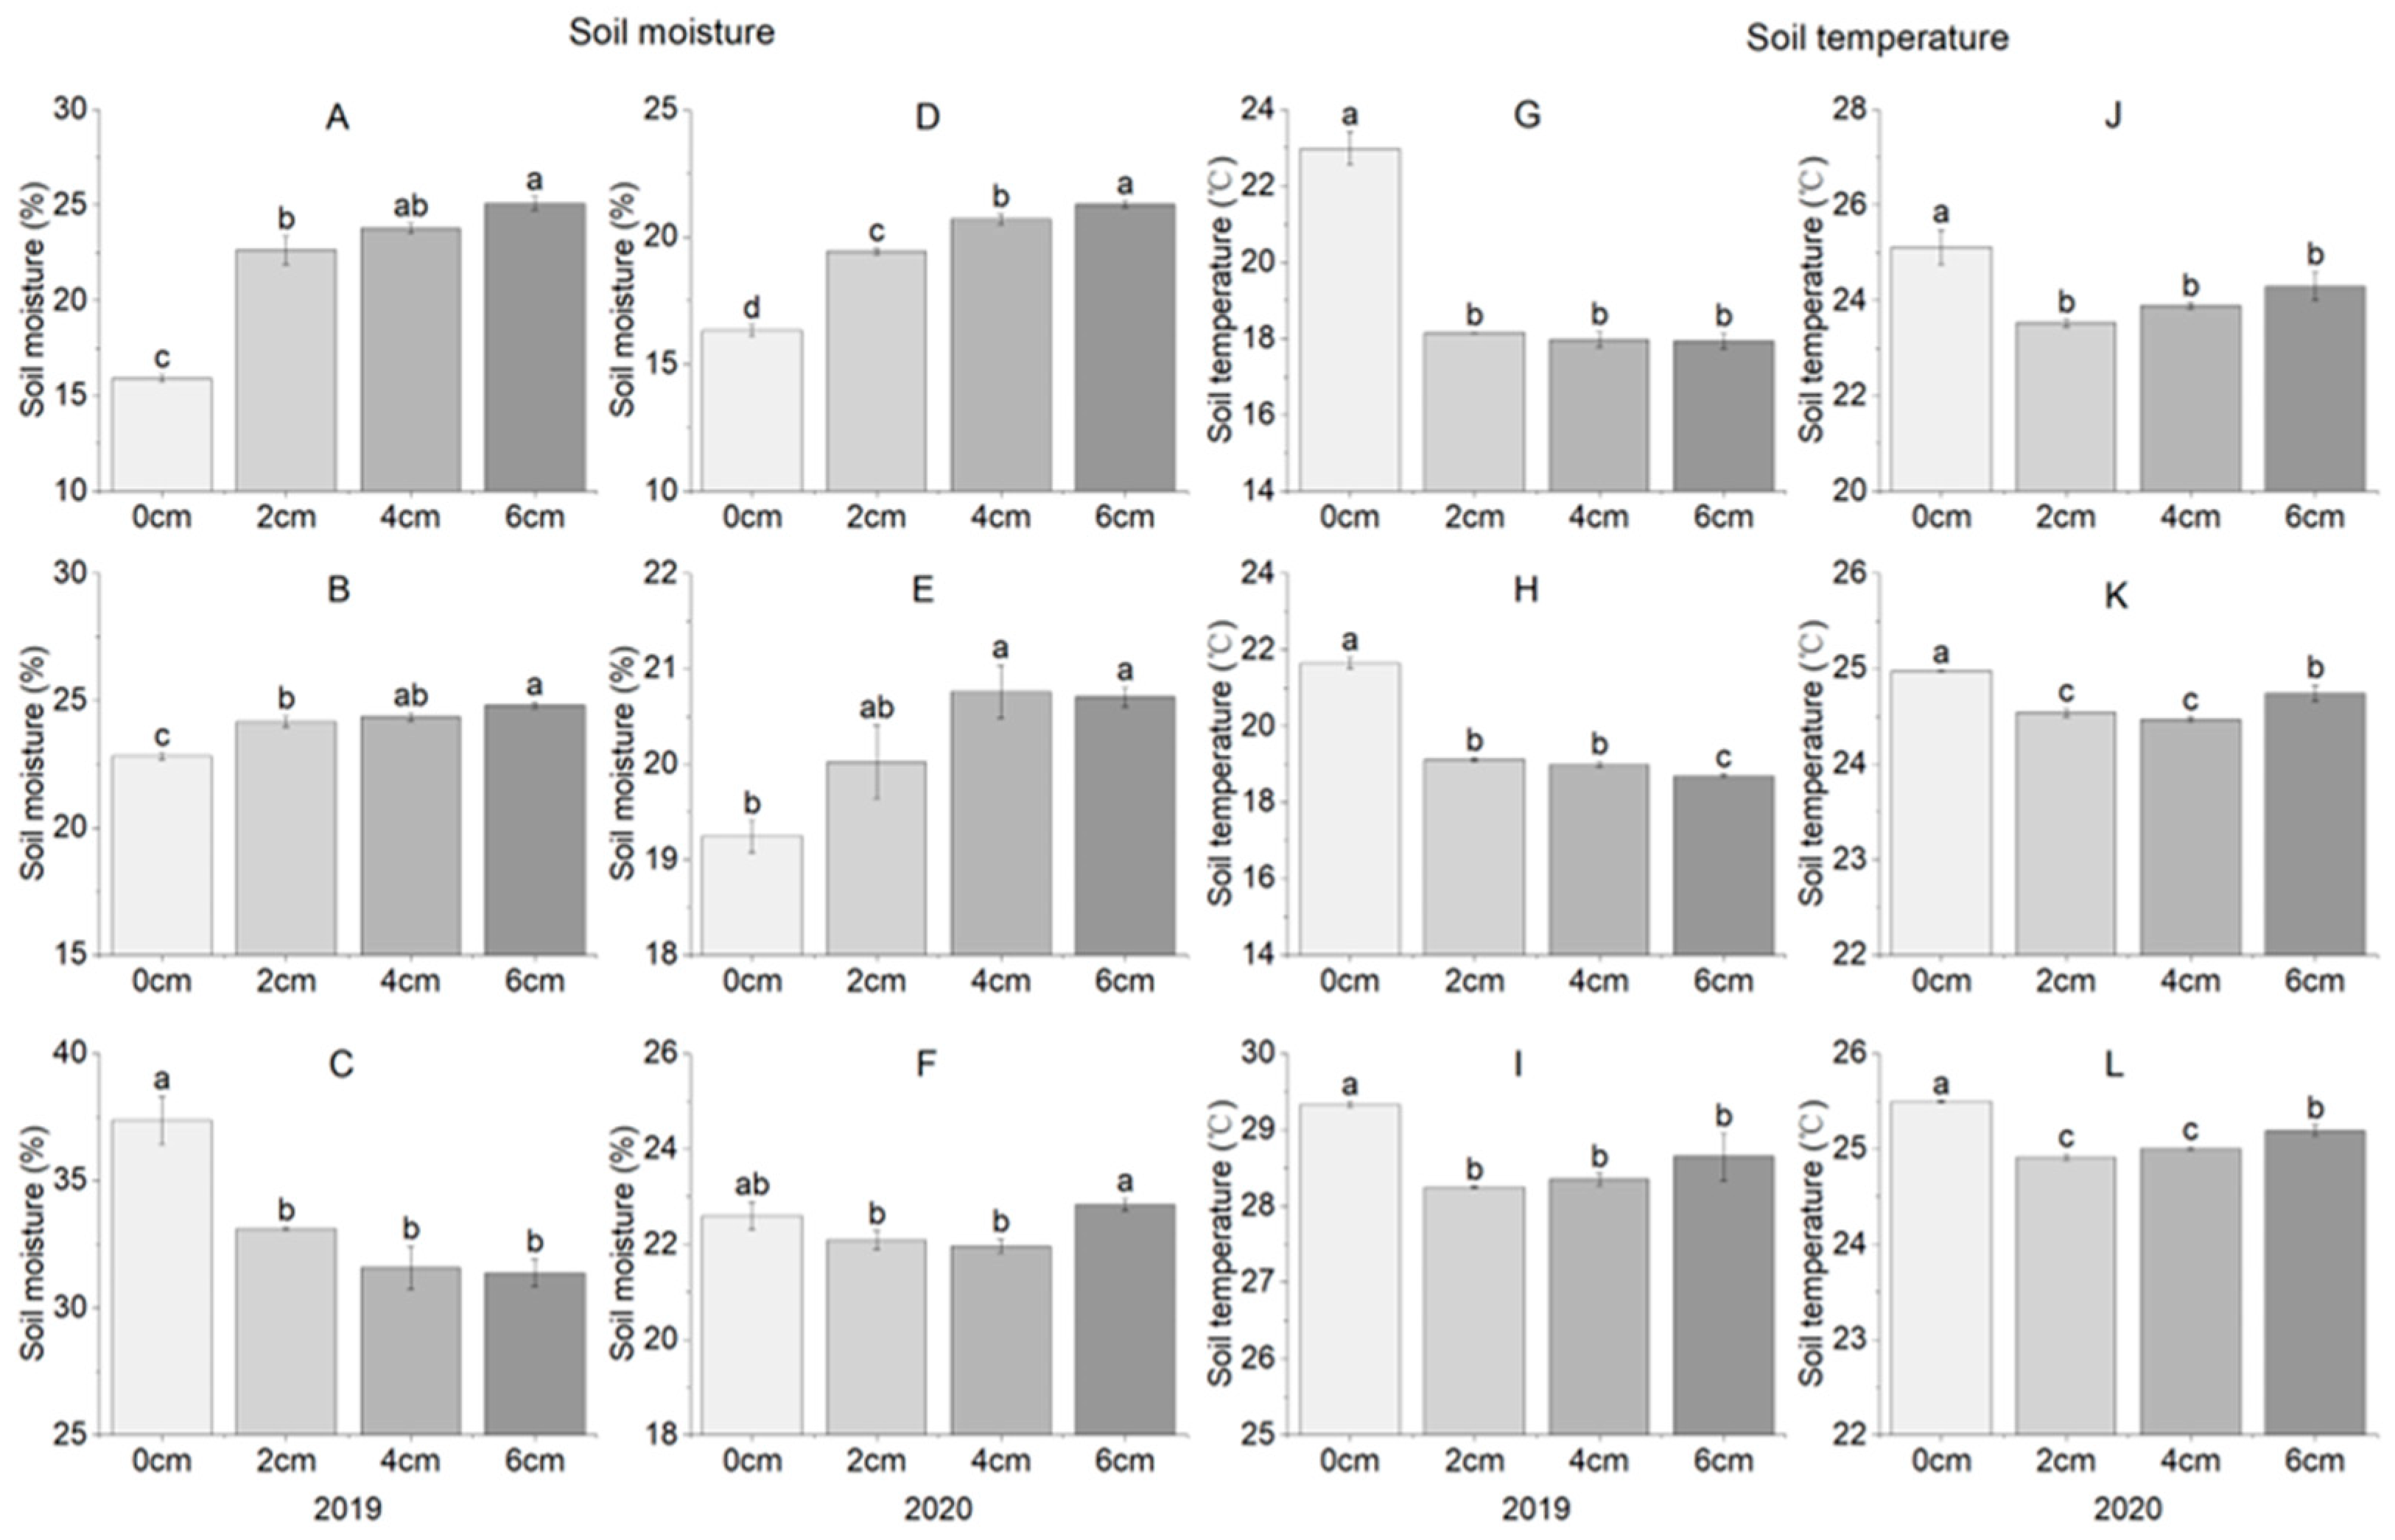
3.1. Soil Temperature and Moisture

The ranges of soil moisture variation for the different treatments were 15.93–37.37% for CK, 19.43–33.11% for the 2 cm straw mulching treatment, 20.69–31.57% for the 4 cm straw mulching treatment and 20.71–31.39% for 6 cm straw mulching treatment. The ranges of soil moisture variation for different treatments were 21.45%, 13.68%, 10.89% and 10.68% for the 0 cm, 2 cm, 4 cm, and 6 cm straw mulching treatments, respectively. Soil moisture in the different treatments varied in three ways over time. First, it was noted that CK treatment was lower than in 2 cm, 4 cm, and 6 cm straw mulching treatments in lower temperature environments. Soil moisture was significantly (p < 0.05) lower in CK than in the 2 cm, 4 cm, and 6 cm straw mulching treatments. The soil moisture increased with the increasing mulch thickness (Figure 2A,B,D). Second, soil moisture fluctuated with increasing mulch thickness in medium temperature environments. It increased first and then decreased without significant difference (p > 0.05) in the 2 cm, 4 cm, and 6 cm straw mulching treatments (Figure 2E), and it decreased first in the 2 cm and 4 cm straw mulching treatments without significant difference (p > 0.05) and then significantly (p < 0.05) increased the soil moisture in the 6 cm straw mulching treatment (Figure 2F). Third, CK had significantly (p < 0.05) higher soil moisture than in the 2 cm, 4 cm and 6 cm straw mulching treatments in higher temperature and large precipitation environments (Figure 2C). The ranges of temperature variation among treatments were 21.65–29.33 °C for CK, 18.15–28.25 °C for 2 cm straw mulching treatment, 17.98–28.35% for 4 cm straw mulching treatment and 17.94–28.64 °C for 6 cm straw mulching treatment. CK was significantly (p < 0.05) higher than 2 cm, 4 cm, and 6 cm straw mulching treatments in soil temperatures at different periods (Figure 2G–L). We found that soil temperature decreased (Figure 2G,H) or increased (Figure 2I,J,L) with increasing mulch thickness. However, sometimes it still fluctuated, with 4 cm straw mulching treatment being the peak of soil temperature (Figure 2K). In addition, 6 cm straw mulching treatment and 2 cm, 4 cm mulching treatments had significant differences (p < 0.05) in Figure 2H,K,L. In total, the trend was more obvious in 2020. The average soil moisture of the 2 cm, 4 cm and 6 cm straw mulching treatments increased with increasing mulching thickness by 5.8%, 9.0% and 11.1% of CK and was decreased by 3.4%, 2.9% and 1.8%, respectively, on average soil temperature.

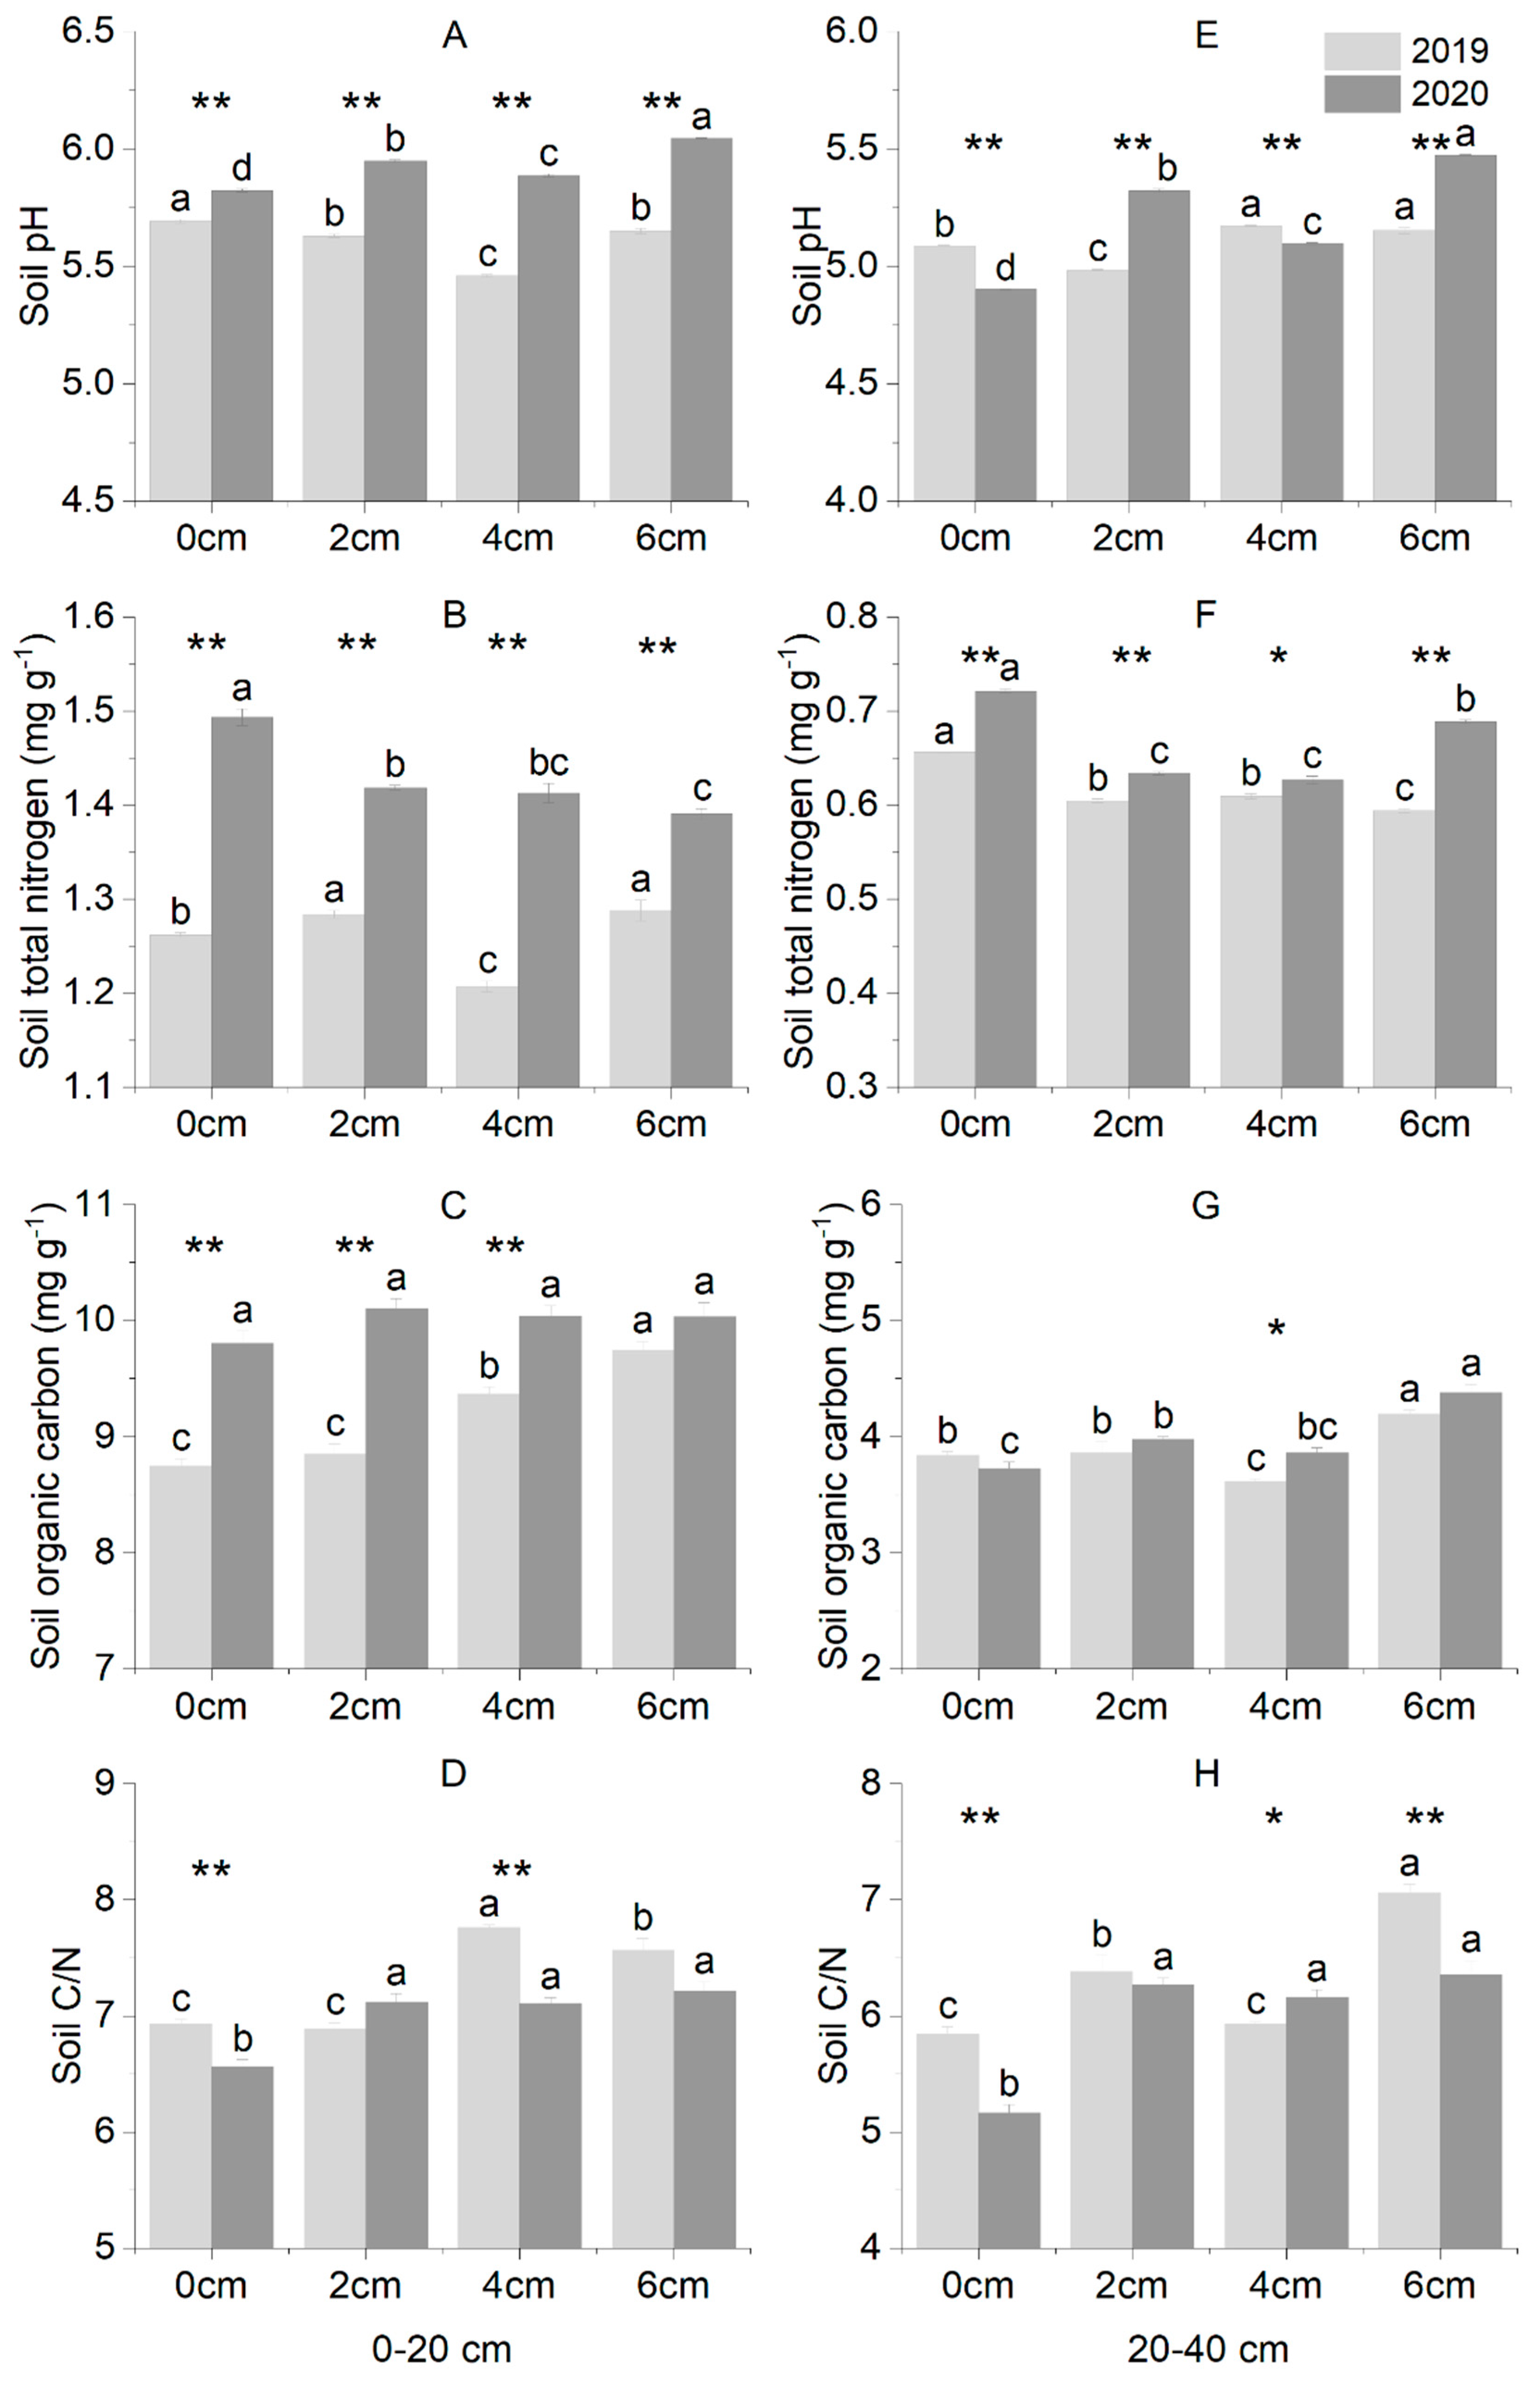
3.2. Soil Properties
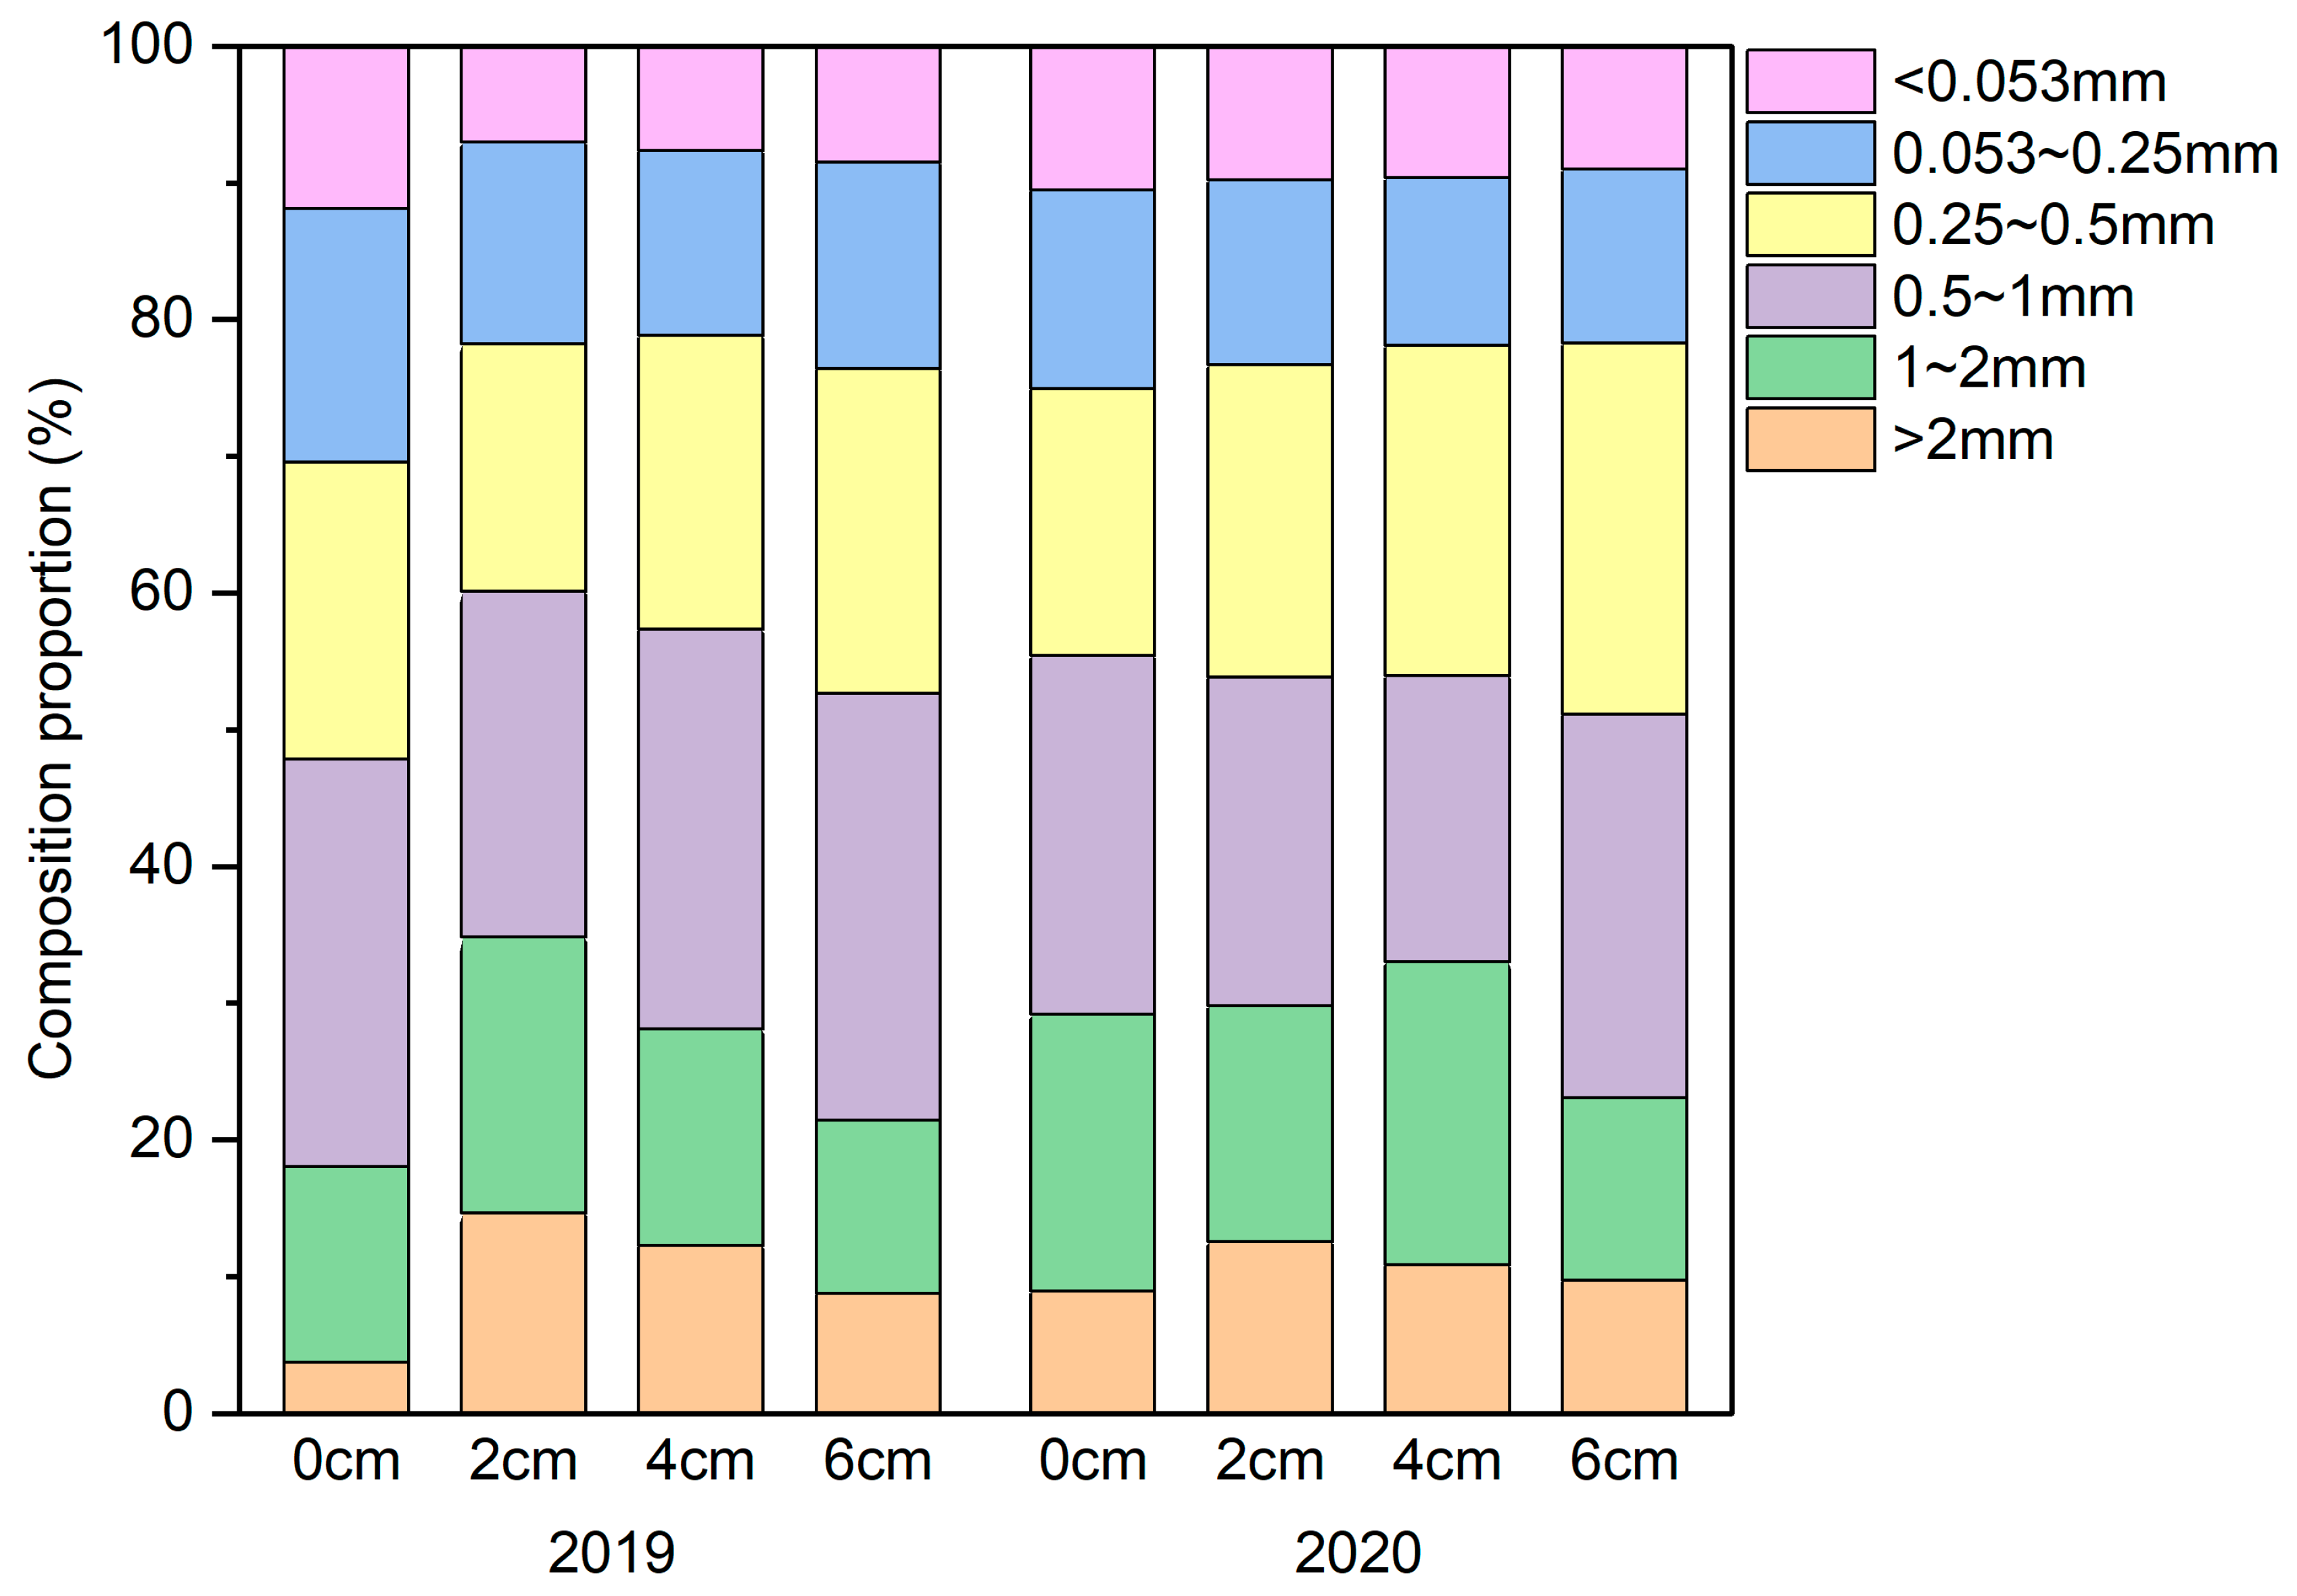
The soil pH, TN, SOC and C/N were all higher in the 0–20 cm soil layer than in the 20–40 cm soil layer (Figure 3). Soil pH decreased and then increased with increasing mulch thickness in the 0–20 cm soil layer. The soil pH was significantly (p < 0.05) higher in CK than in the 2 cm, 4 cm, and 6 cm straw mulching treatments by 1.1%, 4.1% and 0.71%, respectively, in 2019. In contrast, it was significantly (p < 0.05) higher in the 2 cm, 4 cm, and 6 cm straw mulching treatments than in CK by 2.2%, 1.1% and 3.8%, respectively, in the year of 2020 (Figure 3A). In the 20–40 cm soil layer, the soil pH in the 6 cm straw mulching treatment was significantly (p < 0.05) higher than that in the CK and 2 cm treatments. Straw mulching also had a significant (p < 0.05) effect on TN. For instance, in 2020, the TN content decreased significantly (p <0.05) with increasing straw mulch thickness by 5.0%, 5.4% and 6.9%, respectively, with 6 cm straw mulching treatment having the lowest value of 1.39 mg g−1. TN from 20–40 cm was significantly (p < 0.05) higher in the CK treatment than in the 2 cm, 4 cm, and 6 cm treatments. In the 0–20 cm soil layer, TN increased during the two years and was 0.23 mg g−1, 0.13 mg g−1, 0.21 mg g−1 and 0.10 mg g−1 for the 0 cm, 2 cm, 4 cm, and 6 cm straw mulching treatments, respectively. For the 20–40 cm soil layer, they were 0.07 mg g−1, 0.03 mg g−1, 0.02 mg g−1 and 0.09 mg g−1, respectively (Figure 3B,F). Straw mulching had a significant effect on SOC. In 2019, the SOC content of the 0–20 cm soil increased with increasing mulching thickness by 1.2%, 7.1% and 11.4%, respectively. The 4 cm and 6 cm straw mulching treatments had significantly higher SOC than CK, by 0.62 mg g−1 and 1.0 mg g−1, respectively. However, in 2020, there was no significant (p > 0.05) difference among different treatments. CK had the lowest SOC, and the 2 cm, 4 cm, and 6 cm treatments were higher by 3.0%, 2.4% and 2.3%, respectively, than CK. For the 20–40 cm soil layer, SOC was significantly (p < 0.05) higher in the 6 cm straw mulching treatment than in CK (Figure 3C,G). Straw mulching also had a significant effect on the soil C/N, fluctuating with the increasing straw mulching thickness. The 4 cm and 6 cm straw mulching treatments were found to have significantly (p < 0.05) higher C/N in the 0–20 cm soil layer than in CK in 8.27–11.97% (Figure 3D), and the soil C/N in the 2 cm and 6 cm straw mulching treatments was significantly (p < 0.05) higher than the CK in the 20–40 cm soil layer.

3.3. Soil Aggregate

Among the different particle sizes, the soil composition proportion was the highest in the 0.5–1 mm range in all treatments except for the 4 cm straw mulching treatment in 2020 (Figure 4). The 4 cm straw mulching treatment had the highest particle size in the 0.25–0.5 mm range (Table 1). Among the >2 mm soil particle sizes, the percentage of agglomerate fractions decreased with increasing straw mulch, with the lowest being in CK. Nevertheless, for those <0.25 mm soil particle sizes, CK had a higher percentage than the 2 cm, 4 cm, and 6 cm straw mulching treatments. Among all the soil agglomerate fractions, CK was significantly (p < 0.05) higher than the 2 cm, and 4 cm straw mulching treatments in <0.053 mm particles in 2019, however there was no significant (p > 0.05) difference in 2020. Comparing the changes in composition proportion between the two experimental years, all treatments and decreased the proportion of 0.5–1 mm and 0.053–0.25 mm particle sizes.
Both the mean weight diameter (MWD) and geometric mean diameter (GMD) of the soil decreased slightly with the increasing mulch thickness, and they were all higher than those of CK. The treatment from the 2 cm straw mulching was significantly (p < 0.05) higher than CK in 2019, but there was no significant difference (p > 0.05) in 2020. MWD of 2 cm straw mulching decreased by 0.03 mm and 0.08 mm, respectively, and GMD decreased by 0.04 mm and 0.06 mm, respectively, compared with CK in 2019 and 2020. Meanwhile, 6 cm straw mulching treatment slightly increased either GMD or MWD in both years (Figure 5).

3.4. Soil Bulk Density

There was no significant (p > 0.05) difference among the values of soil bulk density (SBD) in the different treatments. The SBD increased with the increasing soil depth. The average SBD of CK was the lowest, with a value of 1.62 g cm−3. However, those of the 2 cm, 4 cm, and 6 cm straw mulching treatments were all at 1.65 g cm−3 (Table 2).

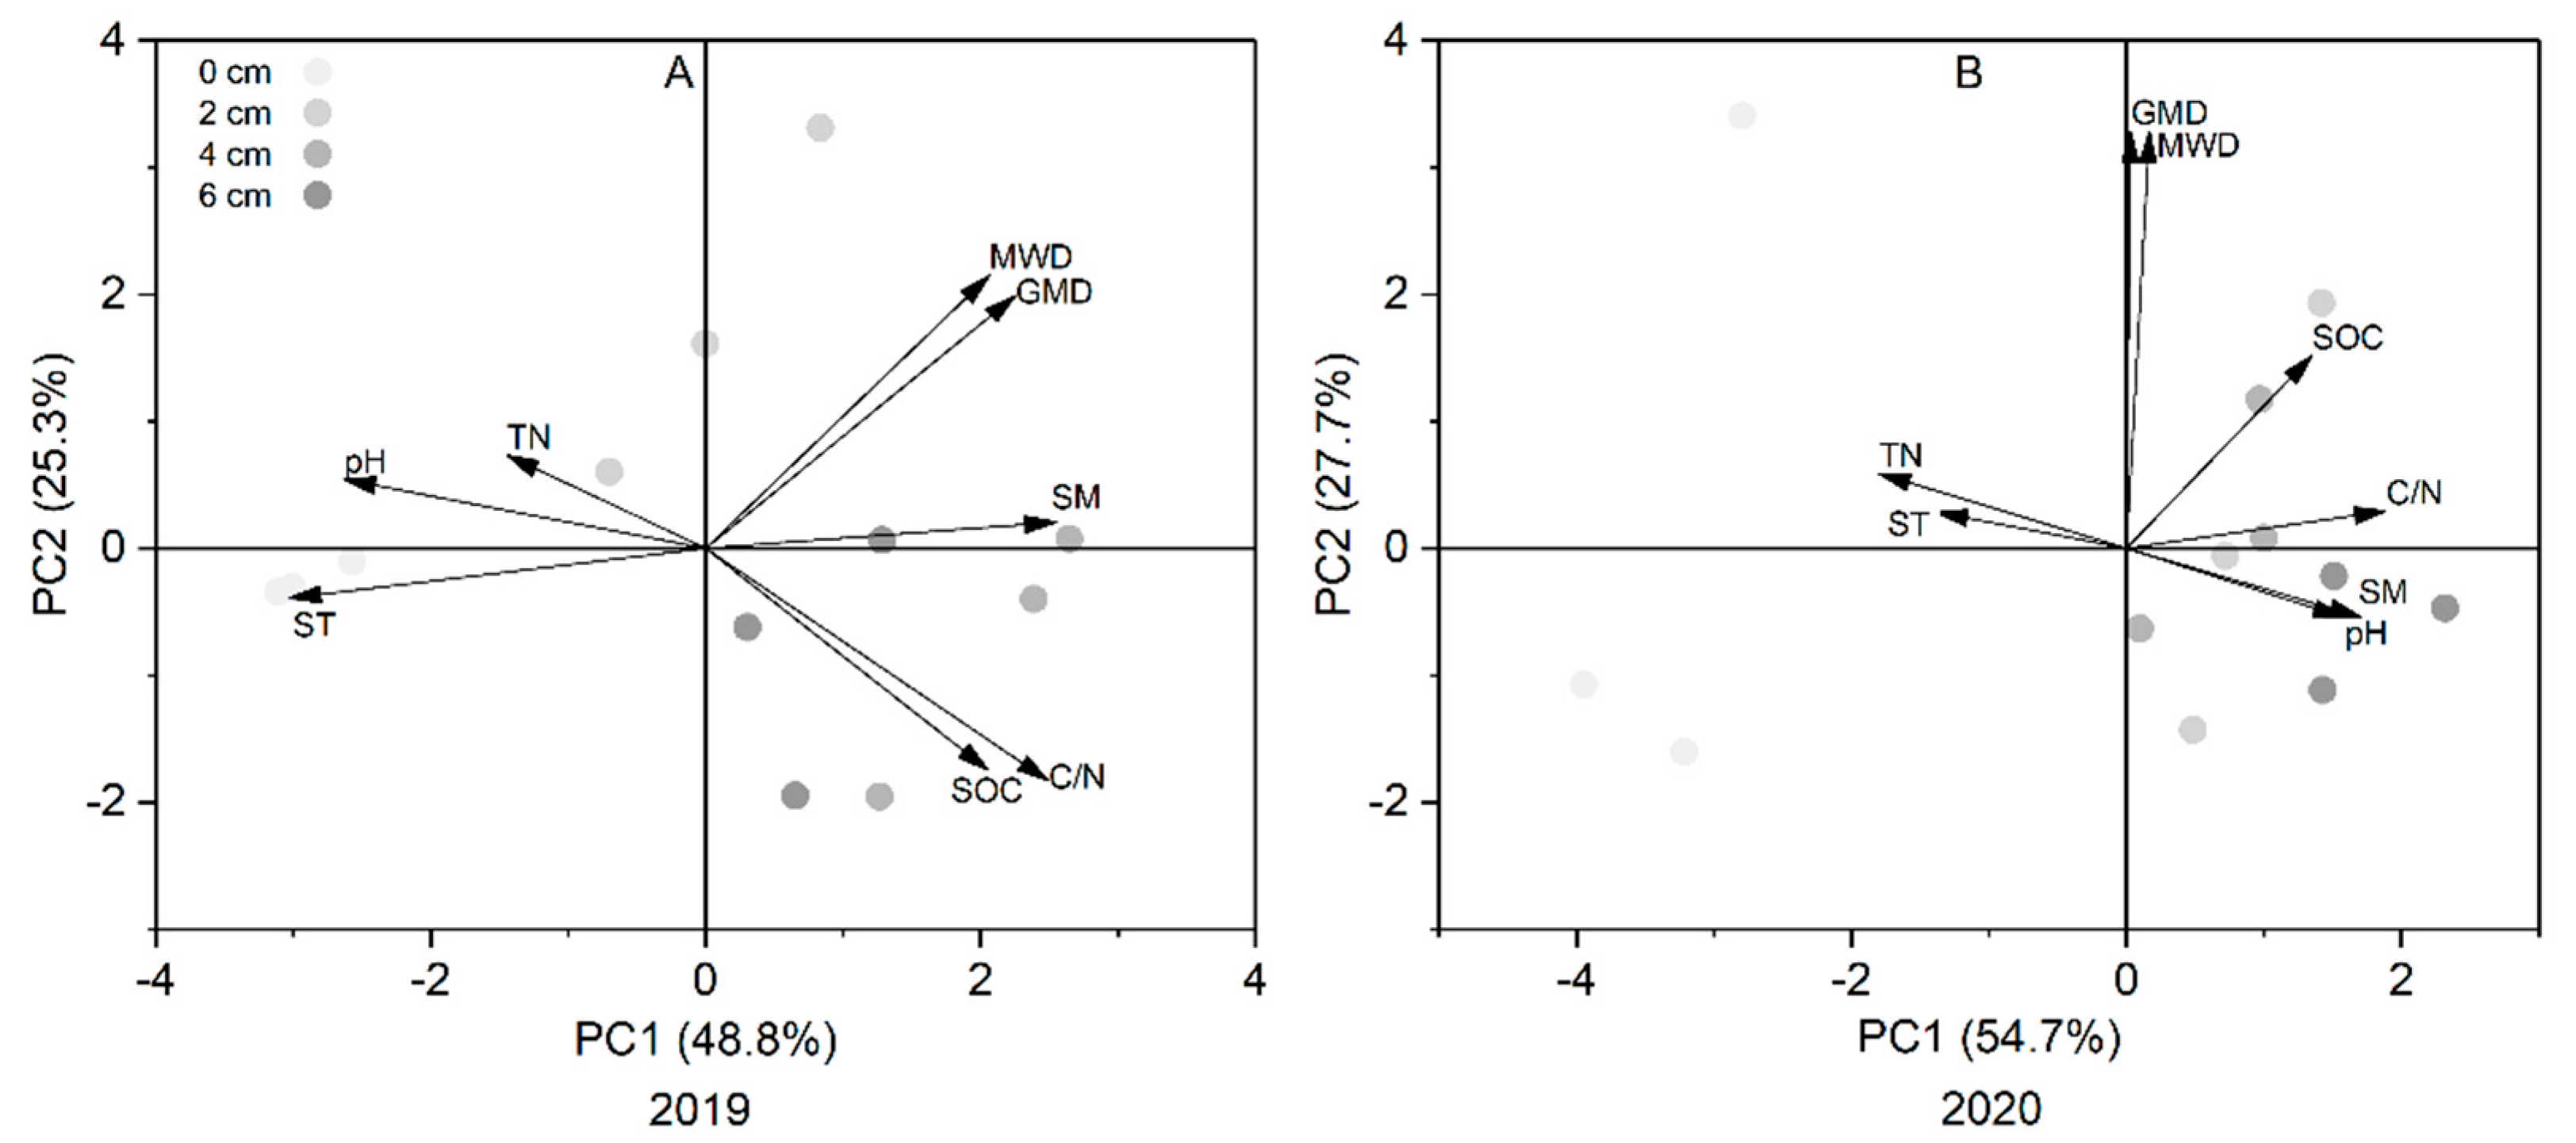
3.5. Principal Component Analysis of Environmental Factors

The eigenvalue percent of PC1 and PC2 was observed as 48.8% and 25.3% in 2019, and it increased to 54.7% and 27.7%, respectively, in 2020 (Figure 6A,B). CK treatment was positively correlated with soil temperature and TN and negatively correlated with soil moisture, C/N and SOC, while the 6 cm straw mulching treatment was positively correlated with soil moisture and soil C/N and negatively correlated with soil temperature and TN. Soil pH was positively correlated with CK and negatively correlated with the 4 cm and 6 cm straw mulching treatments in the first year, while the opposite was true in the second year. Table 3 shows the results of the principal component analysis of the soil quality indicators.

4. Discussion

Soil temperature and moisture are influenced by weather conditions. The precipitation intensity under a warming climate may threaten grape quality and yield [41,42]. In our experiment, straw mulching treatments had great effects on regulating soil temperature and moisture (Figure 2). Compared with CK treatment, the soil moisture increased along with the thickness of straw mulching, which was consistent with the results of previous studies [29]. When rainfall is concentrated, straw mulching can maintain soil moisture in a stabilized range, while the soil moisture from CK is too high and easily causes soil erosion [37]. The straw mulching reduced the soil temperature and could keep the soil temperature stable [43], so straw mulching could reduce the effects of extreme weather such as cold waves, storms, and heatwaves, and CK had the highest daily ranges of soil temperature and exist those threaten of extreme weather [44,45]. The ideal hydrothermal conditions maintained by the straw mulch could accelerate straw decomposition, consume agricultural waste and reduce environmental disturbance from agricultural production [46,47].
Maize straw mulching had a significant advantage in increasing SOC and C/N contents (Figure 3), which would improve soil microbial community structure [48,49]. In this experiment, SOC in the 2 cm, 4 cm, and 6 cm straw mulching treatments was higher than that in CK (Figure 3). In 2019, SOC increased with increasing straw mulching thickness, and in 2020, TN decreased with increasing straw mulching thickness, but C/N was increased in both years. The increase in C/N is caused by the release of carbon from the decomposition of maize straw at a faster rate than nitrogen [50]. The decomposition rate of straw mulch was rapid in the beginning by decomposing the easily decomposed material, and then decreased in decomposing lignin and cellulose [51,52] which provided a stable cover for the soil. The stable soil environment under straw mulch increases soil urease and neutral phosphatase activity and plant-available soil N and Olsen-P content, improves soil nutrient content and promotes plant growth [53]. As a result, the straw decomposition process improves the physical and chemical properties of the soil, promotes the development and stability of agglomerates and causes changes in crop growth characteristics [54].
The status of soil aggregates determines soil health [40]. The higher stability of soil aggregates can strengthen the stability of intra-aggregate and the water infiltration capacity [43]. Our research was consistent with previous research showing that straw mulching improved the uniformity of nutrient distribution for different particle sizes [49]. Now we further found that with the increasing straw mulching, the range of soil composition proportion increased (Figure 4). For the composition proportion of soil aggregates, the proportion of >2 mm soil particle size played a key role in shaping SOC stocks [55], and the aggregates could be better bound under straw addition [56]. Our findings displayed that straw mulching increased the large agglomerate fractions, with 2 cm straw mulching treatment being the highest of the four treatments (Table 1). The proportion of >2 mm soil particle size decreased with increasing straw mulch thickness in the two years. It decreased in the 2 cm and 4 cm treatments with 2.1% and 1.39%, but increased in the 6 cm treatment with 1%, which illustrates that the higher thickness of straw mulch had a long-term effect on soil aggregates. The straw mulching treatments were higher than CK in the proportion of the > 0.25 mm particle size, which was the best size of soil aggregates. The 4 cm straw mulch treatment had the highest proportion of >0.25 mm soil aggregates which could keep the soil structure balance, and CK was the lowest proportion and has the risk of soil erosion [44]. In addition, researchers found that MWD was associated with soil mulch, soil aggregates, water content, soil organic carbon and total nitrogen, and MWD and GMD increased with the straw mulching [57,58]. Here, we found that the 2 cm, 4 cm, and 6 cm straw mulching treatments increased soil MWD and GMD compared with CK (Figure 5), indicating that the soil carbon sequestration improved and had a long-term perspective [49,59]. The 2 cm straw mulching treatment had the highest MWD and GMD in the first year, but it was difficult to maintain in the last year. The 4 cm straw mulching treatment was already higher than that of the 2 cm straw mulching treatment in the second year. The 6 cm straw mulching treatment was reduced compared with the 2 cm and 4 cm straw mulching treatments, indicating that the amount of maize straw used as mulching material had certain limitations [60].
Previous researchers have found that straw mulching could directly influence the SBD but the thickness of straw mulch did not have a linear relationship with SBD [61]. We found that the 4 cm straw mulching treatment had the lowest SBD at 0–5 cm, which was the opposite to CK (Table 2). In addition, low SBD in the soil surface can decrease the loss of water and nutrients in vineyards [62]. Previous research also confirmed that bare ground was poor in constraining soil moisture [20]. The efficient use of soil water is transpiration, which regulates the stomatal state of the leaves and promotes the accumulation of nutrients by photosynthesis. The water loss from bare ground occurs through direct evaporation, which is a pure physical process. The higher the environmental temperature is, the greater the water loss. This situation may cause water stress and stomata closing environments and affect photosynthesis. Shandong Province has a sufficient annual rainfall, and the precipitation of the growing stages (Mar. to Sep.) was 855 mm and 1042 mm in 2019 and 2020, respectively, but the seasonal water distribution is uneven (Figure 1), and in that situation the risk of dryness/wetness events in the traditional management model exists [63,64]. In our experiment, there was no significant difference in CK, 2 cm and 6 cm straw mulching treatments in SBD. The 4 cm straw mulching treatment had the lowest SBD in 0–5 cm and the highest in 20–40 cm without changing the average SBD, indicating that a suitable straw thickness is more effective on water content in surface and bulk density in depth. Therefore, the 4 cm straw mulching treatment could best meet the needs of plant root growth and was suitable as a mulch thickness on soil [65].
As an open system with multiple actors in dynamic balance, we should improve the ability of vineyards to adapt to climate change and prevent agricultural pollution [17,66]. In this experiment, it was noted that straw mulching treatments had a significant effect on soil temperature, moisture, pH, TN, SOC, C/N, MWD and GMD compared with the CK (Figure 6 and Table 3), and soil SOC, C/N and moisture were increased with increasing thickness of maize straw mulching, while soil pH was decreased and then increased with the increasing thickness. The 4 cm straw mulching treatment had the greatest impact on the soil physical characteristics of SBD, which was suitable for maintaining MWD and GMD. The agronomic practices of straw mulching contribute to the rapid improvement of soil physicochemical properties and to the sustainability of viticulture and ensure soil quality and function [17,67].

5. Conclusions

Maize straw mulching had a synergistic effect on soil properties by increasing soil pH, SOC, C/N, MWD, GMD and SBD, but reduced TN and soil temperature in the organic vineyard. The suitable 4 cm maize straw represents a useful soil mulching thickness that provides beneficial services in the utilization of agricultural waste and is a suitable method both ecologically and environmentally. Its implementation could improve the soil health in vineyards. It is worth noting that the type and thickness of soil mulch should be adjusted according to the soil type, agricultural ecological environment and local agricultural waste in different scales before definitive conclusions can be drawn. Future research is needed to measure and compare the economic, social and environmental impacts of the sustainable management model with those of the traditional model.

Author Contributions

Conceptualization, T.Q., C.L., L.G., J.Z. and G.J.; methodology, T.Q., L.W. and G.Z.; formal analysis, T.Q., L.W. and G.Z.; investigation, T.Q., L.W. and G.Z.; writing—original draft preparation, T.Q.; writing—review and editing, T.Q., C.L., L.G., L.W., G.Z., J.Z. and G.J. All authors have read and agreed to the published version of the manuscript.

Funding

This research was co-funded by National Key Research and Development Program of Ministry of Science and Technology of the People’s Republic of China (grant number 2016YFC050708 and 2017YFC1700701), and the 4th Batch of Zhihui Zhengzhou 1125 Jucai Project of Henan Provinence (grant number 201921ZHZH).

Institutional Review Board Statement

Not applicable.

Data Availability Statement

Not applicable.

Acknowledgments

The authors thank Jiang Shenglin and Zhang Chengxia of the Hongyi Organic Farm who provided necessary technological assistance to complete this study.

Conflicts of Interest

The authors declare no conflict of interest.

References

  1. Winter, S.; Bauer, T.; Strauss, P.; Kratschmer, S.; Paredes, D.; Popescu, D.; Landa, B.; Guzman, G.; Gomez, J.A.; Guernion, M.; et al. Effects of vegetation management intensity on biodiversity and ecosystem services in vineyards: A meta-analysis. J. Appl. Ecol. 2018, 55, 2484–2495. [Google Scholar] [CrossRef] [Green Version]
  2. Meemken, E.-M.; Qaim, M. Organic Agriculture, Food Security, and the Environment. Annu. Rev. Resour. Econ. 2018, 10, 39–63. [Google Scholar] [CrossRef] [Green Version]
  3. Azadi, H.; Schoonbeek, S.; Mahmoudi, H.; Derudder, B.; De Maeyer, P.; Witlox, F. Organic agriculture and sustainable food production system: Main potentials. Agric. Ecosyst. Environ. 2011, 144, 92–94. [Google Scholar] [CrossRef] [Green Version]
  4. Aguilera, E.; Guzman, G.; Alonso, A. Greenhouse gas emissions from conventional and organic cropping systems in Spain. II. Fruit tree orchards. Agron. Sustain. Dev. 2015, 35, 725–737. [Google Scholar] [CrossRef] [Green Version]
  5. NBS. Grape Yield and Planting Area in 2019. Available online: https://data.stats.gov.cn (accessed on 1 January 2022).
  6. Willer, H.; Travniek, J.; Meier, C.; Schlatter, B. The World of Organic Agriculture. Statistics and Emerging Trends 2021; Research Institute of Organic Agriculture FiBL: Frick, Switzerland; IFOAM–Organics International: Bonn, Germany.
  7. Ye, K.; Wang, Y. Current Situation of Development of Organic Agriculture and Certification of Organic Products in China. Shaanxi J. Agric. Sci. 2021, 67, 107–111. [Google Scholar]
  8. Qin, T.; Wang, L.; Zhou, Y.; Guo, L.; Jiang, G.; Zhang, L. Digital Technology-and-Services-Driven Sustainable Transformation of Agriculture: Cases of China and the EU. Agriculture 2022, 12, 297. [Google Scholar] [CrossRef]
  9. Wang, L. Practice and research on development of agricultural water-saving irrigation in Linyi City, Shandong Province. Water Resour. Dev. Res. 2022, 22, 86–90. [Google Scholar]
  10. Xu, L.; Lu, C. Evaluation on the Influencing Factors of Agricultural Irrigation Water Use Efficiency in Shandong Province. J. Shanxi Agric. Sci. 2016, 44, 1541–1545. [Google Scholar]
  11. Zhang, L.; Ru, X.; He, X.; Liu, Y.; Dong, Z. Analysis of Water Allocation Options for Irrigation Projects in the Core Area of the Grape Corridor at the Eastern Foot of the Helan Mountains in Ningxia. 2015, pp. 232–240. Available online: https://www.imsilkroad.com/news/p/476733.html (accessed on 1 September 2022).
  12. Xiao, D.; Liu, D.L.; Feng, P.; Wang, B.; Waters, C.; Shen, Y.; Qi, Y.; Bai, H.; Tang, J. Future climate change impacts on grain yield and groundwater use under different cropping systems in the North China Plain. Agric. Water Manag. 2021, 246, 106685. [Google Scholar] [CrossRef]
  13. Nanshu, X.; Buchun, L.; Hong, Y.; Yuan, L.; Meijuan, Q.; Yueying, Z.; Keyi, W. Drought Risk Assessment of Table Grapes in the Bohai Rim Region Based on Crop Water Deficit Index. Chin. J. Agrometeorol. 2022, 43, 380–392. [Google Scholar]
  14. Zhang, D.; Hu, W.; Liu, H.; Du, L.; Xu, Y.; Cheng, Z.; Sun, S.; Wang, H. Characteristics of residual mulching film and residual coefficient of typical crops in North China. Trans. Chin. Soc. Agric. Eng. 2016, 32, 1–5. [Google Scholar]
  15. Gong, L.; Tang, M.; Wang, Y.; Wu, X.; Chen, Y.; Yang, L. Development of New and Old Kinetic Energy Conversion of Grape Industry in Shandong Province. North. Hortic. 2018, 09, 180–183. [Google Scholar]
  16. Zhang, F.; Song, X.; Huo, M. Excess Fertilizer Application and Growers’ Adoption Behavior for Soil Testing for Fertilizer Formulation and Their Determinants: An Empirical Analysis based on Survey Data from Apple Growers in 9 Counties of Shandong Province. China Rural Surv. 2017, 3, 117–130. [Google Scholar]
  17. Cataldo, E.; Fucile, M.; Mattii, G.B. A Review: Soil Management, Sustainable Strategies and Approaches to Improve the Quality of Modern Viticulture. Agronomy 2021, 11, 2359. [Google Scholar] [CrossRef]
  18. Casson, A.; Ortuani, B.; Giovenzana, V.; Brancadoro, L.; Corsi, S.; Gharsallah, O.; Guidetti, R.; Facchi, A. A multidisciplinary approach to assess environmental and economic impact of conventional and innovative vineyards management systems in Northern Italy. Sci. Total Environ. 2022, 838, 156181. [Google Scholar] [CrossRef]
  19. DeVetter, L.W.; Dilley, C.A.; Nonnecke, G.R. Mulches reduce weeds, maintain yield, and promote soil quality in a continental-climate vineyard. Am. J. Enol. Vitic. 2015, 66, 54–64. [Google Scholar] [CrossRef]
  20. Bavougian, C.M.; Read, P.E. Mulch and groundcover effects on soil temperature and moisture, surface reflectance, grapevine water potential, and vineyard weed management. Peerj 2018, 6, e5082. [Google Scholar] [CrossRef]
  21. Muscas, E.; Cocco, A.; Mercenaro, L.; Cabras, M.; Lentini, A.; Porqueddu, C.; Nieddu, G. Effects of vineyard floor cover crops on grapevine vigor, yield, and fruit quality, and the development of the vine mealybug under a Mediterranean climate. Agric. Ecosyst. Environ. 2017, 237, 203–212. [Google Scholar] [CrossRef]
  22. Tillman, J.; Nair, A.; Gleason, M.; Batzer, J. Evaluating strip tillage and rowcover use in organic and conventional muskmelon production. Horttechnology 2015, 25, 487–495. [Google Scholar] [CrossRef] [Green Version]
  23. Liu, E.K.; He, W.Q.; Yan, C.R. ‘White revolution’ to ‘white pollution’—Agricultural plastic film mulch in China. Environ. Res. Lett. 2014, 9, 091001. [Google Scholar] [CrossRef] [Green Version]
  24. Steinmetz, Z.; Wollmann, C.; Schaefer, M.; Buchmann, C.; David, J.; Tröger, J.; Muñoz, K.; Frör, O.; Schaumann, G.E. Plastic mulching in agriculture. Trading short-term agronomic benefits for long-term soil degradation? Sci. Total Environ. 2016, 550, 690–705. [Google Scholar] [CrossRef]
  25. Cui, X.; Guo, L.; Li, C.; Liu, M.; Wu, G.; Jiang, G. The total biomass nitrogen reservoir and its potential of replacing chemical fertilizers in China. Renew. Sustain. Energy Rev. 2021, 135, 110215. [Google Scholar] [CrossRef]
  26. Nati, C.; Boschiero, M.; Picchi, G.; Mastrolonardo, G.; Kelderer, M.; Zerbe, S. Energy performance of a new biomass harvester for recovery of orchard wood wastes as alternative to mulching. Renew. Energy 2018, 124, 121–128. [Google Scholar] [CrossRef]
  27. Abouziena, H.F.; Hafez, O.M.; El-Metwally, I.M.; Sharma, S.D.; Singh, M. Comparison of weed suppression and mandarin fruit yield and quality obtained with organic mulches, synthetic mulches, cultivation, and glyphosate. HortScience 2008, 43, 795–799. [Google Scholar] [CrossRef] [Green Version]
  28. Jin, X.; An, T.; Gall, A.R.; Li, S.; Sun, L.; Pei, J.; Gao, X.; He, X.; Fu, S.; Ding, X.; et al. Long-term plastic film mulching and fertilization treatments changed the annual distribution of residual maize straw C in soil aggregates under field conditions: Characterization by C-13 tracing. J. Soils Sed. 2018, 18, 169–178. [Google Scholar] [CrossRef]
  29. Wang, W.; Akhtar, K.; Ren, G.; Yang, G.; Feng, Y.; Yuan, L. Impact of straw management on seasonal soil carbon dioxide emissions, soil water content, and temperature in a semi-arid region of China. Sci. Total Environ. 2019, 652, 471–482. [Google Scholar] [CrossRef]
  30. Ma, M.; Xi, F.; Yin, Y.; Bing, L.; Wang, J.; Zhang, W.; Niu, L. Contribution of straw disposal to carbon source and sink under the framework of carbon neutrality. Chin. J. Appl. Ecol. 2022, 33, 1331–1339. [Google Scholar] [CrossRef]
  31. Ministry of Ecology and Environment; National Development and Reform Commission; Ministry of Finance; Ministry of Natural Resources; Ministry of Housing and Urban Rural Development; Ministry of Water Resources; Ministry of Agriculture and Rural Areas of the People’s Republic of China. “Fourteenth Five Year Plan” for Soil, Groundwater and Rural Ecological Environment Protection. 2021. Available online: http://www.gov.cn/zhengce/zhengceku/2022-01/04/content_5666421.htm (accessed on 1 September 2022).
  32. Pan, L.; Li, R. Research status and prospect of effects of organic mulching on soil fertility. J. Guizhou Norm. Univ. (Nat. Sci.) 2021, 39, 91–101. [Google Scholar]
  33. Wang, X.Y.; Zhang, X.H.; Yang, M.X.; Gou, X.N.; Liu, B.B.; Hao, Y.C.; Xu, S.T.; Xue, J.Q.; Qin, X.L.; Siddique, K.H.M. Multi-Site Evaluation of Accumulated Temperature and Rainfall for Maize Yield and Disease in Loess Plateau. Agriculture 2021, 11, 373. [Google Scholar] [CrossRef]
  34. Li, Z.; Zheng, J. The research evolution road and trend of crop straw returning in China—Based on the CiteSpace knowledge map. Chin. J. Agric. Resour. Reg. Plan. 2021, 42, 16–26. [Google Scholar]
  35. Cabrera-Perez, C.; Recasens, J.; Baraibar, B.; Royo-Esnal, A. Emergence modelling of 18 species susceptible to be used as cover crops in Mediterranean semiarid vineyards. Eur. J. Agron. 2022, 132, 126413. [Google Scholar] [CrossRef]
  36. Romero, P.; Navarro, J.M.; Ordaz, P.B. Towards a sustainable viticulture: The combination of deficit irrigation strategies and agroecological practices in Mediterranean vineyards. A review and update. Agric. Water Manag. 2022, 259, 107216. [Google Scholar] [CrossRef]
  37. Prosdocimi, M.; Jordan, A.; Tarolli, P.; Keesstra, S.; Novara, A.; Cerda, A. The immediate effectiveness of barley straw mulch in reducing soil erodibility and surface runoff generation in Mediterranean vineyards. Sci. Total Environ. 2016, 547, 323–330. [Google Scholar] [CrossRef] [Green Version]
  38. Gattullo, C.E.; Mezzapesa, G.N.; Stellacci, A.M.; Ferrara, G.; Occhiogrosso, G.; Petrelli, G.; Castellini, M.; Spagnuolo, M. Cover Crop for a Sustainable Viticulture: Effects on Soil Properties and Table Grape Production. Agronomy 2020, 10, 1334. [Google Scholar] [CrossRef]
  39. Sun, T.; Li, G.; Ning, T.Y.; Zhang, Z.M.; Mi, Q.H.; Lal, R. Suitability of mulching with biodegradable film to moderate soil temperature and moisture and to increase photosynthesis and yield in peanut. Agric. Water Manag. 2018, 208, 214–223. [Google Scholar] [CrossRef]
  40. Ren, C.; Liu, K.; Dou, P.; Li, J.; Wang, K. The Changes in Soil Microorganisms and Soil Chemical Properties Affect the Heterogeneity and Stability of Soil Aggregates before and after Grassland Conversion. Agriculture 2022, 12, 307. [Google Scholar] [CrossRef]
  41. Zwane, E.M. Impact of climate change on primary agriculture, water sources and food security in Western Cape, South Africa. Jamba (Potchefstroom South Afr.) 2019, 11, 562. [Google Scholar] [CrossRef] [PubMed] [Green Version]
  42. Di Carlo, P.; Aruffo, E.; Brune, W.H. Precipitation intensity under a warming climate is threatening some Italian premium wines. Sci. Total Environ. 2019, 685, 508–513. [Google Scholar] [CrossRef] [PubMed]
  43. Pavlu, L.; Kodesova, R.; Fer, M.; Nikodem, A.; Nemec, F.; Prokes, R. The impact of various mulch types on soil properties controlling water regime of the Haplic Fluvisol. Soil Tillage Res. 2021, 205, 104748. [Google Scholar] [CrossRef]
  44. Sgubin, G.; Swingedouw, D.; de Cortazar-Atauri, I.G.; Ollat, N.; van Leeuwen, C. The Impact of Possible Decadal-Scale Cold Waves on Viticulture over Europe in a Context of Global Warming. Agronomy 2019, 9, 397. [Google Scholar] [CrossRef] [Green Version]
  45. Blanco-Ward, D.; Monteiro, A.; Lopes, M.; Borrego, C.; Silveira, C.; Viceto, C.; Rocha, A.; Ribeiro, A.; Andrade, J.; Feliciano, M.; et al. Climate change impact on a wine-producing region using a dynamical downscaling approach: Climate parameters, bioclimatic indices and extreme indices. Int. J. Climatol. 2019, 39, 5741–5760. [Google Scholar] [CrossRef]
  46. Zhu, Z.; Qian, J.; Zhang, Y.; Zhang, H.; Dai, H.; Zhang, Z.; Miao, M.; Jiang, J. Taro (Colocasia esculenta (L.) Schott) Yields and Soil Chemical Properties Were Improved by Row-Surface Straw Mulching. Agronomy 2022, 12, 645. [Google Scholar] [CrossRef]
  47. Wang, J.; Fu, X.; Sainju, U.M.; Zhao, F. Soil carbon fractions in response to straw mulching in the Loess Plateau of China. Biol. Fertil. Soils 2018, 54, 423–436. [Google Scholar] [CrossRef]
  48. Han, Y.; Ma, W.; Zhou, B.; Yang, X.; Salah, A.; Li, C.; Cao, C.; Zhan, M.; Zhao, M. Effects of Straw-Return Method for the Maize-Rice Rotation System on Soil Properties and Crop Yields. Agronomy 2020, 10, 461. [Google Scholar] [CrossRef] [Green Version]
  49. Zhang, J.; Liu, Y.; Zheng, T.; Zhao, X.; Liu, H.; Zhang, Y. Nutrient and Stoichiometric Characteristics of Aggregates in a Sloping Farmland Area under Different Tillage Practices. Sustainability 2021, 13, 890. [Google Scholar] [CrossRef]
  50. Yang, F.K.; He, B.; Zhang, L.; Zhang, G.; Gao, Y. An Approach to Improve Soil Quality: A Case Study of Straw Incorporation with a Decomposer Under Full Film-Mulched Ridge-Furrow Tillage on the Semiarid Loess Plateau, China. J. Soil Sci. Plant Nutr. 2020, 20, 125–138. [Google Scholar] [CrossRef]
  51. Dong, S.; Dou, S.; Lin, C.; Li, L.; Tan, C. Decomposition Rate of Corn Straw in Soil and Its Effects on Soil Humus Composition. J. Jilin Agric. Univ. 2016, 38, 579–586. [Google Scholar]
  52. Liu, W.; Weng, L.; Yao, Y. Study on Wheat Straw Decomposition and Nutrient Release Dynamics in Saline-Alkali Farmland of Yellow River Delta. J. Shandong Agric. Eng. Univ. 2021, 38, 18–22. [Google Scholar]
  53. Yang, H.; Wu, G.; Mo, P.; Chen, S.; Wang, S.; Xiao, Y.; Ma, H.A.; Wen, T.; Guo, X.; Fan, G. The combined effects of maize straw mulch and no-tillage on grain yield and water and nitrogen use efficiency of dry-land winter wheat (Triticum aestivum L.). Soil Tillage Res. 2020, 197, 104485. [Google Scholar] [CrossRef]
  54. Zhang, G.; Yang, Y.; Liu, Y.; Wang, Z. Mechanisms and benefits of straw return in mitigating black soil erosion. Soils Crops 2022, 11, 115–128. [Google Scholar]
  55. Mao, X.L.; Van Zwieten, L.; Zhang, M.K.; Qiu, Z.T.; Yao, Y.C.; Wang, H.L. Soil parent material controls organic matter stocks and retention patterns in subtropical China. J. Soils Sed. 2020, 20, 2426–2438. [Google Scholar] [CrossRef]
  56. Huang, R.; Tian, D.; Liu, J.; Lv, S.; He, X.; Gao, M. Responses of soil carbon pool and soil aggregates associated organic carbon to straw and straw-derived biochar addition in a dryland cropping mesocosm system. Agric. Ecosyst. Environ. 2018, 265, 576–586. [Google Scholar] [CrossRef]
  57. Bogunovic, I.; Telak, L.J.; Pereira, P.; Filipovic, V.; Filipovic, L.; Percin, A.; Durdevic, B.; Birkas, M.; Dekemati, I.; Rodrigo Comino, J. Land management impacts on soil properties and initial soil erosion processes in olives and vegetable crops. J. Hydrol. Hydromech. 2020, 68, 328–337. [Google Scholar] [CrossRef]
  58. Fan, W.; Wu, J.; Ahmed, S.; Hu, J.; Chen, X.; Li, X.; Zhu, W.; Opoku-Kwanowaa, Y. Short-Term Effects of Different Straw Returning Methods on the Soil Physicochemical Properties and Quality Index in Dryland Farming in NE China. Sustainability 2020, 12, 2631. [Google Scholar] [CrossRef] [Green Version]
  59. Yang, F.; He, B.; Zhang, G. Humate Combined with Film-Mulched Ridge-Furrow Tillage Improved Carbon Sequestration in Arid Fluvo-Aquic Soil. Agronomy 2022, 12, 1398. [Google Scholar] [CrossRef]
  60. Guesmi, H.; Darej, C.; Goufo, P.; Ben Youssef, S.; Chakroun, M.; Ben Salem, H.; Trindade, H.; Moujahed, N. Stubble Quality of Wheat Grown under No-Tillage and Conventional Tillage Systems, and Effects of Stubble on the Fermentation Profile of Grazing Ewes’ Ruminal Fluid. Agriculture 2022, 12, 520. [Google Scholar] [CrossRef]
  61. Mulumba, L.N.; Lal, R. Mulching effects on selected soil physical properties. Soil Tillage Res. 2008, 98, 106–111. [Google Scholar] [CrossRef]
  62. Telak, L.J.; Pereira, P.; Bogunovic, I. Soil degradation mitigation in continental climate in young vineyards planted in Stagnosols. Int. Agrophysics 2021, 35, 307–317. [Google Scholar] [CrossRef]
  63. Yang, X.J.; Yao, N.; Hu, W.; Ji, X.J.; Luan, Q.Z.; Liu, Y.; Bai, W.; Chen, D.; Liu, B.C. Spatiotemporal Characteristics of Dryness/Wetness in the Wine Regions of China from 1981 to 2015. Agronomy 2022, 12, 843. [Google Scholar] [CrossRef]
  64. Cheng, X.; Sun, S.; Zhang, Z.-T.; Liu, Z.-J.; Yang, X.-G. Characteristics of water requirement of table grape in the growing season. J. Appl. Ecol. 2021, 32, 2847–2856. [Google Scholar] [CrossRef]
  65. Paul, P.L.C.; Bell, R.W.; Barrett-Lennard, E.G.; Kabir, E. Impact of Rice Straw Mulch on Soil Physical Properties, Sunflower Root Distribution and Yield in a Salt-Affected Clay-Textured Soil. Agriculture 2021, 11, 264. [Google Scholar] [CrossRef]
  66. Wheeler, S.A.; Marning, A. Turning water into wine: Exploring water security perceptions and adaptation behaviour amongst conventional, organic and biodynamic grape growers. Land Use Policy 2019, 82, 528–537. [Google Scholar] [CrossRef]
  67. Gagnarli, E.; Valboa, G.; Vignozzi, N.; Goggioli, D.; Guidi, S.; Tarchi, F.; Corino, L.; Simoni, S. Effects of Land-Use Change on Soil Functionality and Biodiversity: Toward Sustainable Planning of New Vineyards. Land 2021, 10, 358. [Google Scholar] [CrossRef]
Figure 1. Average daily temperature and precipitation in 2019–2020.
Agriculture 12 01751 g001
Figure 2. The effects of different treatments on soil moisture and temperature. (A)–(F) represent the average soil moisture ± standard error of 0 cm, 2 cm, 4 cm and 6 cm straw mulching treatments in different stages in 2019 and 2020. (G)–(L) represent the average soil temperature ± standard error of 0 cm, 2 cm, 4 cm and 6 cm straw mulching treatments in different stages in 2019 and 2020 (the soil moisture and temperature were measured in 7 cm depth under soil surface, n = 3, p < 0.05).
Agriculture 12 01751 g002
Figure 3. The effects of different treatments on soil properties. (A)–(D) represent the soil pH, total nitrogen, organic carbon and C/N of the 0 cm, 2 cm, 4 cm and 6 cm straw mulching treatments in the 0–20 cm soil layer in the two years, and (E)–(H) represent the soil pH, total nitrogen, organic carbon and C/N of the 0 cm, 2 cm, 4 cm and 6 cm straw mulching treatments in the 20–40 cm soil layer in the two years. Different lowercase letters indicate significant differences among different treatments at p < 0.05 level, with * indicating significant differences in the same treatment at p < 0.05 level between the different years, and ** indicating significant differences in the same treatment at p < 0.01 level between the different years. Mean values ± standard error, n = 3.
Agriculture 12 01751 g003
Figure 4. The effects of different treatments on soil composition proportions.
Agriculture 12 01751 g004
Figure 5. The mean weight diameter (MWD) and the geometric mean diameter (GMD) of soil particles under different mulching treatments. (A) represents the mean weight diameter ± standard error of soil particles in the 0 cm, 2 cm, 4 cm and 6 cm straw mulching treatments in 2019 and 2020, and (B) represents and the geometric mean diameter ± standard error of soil particles in the 0 cm, 2 cm, 4 cm and 6 cm straw mulching treatments in 2019 and 2020. Different lowercase letters indicate significant differences among different treatments at the p < 0.05 level. n = 3.
Agriculture 12 01751 g005
Figure 6. Principal component analysis (PCA) of different environmental factors. (A) represents the PCA in 2019, (B) represents the PCA in 2020. Abbreviations: Soil pH (pH); Soil organic carbon (SOC); Total nitrogen (TN); Soil C/N (C/N); Soil temperature (ST); Soil moisture (SM); Mean weight diameter (MWD); Geometric mean diameter (GMD).
Agriculture 12 01751 g006
Table 1. The composition proportion of aggregates of different particle sizes (%) from different straw mulching thicknesses.
YearParticle Sizes0 cm 2 cm 4 cm 6 cm
2019>2 mm3.7 ± 0.12 Ea14.63 ± 6.65 ABa12.26 ± 4.29 CDa8.73 ± 2.25 Da
1–2 mm14.31 ± 2.56 CDa20.17 ± 3.11 Aa15.82 ± 1.5 BCa12.68 ± 2.35 CDa
0.5–1 mm29.83 ± 2.07 Aa25.33 ± 2.55 Aa29.26 ± 1.2 Aa *31.25 ± 2 Aa
0.25–0.5 mm21.74 ± 0.65 Bab18.09 ± 0.7 ABb *21.52 ± 1.6 Bab23.71 ± 1.13 Ba
0.053–0.25 mm18.52 ± 1.45 BCa14.75 ± 2.53 ABa13.52 ± 1.66 CDa15.15 ± 1.25 Ca
<0.053 mm11.91 ± 0.43 Da7.03 ± 1.22 Bb7.63 ± 1.48 Db8.49 ± 1.14 Dab
2020>2 mm8.95 ± 3.89 Aa12.53 ± 3.72 Ba10.87 ± 0.96 Ca9.73 ± 1.44 Ba
1–2 mm20.25 ± 11.1 Aa17.29 ± 3.76 ABa22.2 ± 5.9 Aa13.35 ± 1.83 Ba
0.5–1 mm26.26 ± 4.73 Aa24.03 ± 0.56 Aa20.91 ± 2.49 ABa28.04 ± 2.2 Aa
0.25–0.5 mm19.47 ± 11.82 Aa22.86 ± 1.43 Aa24.15 ± 0.39 Aa27.13 ± 4.86 Aa
0.053–0.25 mm14.54 ± 5.38 Aa13.51 ± 2.69 Ba12.27 ± 2.72 BCa12.76 ± 0.8 Ba
<0.053 mm10.52 ± 6.83 Aa9.78 ± 3.47 Ba9.61 ± 2.16 Ca9 ± 1.39 Ba
Different capital case letters indicate significant differences among different particle sizes at the p < 0.05 level, different lowercase letters indicate significant differences among the different treatments at the p < 0.05 level, and * indicates significant differences in the same treatment at the p < 0.05 level between the different years. Mean values ± standard error, n = 3, unit %.
Table 2. Soil bulk density of different mulching treatments.
Soil Layers0 cm 2 cm 4 cm 6 cm
0–5 cm1.54 ± 0.04 Aa1.54 ± 0.07 Aa1.42 ± 0.02 Ca1.53 ± 0.09 Aa
5–10 cm1.54 ± 0.04 Aa1.67 ± 0.02 Aa1.6 ± 0.04 Ba1.52 ± 0.13 Aa
10–20 cm1.61 ± 0.05 Aa1.64 ± 0.05 Aa1.7 ± 0.04 Aa1.68 ± 0.06 Aa
20–40 cm1.67 ± 0.05 Aa1.68 ± 0.01 Aa1.7 ± 0.02 Aa1.69 ± 0.01 Aa
Average1.62 ± 0.01 a1.65 ± 0.02 a1.65 ± 0.02 a1.65 ± 0.04 a
Different capital case letters indicate significant differences among the different soil layers at the p < 0.05 level, and different lowercase letters indicate significant differences among the different treatments in the same soil layers at the p < 0.05 level. Mean values ± standard error, n = 3.
Table 3. Results of the principal component of the soil quality indicators.
Variable20192020
PC1 PC2PC1 PC2
Soil pH (pH)−0.394540.135890.39693−0.10936
Total nitrogen (TN)−0.216840.18314−0.450540.11804
Soil organic carbon (SOC)0.30817−0.436210.337140.3034
Soil C/N (C/N)0.37391−0.456890.471760.05897
Soil temperature (ST)0.382390.051480.42634−0.10818
Soil moisture (SM)−0.45412−0.09736−0.345930.05719
Mean weight diameter (MWD)0.309450.537570.041840.65682
Geometric mean diameter (GMD)0.338130.497860.007460.65741
Publisher’s Note: MDPI stays neutral with regard to jurisdictional claims in published maps and institutional affiliations.

