Article

Using UAV Multispectral Remote Sensing with Appropriate Spatial Resolution and Machine Learning to Monitor Wheat Scab

1
School of Agricultural Engineering, Jiangsu University, Zhenjiang 212013, China
2
Key Laboratory of Modern Agricultural Equipment and Technology, Ministry of Education, Jiangsu University, Zhenjiang 212013, China
3
Institute of Food Crops, Jiangsu Academy of Agricultural Sciences, Nanjing 210014, China
*
Author to whom correspondence should be addressed.
Agriculture 2022, 12(11), 1785; https://doi.org/10.3390/agriculture12111785
Submission received: 26 September 2022 / Revised: 18 October 2022 / Accepted: 24 October 2022 / Published: 27 October 2022
(This article belongs to the Section Digital Agriculture)

Abstract

:
This study took the wheat grown in the experimental area of Jiangsu Academy of Agricultural Sciences as the research object and used the unmanned aerial vehicle (UAV) to carry the Rededge-MX multispectral camera to obtain the wheat scab image with different spatial resolutions (1.44 cm, 2.11 cm, 3.47 cm, 4.96 cm, 6.34 cm, and 7.67 cm). The vegetation indexes (VIs) and texture features (TFs) extracted from the UAV multispectral image were screened for high correlation with the disease index (DI) to investigate the impact of spatial resolution on the accuracy of UAV multispectral wheat scab monitoring. Finally, the best spatial resolution for UAV multispectral monitoring of wheat scab was determined to be 3.47 cm, and then, based on the 3.47 cm best resolution image, VIs and TFs were used as input variables, and three algorithms of partial least squares regression (PLSR), support vector machine regression (SVR), and back propagation neural network (BPNN) was used to establish wheat scab, monitoring models. The findings demonstrated that the VIs and TFs fusion model was more appropriate for monitoring wheat scabs by UAV remote sensing and had better fitting and monitoring accuracy than the single data source monitoring model during the wheat filling period. The SVR algorithm has the best monitoring effect in the multi-source data fusion model (VIs and TFs). The training set was identified as 0.81, 4.27, and 1.88 for the coefficient of determination (R2), root mean square error (RMSE), and relative percent deviation (RPD). The verification set was identified as 0.83, 3.35, and 2.72 for R2, RMSE, and RPD. In conclusion, the results of this study provide a scheme for the field crop diseases in the UAV monitoring area, especially for the classification and variable application of wheat scabs by near-earth remote sensing monitoring.

1. Instruction

Food security has received considerable attention both at domestic and international levels. Wheat, one of the three major staple foods in China, is also the key to national food security [1]. However, in recent years, diseases and insect pests have been spreading continuously. Some potential diseases of wheat, including yellow rust, powdery mildew, and scab seriously threatened the safety of wheat production. Scab, as a high-incidence disease of wheat, can reduce production by more than 40% at most in epidemic years [2]. Additionally, if people or animals accidentally consume wheat-diseased grains, will experience opposing reactions [3]. Currently, the traditional field scale monitoring method of scab is mainly the field investigation method. Still, its monitoring range is small, time-consuming, and laborious [4]. It is easy to be affected by subjective factors, so replacing the traditional method with a fast, real-time, and wide-coverage disease monitoring method is urgent.
Spectral imaging technology can achieve both spectral analysis and image processing, so it has been widely used in disease detection [5,6]. The rapid development of airborne multispectral and remote sensing technology allows for rapid monitoring of large-scale pests and diseases. Satellite and aerial remote sensing are difficult to observe the dynamic changes of wheat scabs in real time due to their shortcomings, such as low spatial resolution and long revisit period [7], which limits their potential application in precision agriculture. In addition to overcoming the drawbacks of satellite remote sensing, unmanned aerial vehicle (UAV) remote sensing has the benefits of good real-time, high economy, and easy operation. It has gradually grown into a crucial tool for regional crop farming monitoring [8].
At present, UAV remote sensing has been widely used in the field of wheat disease and pest monitoring [9,10]. Some scholars at home and abroad choose spectral features, and texture features (TFs) or combine them to monitor wheat diseases. For example, Su Baofeng et al. [11] Used unmanned aerial vehicles to collect multi-spectral data on naturally induced wheat stripe rust, established a severity model of wheat stripe rust based on vegetation index (VIs) by using algorithms such as random forest and support vector machine, and concluded that this model could achieve the classification of wheat stripe rust. Guo et al. [12] Based on UAV hyperspectral remote sensing to obtain wheat yellow rust data with different resolutions, extracted VIs and TFs for combination, and established a partial least squares regression (PLSR) monitoring model for wheat at different infection periods. Aside from the wheat disease spectrum and TFs, Ramin et al. [13] also observed good consistency between wheat canopy coverage and stripe rust by obtaining UAV visible light data. Scab is more suitable for UAV remote sensing monitoring than other crop diseases [14]. When scabs damage wheat, it will first affect the top of the plant, and the wheat ear will show a red mold layer. The spatial resolution of the image obtained by UAV remote sensing is high (1.44 cm~7.67 cm). Moreover, because the scab is mostly spiked hair, the wheat ear is not blocked by leaves, which can directly identify the diseased part of wheat [15], and the scab is a self-occurring spikelet; it extends along the main spike axis to the adjacent spikelets, and there is no lag in observing the canopy data of the disease [16]. In recent years, UAV remote sensing monitoring of wheat scabs has gradually become a research hotspot. Liu et al. [17] used the hyperspectral sensor carried by UAV to obtain wheat scab data, screened the original spectral bands, VIs and TFs, and established a scab monitoring model by improving the back propagation neural network (BPNN). The overall accuracy was 98% and the stability was good. Xiao et al. [18] obtained hyperspectral data of wheat scab through UAV, screened sensitive bands of scab, extracted TFs, selected the best window size, and found that 5 × 5 window size can more accurately detect scab. Ma et al. [19] Based on UAV hyperspectral remote sensing to obtain data on the wheat filling period, built a field scale wheat scab detection model by combining spectral bands, VIs, and wavelet features and using the maximum and minimum normalization algorithms. The primary research demonstrated the efficacy of UAV remote sensing applications in scab monitoring. However, several studies have focused on spatial resolution’s effect on crop disease monitoring outcomes, particularly wheat scabs. The higher the image’s spatial resolution, the more pixels per unit area, the higher the image definition, and the lower the image processing efficiency [20,21], selecting the best spatial resolution is also an important aspect of accurately monitoring crop diseases.
Based on these observations, this study took wheat infected with scab at the filling stage as the research object. The objectives were to (1) collect data on the wheat canopy at various spatial scales and assess the relationship with the disease index (DI) for a wheat scab, (2) determine the best spatial resolution for UAV monitoring of wheat scab based on vegetation indexes (VIs), and (3) build a regional plot scale surveillance model of wheat scab based on the best spatial resolution.

2. Materials and Methods

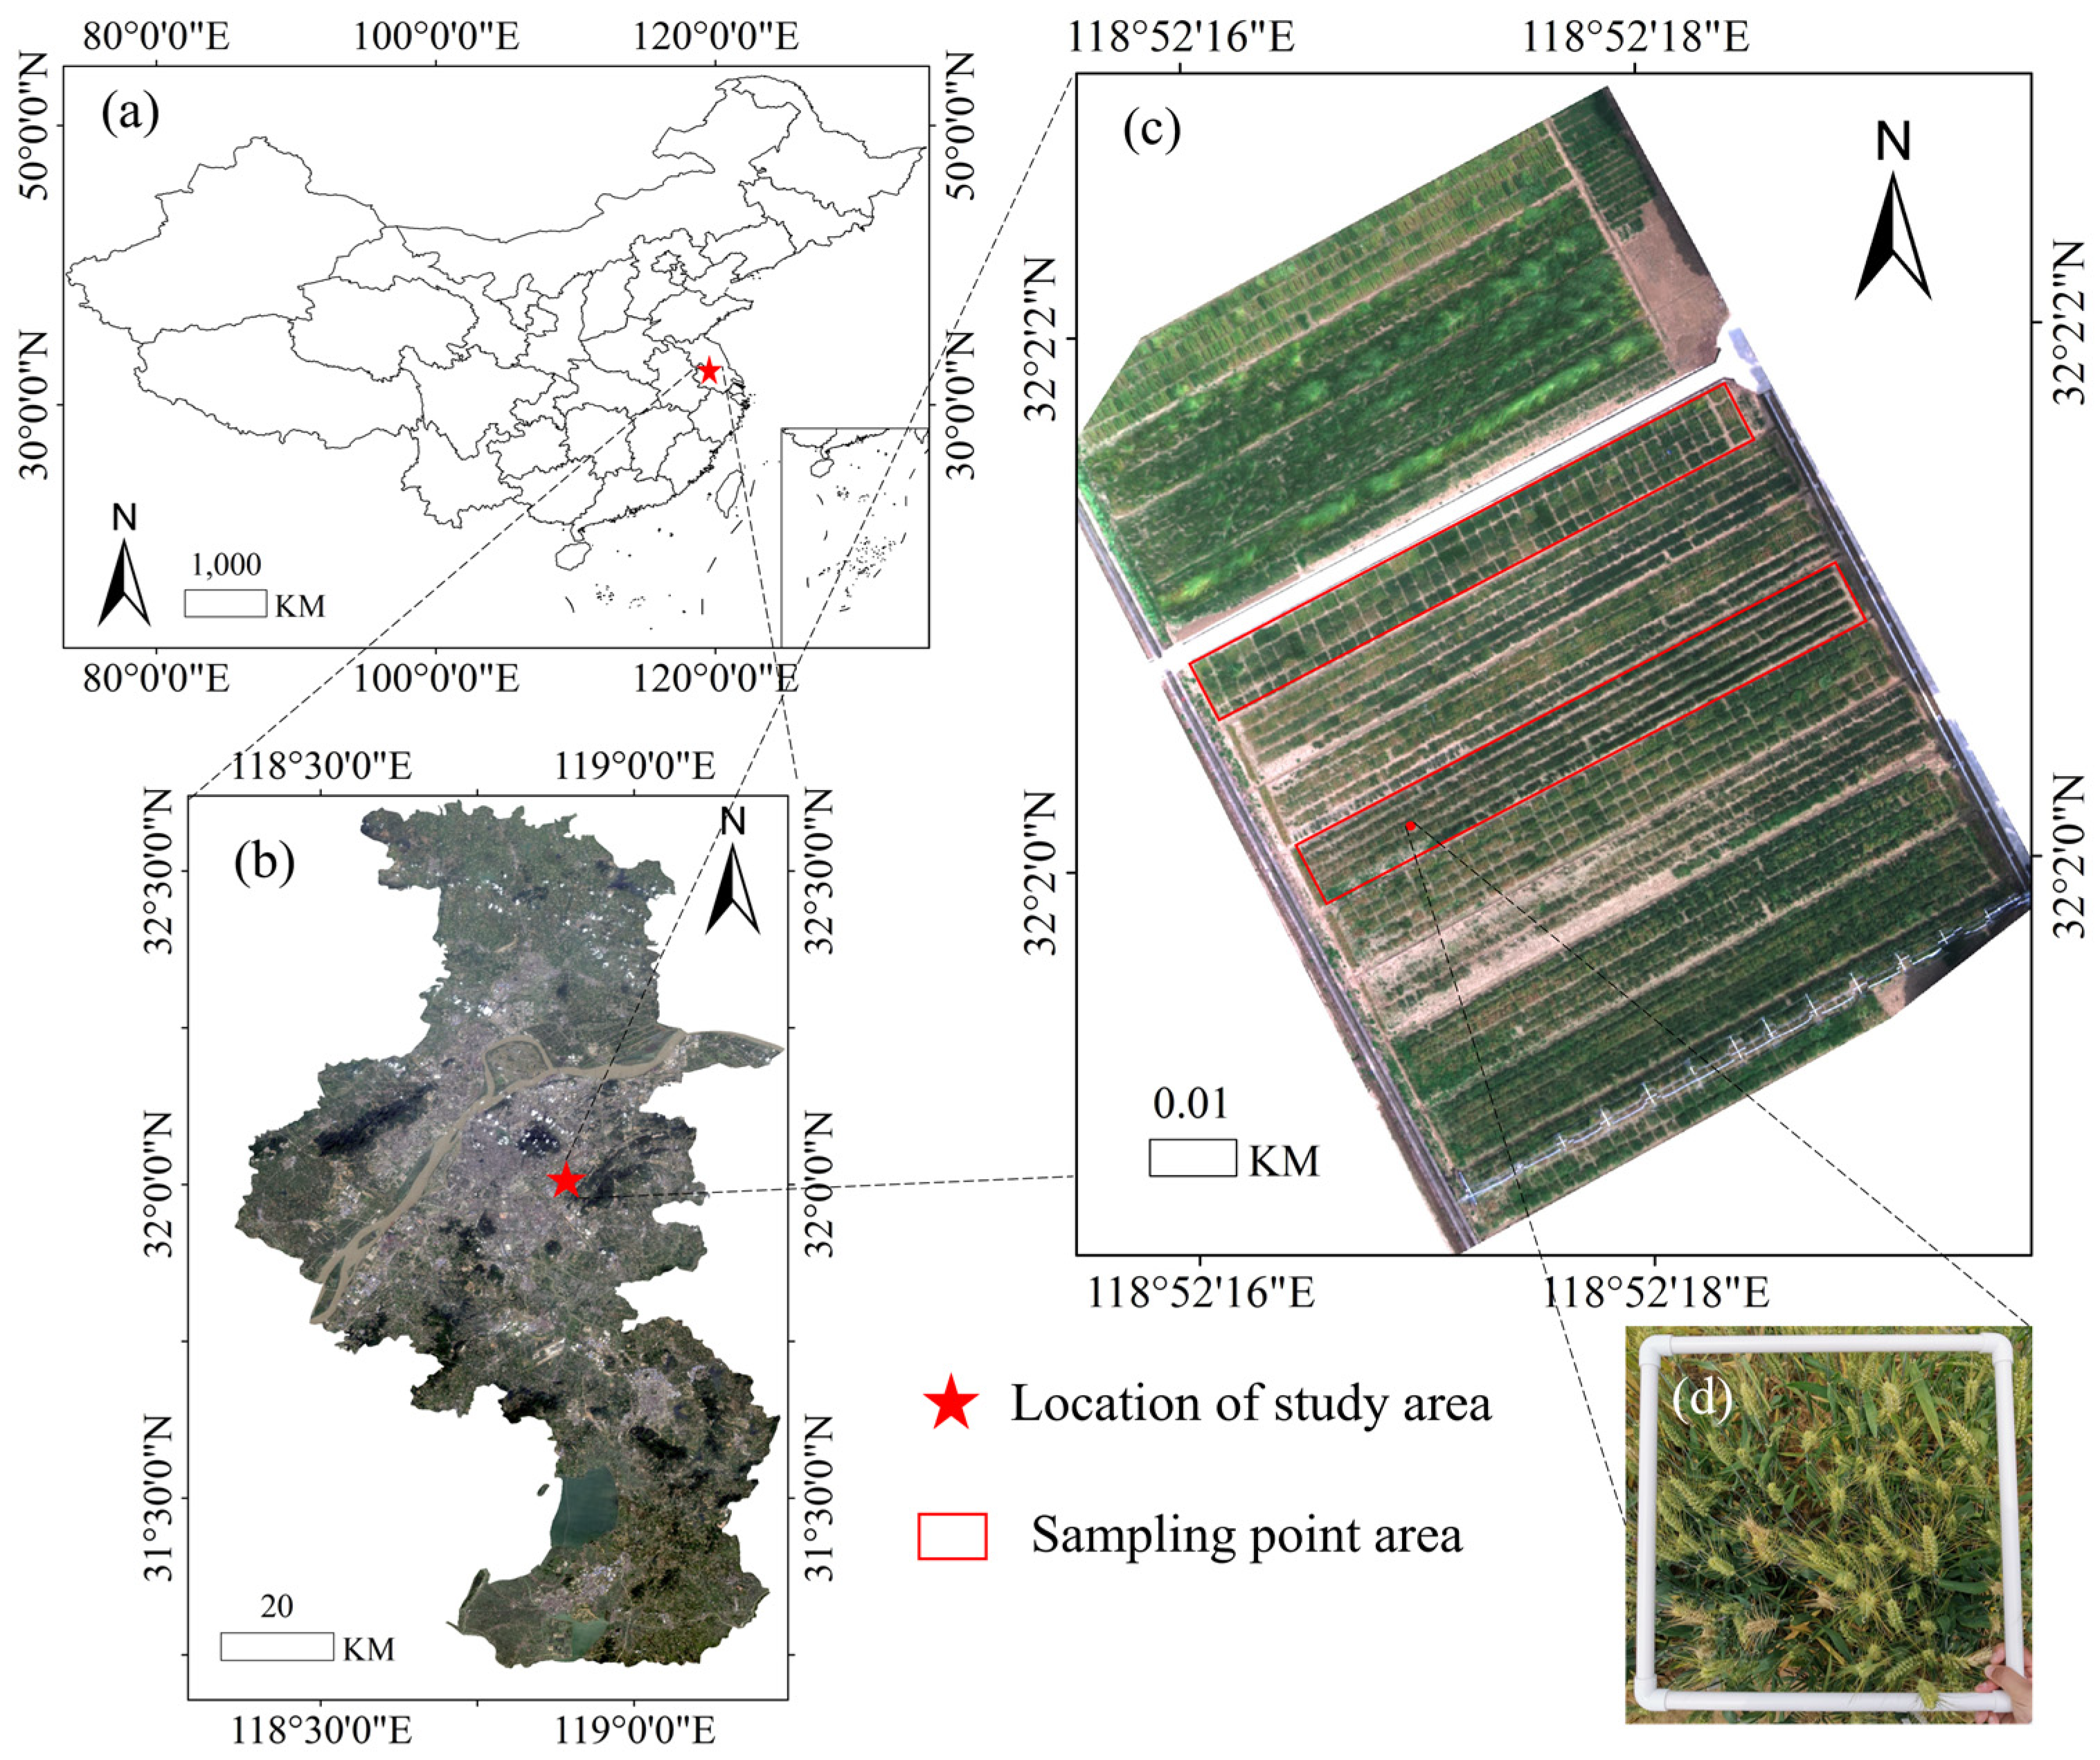
2.1. Overview of the Research Area

The trial site is located in the Jiangsu Academy of Agricultural Sciences’ experimental wheat field in Nanjing, Jiangsu Province (118°52′16″E, 33°2′2″N) (Figure 1). The institute is located in a region with a north subtropical monsoon climate, which has an annual average temperature of 15.4 °C, 1200 millimeters of ample rainfall, and 2132 h of average sunshine. The photothermal conditions are ideal and conducive to the growth of other crops, such as wheat and rice.
The experimental materials were 42 new wheat cultivars resistant to scab identified by Jiangsu Academy of Agricultural Sciences (Sumai 3, Nanjing 8611, 20FH0012, etc.). The research area is primarily used for breeding wheat disease resistance and UAV remote sensing monitoring. In this experiment, two sampling locations were set up (Figure 1). The wheat varieties in the two sampling regions were similar, covering a total area of 545 m2. Each sampling site had a high level of vegetation coverage and was approximately 2.5 m2 in size. The artificial inoculation of the tested pathogen was performed in accordance with the Chinese agriculture industry-standard NY/T1433.4-2007 Rules for Resistance Evaluation of Wheat to Diseases and Insect Pests Part4: Rules for Resistance Evaluation of Wheat to Wheat Scab.

2.2. UAV Multispectral Data Acquisition

In this test, the Dajiang matrix 600 Pro UAV is equipped with multi-spectrum as the data acquisition system, with a fuselage wheelbase of 113 mm, a maximum take-off weight of 15.5 kg, a maximum horizontal flight speed (no wind) of 18 m/s, and an average endurance of about 30 min. It is equipped with the RedEdge-MX multi-spectrum imaging system produced by the American Micasense company, as shown in Figure 2. RedEdge-MX multispectral camera (Figure 2b) has five channels: blue, green, red, red edge, and near-infrared. The corresponding central wavelength/width is 475 nm/32 nm, 560 nm/27 nm, 668 nm/16 nm, 717 nm/12 nm and 840 nm/57 nm. The resolution of each channel is 1280 × 960, and the field of view is 47.2°. It is also equipped with a calibration plate (Figure 2c) to correct reflectivity and a light intensity sensor to correct the angle between the sun and light. The collection time is 10:00–14:00 on May 7, 2022, 16 days after the inoculation of the scab. On the day of the experiment, the weather was clear and cloudless. Multispectral data of wheat canopy were collected at six flight heights, which were 20 m, 30 m, 50 m, 70 m, 90 m, and 110 m, respectively. The overlap rate of heading was 80%, and the overlap rate of side direction was 70%.

2.3. Field Data Collection

The field experiment was conducted using a rectangular frame (40 cm × 40 cm) surrounded by UPVC pipes to delimit the canopy data collection range (Figure 1), record the total number of wheat ears in the rectangular frame, and record the disease grade of each wheat ear according to the proportion of diseased wheat grains to the total wheat grains. According to the Rules for Monitoring and Forecast of the Wheat Head Blight (GB/T15796-2011) [22], the disease severity of wheat ears is divided into five levels (0%, 1~25%, 26~50%, 51~75%, 76~100%), where 0% is healthy (level 0), 1~25% is disease level 1… … 76~100% is disease level 4. The center of the field is selected as the sampling point to ensure the uniformity of wheat in the area, and the leaf area index of wheat in the center of the field is high [16], and the background interference, such as soil, can be ignored. After obtaining multispectral data, the field data collection was conducted by two people under the guidance and supervision of professional agricultural technicians of Jiangsu Academy of Agricultural Sciences. The formula [23] for calculating DI of wheat scab is as follows:
D I =   ( h f × f ) H × 4 × 100
where hf represents the number of wheat ears at each disease grade; f represents the disease level of wheat ears; H represents the total number of ears of wheat in the rectangular frame; DI indicates the disease index of wheat scab, and DI indicates the average level of the incidence rate of wheat scab.

2.4. UAV Data Preprocessing

First, the original multispectral images obtained by aerial photography at various flight heights are imported into pix4dmapper software for image mosaic, radiometric correction, and other preprocessing to generate 5-channel single-band reflectance images. The spatial resolution and required time of the synthetic images at various flight heights are shown in Table 1. Table 1 shows that the higher the flying height of the UAV remote sensing platform with the same sensors, the lower the spatial resolution of the image and the shorter the pre-processing time for image stitching [24]. Then, ENVI5.3 software synthesizes the reflectance images of various bands into multispectral images, and the threshold segmentation method is used to segment the image background. The normalized difference vegetation index [25] (RDVI) is used to segment the wheat and soil background, and the binary vector mask is generated by the comparison of statistical data tools, which is imported into the region of interest for image clipping to reduce the impact of soil background on the classification results.

2.5. Research Methods

2.5.1. Selection of Vegetation Index

After wheat is infected with the scab, transpiration rate, water content, chlorophyll content, and physiological morphology of infected wheat will change [11]. Therefore, 21 vegetation indices related to crop growth are selected to establish a wheat scab prediction model. The vegetation indices and calculation formulas used in this paper are shown in Table 2. RDVI has participated in the threshold segmentation of removing soil background, and its participation in the calculation may affect the extraction results; it does not participate in subsequent modeling.

2.5.2. Extraction of Texture Features

When spectral features are not enough to monitor crop diseases, crop texture features, as an effective complement of spectral features plays an important role in improving the accuracy of disease monitoring. Multispectral texture features are obtained by calculating the gray-level co-occurrence matrix (GLCM) [12]. ENVI5.3 software is used to extract a total of 8 texture features including mean (mea), variance (var), homogeneity (hom), contract (con), dissimilarity (dis), entropy (ent), second moment (sec) and correlation (cor) from five bands. When extracting texture features, the selection window size is 5 × 5 [18], set the step size to 1, set the direction according to the planting direction of wheat, and finally set the 45° direction (Figure 1).

2.5.3. Modeling Method

In this study, partial least squares regression (PLSR), support vector machine regression (SVR), and back propagation neural network (BPNN) were used to establish wheat scab, monitoring models.
(1)
The PLSR method combines the advantages of three analysis methods: principal component analysis, canonical correlation analysis and multiple linear regression analysis. Since it is more efficient and useful, the partial least squares method is frequently used to predict data in the fields of remote sensing and other disciplines [38].
(2)
SVR is a machine learning method based on statistical theory [39]. It was proposed as a branch of the support vector machine. Based on a support vector machine, a sensitivity loss function was introduced to convert the classification task into a regression task. Because of its simple structure and strong robustness, it is often used for the inversion of crop parameters [40]. When modeling with SVR, the linear kernel function of the LIBSVM3.25 toolkit [41] needs to be called to train the model, and the default value is selected for the loss function parameters.
(3)
The BPNN is a multi-layer feedforward neural network that has strong fault tolerance and the ability to self-adapt. It is often used in remote sensing image analysis and data fitting [17]. After repeated debugging, the neural network with the number of hidden layer nodes of 5 and 14, the number of output layer nodes of 1, the learning rate of 0.02, and the training error targets of 10−3 and 10−1 is finally constructed.

2.5.4. Accuracy Verification

A total of 160 canopy data of wheat scabs during grain filling were collected in the study area. The SPXY sampling method [42] was used to divide the canopy data, of which 70% was used as the training set and 30% as the verification set. After determining the principal component score of the data, according to the clustering analysis results, some data samples that deviated from the curve position are removed to improve the quality of the correction set samples, reduce the adverse impact on subsequent data processing, and improve the accuracy of the model.
The determination coefficient (R2), root mean square error (RMSE), and relative percent deviation (RPD) [43] are used to assess the quality of the monitoring model. When RPD is 1.5, the model has little prediction ability; when RPD is 2.0, the model has some prediction ability; and when RPD is greater than 2.0, the model has excellent prediction ability. The greater the R2 and RPD, the lower will be the RMSE and the higher the model’s accuracy.
R 2 = i = 1 n ( x i x ¯ ) 2 × ( y i y ¯ ) 2 i = 1 n ( x i x ¯ ) 2 × i = 1 n ( y i y ¯ ) 2
R M S E = i = 1 n ( y i x i ) 2 n
R P D = i = 1 n ( y i y ¯ ) 2 n 1 R M S E
where xi, x ¯ , yi and y ¯ They are the measured DI value, the average DI value of wheat scab, the predicted DI value, and the average DI value of wheat scab; n is the number of canopy samples.

3. Results and Analysis

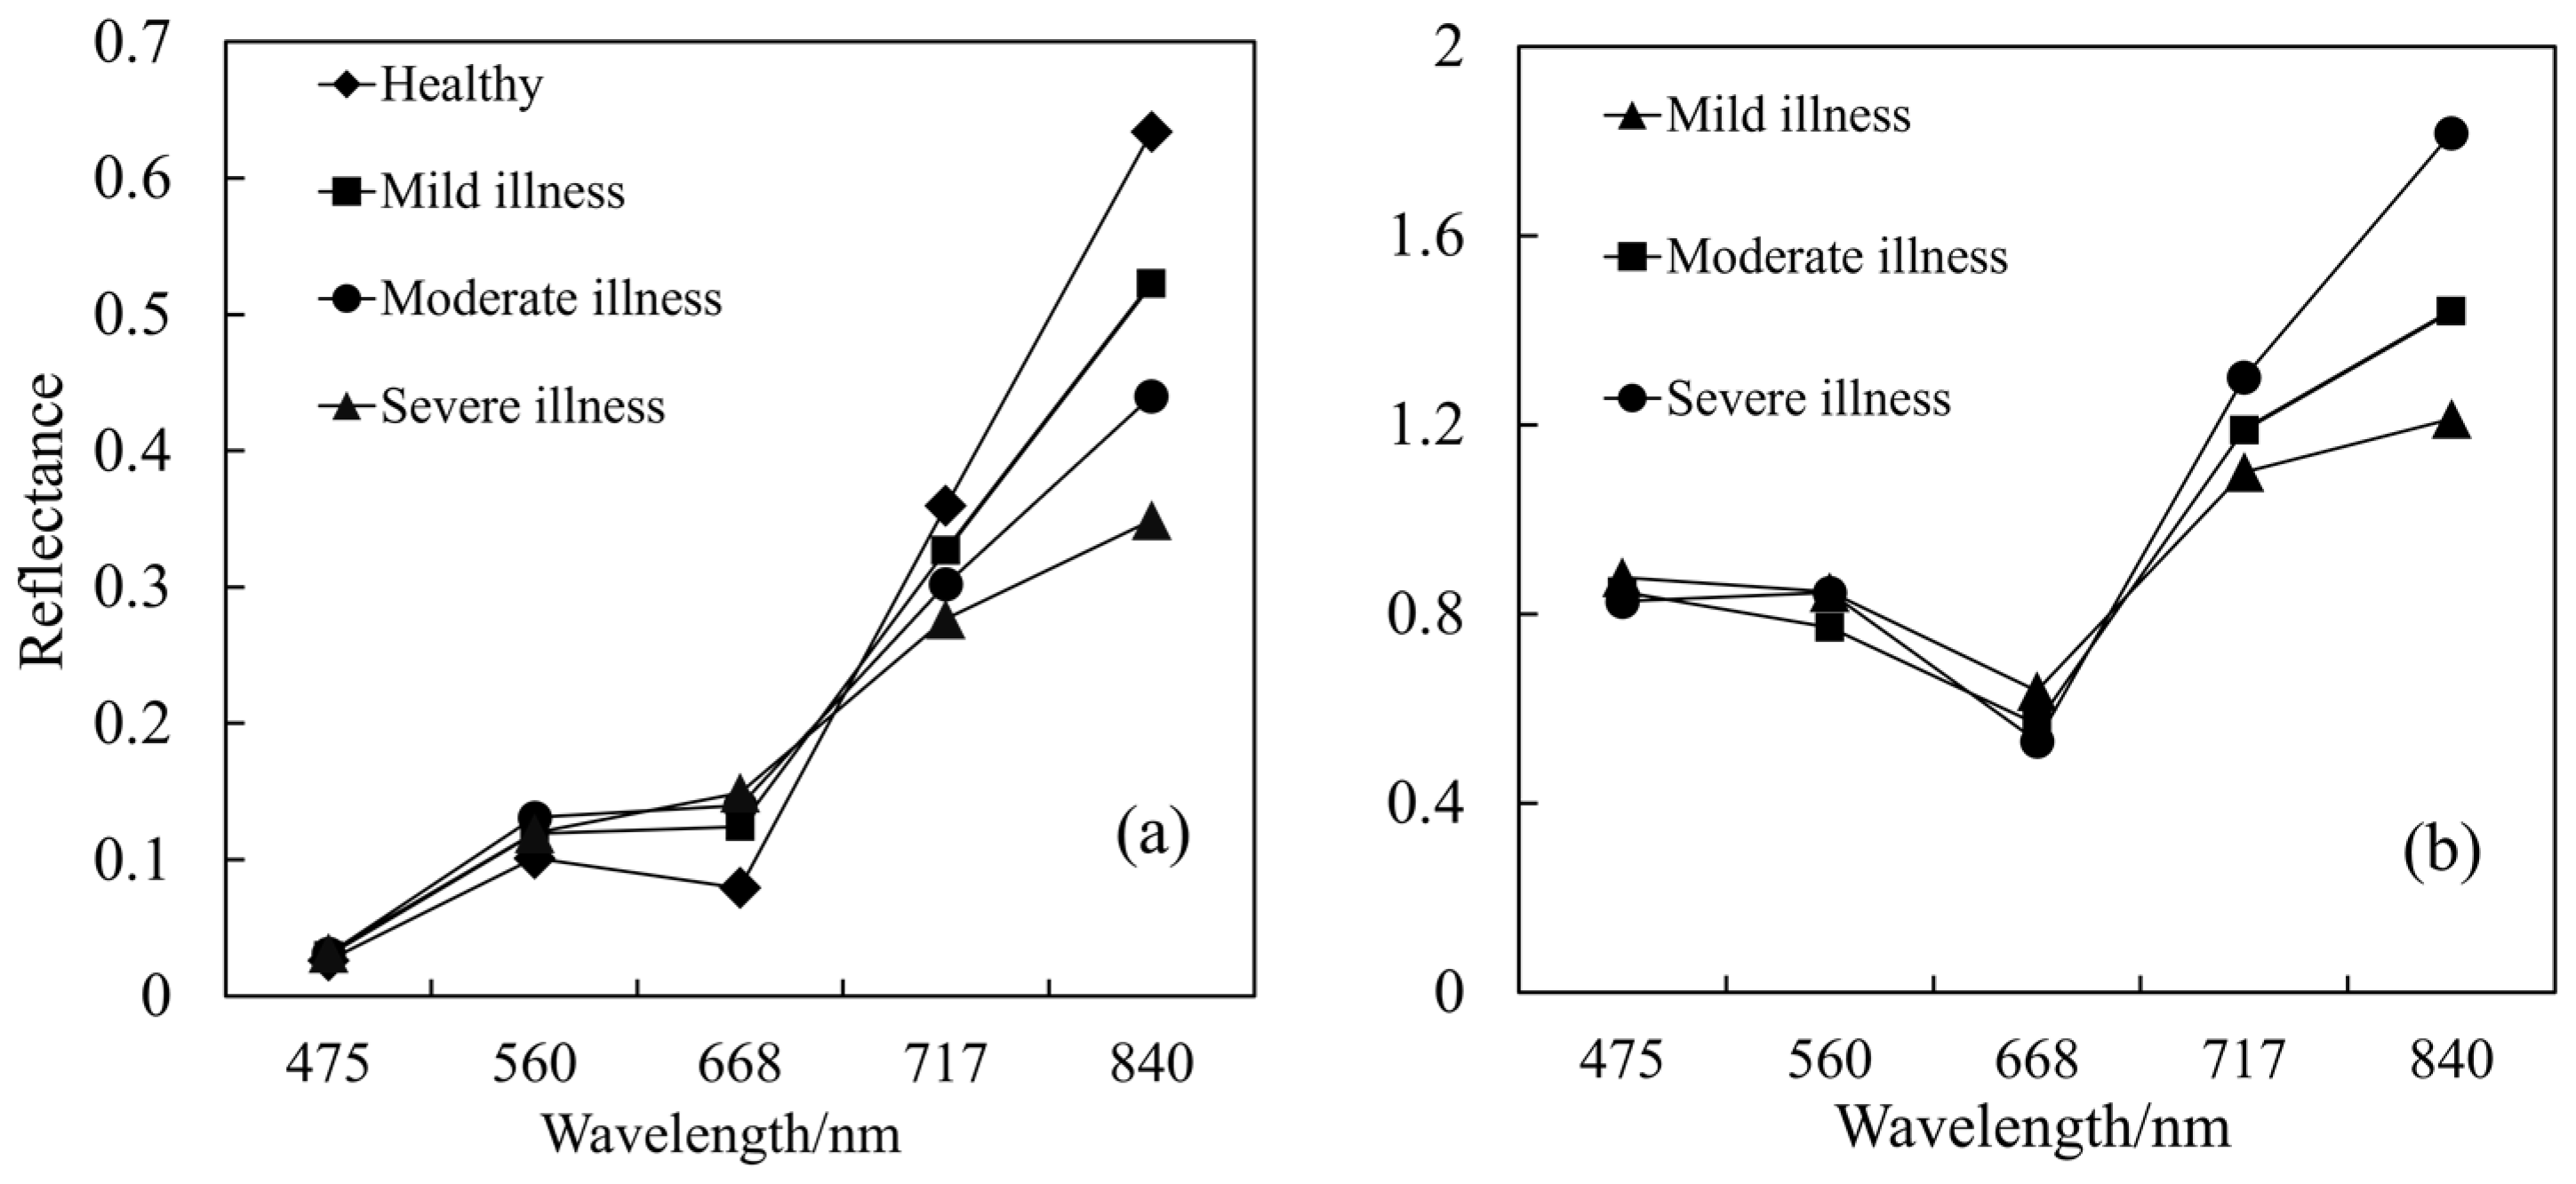
3.1. Spectral Response and Correlation Analysis

First, take the 1.44 cm spatial resolution image as an example (the analysis results of other resolution images are similar), and analyze the spectral response of diseased and healthy wheat. According to the Rules for Monitoring and Forecast of the Wheat Head Blight (GB/T15796-2011) [22], DI is divided into four categories, healthy (DI ≤ 5%), mild disease (5% < DI ≤ 25%), moderate disease (25% < DI ≤ 50%) and severe disease (DI > 50%), and the spectral reflectance curve of wheat scab is constructed. As can be seen in Figure 3a, there are clear differences between diseased and healthy wheat in terms of canopy reflectance, with a small difference between mildly diseased wheat, moderately diseased wheat and severely diseased wheat at 668 nm, 717 nm, and 840 nm, and a small difference between mildly diseased wheat and moderate and severe diseased wheat at 668 nm, indicating that 668 nm is a sensitive band. At 717 nm and 840 nm, with the increase in the disease degree, the band reflectance will continue to decrease, and the reflectance change rate will also continue to increase. The reflectance of severely ill wheat is between 0.08 and 0.28 lower than that of healthy wheat, with the largest difference occurring at 840 nm. Figure 3b shows that the reflectance of diseased wheat was lower than that of healthy wheat at 475 nm, 560 nm, and 668 nm. Indicating that 668 nm was the sensitive band in the early stages of the disease, the reflectance difference at 668 nm was the highest, and the reflectance of wheat with different disease grades was essentially unaltered. At 717 nm and 8480 nm, unhealthy wheat had a higher reflectance than healthy wheat. As the illness grade grew, the amount of impacted wheat at 840 nm increased, showing that 840 nm was the most sensitive band in the later stages of the disease. The correlation analysis between the reflectance of each wavelength band and the DI value of wheat scab (Table 3) shows that there is an extremely significant correlation at 668 nm, 717 nm, and 840 nm, and that the larger the wavelength, the larger the absolute value of correlation coefficient, which reaches 0.594 at 840 nm. Based on the above analysis, it is concluded that the red (668 nm), red edge (717 nm), and near-infrared (840 nm) bands are the sensitive bands of wheat scabs [13].

3.2. Coefficient of Correlation between Selected Vegetation Indices and Wheat Scab Disease Index

The regional mean value of each sampling point for the vegetation index in the statistical study area and the DI value of the wheat scab were correlated (Table 3). As can be seen from Table 3, all VIs and DI values have a very significant level of correlation (p < 0.01), except the carotenoid content index CRI2. The PSRI has the strongest correlation with a scab (R = 0.765), followed by the correlation coefficients of RGR, SIPI, ARI, and GLI, which are all above 0.7. The study found that the above five VIs all have red bands, while the VIs corresponding to R ≤ 0.6, such as CIrededge, CRI2, GDVI, GVI, and NPCI, do not have red bands, which shows that the red band has important reference value and research significance for the monitoring of scab.

3.3. Coefficient of Correlation between Texture Features and DI Value

The correlation between wheat TFs and scab DI values at various spatial resolutions was analyzed (Figure 4). All the correlation coefficients (R) are between −0.7~0.5. From the perspective of texture features, the average texture features perform best. The R between the red, RedEdge, Nir bands, and DI values are all greater than 0.35. The R in the Nir bands is the highest in all spatial resolutions; the second is entropy and second moment, which are similar; however, entropy is positively correlated with the DI value, whereas the second moment is negatively correlated; the R between variance texture feature and DI value is less than 0.3. The performance of the Nir band is the best among the different bands, and the performance of RedEdge is the second best. The R of six texture features in each spatial resolution image is greater than 0.3. The Blue band performs worst, and the R of all texture features is less than 0.3. From the perspective of different spatial resolutions, there is only one texture feature with an R greater than 0.5 for each spatial resolution, of which the Nir_mea correlation coefficient (R = −0.652) of 3.47 cm spatial resolution is the largest. The maximum R of texture features greater than 0.4 is 1.44 cm and 3.47 cm spatial resolution, both of which are 10. With only 3.47 cm of spatial resolution and 20 TFs, the maximum R greater than 0.3 is achieved. In conclusion, it is discovered that the 3.47 cm spatial resolution image performs best when analyzing TFs.

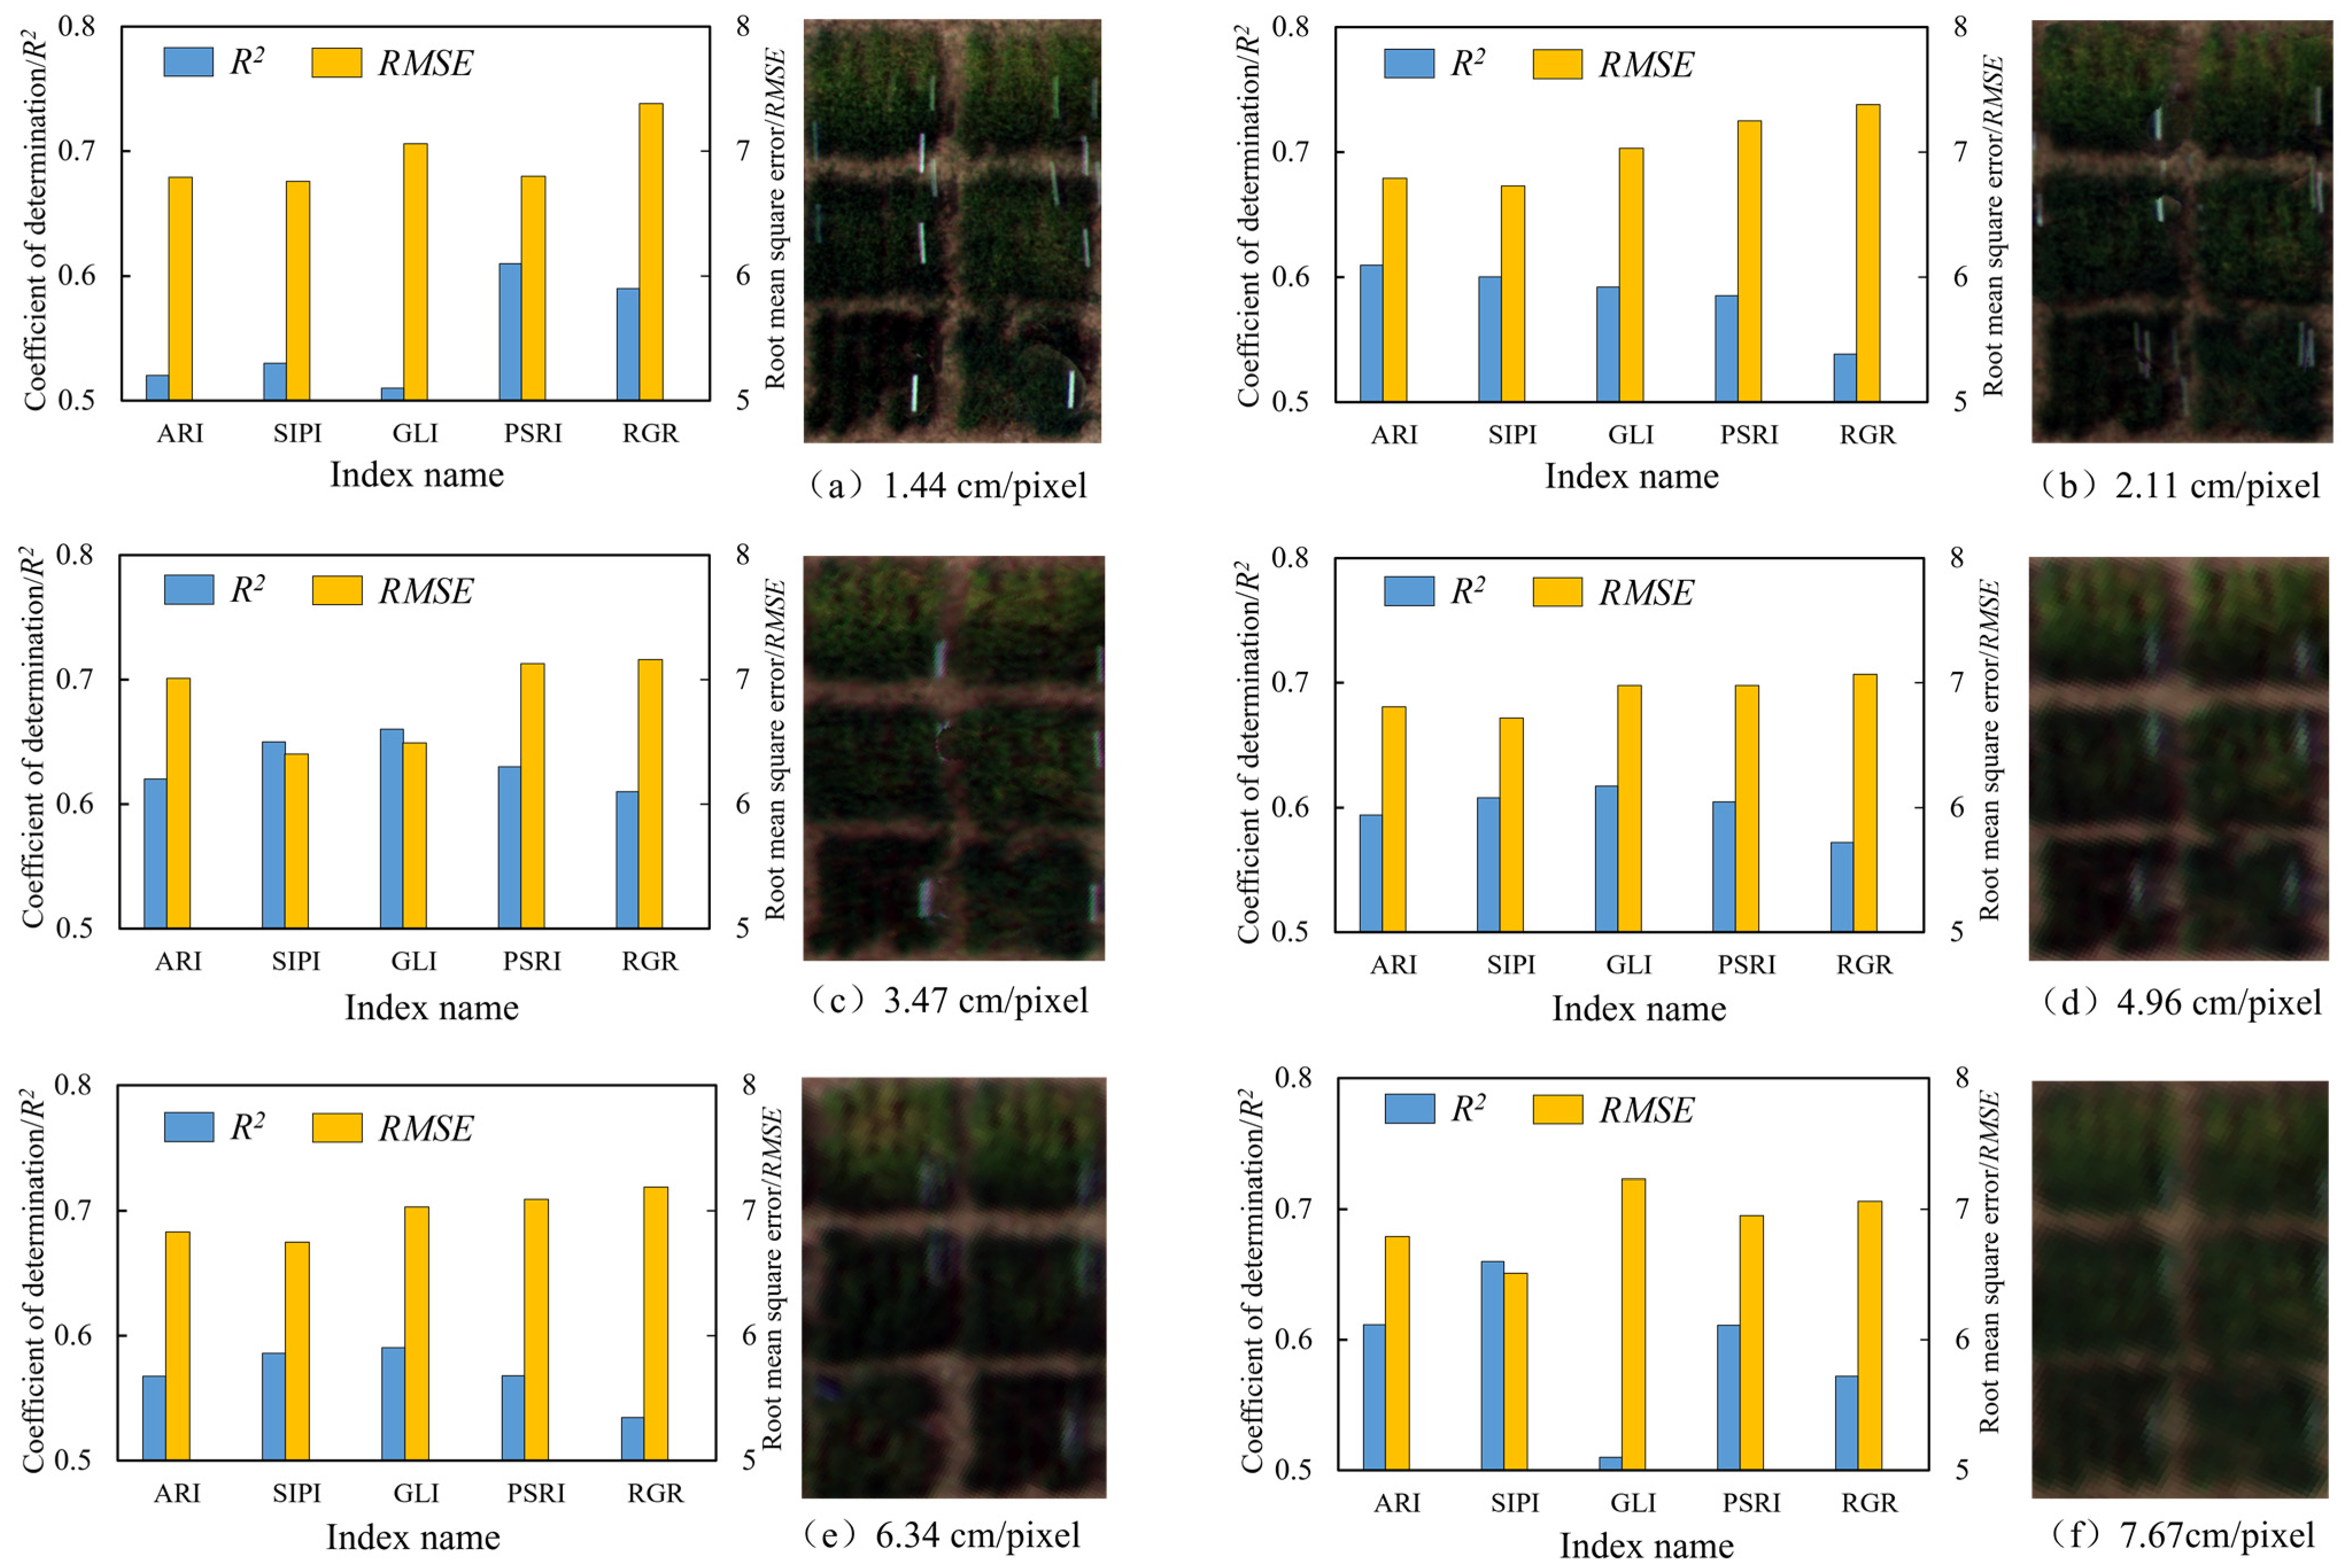
3.4. Selection of the Best Spatial Resolution

In order to determine the best resolution for monitoring wheat scabs, this study first analyzed the effect of spatial resolution on the reflectance of each band. As shown in Figure 5, except for 560 nm (green band), all spatial resolution images have little influence on band reflectance. It is difficult to screen the best spatial resolution by band reflectance.
A monitoring model’s accuracy will be impacted by information redundancy, increased calculation, challenges with data processing, and redundant information. VIs with a significant correlation to scab (p < 0.01) and R > 0.7 were chosen to increase data processing effectiveness. Table 3 shows that the requirements are met by PSRI, RGR, SIPI, ARI, and GLI. Because the correlation coefficient has positive and negative differences, the determination coefficient is used for comparison instead of the correlation coefficient. Only the top 5 VIs with the strongest correlation to scab are analyzed for each spatial resolution image, and a vegetation index correlation diagram with five different spatial resolutions is established.
It can be seen from Figure 6 that there are some differences in the correlation of various VIs under different spatial resolutions. Among them, the monitoring accuracy of PSRI (0.57 < R2 < 0.63) and RGR (0.57 < R2 < 0.62) are relatively stable, but the RMSE of each spatial resolution of RGR is above 7, which means that the dispersion of RGR is large, and there are large differences in the reflectance of each disease grade; SIPI (0.53 < R2 < 0.66) and ARI (0.53 < R2 < 0.66) have general monitoring accuracy in high spatial resolution, but high monitoring accuracy in low spatial resolution, and RMSE is below 7; GLI (0.51 < R2 < 0.66) has poor monitoring accuracy and stability, and performs poorly at low and high spatial resolutions, but performs well at 3.47 cm and 4.96 cm spatial resolutions.
Through comprehensive analysis of Table 1, Figure 4, and Figure 6, it is found that high spatial resolution images can be obtained at low flying altitudes. Still, the high spatial resolution does not mean high monitoring accuracy. The monitoring accuracy of each VIs with a high spatial resolution (1.44 cm) is generally low, and the image processing efficiency is low. If the required image resolution does not meet the wheat ear scale test requirements, then 3.47 cm is the best spatial resolution.

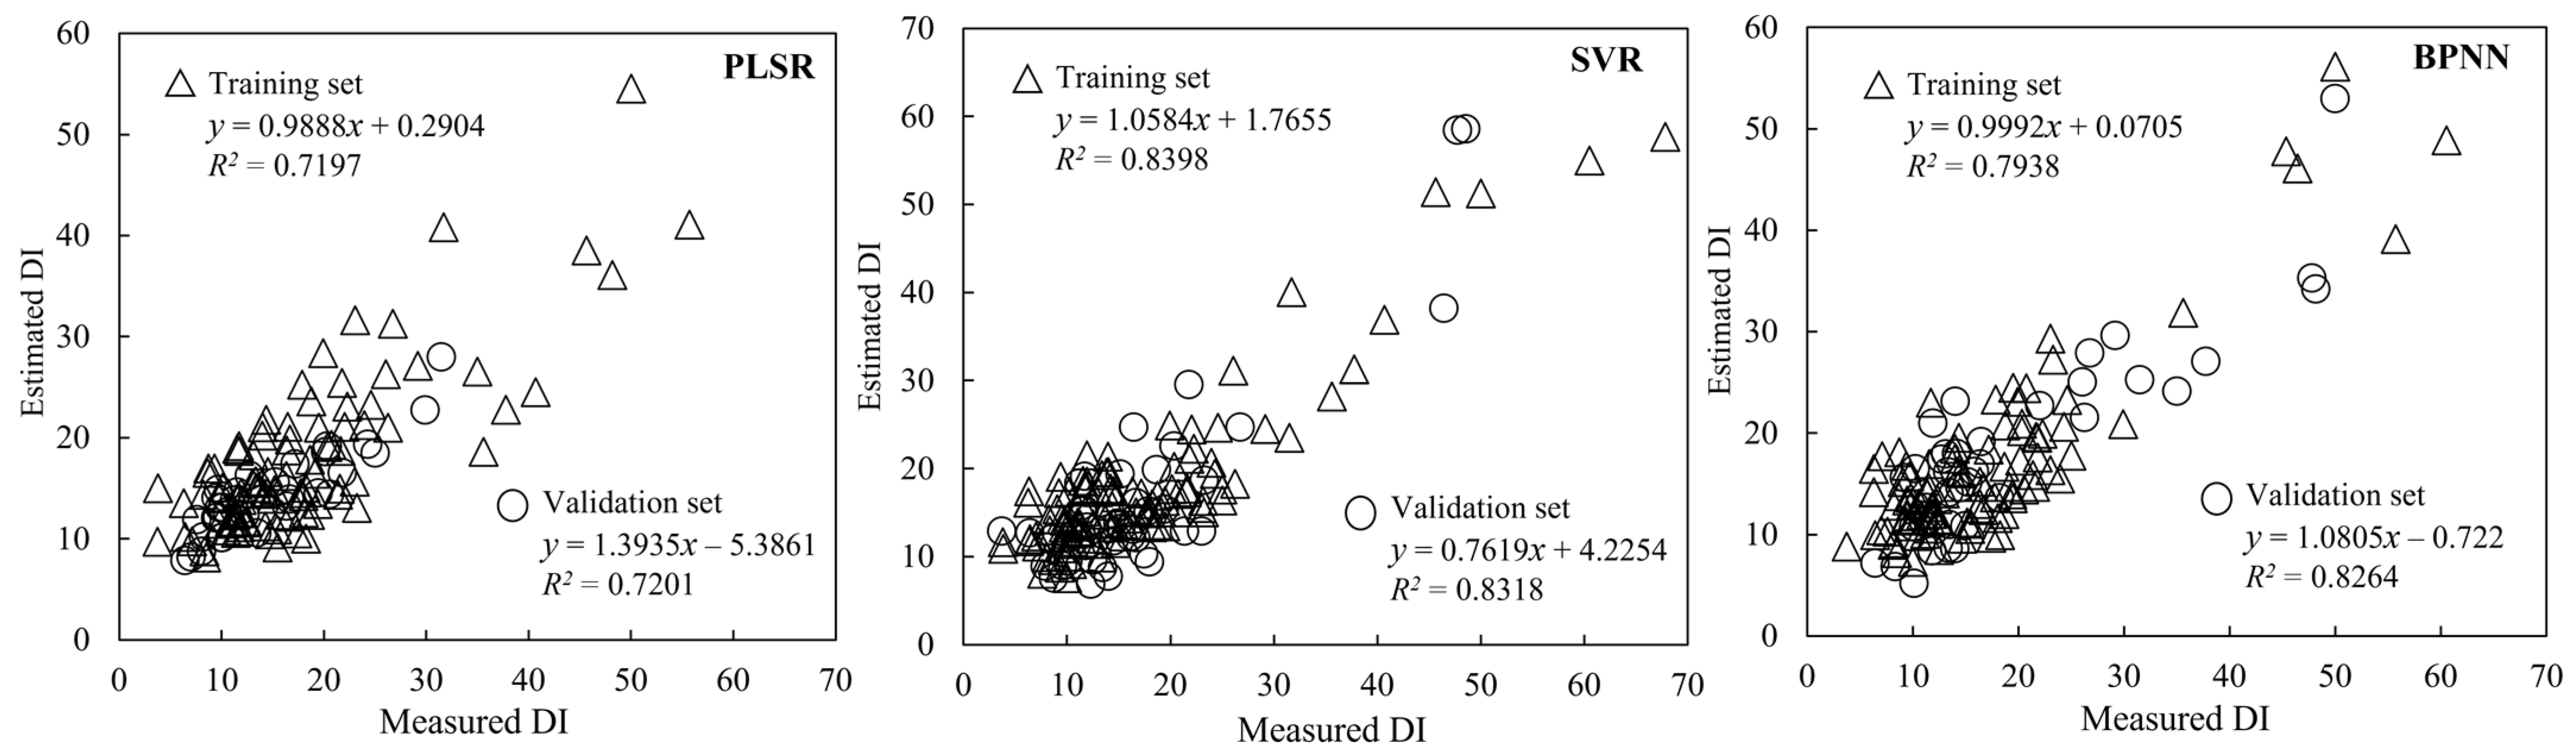
3.5. Establishment and Evaluation of Monitoring Model

The monitoring effect of a single data source monitoring model is poor, which cannot achieve the purpose of accurately monitoring wheat scabs. To give full play to the synergy between different data sources, this study takes the best spatial resolution of 3.47 cm as the research object, five VIs (PSRI, RGR, SIPI, ARI, and GLI) with the highest correlation with Scab, and nine TFs (Nir_mea, Rededge_mea, Red_mea, Nir_sec, Rededge_sec, Nir_hom, Nir_dis, Nir_ent and Rededge_ent) with the highest correlation with scab were selected to establish a wheat scab monitoring model (Figure 7). The training and verification results of the three algorithms are shown in Table 4.
Table 4 shows that the PLSR monitoring model, which has the lowest R2 of the three algorithms in the VIs model, has RMSE values of 5.14 and 4.32 and an R2 in the training set and prediction set of 0.73 and 0.72, respectively. The PLSR verification set has the lowest RMSE, but due to its low standard deviation, its verification set’s RPD is only 1.61. The SVR monitoring model has an R2 of 0.79 and 0.77, an RMSE of 4.83 and 4.79, and an RPD of 1.88 and 2.30, respectively. The RPD of the SVR is the largest among the three algorithms, whether in the training set or the validation set. The RPD of the validation set is greater than 2.0, which indicates that the model has excellent prediction ability. The RPD of BPNN monitoring model is 1.75 and 1.77, respectively. RPD greater than 1.5 indicates that the model has certain prediction ability. The monitoring accuracy of the TFs model is generally lower than that of the VIs model. Except for the RPD of the SVR algorithm training set, which is slightly greater than 1.5, all other RPDs are less than 1.5, indicating that the TFs model has almost no prediction ability for wheat scab.
Taking the VIs data source as a benchmark, when fusing TFs data for modeling, R2 and RPD of the training set and the verification set both improved, of which R2 of the training set increased by 6.45% on average, R2 of the verification set increased by 8.77%, RPD of the training set increased by 6.58%. RPD of the verification set increased by nearly 20.19 %, of which RPD of SVR increased the most, by nearly 28%, and RMSE of the training set and the verification set decreased. RMSE of the training set decreased by 7.21%. The RMSE of the validation set decreased the most, by 25.91%, and the RPD of all modeling algorithms was greater than 1.5. Among them, the RPD of the SVR and BPNN algorithms in the validation set was greater than 2.0, indicating that the VIs and TFs fusion model has excellent prediction ability.
From the comparison of modeling algorithms, SVR and BPNN algorithms have a better monitoring effect, while PLSR algorithm has a worse monitoring effect. Among them, SVR has the highest R2, the lowest RMSE, and the largest RPD, indicating that the SVR algorithm has the best model prediction ability, BPNN is the second, and PLSR is the worst. From the independent verification results, the monitoring effect of the VIs and TFs fusion model is better than any single data source model, and it has better fitting and prediction accuracy, which shows that the multi-source data fusion method has certain advantages in monitoring wheat scabs.
This study uses a 3.47 cm resolution image as an example to demonstrate the disease grade and distribution of diseased wheat in the study area. The PSRI, RGR, SIPI, ARI, and GLI vegetation indices with the highest correlation to DI values are regressed using multiple linear regression (MLR) to create the MLR model of wheat disease (DI = 288.91 PSRI + 194.58 RGR-1839.93 API–42.75 SIPI–5.23 GLI–123.86), and the MLR model is then used to construct the distribution map of wheat scab (Figure 8). It can be seen from Figure 7 and Figure 8 that the distribution of wheat scab in the study area is aggregated, and most of the wheat is in the state of mild disease (5% < DI ≤ 25%), and few are in the state of severe disease, accounting for only about 5%. The reason may be that the wheat varieties in the study area are complex, most of the varieties of wheat have a certain ability to resist scab, and the healthy wheat is concentrated, which indicates that the wheat here has a strong ability to resist scab, it may also be in the middle of the scab outbreak at this time, and there is a tendency to continue to spread. The distribution and development of wheat scabs in the study area are basically consistent with the experimental observation results, which indicates that the monitoring effect of the established stepwise regression model is better.

4. Discussion

UAV remote sensing monitoring is based on the spectral changes of crops before and after damage [44]. Crop disease-induced changes in surface color, cell structure, and water content will be visible in the spectrum. Spectral changes in visible light bands (475 nm, 560 nm, and 668 nm) are primarily caused by changes in leaf color, whereas changes in cell structure cause spectral changes in near-infrared bands (717 nm and 840 nm) [12]. As shown in Figure 3a above, the reflectance of diseased wheat is higher than that of healthy wheat in the visible light band but lower than that of healthy wheat in the near-infrared band, which indicates that the color of wheat (red mold layer is formed on the surface of wheat ears) and the cell structure (withered and white ears of wheat ears) have changed after scab infection, and the degree of structural change is greater than that of color change. Recently, several researchers [45] have been successful in identifying diseased wheat ears in wheat fields using multispectral or hyperspectral imaging. They find that the red band was the most susceptible to wheat scab, which coincides with the findings of this study. The 668 nm (red band) reflectance essentially remained unchanged with increasing wheat scab infection levels, as shown in Figure 3b, and the ratio of healthy to diseased wheat ranged from 0.53 to 0.63. The reflectance at 840 nm (Nir band) gradually increases, and the ratio ranges between 1.21 and 1.81. The aforementioned observations suggest that the 668 nm band is better suited for discriminating between healthy and diseased wheat, whereas the 840 nm band is better suited for distinguishing between wheat with varying degrees of disease. Machine learning paired with remote sensing data has been frequently employed and has produced good results in wheat remote sensing monitoring [46,47]. Jing et al. [48] employed a combination of SVR and genetic algorithm (GA) to pick wheat stripe rust traits, demonstrating the SVR algorithm’s universality. Wang et al. [49] screened wheat varieties using machine learning approaches such as SVR, demonstrating the superiority of the SVR algorithm. In this study, a scab surveillance model based on PLSR, SVM, and BPNN was developed. The SVR model outperforms all other monitoring models. After combining TFs and VIs data sources, R2 and RPD of both training and validation sets improve, while RMSE decreases. This finding is consistent with the findings of Feng et al. [38], who used multi-source data to monitor wheat powdery mildew. VIs models (PSRI, RGR, SIPI, ARI, and GLI) primarily represent pigment and cell structural changes in diseased wheat. TFs models (Nir_mea, Rededge_mea, Rededg_mea, Nir_sec, Rededge_sec, Nir_hom, Nir_dis, Nir_ent, Rededge_ent.) mostly reflect diseased wheat’s exterior color and surface morphology [12]. The monitoring accuracy of the VIs and TFs fusion model is higher than that of the single data model, which could be due to the fact that the VIs and TFs model can reflect both internal and external changes in wheat induced by scab.
It is considered to be one of the difficulties in remote sensing monitoring to select the appropriate spatial scale according to the research object and test requirements [50]. High spatial resolution images can be obtained at a low flight scale, which can correspondingly reduce the proportion of mixed pixels and improve the resolution of ground objects. However, synthesizing high-resolution images will greatly increase the image processing time and easily cause splicing dislocation in the image splicing process (Figure 6), which may also be one of the reasons for the low correlation between high-resolution images and vegetation indices. When evaluating the impact of the image resolution of each flight scale on scab monitoring accuracy, this study first extracted the reflectance of each band and the DI value of the scab for correlation analysis. The results showed that except for the green band (560 nm), the reflectance of other bands was not significantly affected by spatial resolution (Figure 8). The appropriate geographic resolution for scab monitoring was then determined by doing a correlation study on VIs and TFs. The findings demonstrate that spatial resolution has a considerable impact on the VIs and TFs models but no discernible impact on band reflectance. The choice of 3.47 cm as the highest spatial resolution could be connected to the size of the wheat ear. The best spatial resolution for a rapeseed seedling [51] is 2.61 cm. The environmental background, such as soil and shadow, will affect the monitoring accuracy of the monitoring model. In this study, RDVI has been used to remove the soil background of the image data before modeling. However, there are still shadows and part of the soil background in the image, as shown in Figure 8. The shadow background at the edge of each small field in the figure is identified as wheat with moderate or severe disease, which affects the monitoring accuracy of the model. How to effectively remove the shadow background of remote sensing images is also another difficulty in remote sensing monitoring [52].
The advancement of knowledge and technology has some bearing on how agricultural diseases are monitored. Using near-ground spectroscopy, it is possible to monitor wheat diseases with a considerable level of precision [4,53]. However, large-scale macroscopic monitoring of near-Earth spectroscopy is difficult. Although satellite remote sensing can enable large-scale macro monitoring of wheat diseases [54], it is susceptible to cloud cover, revisit period, and image resolution. However, cloud cover, revisit period, and image resolution are all easily influenced. Low-altitude UAV remote sensing is unaffected by the aforementioned factors, and it has the advantages of low cost and quick acquisition speed, opening up a new avenue for large-scale farmland monitoring. The UAV remote sensing platform can transport a variety of sensors, including hyperspectral sensors with a large number of bands but at a high cost. Low-cost visible light sensors with a limited number of bands are available. A multispectral sensor with a moderate price and number of bands is used in this study, making it more suitable for agricultural production and disease monitoring applications [38]. However, this does not imply that multispectral sensors perform best in monitoring wheat diseases. Many studies use the low cost and wide applicability of visible light sensors to monitor wheat diseases [55,56]. However, because the available spectral information of visible light sensors is limited, detecting disease information in the early stages of wheat disease is difficult. The hyperspectral sensor has significant advantages in detecting spectral details and can more accurately determine the range of wheat-sensitive bands [12,17]. Future research can compare the performance of UAV hyperspectral and multispectral remote sensing in monitoring wheat scabs at various stages. The near-Earth spectral technology can also be used to obtain ground data, as well as the UAV multi-spectral acquisition of remote sensing data, as well as the comparison and analysis of the two while taking the benefits of near-Earth spectral imaging and UAV multi-spectral imaging into account. Finally, the findings of this study suggest a strategy for field crop diseases in UAV monitoring areas, specifically for the classification and variable application of wheat scabs using near-ground remote sensing monitoring.

5. Conclusions

In this study, UAV remote sensing was used to obtain multispectral data of wheat scab at the filling stage. Through correlation analysis between each band and DI value, and analysis of spectral differences between healthy and diseased wheat, the sensitive band of wheat scab was determined, the VIs related to the sensitive band was screened, and the VIs and TFs with the highest correlation with wheat scab were selected, so as to evaluate the best spatial resolution for monitoring wheat scab, and the monitoring model of wheat scab was established based on five VIs and nine TFs with the highest correlation. The following conclusions are obtained:
(1)
Wheat scab-sensitive bands (668 nm), red edge (717 nm), and Nir (840 nm) are the wheat scab-sensitive bands. PSRI, RGR, SIPI, ARI, and GLI are the most sensitive VIs for monitoring wheat scabs. The TFs with the highest correlation with the DI of wheat scab are Nir_mea, Rededge_mea, Rededge_mea, Nir_sec, Rededge_sec, Nir_hom, Nir_dis, Nir_ent, and RedEdge_ent.
(2)
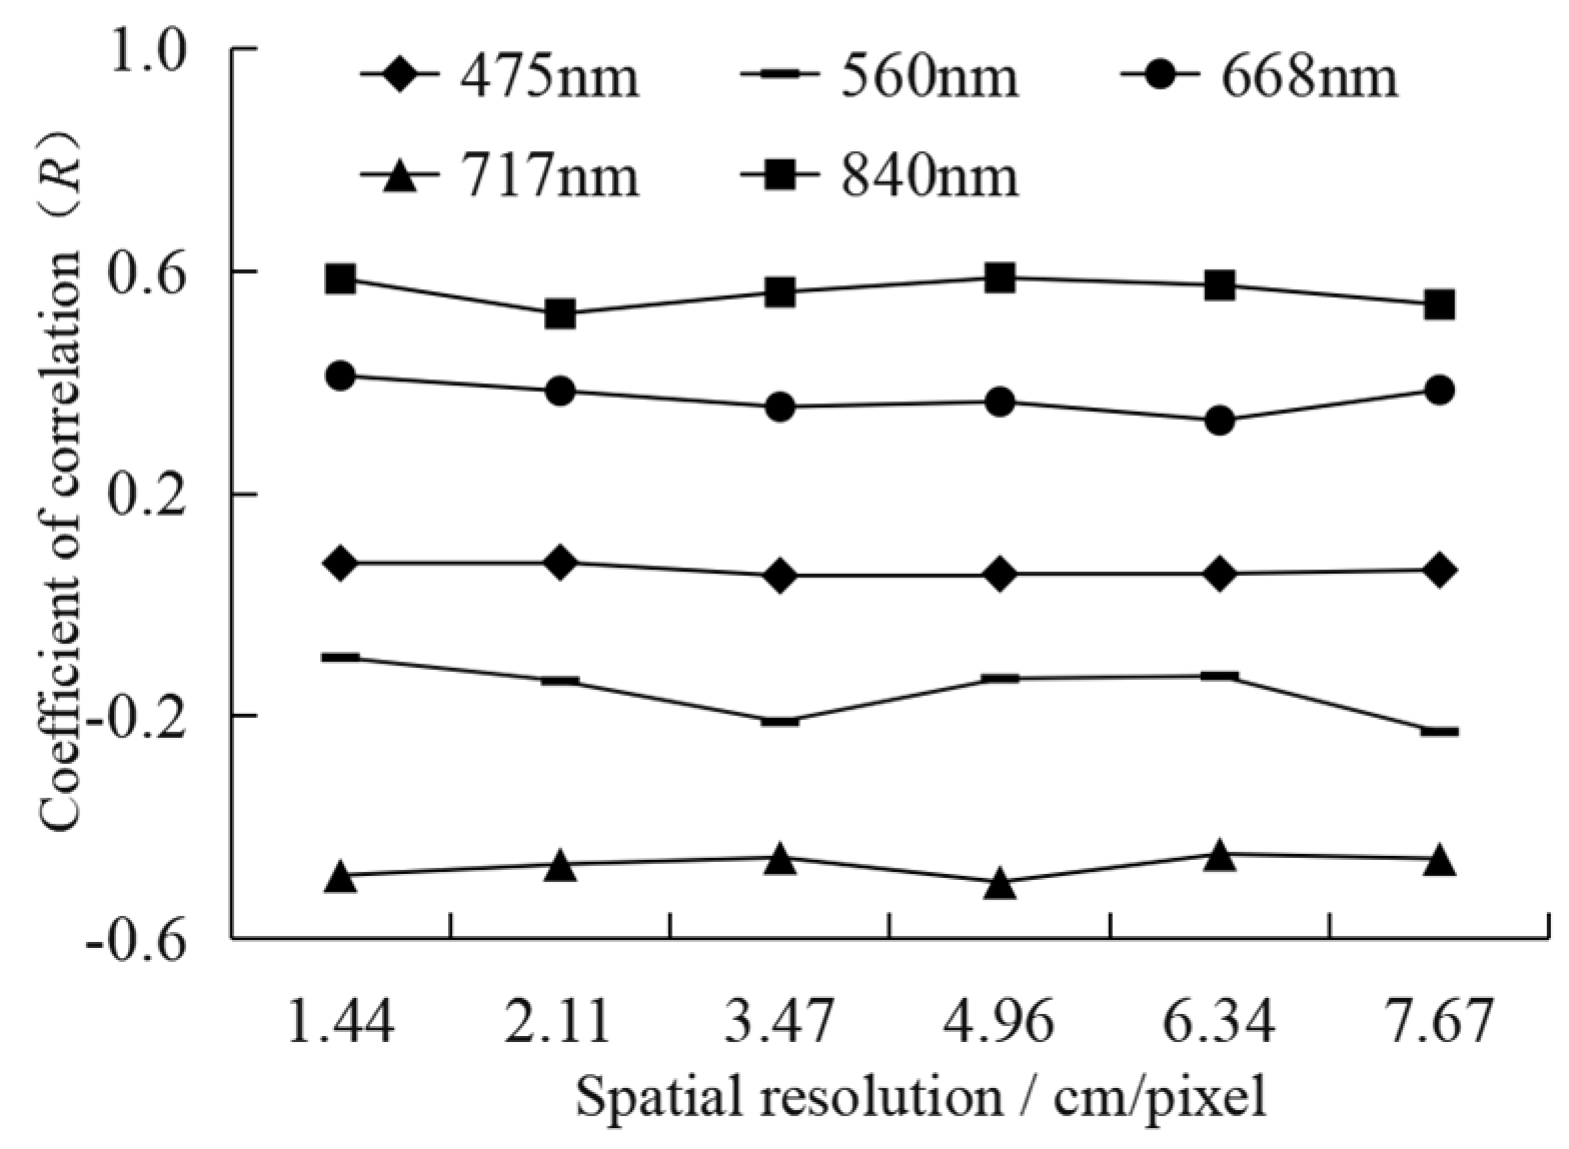
The spatial resolution has no obvious influence on band reflectance, but it greatly influences VIs and TFs models. By analyzing the correlation between vegetation index and texture characteristics of each spatial resolution image and wheat scab, it is determined that 3.47 cm is the best spatial resolution.
(3)
The multi-source data fusion method has better fitting and monitoring accuracy than the single data source monitoring model. It is more suitable for monitoring wheat scabs by UAV remote sensing.
(4)
The monitoring accuracy of the SVR algorithm is higher when compared to PLSR and BPNN algorithms. The R2 of the VIs and TFs monitoring model’s training set is 0.81, the RMSE is 4.27, the RPD is 1.88, and the R2 of its validation set is 0.83, the RMSE is 3.35, and the RPD is 2.72.
We only conducted one day of observation testing in this study, and the wheat scab monitoring model is not perfect or universal. Second, the wheat varieties in this experimental field are not uniform, which may have an effect on the results of the experiment. In our further studies, we will extend the observation period of wheat scabs and fully exploit the disease characteristics of wheat scabs in each period. We will also add polarization information as a supplement to light intensity information to establish a more perfect monitoring model.

Author Contributions

Conceptualization, W.Z.; methodology, W.Z. and Z.F.; software, Z.F.; validation, W.Z. and P.Z.; formal analysis, W.Z.; investigation, Z.F. and S.D.; resources, W.Z. and X.W.; data curation, Z.F.; writing—original draft preparation, Z.F.; writing—review and editing, W.Z. and Z.F.; visualization, Z.F.; supervision, W.Z. and P.Z.; project administration, W.Z.; funding acquisition, W.Z. All authors have read and agreed to the published version of the manuscript.

Funding

This research was funded by National Natural Science Foundation of China (61901194), Jiangsu Agricultural Science and Technology Innovation Fund (CX(21)3061), National Natural Science Foundation of China (32071905), Superior disciplines in Jiangsu Province (PAPD-2018-87), and Innovation Training Plan of Jiangsu University (202110299634X).

Institutional Review Board Statement

This study not involving humans.

Data Availability Statement

Data sharing is not applicable to this article.

Conflicts of Interest

The authors declare no conflict of interest.

References

  1. Han, J.; Zhang, Z.; Cao, J.; Luo, Y.; Zhang, L.; Li, Z.; Zhang, J. Prediction of winter wheat yield based on multi-Source data and machine learning in China. Remote Sens. 2020, 12, 236. [Google Scholar] [CrossRef] [Green Version]
  2. Zhang, D.; Gu, C.; Wang, Z.; Zhou, X.; Li, W. Evaluating the efficacy of fungicides for wheat scab control by combined image processing technologies. Biosyst. Eng. 2021, 211, 230–246. [Google Scholar] [CrossRef]
  3. Drakopoulos, D.; Kagi, A.; Gimeno, A.; Six, J.; Jenny, E.; Forrer, H.R.; Musa, T.; Meca, G.; Vogelgsang, S. Susanne prevention of fusarium head blight infection and mycotoxins in wheat with cut-and-carry biofumigation and botanicals. Field Crop. Res. 2020, 246, 9. [Google Scholar] [CrossRef]
  4. Bauriegel, E.; Herppich, W.B. Hyperspectral and Chlorophyll Fluorescence Imaging for Early Detection of Plant Diseases, with Special Reference to Fusarium spec. Infections on Wheat. Agriculture 2014, 4, 32–57. [Google Scholar] [CrossRef] [Green Version]
  5. Meng, R.; Lv, Z.; Yan, J.; Chen, G.; Zhao, F.; Zeng, L.; Xu, B. Development of Spectral Disease Indices for Southern Corn Rust Detection and Severity Classification. Remote Sens. 2020, 12, 3233. [Google Scholar] [CrossRef]
  6. Nguyen, C.; Sagan, V.; Maimaitiyiming, M.; Maimaitijiang, M.; Bhadra, S.; Kwasniewski, M.T. Early Detection of Plant Viral Disease Using Hyperspectral Imaging and Deep Learning. Sensors 2021, 21, 742. [Google Scholar] [CrossRef] [PubMed]
  7. Cai, Z.; Liu, Z.; Kou, L.; Kou, L. Reliable UAV Monitoring System Using Deep Learning Approaches. IEEE Trans. Reliab. 2022, 71, 973–983. [Google Scholar] [CrossRef]
  8. Song, X.; Wu, F.; Lu, X.; Yang, T.; Ju, C.; Sun, C.; Liu, T. The classification of farming progress in rice–wheat rotation fields based on UAV RGB images and the regional mean model. Agriculture 2022, 12, 124. [Google Scholar] [CrossRef]
  9. Su, J.; Liu, C.; Hu, X.; Xu, X.; Guo, L.; Chen, W.-H. Spatio-temporal monitoring of wheat yellow rust using UAV multispectral imagery. Comput. Electron. Agric. 2019, 167, 105035. [Google Scholar] [CrossRef]
  10. Su, J.; Liu, C.; Coombes, M.; Hu, X.; Wang, C.; Xu, X.; Li, Q.; Guo, L.; Chen, W.-H. Wheat yellow rust monitoring by learning from multispectral UAV aerial imagery. Comput. Electron. Agric. 2018, 155, 157–166. [Google Scholar] [CrossRef]
  11. Su, B.; Liu, Y.; Huang, Y.; Wei, R.; Cao, X.; Han, D. Analysis for stripe rust dynamics in wheat population using UAV remote sensing. Trans. Chin. Soc. Agric. Eng. 2021, 37, 127–135. [Google Scholar]
  12. Guo, A.; Huang, W.; Dong, Y.; Ye, H.; Ma, H.; Liu, B.; Wu, W.; Ren, Y.; Ruan, C.; Geng, Y. Wheat yellow rust detection using UAV-based hyperspectral technology. Remote Sens. 2021, 13, 123. [Google Scholar] [CrossRef]
  13. Heidarian Dehkordi, R.; El Jarroudi, M.; Kouadio, L.; Meersmans, J.; Beyer, M. Monitoring wheat leaf rust and stripe rust in winter wheat using high-resolution UAV-based red-green-blue imagery. Remote Sens. 2020, 12, 3696. [Google Scholar] [CrossRef]
  14. Hong, Q.; Jiang, L.; Zhang, Z.; Ji, S.; Gu, C.; Mao, W.; Li, W.; Liu, T.; Li, B.; Tan, C. A Lightweight Model for Wheat Ear Fusarium Head Blight Detection Based on RGB Images. Remote Sens. 2022, 14, 3481. [Google Scholar] [CrossRef]
  15. Yan, Z.; Zhang, H.; Van Der Lee, T.; Waalwijk, C.; Van Diepeningen, A.; Deng, Y.; Feng, J.; Liu, T.; Chen, W. Resistance to Fusarium head blight and mycotoxin accumulation among 129 wheat cultivars from different ecological regions in China. World Mycotoxin J. 2020, 13, 189–200. [Google Scholar] [CrossRef]
  16. Feng, W.; Wang, X.; Song, X.; He, L.; Wang, Y.; Guo, T. Estimation of severity level of wheat powdery mildew based on canopy spectra reflectance. Acta Agron. Sin. 2013, 39, 1469–1477. [Google Scholar] [CrossRef]
  17. Liu, L.; Dong, Y.; Huang, W.; Du, X.; Ma, H. Monitoring wheat fusarium head blight using unmanned aerial vehicle hyperspectral imagery. Remote Sens. 2020, 12, 3811. [Google Scholar] [CrossRef]
  18. Xiao, Y.; Dong, Y.; Huang, W.; Liu, L.; Ma, H. Wheat fusarium head blight detection using UAV-based spectral and texture features in optimal window size. Remote Sens. 2021, 13, 2437. [Google Scholar] [CrossRef]
  19. Ma, H.; Huang, W.; Jing, Y.; Pignatti, S.; Laneve, G.; Dong, Y.; Ye, H.; Liu, L.; Guo, A.; Jiang, J. Identification of fusarium head blight in winter wheat ears using continuous wavelet analysis. Sensors 2019, 20, 20. [Google Scholar] [CrossRef] [Green Version]
  20. Zhou, K.; Cheng, T.; Zhu, Y.; Cao, W.; Ustin, S.L.; Zheng, H.; Yao, X.; Tian, Y. Assessing the impact of spatial resolution on the estimation of leaf nitrogen concentration over the full season of paddy rice using near-surface imaging spectroscopy data. Front. Plant Sci. 2018, 9, 964. [Google Scholar] [CrossRef] [PubMed] [Green Version]
  21. Breunig, F.M.; Galvão, L.S.; Dalagnol, R.; Santi, A.L.; Della Flora, D.P.; Chen, S. Assessing the effect of spatial resolution on the delineation of management zones for smallholder farming in southern Brazil. Remote Sens. Appl. Soc. Environ. 2020, 19, 100325. [Google Scholar] [CrossRef]
  22. Li, L.; Dong, Y.; Xiao, Y.; Liu, L.; Zhao, X.; Huang, W. Combining disease mechanism and machine learning to predict wheat fusarium head blight. Remote Sens. 2022, 14, 2732. [Google Scholar] [CrossRef]
  23. Huang, L.; Ruan, C.; Huang, W.; Shi, Y.; Peng, D.; Ding, W. Wheat powdery mildew monitoring based on GF-1 remote sensing image and relief-mRMR-GASVM model. Trans. Chin. Soc. Agric. Mach. 2018, 34, 167–175. [Google Scholar]
  24. Roth, K.L.; Roberts, D.A.; Dennison, P.E.; Peterson, S.H.; Alonzo, M. The impact of spatial resolution on the classification of plant species and functional types within imaging spectrometer data. Remote Sens. Environ. 2015, 171, 45–57. [Google Scholar] [CrossRef]
  25. Zhang, Z.; Zhou, Y.; Yang, S.; Tan, C.; Lao, C.; Xu, C. Inversion method for soil water content in winter wheat root zone with eliminating effect of soil background. Trans. Chin. Soc. Agric. Mach. 2021, 52, 197–207. [Google Scholar]
  26. Gitelson, A.A.; Merzlyak, M.N.; Chivkunova, O.B. Optical properties and nondestructive estimation of anthocyanin content in plant leaves. Photochem. Photobiol. 2001, 74, 38–45. [Google Scholar] [CrossRef]
  27. Chivasa, W.; Mutanga, O.; Burgueño, J. UAV-based high-throughput phenotyping to increase prediction and selection accuracy in maize varieties under artificial MSV inoculation. Comput. Electron. Agric. 2021, 184, 106128. [Google Scholar] [CrossRef]
  28. Li, B.; Li, B.; Zhang, L.; Han, J.; Bian, C.; Li, G.; Xu, X.; Li, P. Above-ground Biomass estimation and yield prediction in potato by using UAV-based RGB and hyperspectral imaging. ISPRS J. Photogramm. Remote Sens. 2020, 162, 161–172. [Google Scholar] [CrossRef]
  29. Patrick, A.; Pelham, S.; Culbreath, A.; Holbrook, C.C.; Li, C. High throughput phenotyping of tomato spot wilt disease in peanuts using unmanned aerial systems and multispectral imaging. IEEE Instrum. Meas. Mag. 2017, 20, 4–12. [Google Scholar] [CrossRef]
  30. Merzlyak, M.N.; Gitelson, A.A.; Chivkunova, O.B.; Rakitin, V.Y. Non-destructive optical detection of pigment changes during leaf senescence and fruit ripening. Physiol. Plant. 1999, 106, 135–141. [Google Scholar] [CrossRef] [Green Version]
  31. Huang, L.; Zhang, H.; Chao, R.; Huang, W.; Zhao, J. Detection of Scab in wheat ears using in situ hyperspectral data and support vector machine optimized by genetic algorithm. Int. J. Agric. Biol. Eng. 2020, 13, 182–188. [Google Scholar] [CrossRef]
  32. Mahlein, A.K.; Rumpf, T.; Welke, P.; Dehne, H.W. Development of spectral indices for detecting and identifying plant diseases. Remote Sens. Environ. 2013, 128, 21–30. [Google Scholar] [CrossRef]
  33. Gitelson, A.; Merzlyak, M.N. Quantitative estimation of chlorophyll-a using reflectance spectra-experiments with autumn chestnut and maple leaves. J. Photochem. Photobiol. B 1994, 22, 247–252. [Google Scholar] [CrossRef]
  34. Zhou, J.; Yungbluth, D.; Vong, C.N.; Scaboo, A.; Zhou, J. Estimation of the maturity date of soybean breeding lines using UAV-Based multispectral imagery. Remote Sens. 2019, 11, 2075. [Google Scholar] [CrossRef] [Green Version]
  35. Santini, F.; Kefauver, S.C.; Araus, J.L.; Resco, D.V.; Martin, G.S.; Grivet, D.; Voltas, J. Bridging the genotype-phenotype gap for a Mediterranean pine by semi-automatic crown identification and multispectral imagery. New Phytol. 2021, 229, 245–258. [Google Scholar] [CrossRef]
  36. Huete, A.; Didan, K.; Miura, T.; Rodriguez, E.P.; Gao, X.; Ferreira, L.G. Overview of the radiometric and biophysical performance of the MODIS vegetation indices. Remote Sens. Environ. 2002, 83, 195–213. [Google Scholar] [CrossRef]
  37. Broge, N.H.; Leblanc, E. Comparing prediction power and stability of broadband and hyperspectral vegetation indices for estimation of green leaf area index and canopy chlorophyll density. Remote Sens. Environ. 2001, 76, 156–172. [Google Scholar] [CrossRef]
  38. Feng, Z.; Song, L.; Zhang, S.; Jing, Y.; He, L.; Li, F.; Feng, W. Wheat Powdery Mildew monitoring based on information fusion of multi-spectral and thermal infrared images acquired with an unmanned aerial vehicle. Sci. Agric. Sin. 2022, 55, 890–906. [Google Scholar]
  39. Tao, H.; Feng, H.; Yang, G.; Yang, X.; Liu, M.; Liu, S. Leaf area index estimation of winter wheat based on UAV imaging hyperspectral imagery. Trans. Chin. Soc. Agric. Mach. 2020, 51, 176–187. [Google Scholar]
  40. Wang, P.; Qian, H.; Zhang, R.; Han, D.; Wang, J.; Yi, M. Crop Growth monitoring and yield estimation based on deep learning: State of the art and beyond. Trans. Chin. Soc. Agric. Mach. 2022, 53, 1–14. [Google Scholar]
  41. Zhang, Z.; Lin, Z. LIBSVM: A Library for support vector machines. ACM J. Intel. Syst. Tec. 2011, 2, 1–27. [Google Scholar]
  42. Zhang, Z. Research on the Detection of strawberry sugar content by NIR based on SPXY-WT-CARS algorithm. Food Ferment. Sci. Technol. 2020, 56, 136–139. [Google Scholar]
  43. Wang, Y.; Li, F.; Wang, W.; Chen, X.; Chang, Q. Monitoring of winter wheat nitrogen nutrition based on UAV Hyperspectral Images. Trans. Chin. Soc. Agric. Eng. 2020, 36, 31–39. [Google Scholar]
  44. Mahlein, A.-K.; Kuska, M.T.; Thomas, S.; Wahabzada, M.; Behmann, J.; Rascher, U.; Kersting, K. Quantitative and qualitative phenotyping of disease resistance of crops by hyperspectral sensors: Seamless interlocking of phytopathology, sensors, and machine learning is needed! Curr. Opin. Plant. Biol. 2019, 50, 156–162. [Google Scholar] [CrossRef]
  45. Jin, X.; Jie, L.; Wang, S.; Qi, H.J.; Li, S.W. Classifying Wheat Hyperspectral Pixels of Healthy Heads and Fusarium Head Blight Disease Using a Deep Neural Network in the Wild Field. Remote Sens. 2018, 10, 395. [Google Scholar] [CrossRef] [Green Version]
  46. Liu, L.; Dong, Y.; Huang, W.; Du, X.; Luo, J.; Huang, W.; Ma, H. Enhanced regional monitoring of wheat powdery mildew based on an instance-based transfer learning method. Remote Sens. 2019, 11, 298. [Google Scholar] [CrossRef] [Green Version]
  47. Zhang, X.; Han, L.; Dong, Y.; Huang, W.; Huang, W.; Han, L.; González-Moreno, P.; Ma, H.; Ye, H.; Sobeih, T. A deep learning-based approach for automated yellow rust disease detection from high-resolution hyperspectral UAV images. Remote Sens. 2019, 11, 1554. [Google Scholar] [CrossRef] [Green Version]
  48. Jing, X.; Zhang, T.; Bai, Z.; Huang, W. Feature selection and model construction of wheat stripe rust based on GA and SVR algorithm. Trans. Chin. Soc. Agric. Mach. 2020, 51, 253–263. [Google Scholar]
  49. Wang, J.; Zhou, Q.; Shang, J.; Liu, C.; Zhuang, T.; Ding, J.; Xian, Y.; Zhao, L.; Wang, W.; Zhou, G.; et al. UAV- and machine learning-based retrieval of wheat SPAD values at the overwintering stage for variety screening. Remote Sens. 2021, 13, 5166. [Google Scholar] [CrossRef]
  50. Huang, Y.; Zhu, H.; Guo, N.; Yin, S.; Peng, X.; Wang, Y. Study on the suitable resolution of winter wheat lodging extraction based on UAV multispectral image. J. Triticeae Crops. 2021, 41, 254–261. [Google Scholar]
  51. Zhang, J.; Wang, C.; Yang, C.; Xie, T.; Jiang, Z.; Hu, T.; Luo, Z.; Zhou, G.; Xie, J. Assessing the Effect of Real Spatial Resolution of In Situ UAV Multispectral Images on Seedling Rapeseed Growth Monitoring. Remote Sens. 2020, 12, 1207. [Google Scholar] [CrossRef]
  52. Xu, Z.; Liu, J.; Yu, K.Y.; Liu, T.; Gong, C.; Tang, M.; Xie, W.; Li, Z. Construction of vegetation shadow index (SVI) and application effects in four remote sensing images. Spectrosc. Spectral Anal. 2013, 33, 3359–3365. [Google Scholar]
  53. Bauriegel, E.; Giebel, A.; Geyer, M.; Schmidt, U.; Herppich, W.B. Early detection of Fusarium infection in wheat using hyper-spectral imaging. Comput. Electron. Agric. 2011, 75, 304–312. [Google Scholar] [CrossRef]
  54. Ma, H.; Jing, Y.; Huang, W.; Shi, Y.; Dong, Y.; Zhang, J.; Liu, L. Integrating early growth information to monitor winter wheat powdery mildew using multi-temporal landsat-8 imagery. Sensors 2018, 18, 3290. [Google Scholar] [CrossRef] [PubMed] [Green Version]
  55. Zhang, D.; Wang, D.; Gu, C.; Jin, N.; Zhao, H.; Chen, G.; Liang, H.; Liang, D. Using Neural Network to Identify the Severity of Wheat Fusarium Head Blight in the Field Environment. Remote Sens. 2019, 11, 2375. [Google Scholar] [CrossRef] [Green Version]
  56. Qiu, R.; Yang, C.; Moghimi, A.; Jian, Y.; Steffenson, B.; Hirsch, C.D. Detection of fusarium head blight in wheat using a deep neural network and color imaging. Remote Sens. 2019, 11, 2658. [Google Scholar] [CrossRef]
Figure 1. Overview of the study area: (a) the location of Nanjing City; (b) the location of the experimental site; (c) multispectral image of experimental site acquired by UAV; (d) sampling range of canopy data.
Agriculture 12 01785 g001
Figure 2. UAV multispectral remote sensing platform: (a) the UAV system (b) the multispectral camera (c) the calibration plate.
Agriculture 12 01785 g002
Figure 3. Spectral reflectance curve: (a) the spectral curves of wheat with different degrees of disease; (b) the ratio of healthy wheat to diseased wheat.
Agriculture 12 01785 g003
Figure 4. Correlation between images with different spatial resolutions and texture features. The abscissa represents the name of each band. The vertical coordinate represents the name of each texture feature. The data in the figure represent the correlation coefficients obtained from the correlation analysis of different bands and different texture features.
Agriculture 12 01785 g004
Figure 5. Correlation between reflectance and DI of each spatial resolution image band.
Agriculture 12 01785 g005
Figure 6. Correlation between different spatial resolution images and vegetation index. The left figure of each subgraph shows the determination coefficient and root mean square error obtained from the correlation analysis of vegetation index and disease index of images with different resolutions. The right image of each subgraph shows the splicing effect of images with different resolutions.
Agriculture 12 01785 g006
Figure 7. Comparison of monitoring accuracy of three algorithms.
Agriculture 12 01785 g007
Figure 8. Distribution map of wheat scab in the study area.
Agriculture 12 01785 g008
Table 1. Image resolution and processing efficiency at each flight altitude.
Flight Altitude/mImage Processing Time/minImage Resolution/ (cm/Pixel)
20 ± 0.132.331.44
30 ± 0.115.352.11
50 ± 0.27.873.47
70 ± 0.27.554.96
90 ± 0.25.586.34
110 ± 0.24.807.67
Table 2. Spectral vegetation indices used in this study.
TitleDefinitionDescription FormulaReference
GLIGreen Leaf Index(2grb)/(2g + r + b)[11]
OSAVIOptimized Soil Adjusted Vegetation Index(nirr)/(nir + r + 0.16)[13]
RDVIRenormalized Difference Vegetation Index ( n i r r ) / n i r + r [25]
ARIAnthocyanin Reflectance Index1/g − 1/r[26]
CIrededgeChlorophyll Index RedEdgenir/re − 1[27]
SIPIStructure Insensitive Pigment Index(nirb)/(nir − r)[28]
GVIGreen Vegetation Index(gre)/(g + re)[29]
Norm RRENormalized Red-REre/(nir + re + g)[29]
NPCINormalized Pigment Chlorophyll Index(reb)/(re + b)[29]
PSRIPlant Senescence Reflectance Index(rb)/nir[30]
MSRModified Simple Ratio r / n i r / r + 1 [31]
NDVINormalized Difference Vegetation Index(nirr)/(nir + r)[32]
NDVIrededgeNormalized Difference Vegetation Index RedEdge(rer)/(re + r)[33]
GARIGreen Atmospherically Resistant Index(nir − (g − (br)))/(nir + (g + (br)))[34]
GDVIGreen Difference Vegetation IndexNirg[34]
RGRRed–Green Ratior/g[34]
CRI2Carotenoid Content Index 21/g − 1/nir[35]
EVIEnhanced Vegetation Index2.5 × (nirr)/(nir + 6r − 7.5b + 1)[36]
CIgreenChlorophyll Index greennir/g − 1[37]
TVITriangular Vegetation Index60(nirg) − 100(rg)[37]
Note: b, g, r, re, and nir correspond to the reflectivity of blue, green, red, red edge, and near-infrared bands, respectively.
Table 3. DI and the coefficient of correlation of spectral parameters.
Spectral ParametersCoefficient of Correlation (R)Spectral ParametersCoefficient of Correlation (R)
R4750.07CIgreen−0.54 **
R560−0.09CRI2−0.19 *
R6680.42 **EVI−0.67 **
R717−0.50 **GARI−0.65 **
R8400.59 **GDVI−0.60 **
ARI0.72 **GLI−0.71 **
OSAVI−0.69 **GVI0.58 **
CIrededge−0.54 **PSRI0.77 **
SIPI0.73 **Norm RRE0.47 **
MSR0.56 **NPCI−0.39 **
NDVI−0.69 **RGR0.76 **
NDVIrededge−0.70 **TVI0.68 **
Note: * and ** indicate reaching the significance level of 0.05 and 0.01, respectively. The same below.
Table 4. Monitoring results of each model algorithm based on vegetation index.
Independent Variable TypeNumber of VariablesModel AlgorithmTraining SetValidation Set
R2RMSERPDR2RMSERPD
VIs5PLSR0.735.141.560.724.321.61
SVR0.794.831.880.774.792.30
BPNN0.755.041.750.795.331.77
TFs9PLSR0.647.561.370.596.321.26
SVR0.696.171.510.636.631.45
BPNN0.697.311.430.655.981.50
VIs and TFs14PLSR0.765.231.640.764.211.67
SVR0.814.271.880.833.352.72
BPNN0.794.391.840.833.532.08
Publisher’s Note: MDPI stays neutral with regard to jurisdictional claims in published maps and institutional affiliations.

