Article

Effects of Mechanical Transplanting Methods and Planting Geometry on Yield Formation and Canopy Structure of Indica Rice under Rice-Crayfish Rotation

1
Xuzhou Institute of Agricultural Sciences in Jiangsu Xuhuai District, Xuzhou 221121, China
2
Research Institute of Rice Industrial Engineering Technology of Yangzhou University, Yangzhou 225009, China
3
Jiangsu Co-Innovation Center for Modern Production Technology of Grain Crops, Yangzhou University, Yangzhou 225009, China
4
Jiangsu Key Laboratory of Crop Genetics and Physiology/Jiangsu Key Laboratory of Crop Cultivation and Physiology, Agricultural College of Yangzhou University, Yangzhou 225009, China
*
Author to whom correspondence should be addressed.
Agriculture 2022, 12(11), 1817; https://doi.org/10.3390/agriculture12111817
Submission received: 20 September 2022 / Revised: 24 October 2022 / Accepted: 26 October 2022 / Published: 31 October 2022
(This article belongs to the Section Crop Production)

Abstract

:
The rice–crayfish continuous production system developed rapidly due to its high economic benefits and eco-friendly nature in China. This study explored the effects of mechanically transplanted methods and planting geometry on the relationship between rice yield and canopy structure, under rice-crayfish rotation using excellent-quality indica rice, and carried out in 2018 and 2019. Three mechanical transplantation methods were set as follows: carpet seedlings mechanically transplanted with 30 cm equal row spacing (CMTE), pot seedlings mechanically transplanted with narrow row spacing with alternating 23 cm/33 cm wide row spacing (PMTWN), and equal row spacing at 28 cm (PMTE). Different plant spacings (CMTE1-CMTE6, PMTWN1-PMTWN6, PMTE3, and PMTE4) were set in accordance with different mechanical transplanting methods. CMTE and PMTWN both included six transplanting densities, while PMTE included 2 transplanting densities. Results showed that rice yield was improved by 2.87–6.59% under PMTWN when compared to CMTE, which was mainly due to the increase in spikelets per panicle and filled-grain percentage. Dry matter accumulation was increased and larger leaf area indexes were observed under PMTWN than CMTE at the rice main growth stage. Yield of CMTE and PMTWN treatments increased at first and then declined with decreased planting density. Under suitable planting density, PMTWN could optimize rice population structure and increase rice yield compared with PMTE. For tested rice variety, pot seedlings were mechanically transplanted alternating alternating 23 cm/33 cm wide row spacing, combined with a plant spacing of 16.8 cm, was proper for its yield improvement under rice-crayfish rotation.

1. Introduction

Rice (Oryza sativa L.) is an important food crop in China, and it plays a key role in ensuring national food security and improving rice farmers’ income [1,2]. In recent years, rice prices have fluctuated greatly and production costs have increased significantly [3]. Due to this, rice-crayfish (Procambarus clarkii) integrated farming has been rapidly expanding in many parts of China due to the large consumption market and high price of crayfish. By the end of 2020, rice-crayfish integrated farming had reached 12.61 million hectares, accounting for more than 4% of the total rice-planting area in China [4]. Rice-crayfish rotation is a typical mode of rice-crayfish integrated farming, which refers to an agricultural production mode of alternately planting rice and cultivating crayfish in rice paddy fields [5]. However, our study found that rice-crayfish rotation still has problems, the soil silting up caused by the long-term soaking of water in paddy field results in a low mechanized rice-planting rate. Meanwhile, the fishing period of crawfish culture de-lays the time of transplanting seedlings. Which is not conducive to high rice yield. Therefore, we hope to solve the above problems by optimizing the mechanical transplantation method and changing the planting density [6,7].
The methods of mechanically transplanting rice include mechanically transplanting carpet seedlings and mechanically transplanting pot seedlings. The mechanical transplanting of carpet seedling was easily carried out and required a lower cost one-time investment. Compared with mechanically transplanted carpet seedlings, it has been widely proved that mechanically transplanted pot seedlings have the better performance of rice yield and quality [8,9,10]. Mechanically transplanting pot seedlings has better rice seedling quality, faster tillering after transplanting, and more obvious population growth advantages. In particular, the higher photosynthetic production capacity and the drier matter accumulation during the middle- and late-growth stages of rice. The composition of rice production is characterized by “sufficient tillers, large panicles, and heavy grains”. However, rice-crayfish rotation brought many new variables, such as siltier soil and higher soil fertility, which is different from some conventional rice cropping models, such as rice-wheat rotation [11]. Therefore, whether the advantages of mechanically transplanting pot seedlings relative to mechanically transplanting carpet seedlings in rice productivity could be repeated under rice-crayfish rotation still remain unclear.
Planting density, whereby the density of transplanted rice is controlled by planting geometry and the number of seedlings per hole [12,13], is an important cultivation measure to regulate crop growth and development. Mechanically transplanted rice carpet seedlings usually adopt 30 cm equal row spacing, while mechanically transplanted pot seedlings have both equal row spacing and wide-narrow row spacing. Previous studies on the effect of density on rice productivity were mostly concerned with the single factor of fixed row spacing and changing plant spacing, or fixed plant spacing and changing row spacing; there were few researches on wide-narrow row spacing and equal row spacing. However, wide-narrow row spacing is still controversial in existing studies, in terms of whether or not wide-narrow row spacing could prolong the photosynthetic time [14], and exploit this marginal advantage of the rice to promote yield increase [15]. At present, there is a knowledge gap regarding the interaction effects of canopy structure and yield at different heights of rice population with wide-narrow row spacing and equal row spacing.
The objective of this study was to: (i) examine the relationship between yield, photosynthetic matter production and canopy structure of indica rice in crayfish fields under different mechanical transplantation methods and planting geometry configurations; (ii) clarify the most optimal transplanting specifications for a high yield of Fengyouxiangzhan under rice-crayfish rotation. The results could provide a theoretical basis for high-yield cultivation theory and practice in terms of indica rice under a mechanical transplanting pattern.

2. Materials and Methods

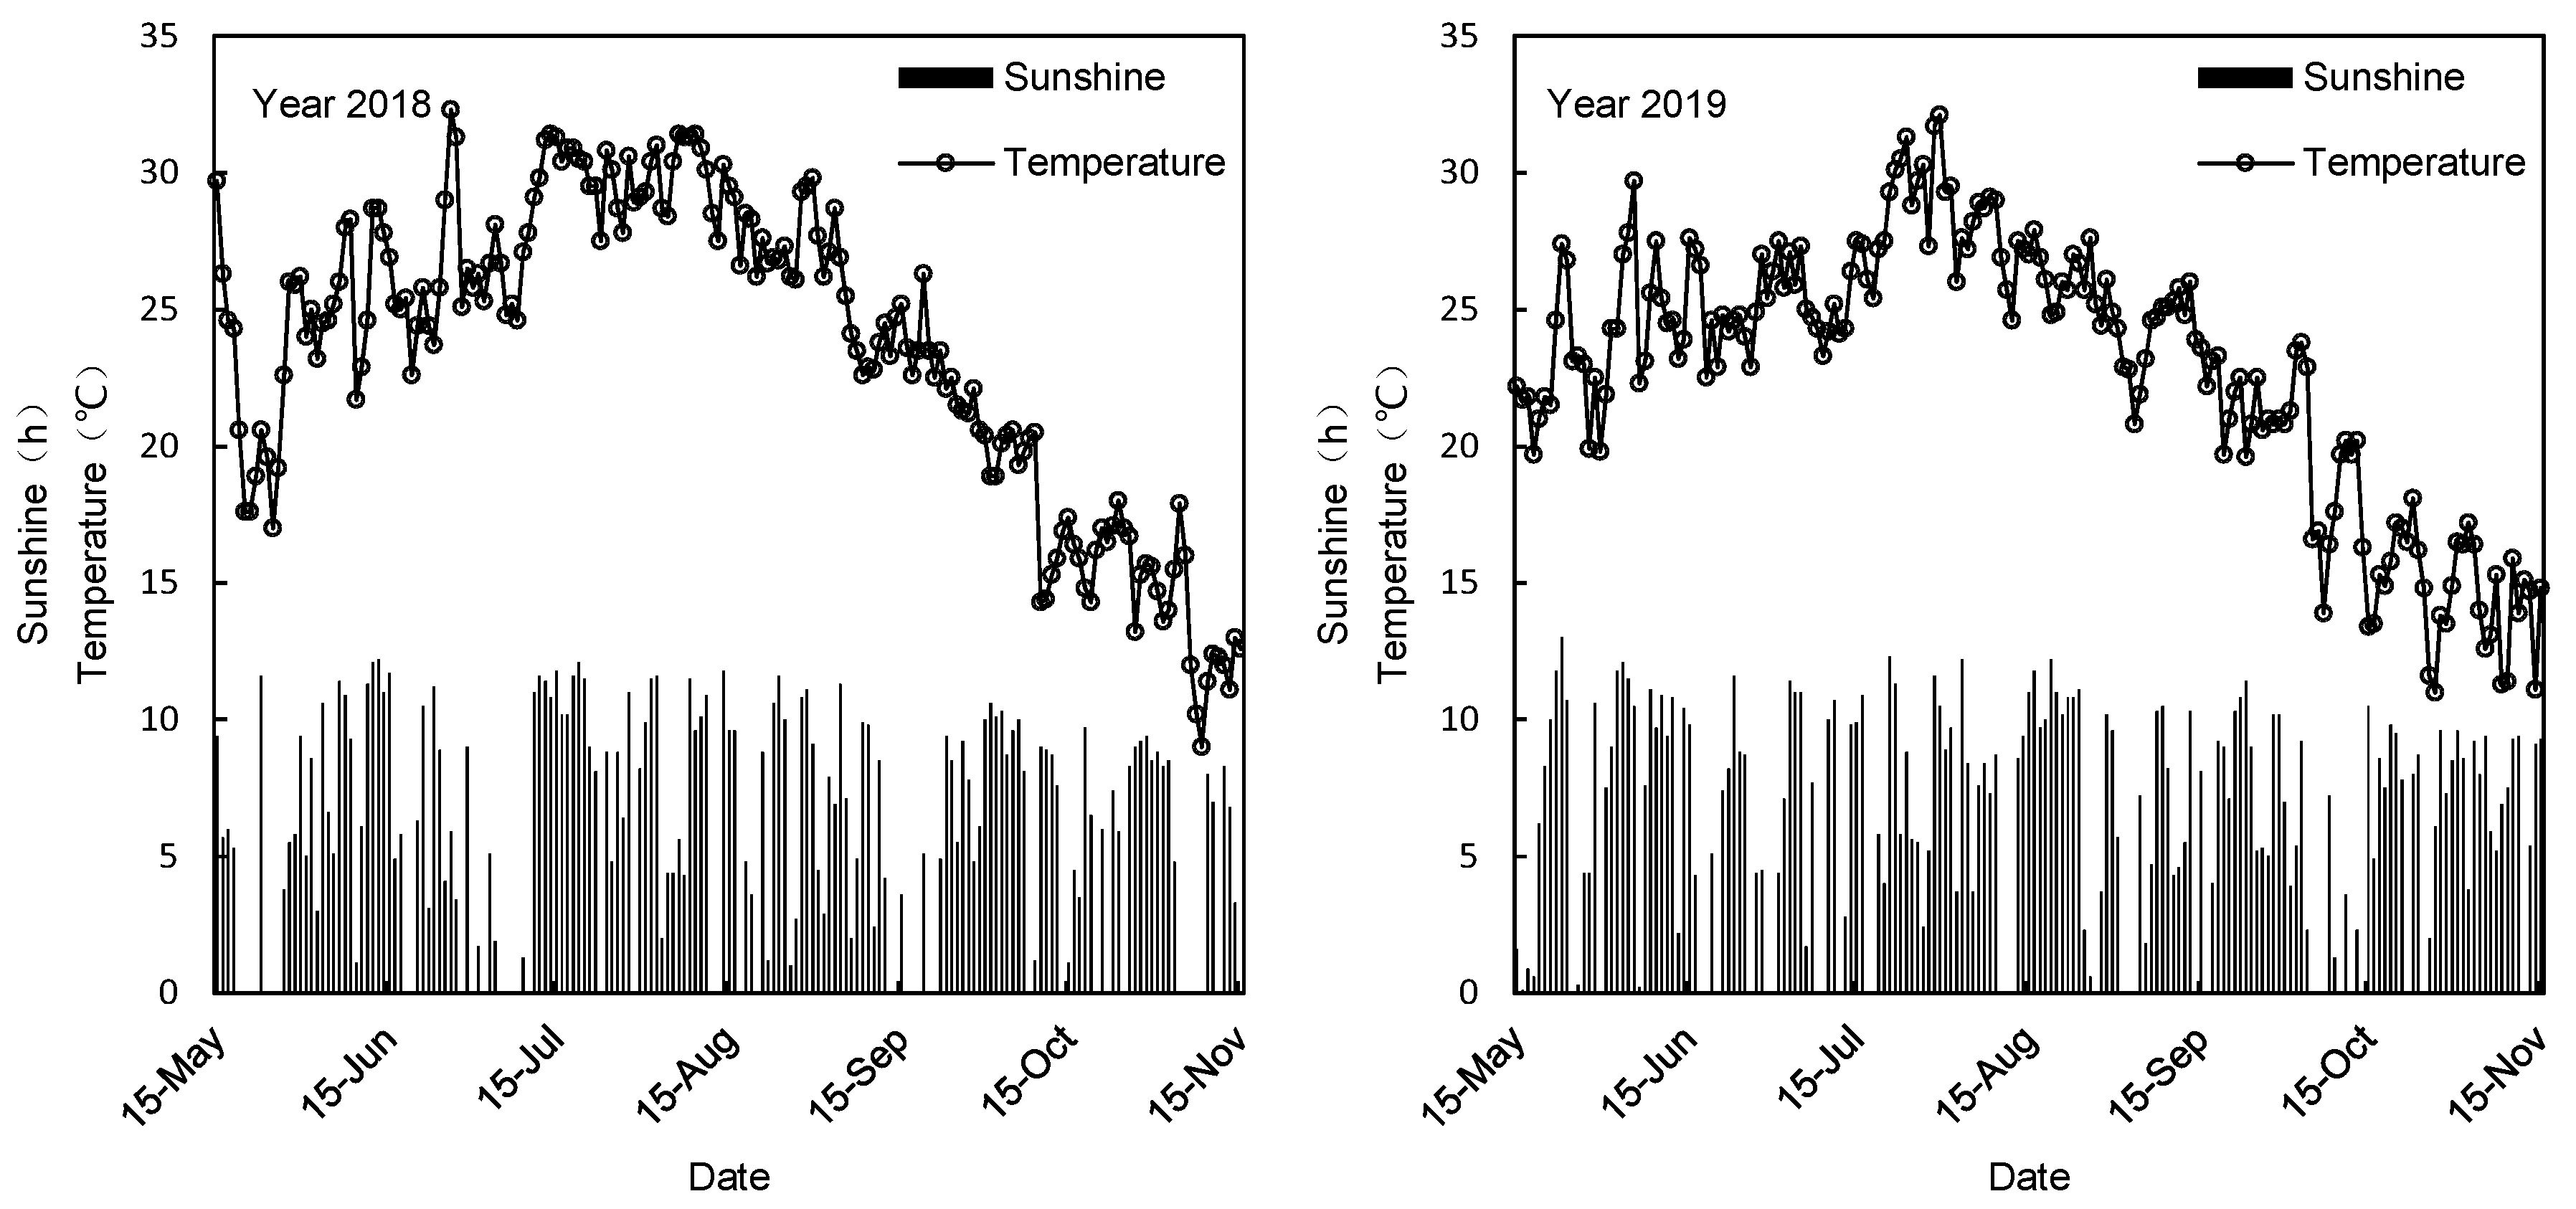
2.1. Experiment Site

In 2018 and 2019, the field experiment was undertaken in Xuyi County, Jiangsu Province, China, which was located in the Huai River Basin (32°59′32″ N, 118°40′43″ E; 51 m), and famous for its crayfish industry. The average daily temperature and sunshine hours of the rice-growing seasons of 2018 and 2019 are shown in Figure 1. The soil parameters at the 0–20 cm layer were as follows: 35.6 g·kg−1 organic matter content, 132.2 mg·kg−1 soil available N, 17.6 mg·kg−1 Olsen-P and 165.6 mg·kg−1 available K. Crayfish were cultivated from mid-November to mid-June of the following year, and rice was planted from mid-June to early-November, forming rice-crayfish rotation.

2.2. Experiment Design

Fengyouxiangzhan, a popular indica three-line hybrid rice with an excellent appearance and eating quality, was used in this experiment.
The experiment was designed in a split plot design, with the mechanical transplanting method as the main plot and the planting densities as split plots. There were three replications for this experiment, and the size of each subplot was 20 m2. The three mechanical transplanting methods were: carpet seedlings mechanically transplanted with equal spacing (30 cm, CMTE); pot seedlings mechanically transplanted with wide-narrow row spacing (narrow row spacing 23 cm/wide row spacing 33 cm alternation, PMTWN); and pot seedlings mechanically transplanted with equal spacing (28 cm, PMTE). Six plant distances of 11.5 cm, 12.8 cm, 14.4 cm, 15.7 cm, 16.7 cm and 19.3 cm were designed for the carpet seedlings, and were recorded as CMTE1, CMTE2, CMTE3, CMTE4, CMTE5 and CMTE6, respectively, while six plant distances of 12.4 cm, 13.8 cm, 15.5 cm, 16.8 cm, 17.9 cm and 20.7 cm were designed for the pot seedlings with wide-narrow row, which were recorded as PMTWN1, PMTWN2, PMTWN3, PMTWN4, PMTWN5 and PMTWN6, respectively, ensuring the consistency of seedlings at the same planting density under different mechanical transplanting methods (CMTE and PMTWN). The preliminary experiment showed that the yield of medium-density treatment pot seedlings with equal spacing was better. Therefore, the spacing of the pot seedlings with equal spacing was designed to be 15.5 cm and 16.8 cm. In order to facilitate the comparison with the pot seedlings with wide-narrow rows and the carpet seedlings under the same planting density, these seedlings were recorded as PMTE3 and PMTE4. In theory, the plant spacing of carpet seedlings can be infinitely graded by the mechanical transplanter, whereas the spacing of the pot seedling mechanical transplanter was set according to the specific spacing that could be regulated by the pot seedling transplanter. Under the premise of determining the density of each PMTWN, the corresponding plant spacing of CMTE was calculated. The specific information of planting geometry for all treatments is displayed in Table 1.
For CMTE, 90 g seeds were sown in each tray manually on June 7 in both years, simulating the seeding rate in production. For PMTWN and PMTE, seeds were raised in 448-hole plastic trays (dry seedling raising) on May 28 in both years, using a 2BD-600 (LSPE-60AM) pot seedling seeder, and we achieved 3–5 seeds landed in each hole by regulating seeding density, thereby guaranteeing 2–3 seedlings per hole. Seedlings for both mechanical transplanting methods were transplanted on June 28. The carpet seedlings were cut off by seedling claws to simulate mechanical injury. Rice planted by carpet seedlings and pot seedlings were harvested on November 3 and October 29, respectively.
Nitrogen application rate set was 180 kg·ha−1, which was approximately 25% lower relative to local rice-wheat rotation in consideration of the high soil fertility after two years of rice-crayfish rotation. It was applied at a ratio of 4:3:3 as base, tillering and panicle initiation, respectively. The prevention and control of diseases, insect pests and weeds was in accordance with the local green prevention control scheme for rice under rice-crayfish rotation. Biological pesticides (including Empedobacter brevis, Validamycin and Bacillus subtilis. Empedobacter brevis was used to control rice leaf roller, Validamycin was used to control rice sheath blight, Bacillus subtilis was used to control rice blast) were mainly used to control rice diseases and insect pests; chemical pesticides with high efficiency and low toxicity were also applied, solar-powered insect-killing lamps were installed at the edge of the field, and sex attractants were arranged to control borers and other pests. Weeds were removed manually.

2.3. Yield and Its Components

At maturity stage, rice plants of 60 holes were sampled for actual yield determination, a LDS-1G grain moisture meter was used to measure the grain moisture content, and actual yield was determined according to 14.5% moisture content. The rice panicles of three holes were harvested and put into net bags to measure spikelets per panicle, filled-grain percentage, and 1000-grain weight.

2.4. Apparent Lodging Rate

The lodging area of each plot was investigated at maturity stage. If the angle between the plant and the ground was less than 45°, it was deemed as lodging, and the lodging area as a percentage of the total area of the plot was the apparent lodging rate (ALR, %).

2.5. Rice Tiller Dynamic

A series of 20 consecutive plants were marked in each plot to count the number of tillers every 7 days since transplanting, and ended at 56 days after transplanting.

2.6. Leaf Area Index and Dry Matter Accumulation

To assess the average number of stems and tillers per plot at jointing, heading, and maturity stages, plants from five representative hills in each plot were sampled. The length-width coefficient method was used to determine the leaf area at the jointing and heading stages. After that, each sample was divided into three parts, including the green leaves, stems plus sheaths, and panicles. These were oven-dried separately at 105 °C for 30 min and then at 80 °C until they reached a constant weight. The dry matter accumulation of each part of the ground was also measured.

2.7. Canopy Structure

A LAI-2200C plant canopy analyzer (LI-COR, Lincoln, Nebarska, NA, USA) was used to measure leaf area index (LAI), diffuse non-interceptance (DIFN) and mean tilt angle (MTA) at rice jointing and heading stages. The three parameters were measured 20 cm above the ground at jointing stage, and were measured from 20 cm (bottom layer), 50 cm (middle layer) and 80 cm (upper layer) above the ground, respectively, at heading stage.
Canopy analysis: This determination should be performed in cloudy days. A value was collected using LAI-2200C plant canopy analyzer above the rice canopy. Likewise, B values were continuously collected from the row spacing between the two rows of rice into near plant, near plant 1/4, near plant 1/2 and near plant 3/4 in the population. Then, the population leaf area index was automatically measured by A value and B values in this instrument. While measuring LAI, the instrument itself measured the canopy condition from five annular areas with different zenith angles, and calculated DIFN and MTA of the canopy. We repeated the measurement three times in each cell among pot seedlings mechanically transplanted with wide-narrow row spacing, to measure the wide and narrow rows, respectively, and the mean value was taken into statistical analysis.

2.8. Decreasing Rate of Leaf Area at Grain-Filling Stage, Photosynthesis Potential, Crop Growth Rate and Net Assimilation Rate

The following equations were used for calculations:
Decreasing rate of leaf area at grain-filling stage (LAI d−1) = |LAI2 − LAI1|/(t2 − t1).
Photosynthesis potential (m2 m−2 d) = 1/2 × (L1 + L2) × (t2 − t1)
Crop growth rate (g m−2 d−1) = (W2 − W1)/(t2 − t1)
Net assimilation rate (g m−2 d−1) = [(LN(L2) − LN(L1)]/(L2 − L1) × (W2 − W1)/(t2 − t1)
LAI2 and LAI1, L1 and L2, W1 and W2, t1 and t2 are the first and second measurements of leaf area indices (m2 m−2), leaf area (m2 m−2), dry matter accumulation (kg ha−1), and time (d), respectively; LN is natural logarithm.

2.9. Statistical Analysis

Tables and graphs were conducted using Microsoft Excel 2013, and the analysis of the relevant data was performed using SPSS 20.0. Differences were considered significant at p < 0.05 using least significant difference.

3. Results

3.1. Rice Yield and Its Components

The mechanical transplanting methods presented significant effects on rice yield and its components (Table 2). Compared with CMTE, the theoretical yield of Fengyouxiangzhan increased by 2.87–6.59%, and the actual yield increased by 1.57–5.80% under PMTWN. In terms of yield components of rice, the panicles of rice decreased by 0.90–5.10%, spikelets per panicle increased by 3.67–6.91%, and the filled-grain percentage increased by 2.33–3.77% under PMTWN compared to CMTE. However, there was no significant difference to 1000-grain weight of rice between CMTE and PMTWN. In addition, rice yield increased first and then decreased under CMTE and PMTWN treatments with the decrease in planting density, and reached the maximum yield in CMTE4 and PMTWN4 treatments. Compared with CMTE4, average theoretical yield of and actual yield were increased by PMTWN4 by 6.29% and 5.17% across two years. The panicles decreased with the decreasing density, but spikelets per panicle and filled-grain percentage increased, and the 1000-grain weight had no obvious differences. Compared with PMTE treatment, the theoretical yield of rice under PMTWN treatment increased by 2.26% and the actual yield increased by 1.31% on average. Among them, the average annual yield of PMTWN4 was 2.81% higher than that of PMTE4 treatment, while the difference was not significant.
Meanwhile, the lodging phenomenon was surveyed across two years. Rice under CMTE treatment underwent serious lodging at high planting density (CMTE1 and CMTE2), and lodging was also observed at medium density (CMTE3 and CMTE4), which was adverse to rice yield. Compared with CMTE, the lodging phenomenon of rice was significantly reduced under PMTWN, the lodging rate of PMTWN3 treatment was 69.2% lower than that under CMTE3 treatment, and rice did not undergo lodging under PMTWN4.

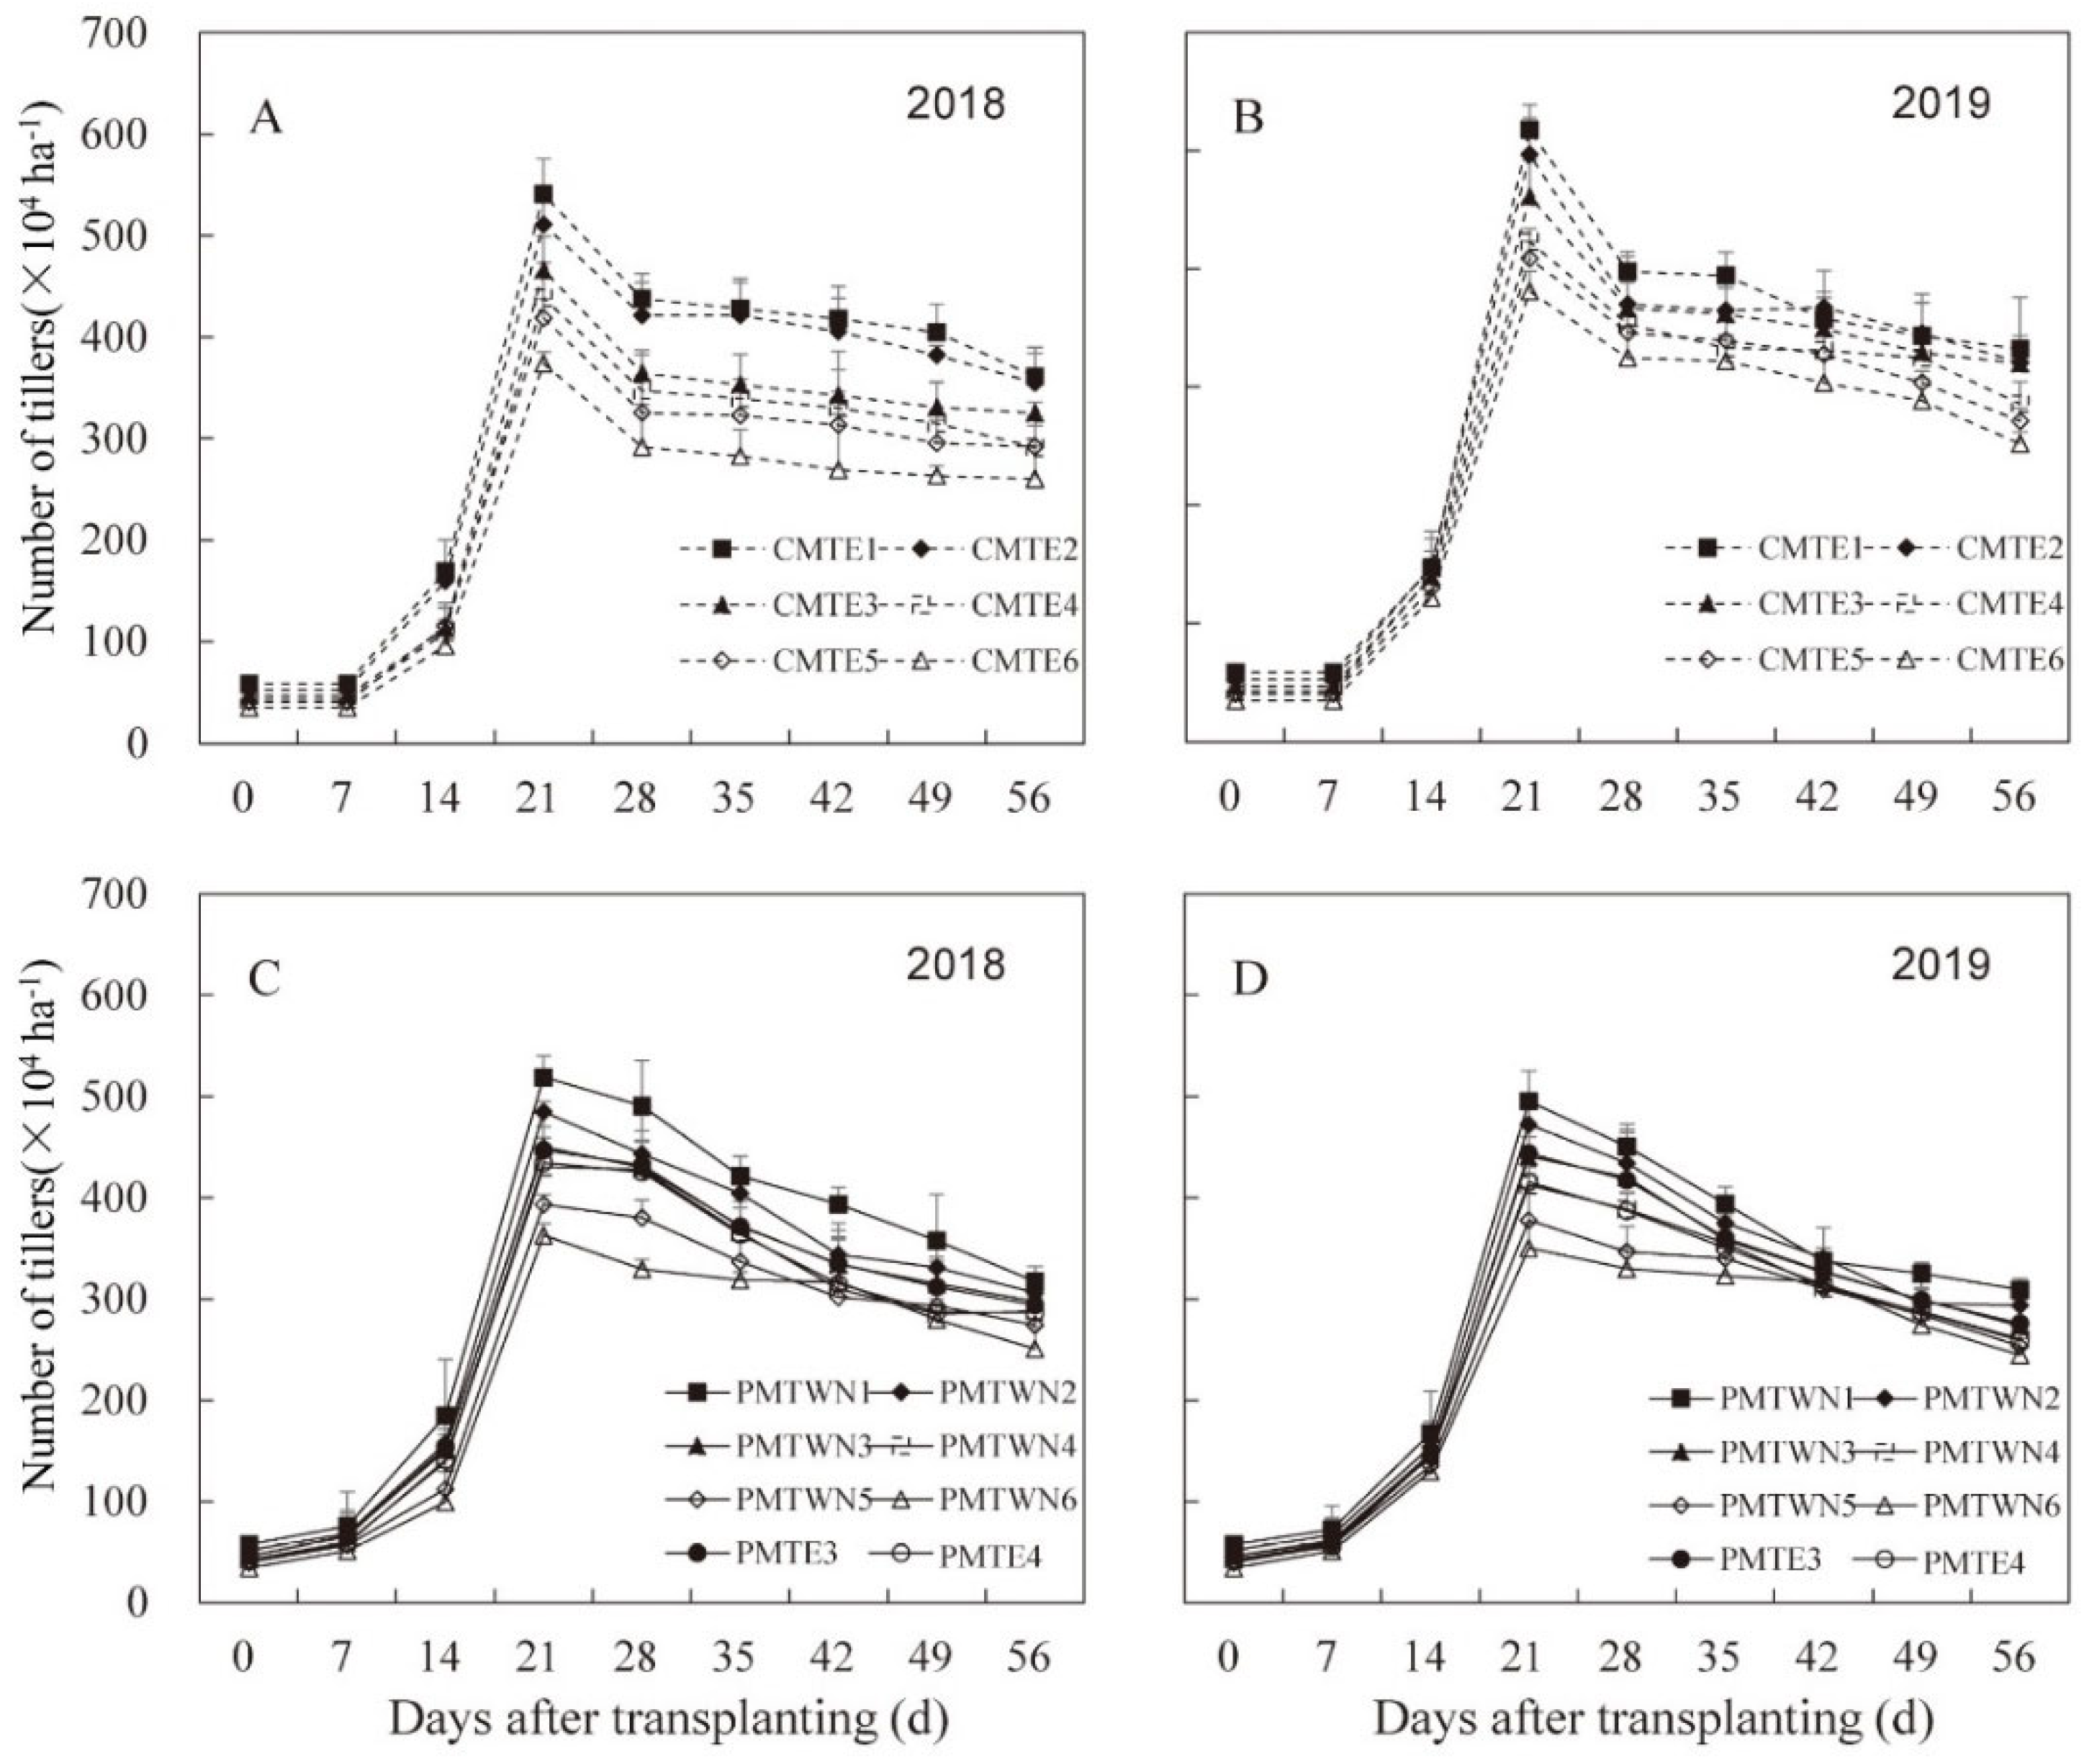
3.2. Rice Tiller Dynamic

Rice tiller dynamics reached a peak seedling period at 21 days after transplanting, and then decreased gradually under all treatments (Figure 2). For all CMTE treatments, there was no obvious increase in tillers at 7 days after transplanting, and the number of tillers increased rapidly after 14 days. The tiller dynamic curve shows the tendency of “flat first, then rapid rise, and rapid drop”. For PMTWN and PMTE treatments, there was no obvious recovery period after transplanting. Compared with CMTE treatment, the number of peak seedlings of PMTWN and PMTE treatments was lower under the same planting density, and the number of tillers after the peak seedling stage of PMTWN and PMTE treatments showed a uniform downward trend, which was quite different from CMTE treatment. In addition, the number of tillers decreased with the decline of planting density under the same transplanting mode at any growth period. Under the same planting density, there were no significant differences in tiller numbers between PMTWN and PMTE.

3.3. Leaf Area Index and Decreasing Rate of Leaf Area

The LAI of PMTWN treatment was higher than that of CMTE treatment at jointing, heading and maturity stages; the LAI of rice under PMTWN treatment increased by 2.18–9.56%, 3.14–5.20% and 10.4–13.3% at jointing, heading and maturity stages, respectively. Meanwhile, the high-efficiency leaf and high-efficiency leaf ratio at heading stage were higher than that under CMTE treatment (Table 3). The high-efficiency leaf and high-efficiency leaf ratio at heading stage increased by 6.94–9.86% and 2.51–3.61%, respectively. The decreasing rate of leaf area from heading to maturity stage under PMTWN treatment was lower than that under CMTE treatment, with the decreasing extent decreased by 1.91–4.17%, but there was no significant difference under the same planting density between different mechanical transplanting methods. With the decline of density, the LAI of rice under CMTE and PMTWN treatments always tended to keep decreasing at jointing stage, while presented the tendency to “increase first and then decrease” at heading and maturity stages. The proportion of efficient leaves in CMTE4 and PMTWN4 treatments was the highest at heading stage. The decreasing rate of leaf area at grain-filling stage decreased with the decrease in density. When compared with CMTE6 treatment, the two-year average decreasing rate of leaf area at grain-filling stage in CMTE1, CMTE2, CMTE3, CMTE4 and CMTE5 treatment increased by 6.72%, 6.03%, 2.57%, 2.57% and 1.06%, respectively. PMTWN treatment slightly increased the LAI of rice at each stage when compared with PMTE, and the decreasing rate of leaf area during grain-filling stage between them was high and low among different planting densities, meaning that there was no significant difference.

3.4. Photosynthetic Potential

The PMTWN treatment significantly improved the photosynthetic potential of rice at all key growth stages, compared with the CMTE treatment (Table 4), while the highest increase range appeared from sowing to jointing, followed by heading-maturity period. The lowest increase range occurred in the jointing to heading stage, with the increase ranges of 17.6–26.4%, 5.32–7.68% and 2.79–5.35%, respectively. As planting density decreased, the photosynthetic potential of rice during sowing-jointing and jointing-heading periods generally showed a downward trend (the photosynthetic potential of PMTWN treatment increased first and then decreased in 2019), and the photosynthetic potential during heading-maturity period showed an upward and then decreasing trend, and reached the peak value in CMTE4 and PMTWN4 treatments (Table 4). Compared with PMTE treatment, the photosynthetic potential of PMTWN treatment decreased during sowing-jointing period under the same planting density, and increased during jointing-heading and heading-maturity periods, so there was no significant difference between PMTE and PMTWN under the same planting density.

3.5. Dry Weight per Stem

As shown in Table 5, the rule of dry weight per stem was basically consistent in two years. At the same density, the dry weight per stem in PMTWN treatment was significantly higher than that in CMTE treatment at jointing, heading and maturity stages, and the increase amplitudes were 7.31–12.3%, 7.01–18.5% and 13.5–15.1%, respectively. With the decline of planting density, the dry weight per stem of CMTE and PMTWN treatments increased at three key growth stages. There was little difference in dry weight per stem between adjacent planting densities at all three key growth stages, but significant difference was detected between high planting density and low planting density under each mechanical planting method. For CMTE, rice dry weight per stem under CMTE6 treatment was significantly increased by 20.9%, 24.5% and 12.8% at jointing, heading and maturity stages, respectively, compared with CMTE1. Compared with PMTE treatment, rice dry weight per stem slightly increased under PMTWN treatment in each period.

3.6. Dry Matter Accumulation and Harvest Index of Rice

There was no difference in population dry matter accumulation between the two mechanical transplanting methods at jointing stage under the same planting density, but significant difference was found at heading and maturity stages between different mechanical transplanting methods, and the differences were detected to increase with the progress of rice growth (Table 6). Compared with CMTE, rice dry matter accumulation under PMTWN treatment at the same planting density increased by 4.38–5.94% and 3.81–4.93% at heading and maturity stages, respectively. No significant difference of harvest index was observed between different mechanical transplanting methods. As planting density declined, the population dry matter accumulation of CMTE and PMTWN treatments decreased at jointing stage, increased first and then decreased at heading and maturity stages, and the largest value occurred at CMTE4 and PMTWN4 at heading and maturity stages for the two mechanical transplanting methods. Among all the treatments, rice grown under PMTWN4 treatment exhibited the highest dry matter accumulation at maturity stage, with an average value of 22.1 t ha−1 between two years, which was a significant increase of 5.00% compared with CMTE4 treatment at the same planting density. PMTWN4 treatment increased by 1.38% compared with PMTE4 treatment with the same planting density, so there was no significant difference. The population dry matter accumulation of PMTWN treatment increased in each period when compared with CMTE treatment, but there was no significant difference of harvest index between different mechanical transplanting methods.

3.7. The Crop Growth Rate and Net Assimilation Rate

As shown in Table 7, mechanical transplanting method and planting geometry both had significant influence on rice crop growth rate at different growth stages. Compared with CMTE, rice crop growth rate under PMTWN treatment decreased by 10.4–12.7% during sowing-jointing period, and increased by 3.60–8.08% and 1.81–5.04% during jointing-heading and heading-maturity periods, respectively. Crop growth rate was observed to be highest during jointing-heading period, followed by heading-maturity period, and the lowest crop growth rate occurred during sowing-jointing period. Under the same mechanical transplanting method, with the decrease in density, the crop growth rate showed a downward trend during sowing-jointing period, and it first increased and then decreased during both jointing-heading and heading-maturity periods. The net assimilation rate of rice under CMTE treatment was significantly higher than that of PMTWN treatment during sowing-jointing period at the same density, with an average increase of 13.6–16.4%. There was no significant difference in net assimilation rate between the two mechanical transplanting methods during both jointing-heading and heading-maturity periods. Under the same mechanical transplanting method, rice net assimilation rate decreased during sowing-jointing period, increased during jointing-heading period, and showed no obvious variation during heading-maturity period, when planting density declined. Compared with PMTE treatment, rice crop growth rate and net assimilation rate during different growth periods were generally improved by PMTWN treatment, while the difference was mostly not significant.

3.8. Canopy Structure

Compared with CMTE treatment, LAI at heading stage 20 cm, 50 cm and 80 cm above the ground were increased under MTPS by 4.76–8.71%, 12.2–22.3% and 13.0–22.3%, respectively (Table 8). With the decrease in planting density, the LAI values measured at different heights at heading stage of the two mechanical transplanting methods showed a similar trend, which first increased and then decreased. Mechanical transplanting method and planting geometry presented different effects on DIFN and MTA of rice as growth stage and canopy of height varied. Under the same planting density, there was no significant difference in DIFN between CMTE and PMTWN treatments at jointing stage. The DIFN of PMTWN was lower than that of CMTE at different heights at heading stage. The DIFN at 20 cm, 50 cm and 80 cm above the ground decreased by 23.8–32.3%, 8.28–18.6% and 22.1–39.5%, respectively. With the decrease in planting density, the DIFN of CMTE and PMTWN treatments increased at jointing stage, and decreased first and then increased at heading stage. The MTA at different growth stages and heights of rice under PMTWN treatment was always higher than that under CMTE treatment, and the average increase amplitude of MTA was 0.72°, 1.10°, 1.97° and 3.05° across all planting densities at jointing stage and 20 cm, 50 cm and 80 cm above the ground at heading stage, respectively. Under the same mechanical transplanting method, with the decline of planting density, the MTA height showed a downward trend at each growth period, the difference between adjacent densities was not significant, and the difference between high planting density and low planting density was significant. Compared to PMTE, there was no obvious rule when comparing LAI, DIFN and MTA values at 20 cm above the ground at jointing stage under PMTWN. LAI and MTA values at heading stage of PMTWN treatment were higher than those of PMTE treatment with the same plant spacing, and DIFN values were lower than those of PMTE treatment with the same plant spacing.

3.9. Relationship between Rice Yield and Canopy Structure

The LAI, DIFN and MTA at different heights of rice population were significantly correlated with yield and its component (Figure 3). LAI of the whole plant and upper layer (80 cm) of rice population was significantly or extremely significantly positively correlated with rice yield; DIFN in each layer of rice population was significantly negatively correlated with yield; there is a significant negative correlation between the upper MTA and the theoretical yield of mechanically transplanted carpet seedlings. The analysis of canopy structure parameters and yield components showed that LAI of each layer was positively correlated with spikelets per panicle and filled-grain percentage, and reached significant or extremely significant levels under mechanically transplanted pot seedlings. The whole plant DIFN was significantly negatively correlated with spikelets per panicle and filled-grain percentage. MTA in each layer of rice population was extremely significantly positively correlated with panicles, and was extremely significantly negatively correlated with spikelets per panicle.

4. Discussion

4.1. Effects of Mechanical Transplanting Method on Grain Yield, Photosynthetic Matter Production and Canopy Structure

Under conventional rice-wheat rotation, it has already been certified that mechanically transplanted pot seedlings have obvious advantages in increasing yield over mechanically transplanted carpet seedlings [8,16]. In this study, compared with CMTE, panicles of Fengyouxiangzhan decreased by 0.90–5.10% annually under PMTWN, and spikelets per panicle and filled-grain percentage increased by 3.67–6.91% and 2.33–3.77%, respectively. The increase in spikelets per panicle was significantly higher than that of filled-grain percentage, and there was no significant difference in 1000-grain weight between the two mechanical transplanting methods. Results indicated that the rice yield was markedly improved in terms of the spikelets per panicle under PMTWN and PMTE relative to CMTE, this was attributed to that the synergistic increase in spikelets per panicle and filled-grain percentage exceeding the negative impact of the decrease in panicles. Therefore, rice yield under PMTWN was increased by 2.87–6.59% more than that under CMTE.
The tiller dynamic, leaf area index, and dry matter accumulation of single-stem and population can effectively reflect the population quality at rice key growth stages of [17]. Generally, the formation of a high yield population of transplanted rice is due to the following characteristics: high seedling quality; rapid recovery from transplanting injury and tiller emergence after transplanting; suitable peak seedling quantity; high mid-term leaf area index and photosynthetic material accumulation; and high-quality population with high photosynthetic efficiency at heading stage. During the later rice growth stage, strong root activity, sluggish decreasing rate of leaf area during grain-filling stage, large photosynthetic potential, high crop growth rate and net assimilation rate are associated with high yield [18,19,20]. The results of our study showed that the time for each treatment of the two mechanical transplanting methods to reach the peak seedling was approximately 21 d after transplanting, which was more than 7 d earlier than that of the conventional rice-wheat rotation field. We speculated that it was related to the high basic soil fertility under rice-crayfish rotation, which was due to long-term fodder application, and waterweed returning to field. Therefore, we selected to control tillers by early sunning. The tillers of rice under CMTE developed rapidly after a week of seedling recovery, and tillers were higher than that of rice under PMTWN and PMTE with the same planting density at the same time, and their peak value was also higher under the same planting density than PMTWN and PMTE. This was because rice seedlings under CMTE had a longer seedling recovery period and thereby missed some tillers at lower position, while the tillers increased rapidly within more ineffective tillers under CMTE, and the ineffective tillers died faster after sunning. Therefore, the rice tiller dynamic of under CMTE presented a phenomenon of “sharp rise and rapid decline”. Different from CMTE, rice of PMTWN and PMTE had non-time of seedling recovery period, and could produce more tillers at low positions, which would develop into panicles with more spikelets. Thus, the number of peak seedlings under PMTWN and PMTE was lower than that of CMTE, and the tiller number decreased steadily after sunning. The overall dynamic of tillers shows a trend of “slow rise and fall” [21]. Rice yield was derived from the accumulation of photosynthetic substances, and was positively correlated with the dry matter accumulation during grain-filling period. To achieve high yield, rice requires not only sufficient material accumulation foundation before grain-filling, but also a reasonable canopy and population structure at heading stage [22]. In this research, compared with CMTE, rice under PMTWN and PMTE had higher LAI and photosynthetic potential at jointing stage, heading stage and mature stage, and higher high-efficiency leaf ratio at heading stage, forming higher-quality rice population. Evidently, PMTWN and PMTE were beneficial for rice population to have an advantage during middle- and late-period over MTCS, which may be correlated with stronger seedlings and higher temperature- and light-utilization rate [8]. In addition, the canopy structure data at heading stage showed that rice under PMTWN and PMTE had low DIFN, which reflected more light energy utilization, and that the larger MTA was found in PMTWN and PMTE indicated that the rice plant had a more upright posture to accept light, which would promote leaf photosynthesis and enhance grain weight and filled-grain percentage.

4.2. Effects of Planting Geometry on Grain Yield, Photosynthetic Matter Production and Canopy Structure

Planting density play an important role in regulating rice yield and its components. Rice yield responded differently to planting density, which interacted with other cultivation factors. Rice yields were 25 and 6.8% higher when Italian ryegrass was used as the cover crop under sparse planting conditions than under dense planting conditions in 2019 and 2020, respectively [23]. The grain yield of Ouu316 and Hitomebore tended to be higher in the practice of nitrogen-free basal dressing with sparse planting density than in the conventional cultivation [24]. However, some previous studies reported a rice yield breakthrough by increasing density and reducing nitrogen [25,26,27]. Recent studies generally showed that the yield of different types of rice increased first and then decreased with the decrease in density [28,29], and dense planting and thin planting will cause different degrees of yield reduction. In terms of the response of yield components to density, many scholars believe that panicles of rice decrease significantly with decreased planting density, and the spikelets per panicle increased significantly [10,30,31,32], and the 1000-grain weight was less affected. However, there were different conclusions about the effect of planting density on filled-grain percentage. The results of this study showed that under the rice-crayfish rotation, with the decrease in density, the rice yield of the two mechanically transplanting methods increased first and then decreased, and reached the peak yield in treatment 4 (basic seedling: 42.6 × 10⁴ ha−1). In terms of yield components, the changes of panicles, spikelets per panicle and 1000-grain weight were basically consistent with previous studies, and the filled-grain percentage increased with the decrease in density. It can be seen that although dense planting can increase panicles, it is difficult to offset the double effects of spikelets per panicle and filled-grain percentage decline, and the final yield is lower than the suitable density; under thin planting, the spikelets per panicle was sufficient, the filled-grain percentage increased, and the individual development and grain filling were more sufficient. However, the panicles were seriously insufficient, the waste of temperature and light resources was serious, and the yield was difficult to improve. Therefore, excessive dense or thin planting would all induce yield reduction, only suitable planting density could coordinate population structure and achieve rice yield potential.
Previous studies were concerned with the effects of planting density on rice population dynamics. Generally, the individual growth potential of mechanically transplanted rice pot seedlings would be fully realized with the decline of planting density [10], but the number of tillers, leaf area index and dry matter accumulation of population decreased, which was adverse to the formation of sufficient population. In this study, rice tiller number at different days after transplanting showed a downward trend as planting density declined. Single-stem rice dry matter accumulation at main growth stages showed an upward trend with the decrease in planting density. The leaf area index and dry matter accumulation of rice at jointing stage decreased with the decline of planting density, while the leaf area index, photosynthetic potential and dry matter accumulation of rice during heading and maturity stages showed a similar variation tendency with the yield, which increased first and then decreased with the decreased planting density. The above results suggested that unconscionable dense planting results in excessive rice population, intensified growth and development contradictions among individual plants, and increased lodging risk due to a weak stem, which was not conducive to a high and stable yield of rice. Although excessive thin planting had a high tiller number per hill, large single-stem dry matter accumulation, fully developed panicles, sufficient grain number, and high stem plumpness, it is difficult to supplement the insufficient panicle number and the decrease in population dry matter accumulation, caused by insufficient basic seedlings, so the yield is reduced. The data of canopy structure showed that under the condition of high density, the number of population tillers was sufficient. However, the quality of single hole tillers decreased seriously, the single plant of rice was dysplasia, and the leaves were petty and erect, so the LAI of each layer decreased, and the MTA and DIFN increased. In the low-density population, the number of tillers was insufficient, the waste of space resources was serious, and the leaves were scattered, so the LAI and MTA of each layer were low, and the DIFN increased. In general, removing the weak individual plants of over-dense planting and over-thin planting of the rice population will lead to the decrease in canopy LAI and the increase in DIFN, resulting in the decrease in light energy-utilization rate and insufficient photosynthetic production capacity, so the final yield is low. Therefore, the suitable density was often more conducive to the formation of reasonable tiller dynamic, higher leaf area index and dry matter accumulation, which lays the material foundation for the construction of a high yield and a high-quality population of rice. Under rice-wheat rotation, the rice grown under suitable planting density group had low DIFN at heading stage and high photosynthetic potential from heading to maturity stage, meaning it efficiently absorbed and utilized light energy, thus promoting yield improvement.
The pot seedlings mechanically transplanted with wide-narrow row spacing rice refers to the cultivation method of fixing the seedling spacing during the operation of the pot seedlings machine and implementing the change of one wide-narrow row spacing. There was a great controversy over whether wide-narrow row allocation could improve rice yield. Some studies reported that the suitable wide-narrow row allocation can make full use of crop-marginal superiority, optimize population ventilation and light transmittance conditions, form excellent canopy structure at heading stage, increase light absorption rate of lower leaves, enhance photosynthetic efficiency of unit leaf area, improve dry matter accumulation and harvest index in during rice middle and late growth stages, and increase rice yield on the basis of increasing spikelets per panicle and filled-grain percentage [10,33]. Another study found that the advantage of wide row side was not as prominent as predicted, and did not present obvious advantages over equal-row geometry. In this study, compared with pot seedlings mechanically transplanted with equal row spacing under rice-crayfish rotation, the wide-narrow row spacing can slightly increase rice yield by enlarging panicle size [15,34]. The correlation analysis showed that LAI of each layer of the population was significantly positively correlated with spikelets per panicle under CMTE, and DIFN of the whole plant of the population was significantly negatively correlated with spikelets per panicle. The above analysis certified that high LAI and low DIFN were conducive to improving rice yield, and MTA had relatively smaller effect on yield. Rice grown under wide-narrow row spacing tended to have larger LAI and lower DIFN at heading stage, so as to construct high photosynthetic efficiency population, which would promote the dry matter accumulation of rice population during middle and late growth stages, and thereby obtained a higher rice yield than the equal row spacing. In addition, whether the yield improvement with PMTWN could reappear in other rice varieties and the effect on size is a valuable scientific issue. We speculated that rice varieties with loose plant type and high plant height may have relatively more advantages than equal row spacing, but this needs to be verified through experiments.

5. Conclusions

Compared with CMTK, rice yield under rice-crayfish rotation was significantly improved by PMTWN and PMTE, mainly due to the significant improvement of spikelets per panicle, followed by the improvement of filled-grain percentage. Rice grown by mechanically transplanting pot-seedlings presented higher dry matter accumulation at the main rice growth stage, larger leaf area index, reasonable tiller dynamic, lower medium-term diffuse non-interceptance, forming high-light efficiency group population, and high potential photosynthetic and crop-growth rate during middle- and late-growth stages, which could enhance rice yield. The results also showed that PMTWN could optimize rice population structure and increase rice yield relative to PMTE. With the decrease in planting density, rice yield increased first and then decreased. The most optimum transplanting geometry for Fengyouxiangzhan is narrow row spacing 23 cm/wide row spacing 33 cm alternation combined with 16.8 cm plant spacing.

Author Contributions

Experimental design, H.G. (Hui Gao), Z.D. and Q.X.; Experiment data acquisition, Y.L. (Yangyang Li), H.G. (Halun Guo), J.J., Y.C., J.L.; Data curation & Writing-original draft, Y.L. (Yangyang Li); Writing-review & editing, H.G. (Hui Gao), Y.L. (Yaju Liu) and Z.D.; Supervision, H.G. (Hui Gao). All authors have read and agreed to the published version of the manuscript.

Funding

This work was supported by National Key Research and Development Project (2018YFD300804), Jiangsu Province Key Research and Development Project (BE2018335), Postdoctoral Scientific Research Fund Project of Jiangsu Province (2018K232C).

Institutional Review Board Statement

Not applicable.

Data Availability Statement

The original data presented in this study are included in the article, more details about raw data can be directed to the corresponding author.

Conflicts of Interest

The authors declare no conflict of interest.

References

  1. Liu, S.; Chao, P.; Fu, C.; Hai, Z.; Xiao, X.; Xin, Z.; Xiu, Z.; Yong, R. Yield variation of double-rice in response to climate change in Southern China. Eur. J. Agron. 2016, 81, 161–168. [Google Scholar] [CrossRef]
  2. Zheng, S.; Ye, C.; Lu, J.; Liufu, J.; Lin, L.; Dong, Z.; Li, J.; Zhuang, C. Improving the rice photosynthetic efficiency and yield by editing OsHXK1 via CRISPR/Cas9 system. Int. J. Mol. Sci. 2021, 22, 9554. [Google Scholar] [CrossRef] [PubMed]
  3. Singh, V.; Gautam, P.; Nanda, G.; Dhaliwal, S.; Pramanick, B.; Meena, S.; Alsanie, W.; Gaber., A.; Sayed, S.; Hossain, A. Soil test based fertilizer application improves productivity, profitability and nutrient use efficiency of rice (Oryza sativa L.) under direct seeded condition. Agron. J. 2021, 11, 1756. [Google Scholar] [CrossRef]
  4. Mo, A.; Dang, Y.; Wang, J.; Liu, C.; Yang, H.; Zhai, Y.; Wang, Y.; Yuan, Y. Heavy metal residues, releases and food health risks between the two main crayfish culturing models: Rice-crayfish coculture system versus crayfish intensive culture system. Environ. Pollut. 2022, 305, 119216. [Google Scholar] [CrossRef]
  5. Kruse, J.; Koch, M.; Khoi, C.M.; Braun, G.; Sebesvari, Z.; Amelung, W. Land use change from permanent rice to alternating rice-shrimp or permanent shrimp in the coastal Mekong Delta, Vietnam: Changes in the nutrient status and binding forms. Sci. Total Environ. 2020, 703, 134758. [Google Scholar] [CrossRef]
  6. Dou, Z.; Li, Y.; Guo, H.; Chen, L.; Jiang, J.; Zhou, Y.; Xu, Q.; Xing, Z.; Gao, H.; Zhang, H. Effects of mechanically transplanting methods and planting densities on yield and quality of Nanjing 2728 under rice-crayfish continuous production system. Agron. J. 2021, 11, 488. [Google Scholar] [CrossRef]
  7. Gao, H.; Li, Y.; Zhou, Y.; Guo, H.; Chen, L.; Yang, Q.; Lu, Y.; Dou, Z.; Xu, Q. Influence of mechanical transplanting methods and planting geometry on grain yield and lodging resistance of indica rice taoyouxiangzhan under rice&crayfish rotation system. Agron. J. 2022, 12, 1029. [Google Scholar]
  8. Xing, Z.; Hu, Y.; Qian, H.; Cao, W.; Guo, B.; Wei, H.; Xu, K.; Huo, Z.; Zhou, G.; Dai, Q.; et al. Comparison of yield traits in rice among three mechanized planting methods in a rice-wheat rotation system. J. Integr. Agr. 2017, 16, 1451–1466. [Google Scholar] [CrossRef] [Green Version]
  9. Hu, Y.; Wu, P.; Zhang, H.; Dai, Q.; Huo, Z.; Xu, K.; Gao, H.; Wei, H.; Guo, B.; Cui, P. Comparison of agronomic performance between inter-sub-specific hybrid and inbred japonica rice under different mechanical transplanting methods. J. Integr. Agr. 2018, 17, 806–816. [Google Scholar] [CrossRef] [Green Version]
  10. Hu, Q.; Jiang, W.; Qiu, S.; Xing, Z.; Hu, Y.; Guo, B.; Liu, G.; Gao, H.; Zhang, H.; Wei, H. Effect of wide-narrow row arrangement in mechanical pot-seedling transplanting and plant density on yield formation and grain quality of japonica rice. J. Integr. Agr. 2020, 19, 1197–1214. [Google Scholar] [CrossRef]
  11. Si, G.; Peng, C.; Yuan, J.; Xu, X.; Zhao, S.; Xu, D.; Wu, J. Changes in soil microbial community composition and organic carbon fractions in an integrated rice–crayfish farming system in subtropical China. Sci. Rep. 2017, 7, 2856. [Google Scholar] [CrossRef] [PubMed]
  12. Wang, D.; Chen, S.; Wang, Z.; Ji, C.; Xu, C.; Zhang, X.; Chauhan, B.S. Optimizing hill seeding density for high-yielding hybrid rice in a single rice cropping system in South China. PLoS ONE 2014, 9, e109417. [Google Scholar] [CrossRef] [PubMed] [Green Version]
  13. Ao, H.; Xie, X.; Huang, M.; Zou, Y. Decreasing hill density combined with increasing nitrogen rate led to yield decline in hybrid rice under low-light conditions. Sci. Rep. 2019, 9, 15786. [Google Scholar] [CrossRef] [PubMed] [Green Version]
  14. Wang, R.; Liyong, H.; Tai, C. Effect of wide–narrow row arrangement and plant density on yield and radiation use efficiency of mechanized direct-seeded canola in Central China. Field Crops Res. 2015, 172, 42–52. [Google Scholar] [CrossRef]
  15. Chauhan, B.; Johnson, D. Row spacing and weed control timing affect yield of aerobic rice. Field Crops Res. 2011, 121, 226–231. [Google Scholar] [CrossRef]
  16. Xing, Z.; Wu, P.; Zhu, M.; Qian, H.; Hu, Y.; Guo, B.; Wei, H.; Xu, K.; Huo, Z.; Dai, Q.; et al. Temperature and solar radiation utilization of rice for yield formation with different mechanized planting methods in the lower reaches of the Yangtze River, China. J. Integr. Agr. 2017, 16, 1923–1935. [Google Scholar] [CrossRef] [Green Version]
  17. Liu, Q.; Chen, S.; Zhou, L.; Tao, Y.; Tian, J.; Xing, Z.; Wei, H.; Zhang, H. Characteristics of population quality and rice quality of semi-waxy japonica rice varieties with different grain yields. Agriculture 2022, 12, 241. [Google Scholar] [CrossRef]
  18. Wei, H.; Zhang, H.; Blumwald, E.; Li, H.; Cheng, J.; Dai, Q.; Huo, Z.; Xu, K.; Guo, B. Different characteristics of high yield formation between inbred japonica super rice and inter-sub-specific hybrid super rice. Field Crops Res. 2016, 198, 179–187. [Google Scholar] [CrossRef]
  19. Shi, Z.; Chang, T.; Chen, G.; Song, Q.; Wang, Y.; Zhou, Z.; Wang, M.; Qu, M.; Wang, B.; Zhu, X. Dissection of mechanisms for high yield in two elite rice cultivars. Field Crops Res. 2019, 241, 107563. [Google Scholar] [CrossRef]
  20. Huang, M.; Tao, Z.; Lei, T.; Cao, F.; Chen, J.; Yin, X.; Zou, Y.; Liang, T. Improving lodging resistance while maintaining high grain yield by promoting pre-heading growth in rice. Field Crops Res. 2021, 270, 108212. [Google Scholar] [CrossRef]
  21. Zhang, H.; Jiang, S.; Du, B.; Zhou, Q.; Wu, Q.; Zhu, J. Tillage intensity and planting density significantly affected photosynthesis, growth, and yield of rice. J. Plant Growth Regul. 2022. [Google Scholar] [CrossRef]
  22. Deng, F.; He, L.; Chen, D.; Zhang, C.; Tian, Q.; Wu, Z.; Li, Q.; Zeng, Y.; Zhong, X.; Chen, H.; et al. Growth characteristics and grain yield of machine-transplanted medium indica hybrid rice with high daily yield. J. Integr. Agr. 2021, 21, 2547–2558. [Google Scholar] [CrossRef]
  23. Matsuoka, T.; Asagi, N.; Komatsuzaki, M. Response of weeds and rice yield to Italian ryegrass as a cover crop and planting density in organic farming. Agron. J. 2022, 114, 689–699. [Google Scholar] [CrossRef]
  24. Duy, P.; Abe, A.; Hirano, M.; Sagawa, S.; Kuroda, E. Analysis of lodging-resistant characteristics of different rice genotypes grown under the standard and nitrogen-free basal dressing accompanied with sparse planting density practices. Plant Prod. Sci. 2004, 7, 243–251. [Google Scholar]
  25. Zheng, H.; Chen, Y.; Chen, Q.; Li, B.; Zhang, Y.; Jia, W.; Mo, W.; Tang, Q. High-density planting with lower nitrogen application increased early rice production in a double-season rice system. Agron. J. 2020, 112, 205–214. [Google Scholar] [CrossRef] [Green Version]
  26. Chong, H.; Jiang, Z.; Shang, L.; Shang, C.; Deng, J.; Zhang, Y.; Huang, L. Dense planting with reduced nitrogen input improves grain yield, protein quality, and resource use efficiency in hybrid rice. J. Plant Growth Regul. 2022. [Google Scholar] [CrossRef]
  27. Guan, X.; Chen, J.; Chen, X.; Xie, J.; Deng, G.; Hu, L.; Li, Y.; Qian, Y.; Qiu, C.; Peng, C. Root characteristics and yield of rice as affected by the cultivation pattern of strong seedlings with increased planting density and reduced nitrogen application. J. Integr. Agr. 2022, 21, 1278–1289. [Google Scholar] [CrossRef]
  28. Dunn, B.; Dunn, T.; Mitchell, J.; Brinkhoff, J. Effects of plant population and row spacing on grain yield of aerial-sown and drill-sown rice. Crop Pasture Sci. 2020, 71, 219. [Google Scholar] [CrossRef]
  29. Yang, G.; Wang, X.; Nabi, F.; Wang, H.; Zhao, C.; Peng, Y.; Ma, J.; Hu, Y. Optimizing planting density and impact of panicle types on grain yield and microclimatic response index of hybrid rice (Oryza sativa L.). Int. J. Plant Prod. 2021, 15, 447–457. [Google Scholar] [CrossRef]
  30. Zhou, C.; Huang, Y.; Jia, B.; Wang, S.; Dou, F.; Samonte, S.; Chen, K.; Wang, Y. Optimization of nitrogen rate and planting density for improving the grain yield of different rice genotypes in Northeast China. Agron. J. 2019, 9, 555. [Google Scholar] [CrossRef] [Green Version]
  31. Guo, X.; Lan, Y.; Xu, L.; Yin, D.; Li, H.; Qian, Y.; Zheng, G.; Lü, Y. Effects of nitrogen application rate and hill density on rice yield and nitrogen utilization in sodic saline-alkaline paddy fields. J. Integr. Agr. 2021, 20, 540–553. [Google Scholar] [CrossRef]
  32. Dey, P.; Mahapatra, B.; Pramanick, B.; Pyne, S.; Pandit, P. Optimization of seed rate and nutrient management levels can reduce lodging damage and improve yield, quality and energetics of subtropical flax. Biomass Bioenergy 2022, 157, 106355. [Google Scholar] [CrossRef]
  33. Zheng, C.; Wang, Y.; Yuan, S.; Yu, X.; Yang, G.; Yang, C.; Yang, D.; Wang, F.; Huang, J.; Peng, S. Effects of skip-row planting on grain yield and quality of mechanized ratoon rice. Field Crops Res. 2022, 285, 108584. [Google Scholar] [CrossRef]
  34. Chauhan, B. Effects of planting pattern and cultivar on weed and crop growth in aerobic rice system. Weed Technol. 2011, 25, 521–525. [Google Scholar]
Figure 1. Average daily sunshine hours and temperature during rice growth season of 2018 and 2019 in the experimental site.
Agriculture 12 01817 g001
Figure 2. Rice tiller dynamic under different mechanical transplanting methods and planting geometry. (A,B) Mechanically transplanted carpet seedlings. (C,D) Mechanically transplanted pot seedlings.
Agriculture 12 01817 g002
Figure 3. Correlation coefficients between canopy structure index and yield at heading stage of rice. (A) Mechanically transplanted carpet seedlings (R20.05 = 0.16, R20.01 = 0.27). (B) Mechanically transplanted pot seedlings (R20.05 = 0.12, R20.01 = 0.20). LAI1, Leaf area index of 20 cm above the ground; DIFN1, Diffuse non-interceptance of 20 cm above the ground; MTA1, Mean tilt angle of 20 cm above the ground; LAI2, Leaf area index of 50 cm above the ground; DIFN2, Diffuse non-interceptance of 50 cm above the ground; MTA2, Mean tilt angle of 50 cm above the ground; LAI3, Leaf area index of 80 cm above the ground; DIFN3, Diffuse non-interceptance of 80 cm above the ground; MTA3, Mean tilt angle of 80 cm above the ground; NP, Panicles; NSPP, Spikelets per panicle; FGP, Filled-grain percentage; TGW, 1000-grain weight; TY, Theoretical yield; HY, Harvest yield. Asterisk indicates a statistically significant difference (*, p < 0.05; **, p < 0.01).
Agriculture 12 01817 g003
Table 1. Comparison of basic rice seedlings of different mechanical transplantations.
Mechanical Transplanting MethodsTreatmentRow Spacing
(cm)
Density
(×104 ha−1)
Seedlings per HillBasic Seedlings
(×104 ha−1)
carpet seedlings mechanically transplantedCMTE111.529.0257.9
with equal row spacing (CMTE)CMTE212.826.1252.2
CMTE314.423.1246.2
CMTE415.721.3242.6
CMTE516.720.0239.9
CMTE619.317.3234.5
pot seedlings mechanically transplantedPMTWN112.428.8257.6
with wide-narrow row spacing (PMTWN)PMTWN213.826.0251.9
PMTWN315.523.1246.2
PMTWN416.821.3242.6
PMTWN517.920.0239.9
PMTWN620.717.3234.5
pot seedlings mechanically transplantedPMTE315.523.1246.2
with equal row spacing (PMTE)PMTE416.821.3242.6
Table 2. Yield and its components of rice under different mechanical transplanting methods and planting geometry.
YearTreatmentPanicles(×104 ha−1)Spikelets per PanicleFilled-Grain Percentage (%)1000-Grain Weight(g)Theoretical Yield(t ha−1)Harvest Yield(t ha−1)Apparent Lodging Rate (%)
2018CMTE1302.9 a152.4 h82.3 e25.9 ab9.84 gh9.19 f100.0
CMTE2290.0 a156.1 h84.9 de26.0 ab10.03 efgh9.61 de100.0
CMTE3270.5 bc165.4 fg86.8 cd26.5 ab10.31 defg9.79 d75.0
CMTE4257.4 cd176.4 de88.0 abcd26.9 a10.73 bcd10.19 c33.0
CMTE5247.9 de181.1 bc88.1 abcd26.4 ab10.44 def9.60 de15.0
CMTE6226.1 fg185.8 a89.6 abc25.9 ab9.74 h9.36 ef0.0
PMTWN1292.0 a162.4 g86.3 cd25.7 b10.52 cde9.55 def100.0
PMTWN2276.3 b167.8 f87.8 bcd26.6 ab10.82 bcd9.77 d80.0
PMTWN3262.4 cd177.6 cde88.5 abcd26.7 a11.00 abc10.32 bc35.0
PMTWN4254.0 d183.6 ab91.2 ab26.8 a11.37 a10.77 a0.0
PMTWN5238.6 ef184.6 ab91.4 ab26.8 a10.77 bcd10.27 bc0.0
PMTWN6222.4 g186.4 a91.9 a26.2 ab9.97 fgh9.61 de0.0
PMTE3260.2 cd175.6 e88.3 abcd26.7 a10.77 bcd10.19 c40.0
PMTE4253.3 d180.3 bcd91.1 ab26.7 a11.11 ab10.59 ab0.0
2019CMTE1289.0 a152.5 h87.5 h26.4 d10.16 e9.45 f100.0
CMTE2281.0 ab159.0 g87.8 gh26.6 bcd10.43 cde9.77 def85.0
CMTE3265.8 c167.2 f88.6 fg27.1 ab10.69 bcde10.01 cde67.0
CMTE4251.4 d179.7 d89.2 ef27.1 ab10.92 bcd10.32 bc10.0
CMTE5250.1 d180.3 d89.3 ef26.6 bcd10.71 bcde9.78 def0.0
CMTE6237.0 e181.0 d90.3 cd26.7 abcd10.36 de9.47 f0.0
PMTWN1277.7 b161.3 g89.8 de26.6 cd10.69 bcde9.69 ef80.0
PMTWN2265.6 c169.0 f90.6 cd27.0 abc10.98 bcd9.91 cde45.0
PMTWN3254.6 d178.0 de91.0 bc26.8 abcd11.06 abc10.15 cd10.0
PMTWN4250.2 d186.1 bc91.7 ab27.2 a11.64 a10.80 a0.0
PMTWN5234.8 e190.9 ab91.6 ab26.7 abcd10.99 bcd10.23 bc0.0
PMTWN6221.8 f193.7 a92.2 a27.1 abc10.72 bcde9.93 cde0.0
PMTE3256.3 d174.2 e91.5 ab26.7 bcd10.91 bcd10.08 cde25.0
PMTE4250.2 d182.5 cd91.7 ab26.9 abc11.27 ab10.63 ab0.0
Values within each column followed by different letters are significantly different at p < 0.05 level.
Table 3. Leaf area index and decreasing rate of leaf area during grain-filling stage of rice under different mechanical transplanting methods and planting geometry.
YearTreatmentJointingHeadingMaturityDecreasing Rate of Leaf Area at Grain-Filling Stage (LAI·d−1)
Leaf Area IndexHigh-Efficiency Leaf Area IndexHigh-Efficiency Leaf Ratio (%)
2018CMTE14.93 a7.21 fg4.35 f60.4 g3.10 g0.0720 ab
CMTE24.61 b7.34 efg4.51 ef61.4 fg3.22 fg0.0724 a
CMTE34.39 bc7.46 cde4.63 e62.1 ef3.55 def0.0686 abc
CMTE43.99 de7.66 bc4.83 d63.0 cde3.78 bcd0.0684 abc
CMTE53.78 e7.38 def4.56 e61.8 ef3.53 def0.0676 abc
CMTE63.51 f7.13 g4.36 f61.1 fg3.34 efg0.0664 abc
PMTWN14.96 a7.41 def4.61 e62.3 def3.43 defg0.0699 abc
PMTWN24.64 b7.59 bcd4.82 d63.5 bcd3.68 bcde0.0684 abc
PMTWN34.49 b7.82 ab5.04 abc64.4 ab4.00 ab0.0671 abc
PMTWN44.18 cd7.99 a5.20 a65.0 a4.28 a0.0653 abc
PMTWN54.17 cd7.59 bcd4.87 cd64.1 abc3.98 abc0.0635 c
PMTWN63.83 e7.28 efg4.59 e63.0 cde3.63 cde0.0642 bc
PMTE34.39 bc7.79 ab5.01 bc64.3 ab3.97 abc0.0670 abc
PMTE44.19 cd7.91 a5.11 ab64.7 ab4.14 a0.0660 abc
2019CMTE14.81 ab7.40 g4.43 g62.9 e3.45 g0.0693 a
CMTE24.45 abcd7.45 fg4.47 fg63.0 e3.57 g0.0680 ab
CMTE34.38 bcd7.72 de4.69 ef63.9 cde3.88 de0.0672 abcd
CMTE44.14 cde7.91 cd4.85 de64.4 bcde4.07 cd0.0674 abcd
CMTE53.96 de7.68 def4.65 efg63.6 de3.91 de0.0662 abcd
CMTE63.70 e7.42 g4.43 g62.8 e3.65 fg0.0660 bcd
PMTWN14.99 a7.66 ef4.78 de64.3 bcde3.80 ef0.0677 abc
PMTWN24.85 ab7.84 cde4.98 cd65.4 abcd4.01 de0.0671 abcd
PMTWN34.63 abc8.15 ab5.20 abc65.8 abc4.39 ab0.0661 bcd
PMTWN44.19 cde8.28 a5.39 a66.6 a4.57 a0.0651 bcd
PMTWN54.13 cde8.02 bc5.10 bc65.2 abcd4.34 b0.0647 cd
PMTWN64.07 cde7.74 de4.82 de64.0 cde4.09 cd0.0642 d
PMTE34.53 abcd8.08 abc5.16 abc65.6 abcd4.28 bc0.0667 abcd
PMTE44.21 cde8.20 ab5.28 ab66.1 ab4.41 ab0.0664 abcd
Values within each column followed by different letters are significantly different at p < 0.05 level.
Table 4. Photosynthetic potential of rice under different mechanical transplanting methods and planting geometry.
YearTreatmentSowing-JointingJointing-HeadingHeading-Maturity
2018CMTE1142.9 c145.6 abc283.5 g
CMTE2133.7 de143.5 cd290.5 fg
CMTE3130.2 e143.4 cd302.6 def
CMTE4115.6 f139.8 e314.6 bcde
CMTE5109.6 f133.9 f299.8 efg
CMTE6101.7 g127.6 g287.7 fg
PMTWN1166.1 a148.5 a298.1 efg
PMTWN2155.6 b146.8 ab309.9 cde
PMTWN3147.0 c146.5 abc324.9 abc
PMTWN4140.1 cd146.1 abc337.4 a
PMTWN5139.7 cd141.2 de318.2 bcd
PMTWN6128.3 e133.4 f300.0 efg
PMTE3147.3 c146.2 abc323.4 abc
PMTE4140.2 cd145.1 bc331.3 ab
2019CMTE1139.4 cd158.7 abcd298.4 e
CMTE2129.0 de154.7 bcd303.2 e
CMTE3126.9 de157.2 abcd319.0 cd
CMTE4120.1 ef156.6 abcd329.3 c
CMTE5114.8 ef151.3 de318.8 cd
CMTE6107.5 f144.7 e304.7 e
PMTWN1167.1 a164.4 ab314.8 d
PMTWN2162.4 ab165.0 ab326.2 c
PMTWN3155.2 ab166.1 a344.5 ab
PMTWN4140.4 cd162.1 abc353.4 a
PMTWN5138.4 cd158.0 abcd339.6 b
PMTWN6136.2 d153.6 cde325.4 c
PMTE3151.6 bc163.9 abc339.8 b
PMTE4141.0 cd161.3 abcd346.9 ab
Values within each column followed by different letters are significantly different at p < 0.05 level.
Table 5. Dry weight per stem of rice under different mechanical transplanting methods and planting geometry.
YearTreatmentJointing (g)Heading (g)Maturity (g)
2018CMTE10.93 e3.08 f7.00 h
CMTE20.99 d3.23 f7.23 gh
CMTE30.99 d3.40 ef7.50 fg
CMTE41.00 d3.68 de7.67 ef
CMTE51.07 c3.81 bcd7.85 def
CMTE61.13 b3.96 bcd7.95 de
PMTWN11.02 d3.41 ef7.60 efg
PMTWN21.06 c3.74 cde7.99 de
PMTWN31.08 c4.00 bcd8.62 ab
PMTWN41.12 b4.09 abc8.84 ab
PMTWN51.15 b4.14 ab8.72 ab
PMTWN61.22 a4.40 a8.90 a
PMTE31.13 b4.01 bcd8.18 cd
PMTE41.19 a4.07 abc8.46 bc
2019CMTE10.94 e3.62 e7.28 e
CMTE21.06 d3.65 e7.47 de
CMTE31.07 d3.68 e7.47 de
CMTE41.08 d3.80 e7.59 de
CMTE51.11 cd4.09 d7.96 cde
CMTE61.13 abcd4.36 cd8.15 bcd
PMTWN11.08 d3.74 e8.63 bcd
PMTWN21.14 abcd4.33 cd8.83 abc
PMTWN31.17 abc4.39 c8.90 abc
PMTWN41.18 abc4.46 c9.10 abc
PMTWN51.21 ab4.95 b9.23 ab
PMTWN61.22 a5.24 a9.56 a
PMTE31.12 bcd4.27 cd8.48 abcd
PMTE41.20 ab4.45 c9.06 abc
Values within each column followed by different letters are significantly different at p < 0.05 level.
Table 6. Dry matter weight and harvest index of rice under different mechanical transplanting methods and planting geometry.
YearTreatmentJointing
(t ha−1)
Heading
(t ha−1)
Maturity
(t ha−1)
Harvest Index (%)
2018CMTE15.18 ab10.1 e19.6 e51.3 bc
CMTE25.07 abc10.3 de19.8 de51.5 bc
CMTE34.78 cde10.3 de20.2 cde51.9 abc
CMTE44.63 def10.6 cd20.6 bcd52.3 abc
CMTE54.51 ef10.4 de20.2 cde51.8 abc
CMTE64.30 f10.0 e19.5 e51.1 c
PMTWN15.32 a10.4 de20.2 cde51.3 bc
PMTWN25.08 abc10.8 abc20.7 bcd52.4 ab
PMTWN34.97 abcd11.0 ab21.3 ab52.5 ab
PMTWN44.78 cde11.2 a21.7 a52.8 a
PMTWN54.63 def10.8 bc20.9 abc52.5 ab
PMTWN64.48 ef10.6 cd20.1 cde51.3 bc
PMTE34.86 bcde10.8 bc21.0 abc51.6 abc
PMTE44.72 cde10.9 ab21.4 ab52.2 abc
2019CMTE15.18 ab10.7 c19.5 f52.4 b
CMTE25.05 abc11.2 abc20.1 ef52.5 b
CMTE34.89 abcd11.4 abc20.8 cde52.7 ab
CMTE44.64 de11.7 abc21.4 bcd53.3 ab
CMTE54.41 ef11.4 abc20.7 cde52.8 ab
CMTE64.26 f11.0 bc20.1 ef52.6 ab
PMTWN15.24 a11.4 abc20.5 de52.7 ab
PMTWN25.14 ab11.9 ab21.2 bcd53.3 ab
PMTWN34.85 bcd12.0 ab21.5 abc53.4 ab
PMTWN44.73 cde12.3 a22.4 a54.4 a
PMTWN54.57 def12.0 ab21.5 abc53.0 ab
PMTWN64.39 ef11.7 abc21.0 cde52.7 ab
PMTE34.87 bcd12.0 ab21.3 bcd53.2 ab
PMTE44.72 cde12.2 ab22.1 ab53.7 ab
Values within each column followed by different letters are significantly different at p < 0.05 level.
Table 7. The crop growth rate and net assimilation rate of rice under different mechanical transplanting methods and planting geometry.
YearTreatmentCrop Growth Rate (g m−2 d−1)Net Assimilation Rate (g m−2 d−1)
Sowing-
Jointing
Jointing-
Heading
Heading-
Maturity
Sowing-
Jointing
Jointing-
Heading
Heading-
Maturity
2018CMTE18.93 a20.3 g17.3 fg2.89 a3.38 g3.55 a
CMTE28.74 a21.7 f17.4 fg2.90 a3.68 f3.47 a
CMTE38.23 b22.9 e18.0 de2.75 b3.92 ef3.42 a
CMTE47.99 bc24.6 bc18.1 de2.77 b4.41 ab3.30 a
CMTE57.78 bcd24.4 bcd17.9 e2.73 b4.53 ab3.43 a
CMTE67.43 def23.9 cd17.3 g2.65 bc4.68 a3.46 a
PMTWN17.93 bc20.4 g17.8 ef2.56 cd3.35 g3.43 a
PMTWN27.57 cde23.0 e18.0 de2.51 de3.84 ef3.34 a
PMTWN37.41 def24.1 bcd18.7 abc2.49 de4.07 cde3.29 a
PMTWN47.13 efgh25.5 a19.1 a2.44 def4.33 bc3.21 a
PMTWN56.90 gh24.7 abc18.4 cd2.37 f4.32 bc3.29 a
PMTWN66.68 h24.5 bcd17.4 fg2.34 f4.55 ab3.31 a
PMTE37.25 efg23.6 de18.6 bc2.44 def3.99 de3.29 a
PMTE47.05 fgh24.9 ab19.0 ab2.41 ef4.26 bcd3.26 a
2019CMTE18.91 a21.2 g16.0 f2.91 a3.54 e3.10 a
CMTE28.70 a23.6 f16.2 ef2.92 a4.05 cde3.08 a
CMTE38.44 ab25.1 e17.0 d2.85 a4.26 abcd3.04 a
CMTE47.99 bc27.3 bc17.6 bc2.74 ab4.68 abc3.06 a
CMTE57.59 cdef26.8 cd16.9 d2.63 bc4.78 ab3.02 a
CMTE67.34 defg26.1 de16.4 e2.59 bcd4.88 ab3.08 a
PMTWN17.82 cd23.7 f16.5 de2.52 cde3.80 de3.02 a
PMTWN27.66 cde26.0 de16.9 d2.49 cde4.18 bcde2.95 a
PMTWN37.23 efg27.4 bc17.3 c2.39 def4.41 abcd2.86 a
PMTWN47.05 fgh28.9 a18.4 a2.41 def4.82 ab2.94 a
PMTWN56.82 gh28.4 ab17.4 c2.34 ef4.85 ab2.91 a
PMTWN66.55 h28.1 ab16.9 d2.26 f4.91 a2.95 a
PMTE37.26 defg27.4 bc16.9 d2.42 cdef4.47 abcd2.83 a
PMTE47.03 fgh28.7 a18.0 b2.40 def4.80 ab2.94 a
Values within each column followed by different letters are significantly different at p < 0.05 level.
Table 8. The canopy structure of rice under different mechanical transplanting methods and planting geometry.
YearTreatment20 cm above the Ground
during Jointing
20 cm above the Ground
during Heading
50 cm above the Ground
during Heading
80 cm above the Ground
during Heading
LAIDIFNMTALAIDIFNMTALAIDIFNMTALAIDIFNMTA
2018CMTE14.09 abc0.0437 d61.3 ab5.64 f0.0414 a60.3 ab4.01 g0.0535 a62.0 ab2.56 g0.1745 ab65.5 ab
CMTE24.09 abc0.0461 cd60.3 abc5.87 ef0.0399 a58.0 cde4.51 f0.0531 a61.0 abc2.64 fg0.1710 ab64.5 abc
CMTE34.00 bcd0.0463 bcd60.3 abc6.18 cd0.0364 b57.5 def4.85 e0.0483 bc60.0 bcd2.81 ef0.1650 ab62.5 abc
CMTE43.91 cde0.0516 abc59.0 abc6.41 bc0.0327 cd57.5 def5.07 cd0.0466 cd57.5 de2.93 de0.1505 bc61.0 bc
CMTE53.92 cde0.0529 ab57.3 c6.24 cd0.0345 bc56.3 ef4.76 e0.0481 bc56.8 e2.81 ef0.1625 ab60.5 c
CMTE63.78 e0.0549 a57.0 c5.86 ef0.0371 b55.5 f4.45 f0.0513 ab56.5 e2.49 g0.1875 a61.5 bc
PMTWN14.26 a0.0417 d62.3 a5.87 ef0.0357 b61.5 a5.06 d0.0470 cd63.0 a2.84 ef0.1495 bc66.5 a
PMTWN24.17 ab0.0443 d61.3 ab6.09 de0.0317 de59.8 abc5.18 cd0.0443 de62.0 ab3.10 cd0.1295 cde66.5 a
PMTWN34.05 bcd0.0448 d60.3 abc6.31 bcd0.0273 f59.0 bcd5.29 bc0.0433 def60.8 abc3.39 b0.1090 ef64.0 abc
PMTWN43.99 bcd0.0460 cd60.0 abc6.70 a0.0269 f59.5 abcd5.60 a0.0395 g61.3 abc3.64 a0.0935 f63.5 abc
PMTWN53.91 cde0.0485 abcd59.5 abc6.39 bc0.0295 ef57.5 def5.51 a0.0422 efg59.3 bcde3.31 bc0.1145 def63.0 abc
PMTWN63.85 de0.0518 abc58.1 bc6.05 de0.0318 cde56.5 ef5.18 cd0.0461 cd59.0 cde2.96 de0.1365 cd62.0 abc
PMTE34.07 abc0.0466 bcd60.0 abc6.14 cd0.0313 de59.5 abcd5.09 cd0.0437 def61.3 abc3.31 bc0.1130 def64.5 abc
PMTE43.95 cde0.0474 bcd60.0 abc6.56 ab0.0280 f59.0 bcd5.43 ab0.0405 fg61.0 abc3.53 ab0.1065 ef63.5 abc
2019CMTE14.03 abc0.0367 c60.1 ab5.84 f0.0393 a60.7 ab4.23 f0.0405 a61.0 abc2.74 f0.1690 a64.8 ab
CMTE23.99 abc0.0382 abc60.0 ab5.91 f0.0342 abc60.5 ab4.39 f0.0380 ab60.0 abc2.81 f0.1640 a62.5 ab
CMTE33.82 bcde0.0443 abc58.9 ab6.20 e0.0292 abcd59.5 bcd4.58 ef0.0370 abc62.0 ab2.93 ef0.1595 a61.8 ab
CMTE43.70 cde0.0465 abc58.3 ab6.45 d0.0185 e58.2 de5.14 cd0.0275 ef58.0 bc3.31 cde0.1235 b60.5 ab
CMTE53.53 de0.0514 ab57.9 ab5.99 ef0.0315 abc58.5 de4.91 de0.0293 def57.5 bc2.85 f0.1355 b59.8 ab
CMTE63.43 e0.0520 a56.1 b5.85 f0.0362 ab57.7 e4.34 f0.0318 cde57.0 c2.77 f0.1675 a58.5 b
PMTWN14.34 a0.0320 c60.8 a6.17 e0.0260 bcde61.0 a5.01 cd0.0365 abc63.3 a3.15 def0.1185 b68.5 a
PMTWN24.22 ab0.0358 c60.1 ab6.59 cd0.0205 de60.5 ab5.38 bc0.0345 bcd63.3 a3.33 bcde0.0903 de68.5 a
PMTWN34.20 ab0.0375 bc58.4 ab6.66 abcd0.0180 ef60.0 abc5.29 c0.0347 bc61.8 abc3.63 abc0.0875 e66.0 ab
PMTWN44.11 ab0.0379 abc58.3 ab6.88 ab0.0105 f60.3 abc5.86 a0.0245 fg60.3 abc3.79 a0.0815 e65.0 ab
PMTWN54.02 abc0.0409 abc58.1 ab6.89 a0.0175 ef59.3 bcd5.68 ab0.0220 g60.0 abc3.60 abc0.1133 bcd64.5 ab
PMTWN63.89 bcd0.0434 abc57.9 ab6.58 cd0.0180 ef58.5 de5.16 cd0.0260 fg58.8 abc3.28 cde0.1145 bc62.0 ab
PMTE34.18 ab0.0350 c58.8 ab6.61 bcd0.0245 cde59.0 cde5.14 cd0.0355 abc61.0 abc3.51 abcd0.0930 cde64.5 ab
PMTE44.09 abc0.0368 c58.0 ab6.75 abc0.0160 ef58.5 de5.69 ab0.0280 ef60.0 abc3.72 ab0.1165 bc64.0 ab
Values within each column followed by different letters are significantly different at p < 0.05 level. LAI, Leaf area index; DIFN, Diffuse non-interceptance; MTA, Mean tilt angle.
Publisher’s Note: MDPI stays neutral with regard to jurisdictional claims in published maps and institutional affiliations.

