Article

ROS Regulate NCF2, Key Metabolic Enzymes and MDA Levels to Affect the Growth of Fusarium solani

1
College of Forestry, Gansu Agricultural University, Lanzhou 730070, China
2
Wolfberry Harmless Cultivation Engineering Research Center of Gansu Province, Lanzhou 730070, China
3
College of Food Science and Engineering, Gansu Agricultural University, Lanzhou 730070, China
4
College of Veterinary Medicine, Gansu Agricultural University, Lanzhou 730070, China
*
Author to whom correspondence should be addressed.
Agriculture 2022, 12(11), 1840; https://doi.org/10.3390/agriculture12111840
Submission received: 7 September 2022 / Revised: 21 October 2022 / Accepted: 31 October 2022 / Published: 2 November 2022
(This article belongs to the Special Issue Plant–Soil–Microorganism Interaction in Grassland Agroecosystem)

Abstract

:
Fusarium solani is the most significant pathogen that causes root rot in wolfberry, which has led to serious economic losses in terms of production. As an important enzyme in organisms, NADPH oxidase produces ROS. However, the mechanism of ROS mediated by NADPH oxidase in the growth of F. solani has not been studied. In this study, F. solani colonies were treated with 40 µmol/L DPI and 0.0012% H2O2. The growth rate in terms of colonies, number of spores, key gene expression levels, activity of key enzymes and the content of key products of ROS metabolic pathways were determined. The results showed that the growth rate of colonies treated by DPI decreased by 19.43%, the number of macroconidia increased by 231.03%, the IOD/area values of O2 and H2O2 decreased by 34.88% and 16.97%, respectively, the expression levels in terms of NCF2, SOD1, CTA1 and PXMP4 significantly decreased and the activities of SOD, CAT and POD decreased significantly, while the MDA content increased significantly. Additionally, in the case of the colonies treated with exogenous H2O2, the MDA content decreased significantly while the other indicators increased. Taken together, the NCF2 gene is involved in regulating the activity of NADPH oxidase and regulates the products of O2 and ROS metabolism enzyme genes and their activities to affect colony growth in the F. solani growth process.

1. Introduction

Root rot disease is the most serious disease in Wolfberry (Lycium barbarum L.) production, especially in those with a long planting period. According to statistics, the highest incidence rate reached 72.4% and occurred in all the main producing bases [1]. The main pathogens of wolfberry root rot contain Fusarium solani, F. oxysporum, F. dimerum, F. moniliforme and Rhizoctonia solani [2]. F. solani has a stronger pathogenicity compared to other root rot pathogens in the Gansu production area [3]. Recent studies have shown that ROS play an important physiological role in cell signal transduction and transcription. At the same time, ROS can react to a variety of ligands, including growth factors, cytokines and protein G-linked receptors [4]. At present, multiple studies have confirmed that the ROS produced by pathogens are positively correlated with their growth and pathogenicity [5,6].
NADPH oxidase can specifically produce superoxide anion, which is the most important kind of ROS, and its abnormal regulation affects the redox signal cascade that controls cell proliferation and death [7]. NADPH oxidase is located on the cell membrane [8] and is the key enzyme in terms of redox signals in eukaryotic cells [9]. ROS generation from NADPH oxidase requires the assembly of multi-subunit complexes [10,11]. Filamentous fungi include three different NADPH oxidase subfamilies, namely NoxA, NoxB and NoxC. Among them, NoxA and NoxB are homologous to the mammalian catalytic subunit gp91phox, and NoxC contains the putative calcium-binding left-handed motif, which is homologous to human Nox5 and plant Nox; it also contains the homologous regulatory subunit p67phox (NoxR, NCF2) and the small GTPase Rac gene [12]. The NoxA complex controls sporophore formation [13], the sclerotia [14,15] and germ tubes [16], toxicity [14,17] and cellulose degradation [18]. The NoxB complex is responsible for host tissue infiltration [19], ROS production [20] and ascospore germination [21].
However, the role of ROS mediated by NADPH oxidase in F. solani isolate growth remains unclear. The key subunit of the NADPH complex that restricts the growth of F. solani and its downstream genes needs to be explored. Additionally, the growth, spore number, gene expression and physiological recovery of F. solani by exogenous ROS need to be verified. In this study, F. solani was used as the test isolate, was cultured in PDA and was treated with the NADPH oxidase inhibitor DPI and a typical ROS such as H2O2. The changes in ROS production intensity and location, key differentially expressed genes and key antioxidant enzyme indices among treatments were measured to reveal the role of ROS mediated by NADPH oxidase in the growth of F. solani and provide a theoretical basis for the control of wolfberry root rot.

2. Materials and Methods

2.1. Fungi

The F. solani isolate was isolated from wolfberry root with root rot disease in Wuhe Township, Jingyuan County, Gansu Province, China (36.98° N, 105.21° E, 1700 m). The isolate was stored at −70 °C in a refrigerator at the Wolfberry Harmless Cultivation Engineering Research Center, College of Forestry, Gansu Agricultural University according to the method of Leslie and Summerell [22]. PDA medium was used to activate and culture the isolate at 25 °C for 8 days before use. After the second culture, the 5 mm plugs were taken out and used as inoculation material in the study.

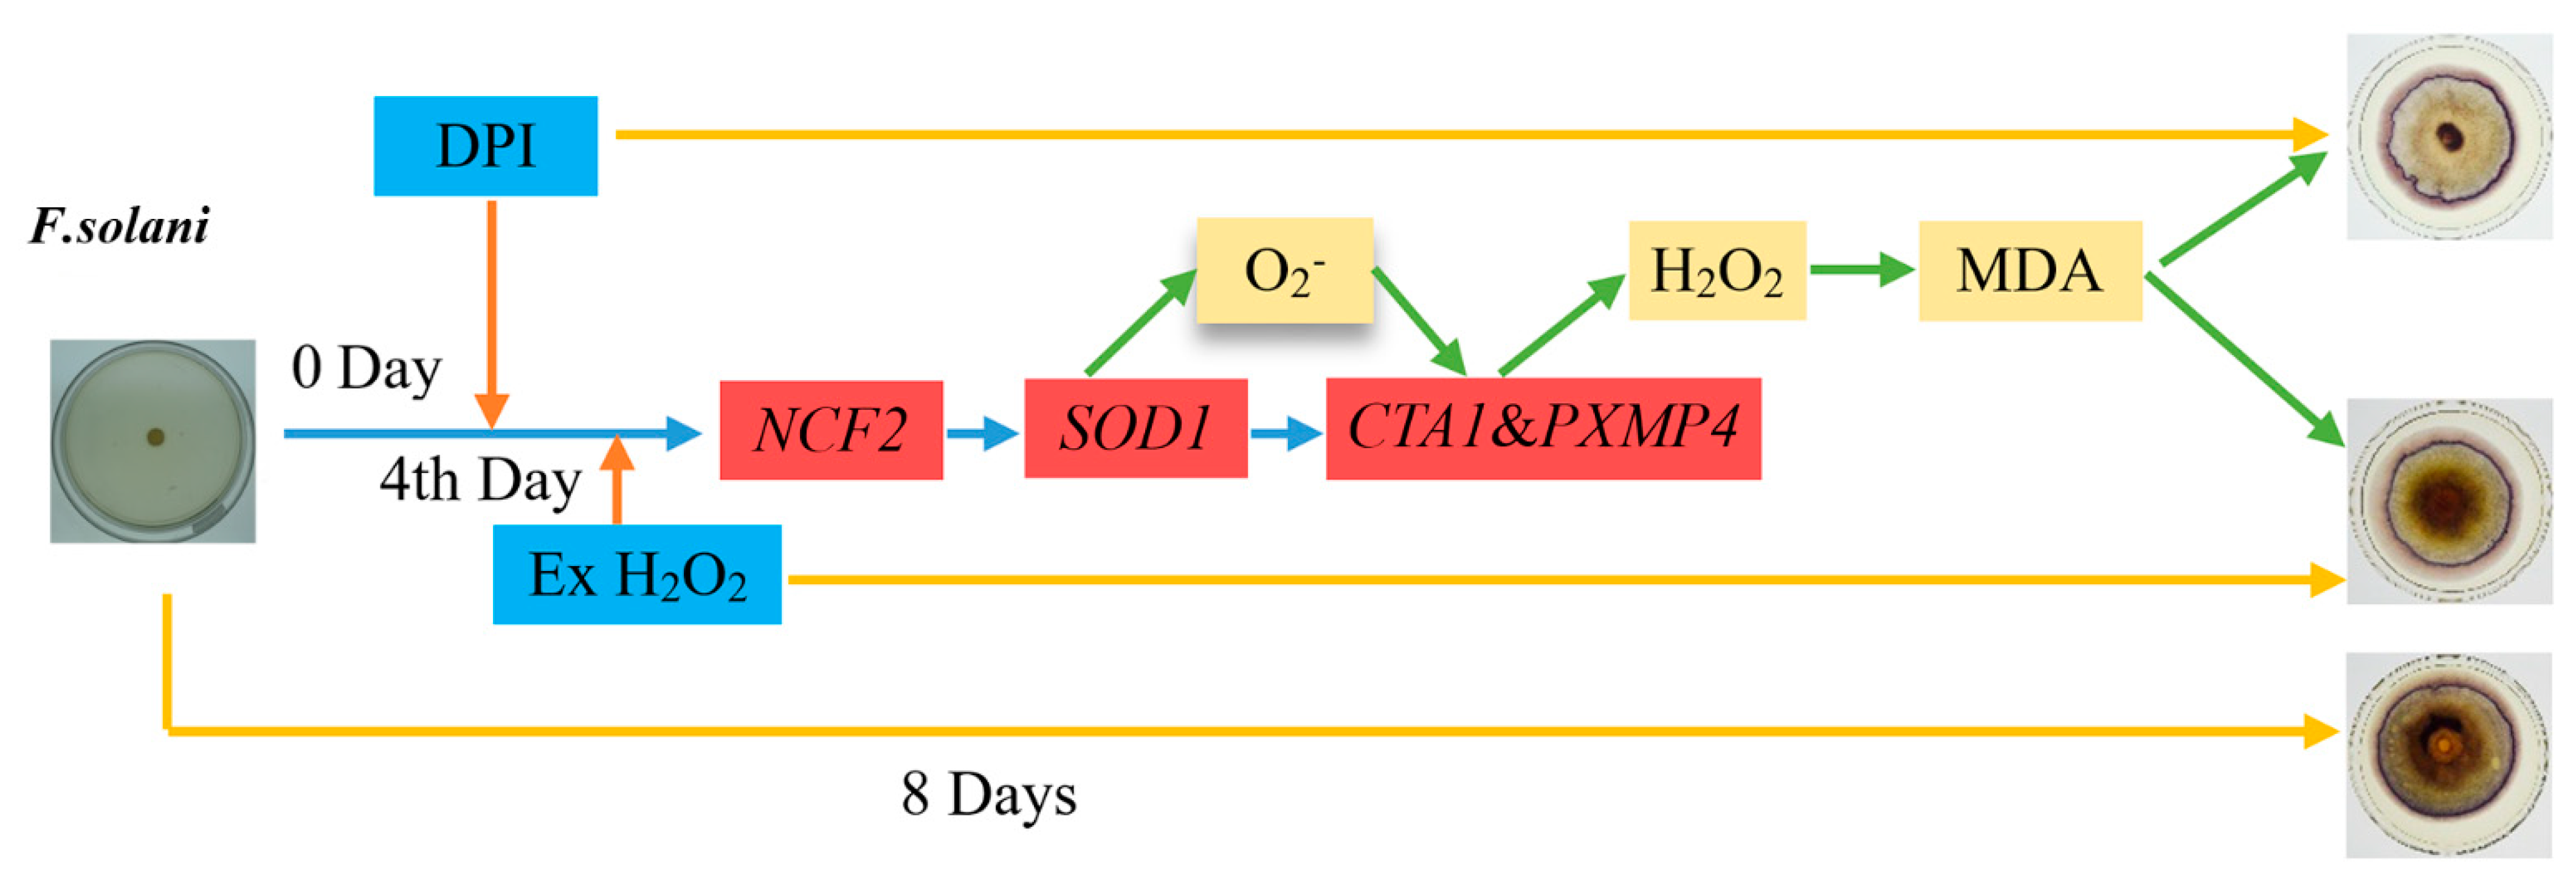
2.2. Treatment and Sample Collection

Four treatments were set up in this study, and F. solani isolate was inoculated in PDA medium for S1 treatment. For S2 treatment, the isolate was inoculated in PDA medium containing 40 µmol/L DPI. For S3 treatment, the isolate was cultured in PDA medium containing 40 µmol/L DPI for 3 days, and 5 mL of 0.0012% H2O2 solution was added on the 4th day. For S4 treatment, the isolate was cultured in PDA medium for 3 days, and 5 mL 0.0012% H2O2 solution was added on the 4th day. There were three repetitions each treatment and fifteen dishes each repetition.
The colonies were observed at 10:00 a.m. every day. The transverse and longitudinal diameters of the colonies were measured by the cross method. The number of spores were determined on the 8th day by a hemocytometer [23]. When the S1, S2 and S3 had been cultured for 8 days, histochemical stained ROS were detected by using the NBT and DAB methods. At the same time, the samples were scraped, mixed, weighed, sub-packed and stored in liquid nitrogen to determine the O2 and H2O2 contents, the activities of major enzymes such as SOD, POD and CAT, the MDA content and the expression level of genes. Fifteen samples were collected for each treatment, 0.2 g each sample. In addition, when S4 had been cultured for 8 days, six mixed samples were collected for O2 and H2O2 determination.

2.3. Transcriptome Extraction, Sequencing, Comparison and Analysis

The total RNA was extracted from the S1, S2 and S3 treatments by employing the Trizol® kit method, and the genomic DNA was removed. After testing the concentration and quality of RNA and mRNA with poly-A tail, the RNA and mRNA were enriched by Oligo(dT) magnetic beads. The fragmented mRNA was used as templates, the random oligonucleotides were used as primers and the first strand of cDNA was synthesized in a reverse transcriptase system (Invitrogen, Waltham, MA, USA). The RNA strand was degraded with RNase H and the second strand of cDNA was synthesized from dNTPs in a DNA polymerase I system. The purified double stranded cDNA was used to repair the end, add the A tail and connect the sequencing connector. The length of cDNA, roughly 250–300 bp, was screened with AMPure XP beads and amplified by PCR and the PCR product was purified with ampure XP beads again, before the the library fragments were finally obtained. The library fragments were sequenced by Wuhan Frasergen Gene Information Co., Ltd. (Wuhan, China) on an Illumina PE150 sequencing platform to obtain raw reads. The splice sequences, low-quality (base number ≤ 5) reads and their paired ends and undetected reads (N content ≥ 10%) and their paired ends were filtered out to obtain clean reads. The contents of Q20, Q30 and GC and the sequence repeat levels were calculated to assess the quality of the sequencing data. The clean reads were compared with the reference genome and information on the differences between the reads and the original after the sequencing was assembled to determine the source genes of these reads by HISAT2 software. Finally, RSEM software was used to obtain the number of reads of each transcript in each sample and convert them in FPKM (fragments per kilobase per million bases) to obtain the expression levels of genes. The DEGs (differentially expressed genes) were calculated and screened by DESeq2 software, and when |log2Fold Change| > 2 and p-adjust < 0.05, the genes were identified as the final differentially expressed genes. Referring to the FPKM value and the pathway map enriched by KEGG (Kyoto Encyclopedia of Genes and Genomes) and GO (Gene Ontology), the genes related to the ROS metabolism pathway were thoroughly analyzed to obtain the differentially expressed genes upstream and downstream [24].

2.4. Real-Time Quantitative PCR Expression Analysis

The RNA preparation and cDNA synthesis were performed in the same way as transcriptome sequencing. Primers were designed according to the DEG sequences, and the gene information and primers are shown in Table 1. The reaction system was 1 μL cDNA (500 ng/μL), 0.5 μL each of upstream and downstream primers (0.2 μmol/mL), 10 μL 2× SYBR Green Pro Taq HS Premix and 8 μL DDH2O, for a total reaction volume of 20 μL. The specific reaction conditions were: predenaturation at 95 °C for 10 s, after denaturation at 95 °C for 10 s, annealing for 10 s and extension at 72 °C for 10 s; a total of 40 cycles were performed. A Light Cycler 96 SW 1.1 (Roch, Switzerland) was used for real-time quantitative PCR. The reference gene was β-actin, and the number of repeats was n = 3. The reaction specificity was determined according to the melting curve, and the CQ (cycle threshold) value of each sample was obtained. The relative expression level of the target gene was calculated by the 2−ΔΔCt method [25,26].

2.5. Determination of MDA Content

MDA determination referred to the method of Hodges et al. [27].

2.6. The Superoxide Anion(O2) and Hydrogen Peroxide (H2O2) Content Assay

The O2 content was determined according to Wang and Luo [28]. The H2O2 content was estimated by forming a titanium–hydroperoxide complex according to Prochazkova et al. [29] with modifications.

2.7. Enzyme Extraction

All enzyme extracts were conducted by homogenizing 0.3 g of frozen colonies in a mortar on ice, using the following extraction media: 10 mL of 50 mmol/L phosphate buffer (pH 7.8) for SOD and POD and 10 mL of 50 mM phosphate buffer (pH 7.5) containing 5 mmol/L dithiothreitol (DTT) and 2% PVPP (w/v) for CAT. The extracts were then centrifuged at 12,000× g for 20 min at 4 °C. The supernatants were used for enzyme assays.

2.8. Enzymatic Activity Assays

SOD activity was assayed by the method of Rao et al. [30] with modifications. CAT activity was assayed according to Wang et al. [31] with modifications. POD activity was assayed colorimetrically with guaiacol as the hydrogen donor according to the method of Venisse et al. [32] with modifications.

2.9. Histochemical Detection of ROS

O2 was visually detected by using the NBT (Nitro-blue tetrazolium chloride, Amresco, Dallas, TX, USA) staining method [33]. The pictures were taken with a Nikon D750 digital camera. The images were counted and analyzed by using Image Pro Plus 6.0, and the relative content of O2 was quantified by the ratio of integrated optical density (IOD) to the total colony area. H2O2 was visually detected by DAB (3,3′-diaminobenzidine; Sigma, St. Louis, MO, USA) staining as described previously [34]. The pictures were taken and treated by using the same method as in the case of O2.

2.10. Statistical Analysis

All statistical analyses were performed by the GraphPad Prism9.0 analysis module. All the data were presented as the mean ± SD, and the significance of treatments were analyzed by the one-way ANOVA and Tukey’s multiple comparisons test. A p-value less than 0.05 was considered statistically significant. The graphs were generated by GraphPad Prism9.0.

3. Results

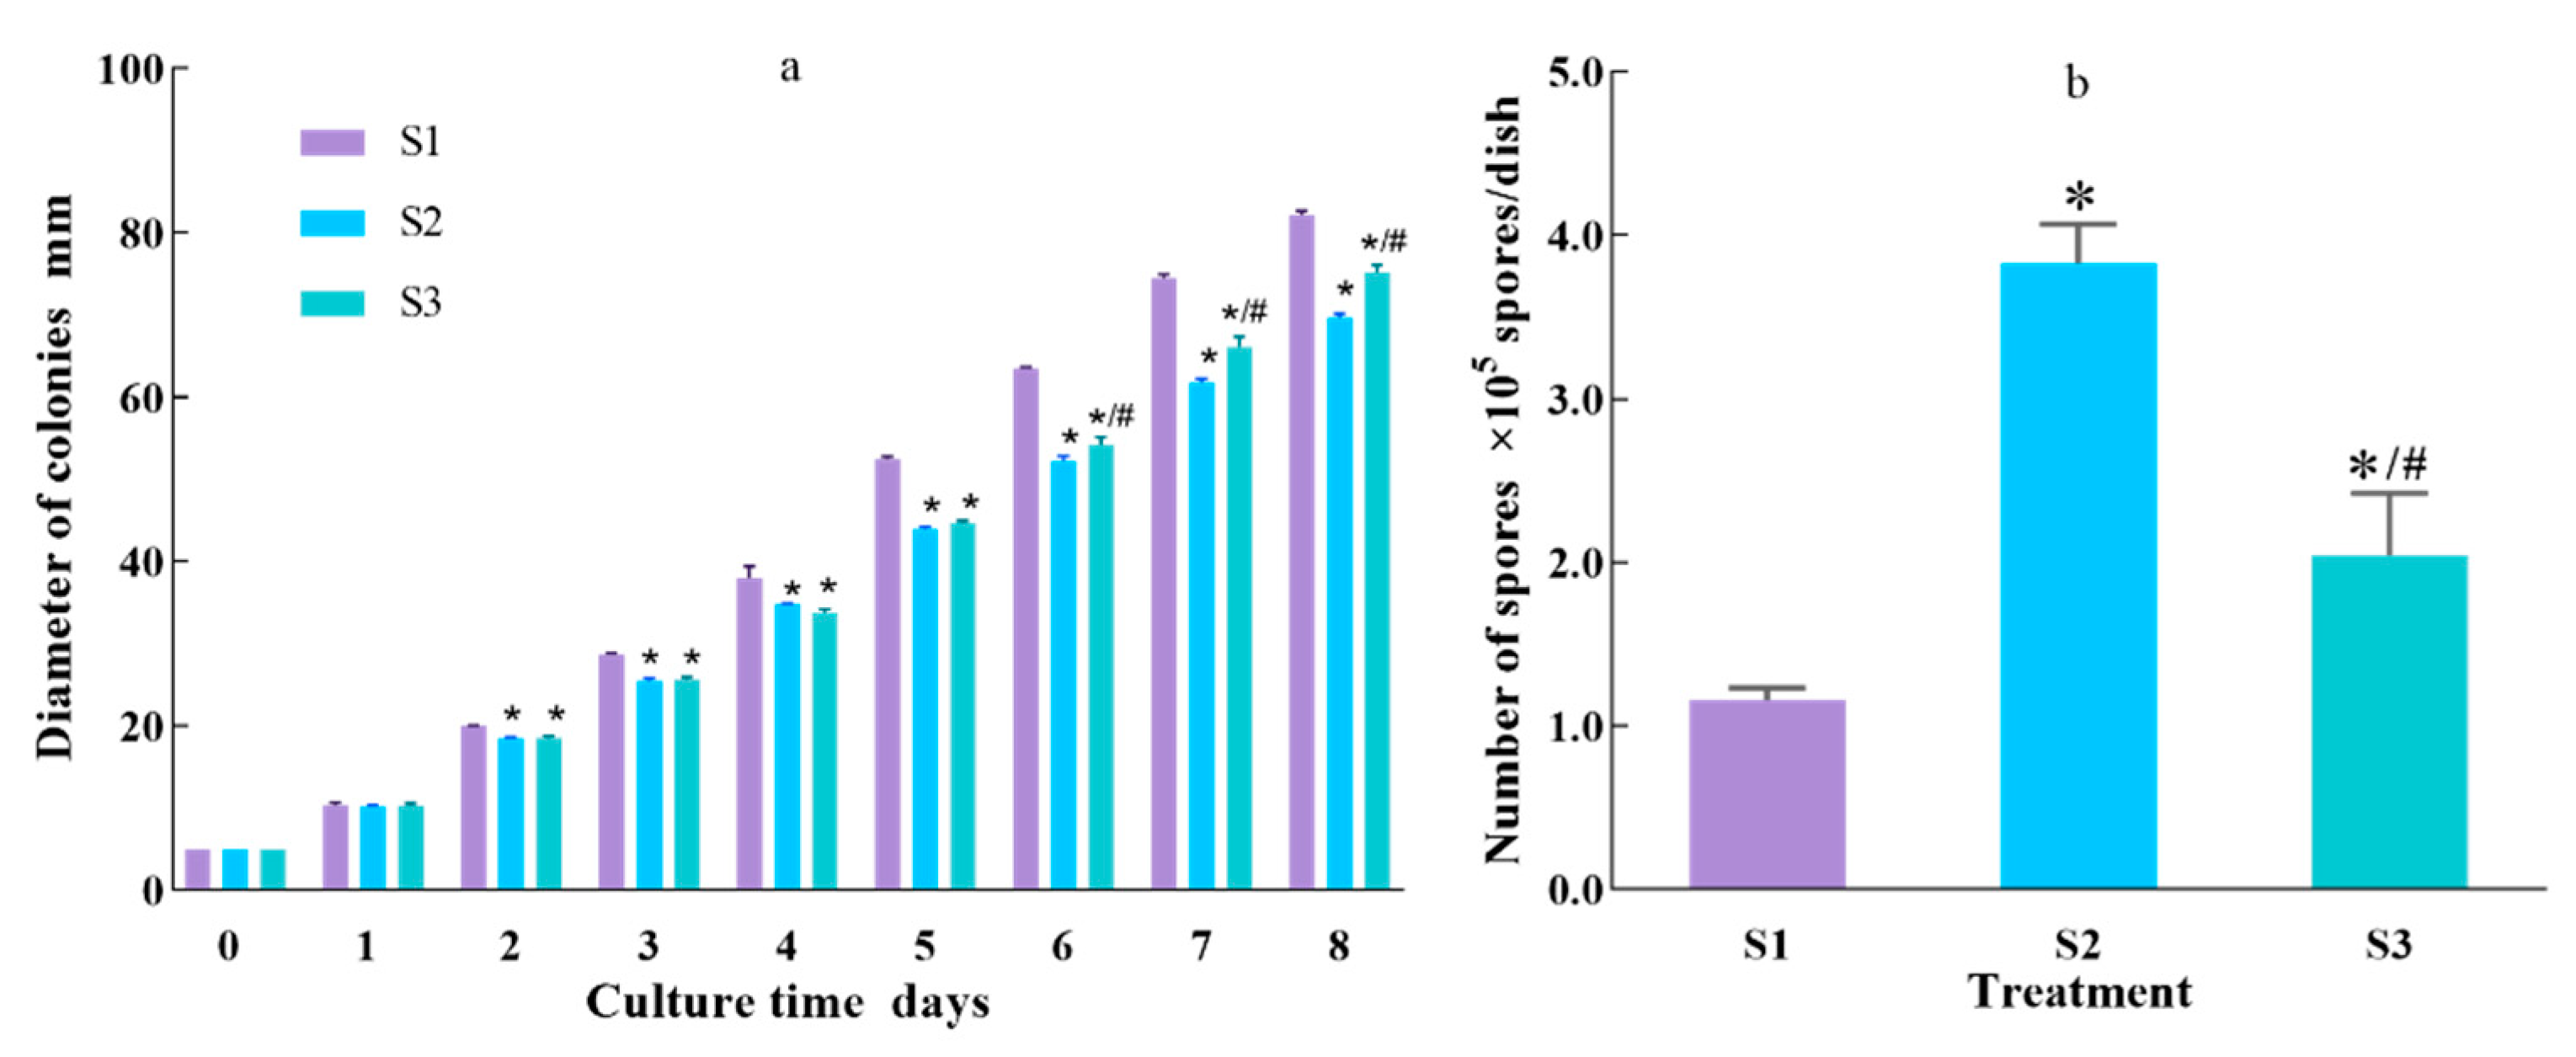
3.1. Colony Growth and Spore Number

Figure 1a shows the colony growth of S1, S2 and S3 within 8 days. On the 8th day, the colony diameter of S1 was the largest, 15.22% and 8.47% larger than S2 and S3, respectively; S2 was 7.97% smaller than S3, and the differences between the three colonies were significant.
Within 8 days, the growth rates of S1, S2 and S3 were 9.65 mm d−1, 8.08 mm d−1 and 8.78 mm d−1, respectively. The growth rate of S2 was 19.43% lower than that of S1. From day 0 to 4, the growth rate of S1 was 8.24 mm d−1, which was significantly higher than that of S2 and S3 at 7.45 mm d−1 and 7.22 mm d−1, respectively, with these being practically the same. From day 5 to 8, after adding H2O2, the growth rate of S3 reached 10.34 mm d−1, which was significantly higher than that of S2 (8.72 mm d−1) and close to S1 (11.06 mm d−1). From the 5th day, the growth rate of S3 accelerated. On the 6th day, the diameter of S3 was significantly larger than that of S2, and the significant difference continued until the end of observation.
At the 8th day of culture, the number of spores of F. solani isolate were detected. The S1, S2 and S3 treatments produced macroconidia but the number of microconidia was low and chlamydospore was not observed. As shown Figure 1b, the macroconidia number of S1, S2 and S3 were 1.16 ± 0.08 × 10⁵, 3.83 ± 0.24 × 10⁵ and 2.05 ± 0.38 × 10⁵ spores per dish, respectively. Compared to S1, the macroconidia numbers of S2 and S3 were significantly higher, 231.03% and 76.92% higher, respectively. Compared with S3, the macroconidia number of S2 was 87.10% higher, with a significant upward trend.

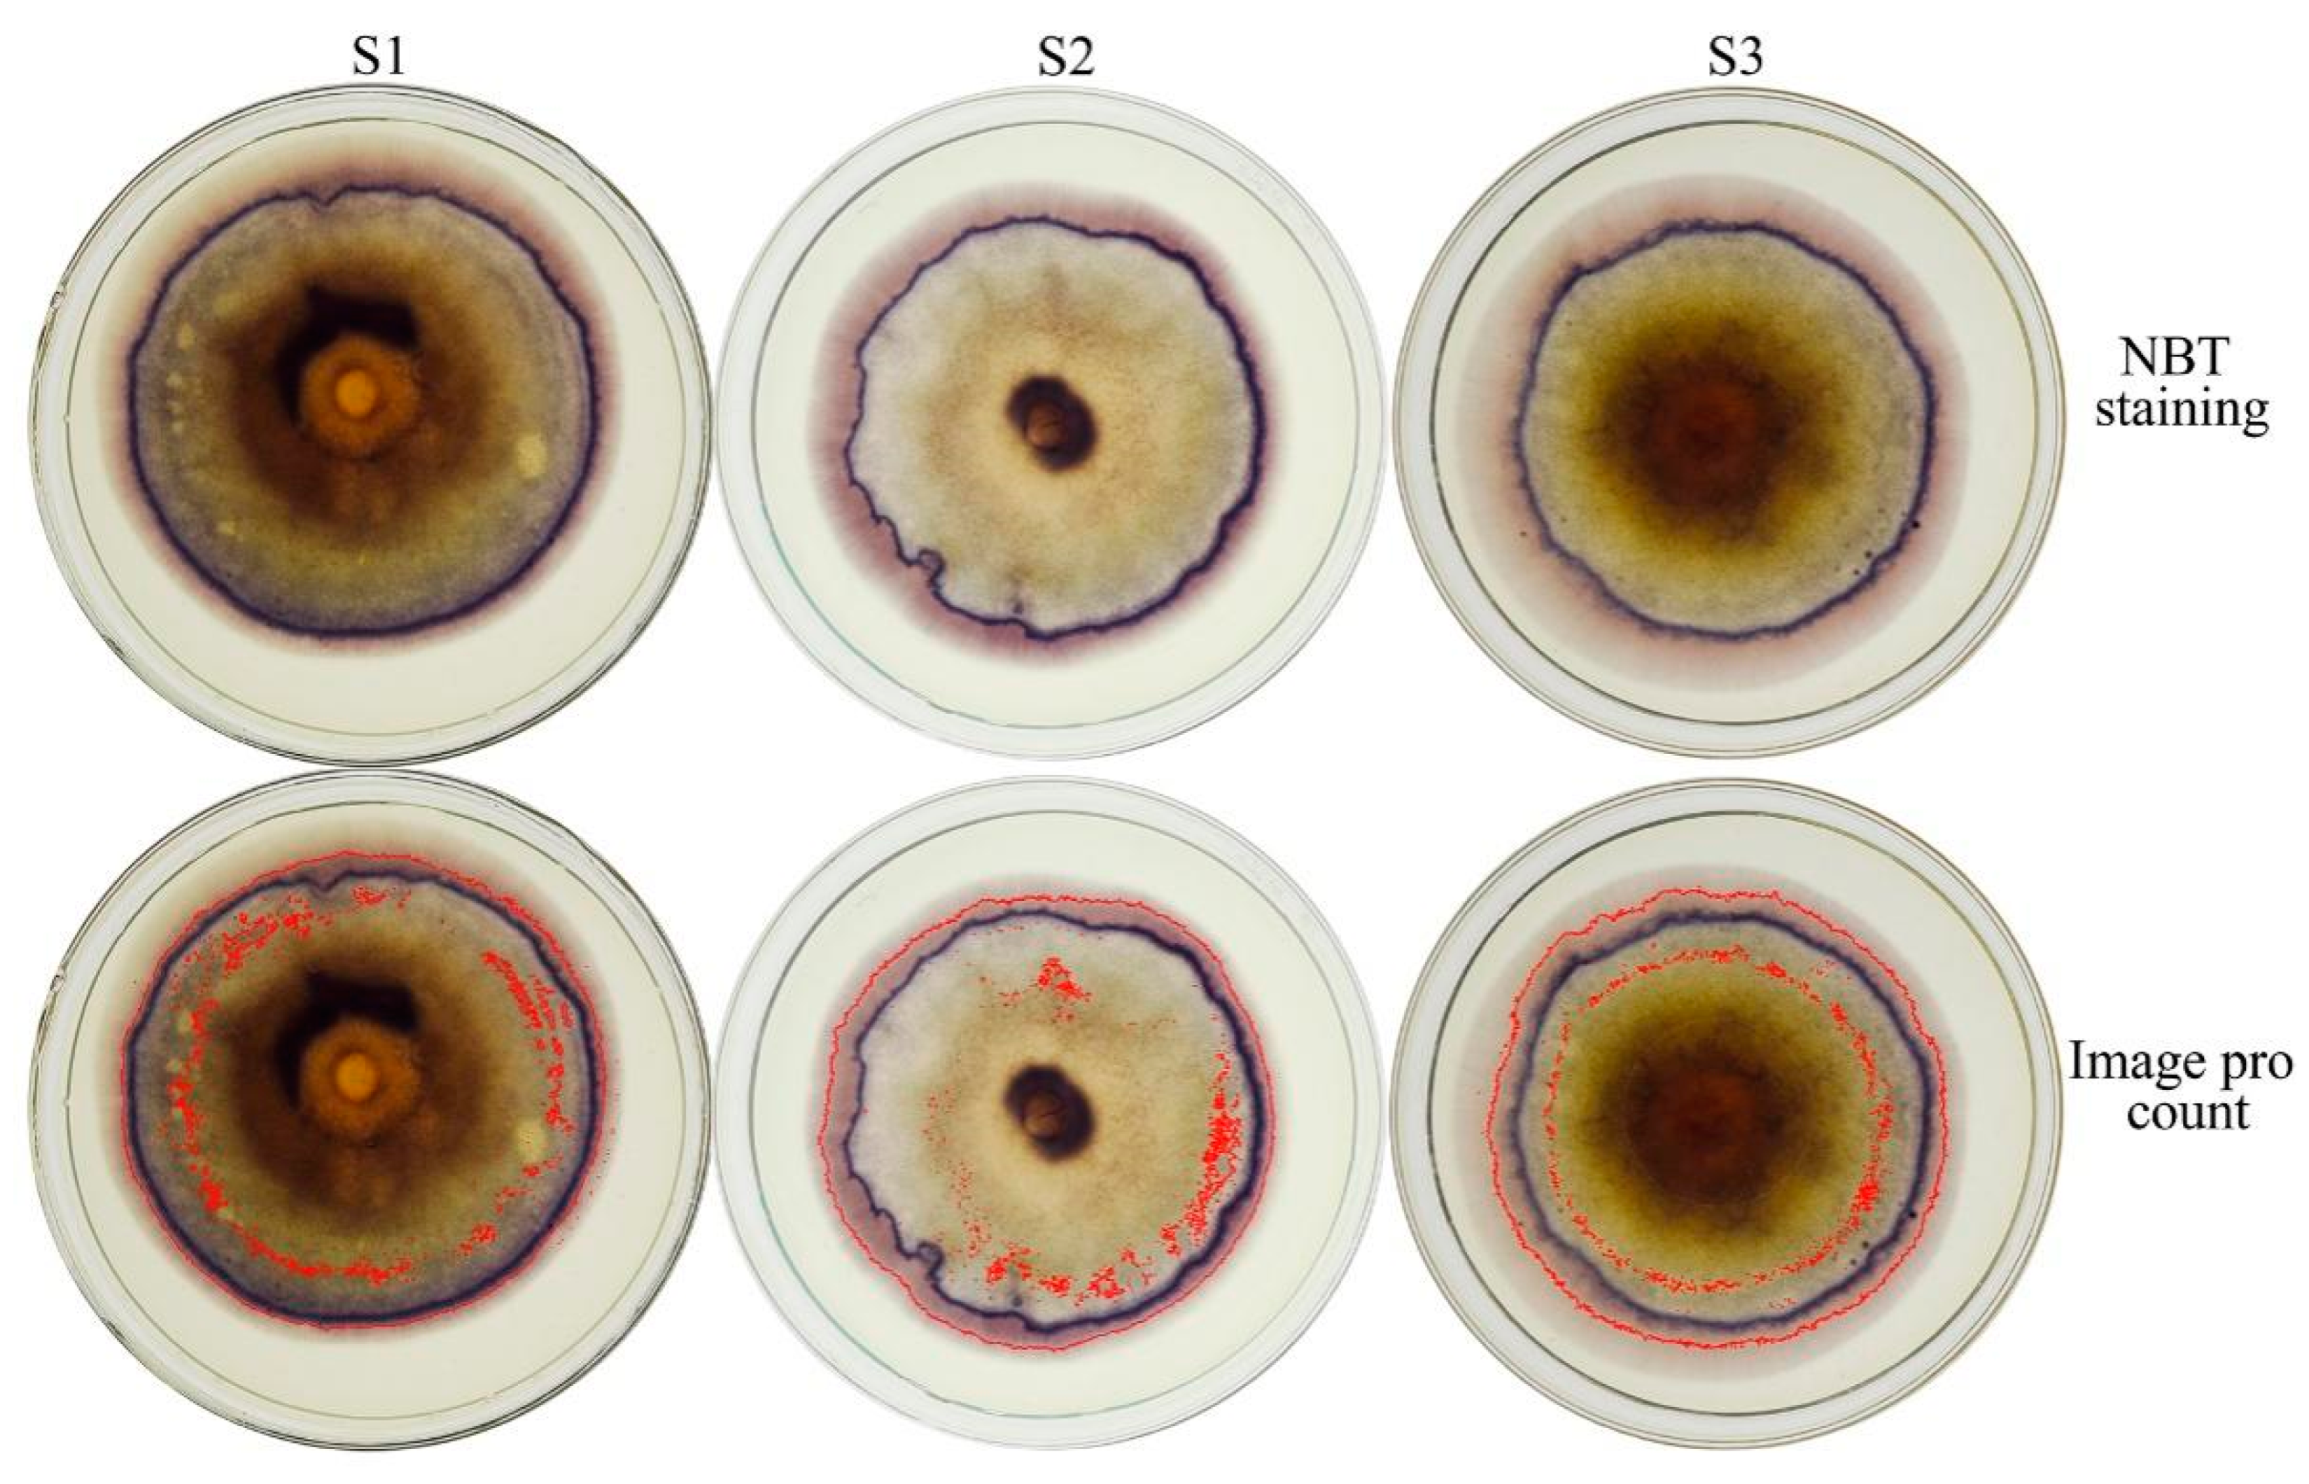
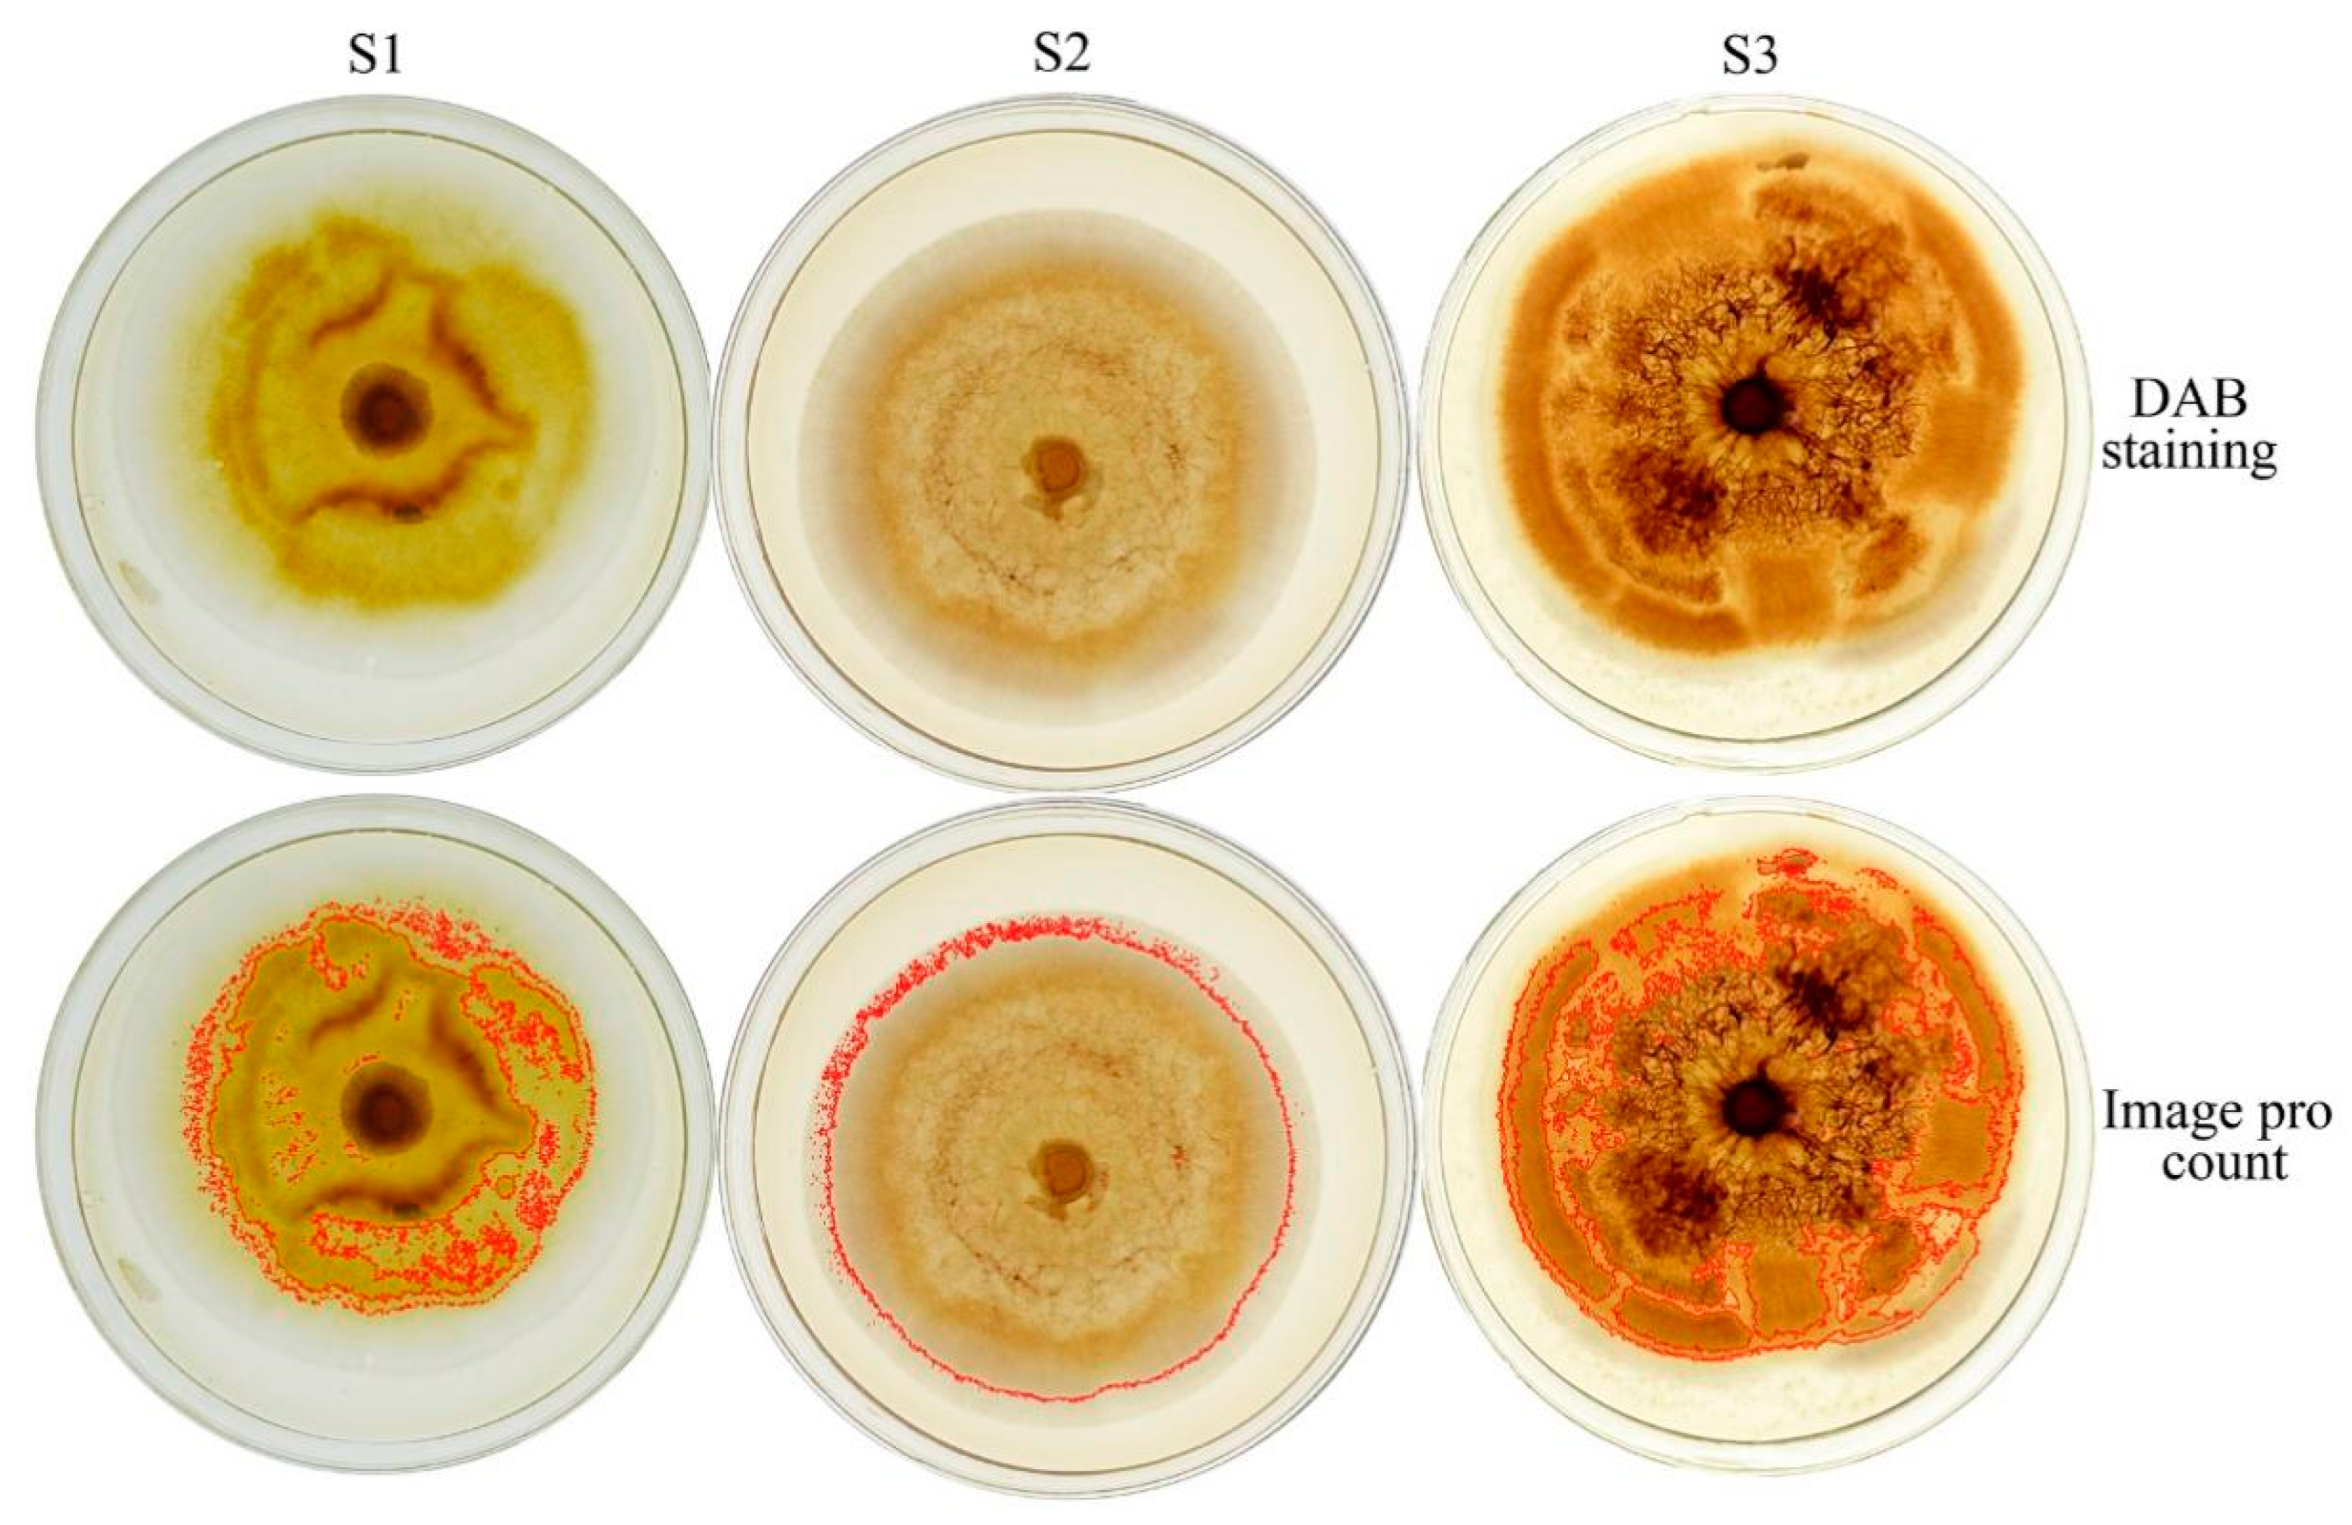
3.2. Colony Histochemical Detection of ROS

As shown in Figure 2, the three treatments produced O2, and the edge colonies were particularly rich. The counting results of the Image-Pro software showed that the IOD/area values of S1, S2 and S3 were 0.086 a.u., 0.056 a.u. and 0.078 a.u., respectively, and the O2 production decreased by 34.88% after NADPH was inhibited, with it recovering after the addition of 0.0012% H2O2, as shown in S3.
As shown in Figure 3, the three colony treatments produced H2O2, which was distributed at 1/3 from the outer edge of the colonies. The counting results showed that the IOD/area value was 0.165 a.u., 0.193 a.u. and 0.285 a.u. for S1, S2 and S3, respectively.

3.3. mRNA Expression of NCF2, SOD1, CTA1 and PXMP4

As shown in Figure 4, the expression of key genes in the ROS metabolic pathway such as NCF2, SOD1, CTA1 and PXMP4 was greatly affected after treatment, and the results were verified by RT-qPCR.
The FPKM value of the NCF2 gene in S2 was 49.95 ± 4.87, which was 25.34% lower than that of S1. The FPKM value of S3 increased significantly, with it being 153.23% higher than that of S1 and 239.16% higher than that of S2 (Figure 4a). The RT-qPCR results showed that variation trend was similar to that shown in Figure 4a. The relative expression value of S3 was 8.90 ± 0.55, which was 7.86 times higher than that of S1 and 15.33 times higher than that of S2. (Figure 4b).
The FPKM value of the SOD1 gene in S2 was as low as 195.44 ± 28.10, 21.42% lower than that of S1, but the difference was not significant (p = 0.766); the S3 FPKM value increased to 343.98 ± 116.59, with this increasing by 38.31% and 76.00% compared with the S1 and S2 values, respectively (Figure 4c). The relative value of S2 significantly decreased to 0.49 ± 0.05 (p = 0.043), 53.22% lower than that of S1. The S3 relative expression value increased to 3.65 ± 0.47, 2.48 and 6.45 times higher that than S1 and S2, respectively (Figure 4d).
The FPKM values of the CTA1 gene in S1, S2 and S3 were 28.67 ± 0.52, 11.43 ± 0.33, and 15.66 ± 3.95, respectively. The FPKM value in S2 was significantly low (p = 0.010) compared with S1. The same value in S3 was 26.99% higher than that of S2 (Figure 4e). Furthermore, the trend of the relative expression value was similar to that of the FPKM value. The relative expression values of S1 and S2 were 0.20 ± 0.11 and 1.28 ± 0.20, respectively. The S2 was significantly lower than S1. The S3 relative expression value was 0.57 ± 0.14, with this being a significant increase, 65.42% (p = 0.004), compared with S2 (Figure 4f).
The FPKM value of the PXMP4 gene in S3 was the highest among the three treatments, reaching 139.07 ± 1.97, with this being 38.90% (p = 0.007) higher and 88.13% (p = 0.001) higher than S1 (100.13 ± 12.12) and S2 (73.93 ± 9.72), respectively (Figure 4g). The change in the trend between the relative expression value and the FPKM value of the PXMP4 gene were practically the same. S3 was the highest among the three treatments, reaching 1.28 ± 0.14, which was significantly higher, 86.87%, than S2 (Figure 4h).

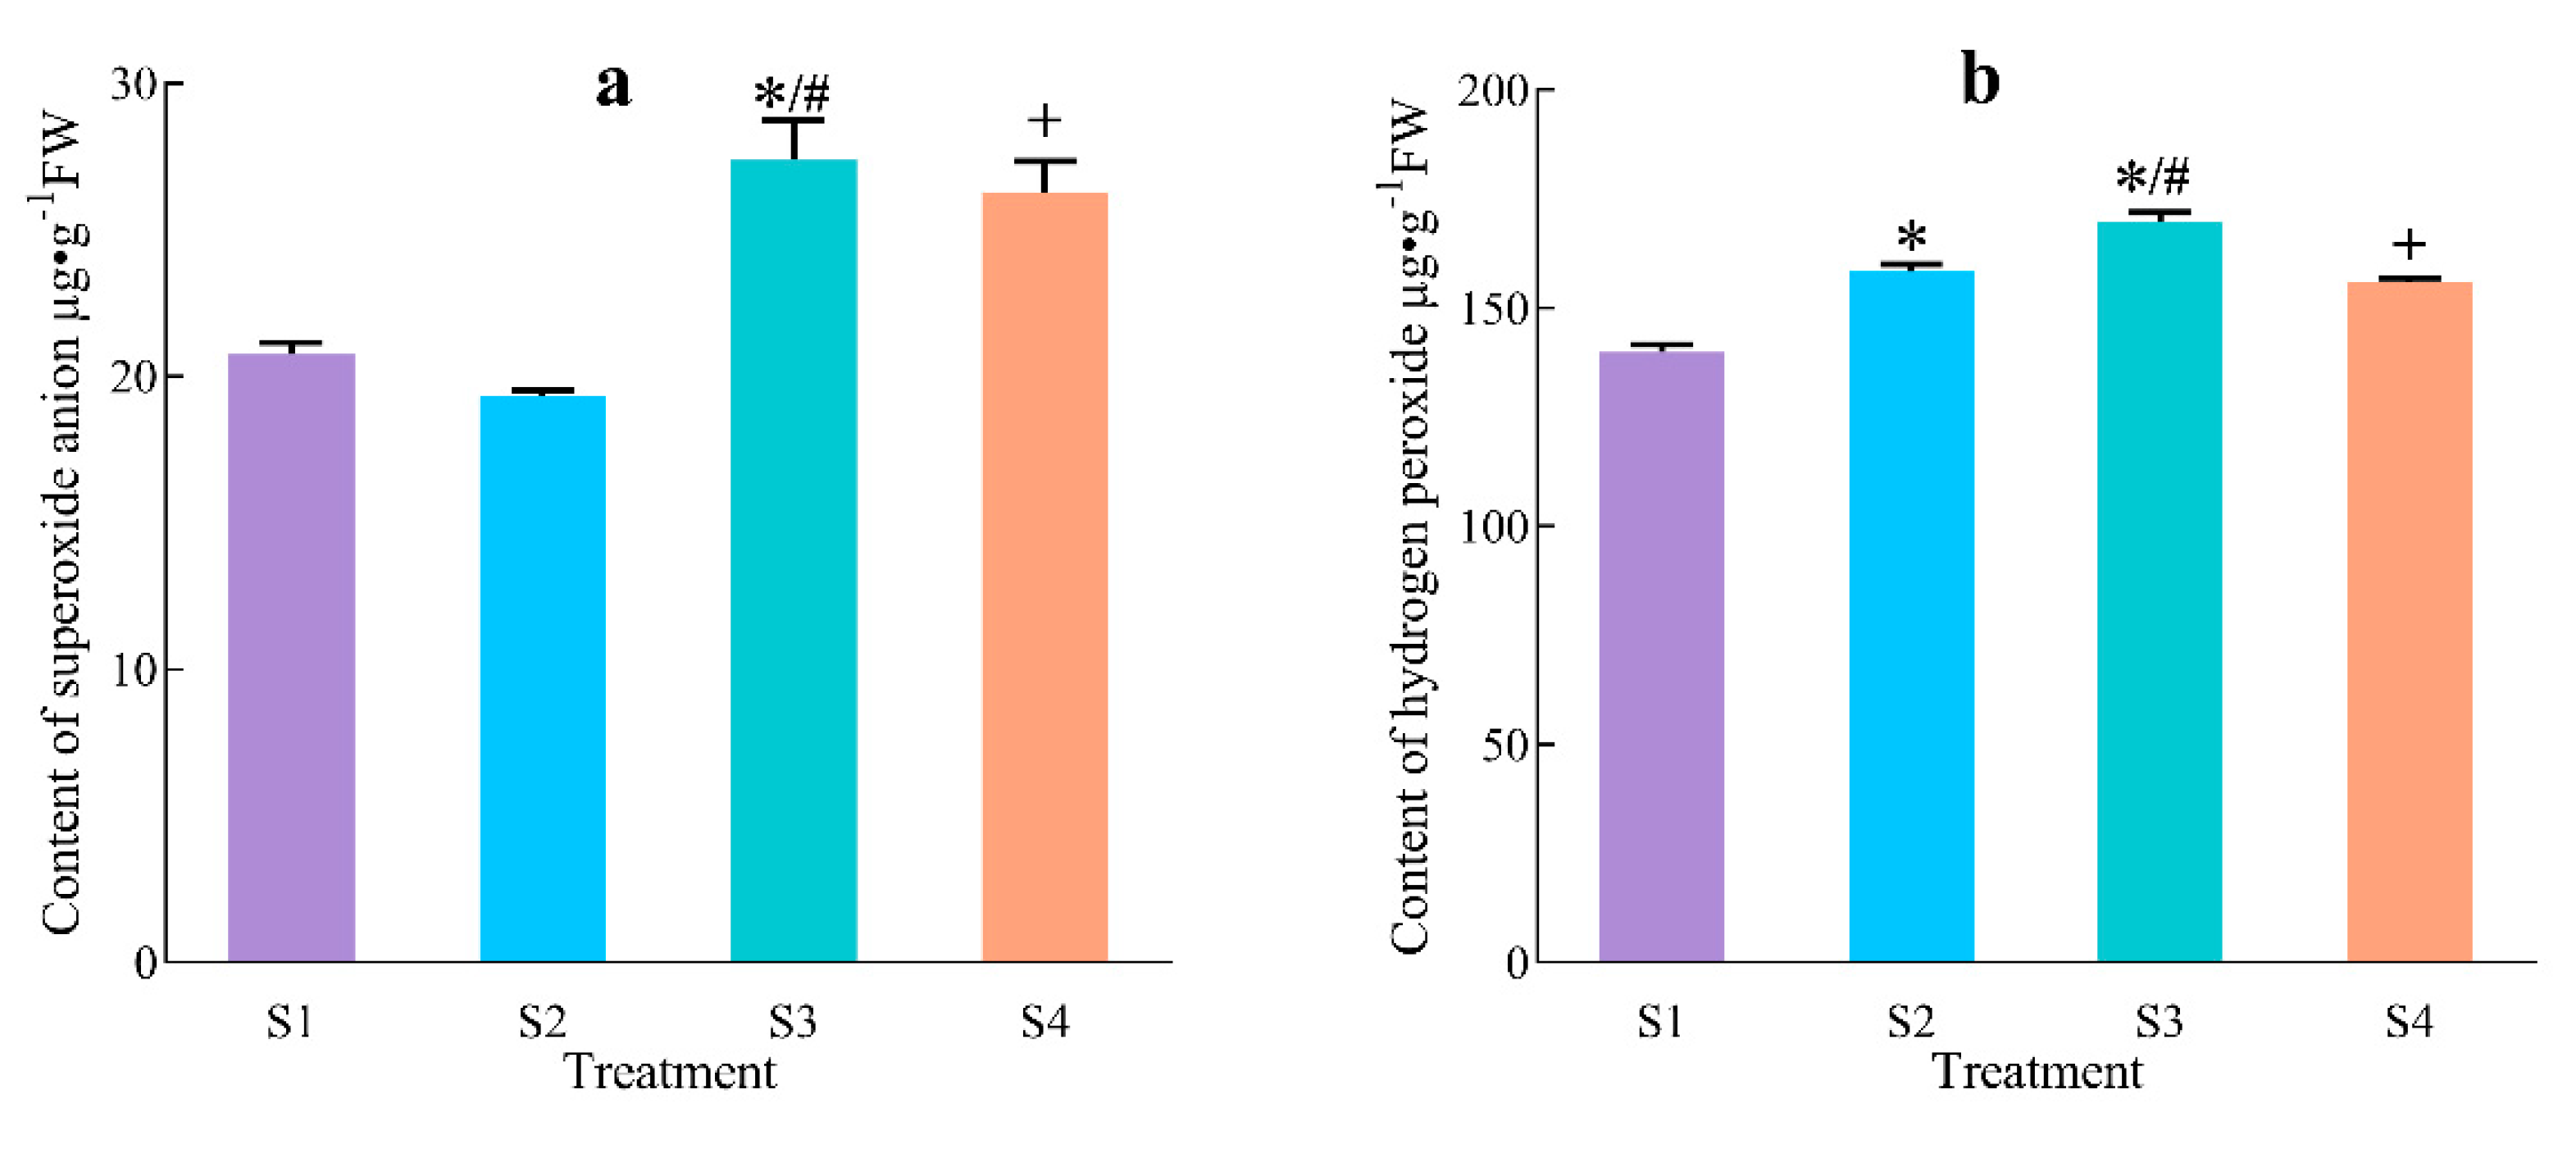
3.4. Colony ROS Level

As shown in Figure 5, the concentrations of O2 and H2O2 in four treatments were measured.
Figure 5a shows the change in O2 content in the colonies. The contents of S1, S2, S3 and S4 were 20.75 ± 0.41 µg g−1FW, 19.35 ± 0.18 µg g−1FW, 27.39 ± 1.34 µg g−1FW and 26.28 ± 1.07 µg g−1FW, respectively. The O2 content increased significantly after the addition of 0.0012% H2O2. Compared with S2, the O2 contents of S3 and S4 increased 5.53 µg g−1FW and 8.04 µg g−1FW, respectively.
As shown in Figure 5b, the H2O2 contents of S1, S2, S3 and S4 were 139.96 ± 1.71 µg g−1FW,158.39 ± 1.64 µg g−1FW, 169.84 ± 2.09 µg g−1FW and 156.01 ± 0.87 µg g−1FW, respectively. Compared with S1, the H2O2 content of S4 increased 16.05 µg g−1FW. Compared with S2, the H2O2 content of S3 increased 11.45 µg g−1FW, and the increment was less than that without inhibitor.

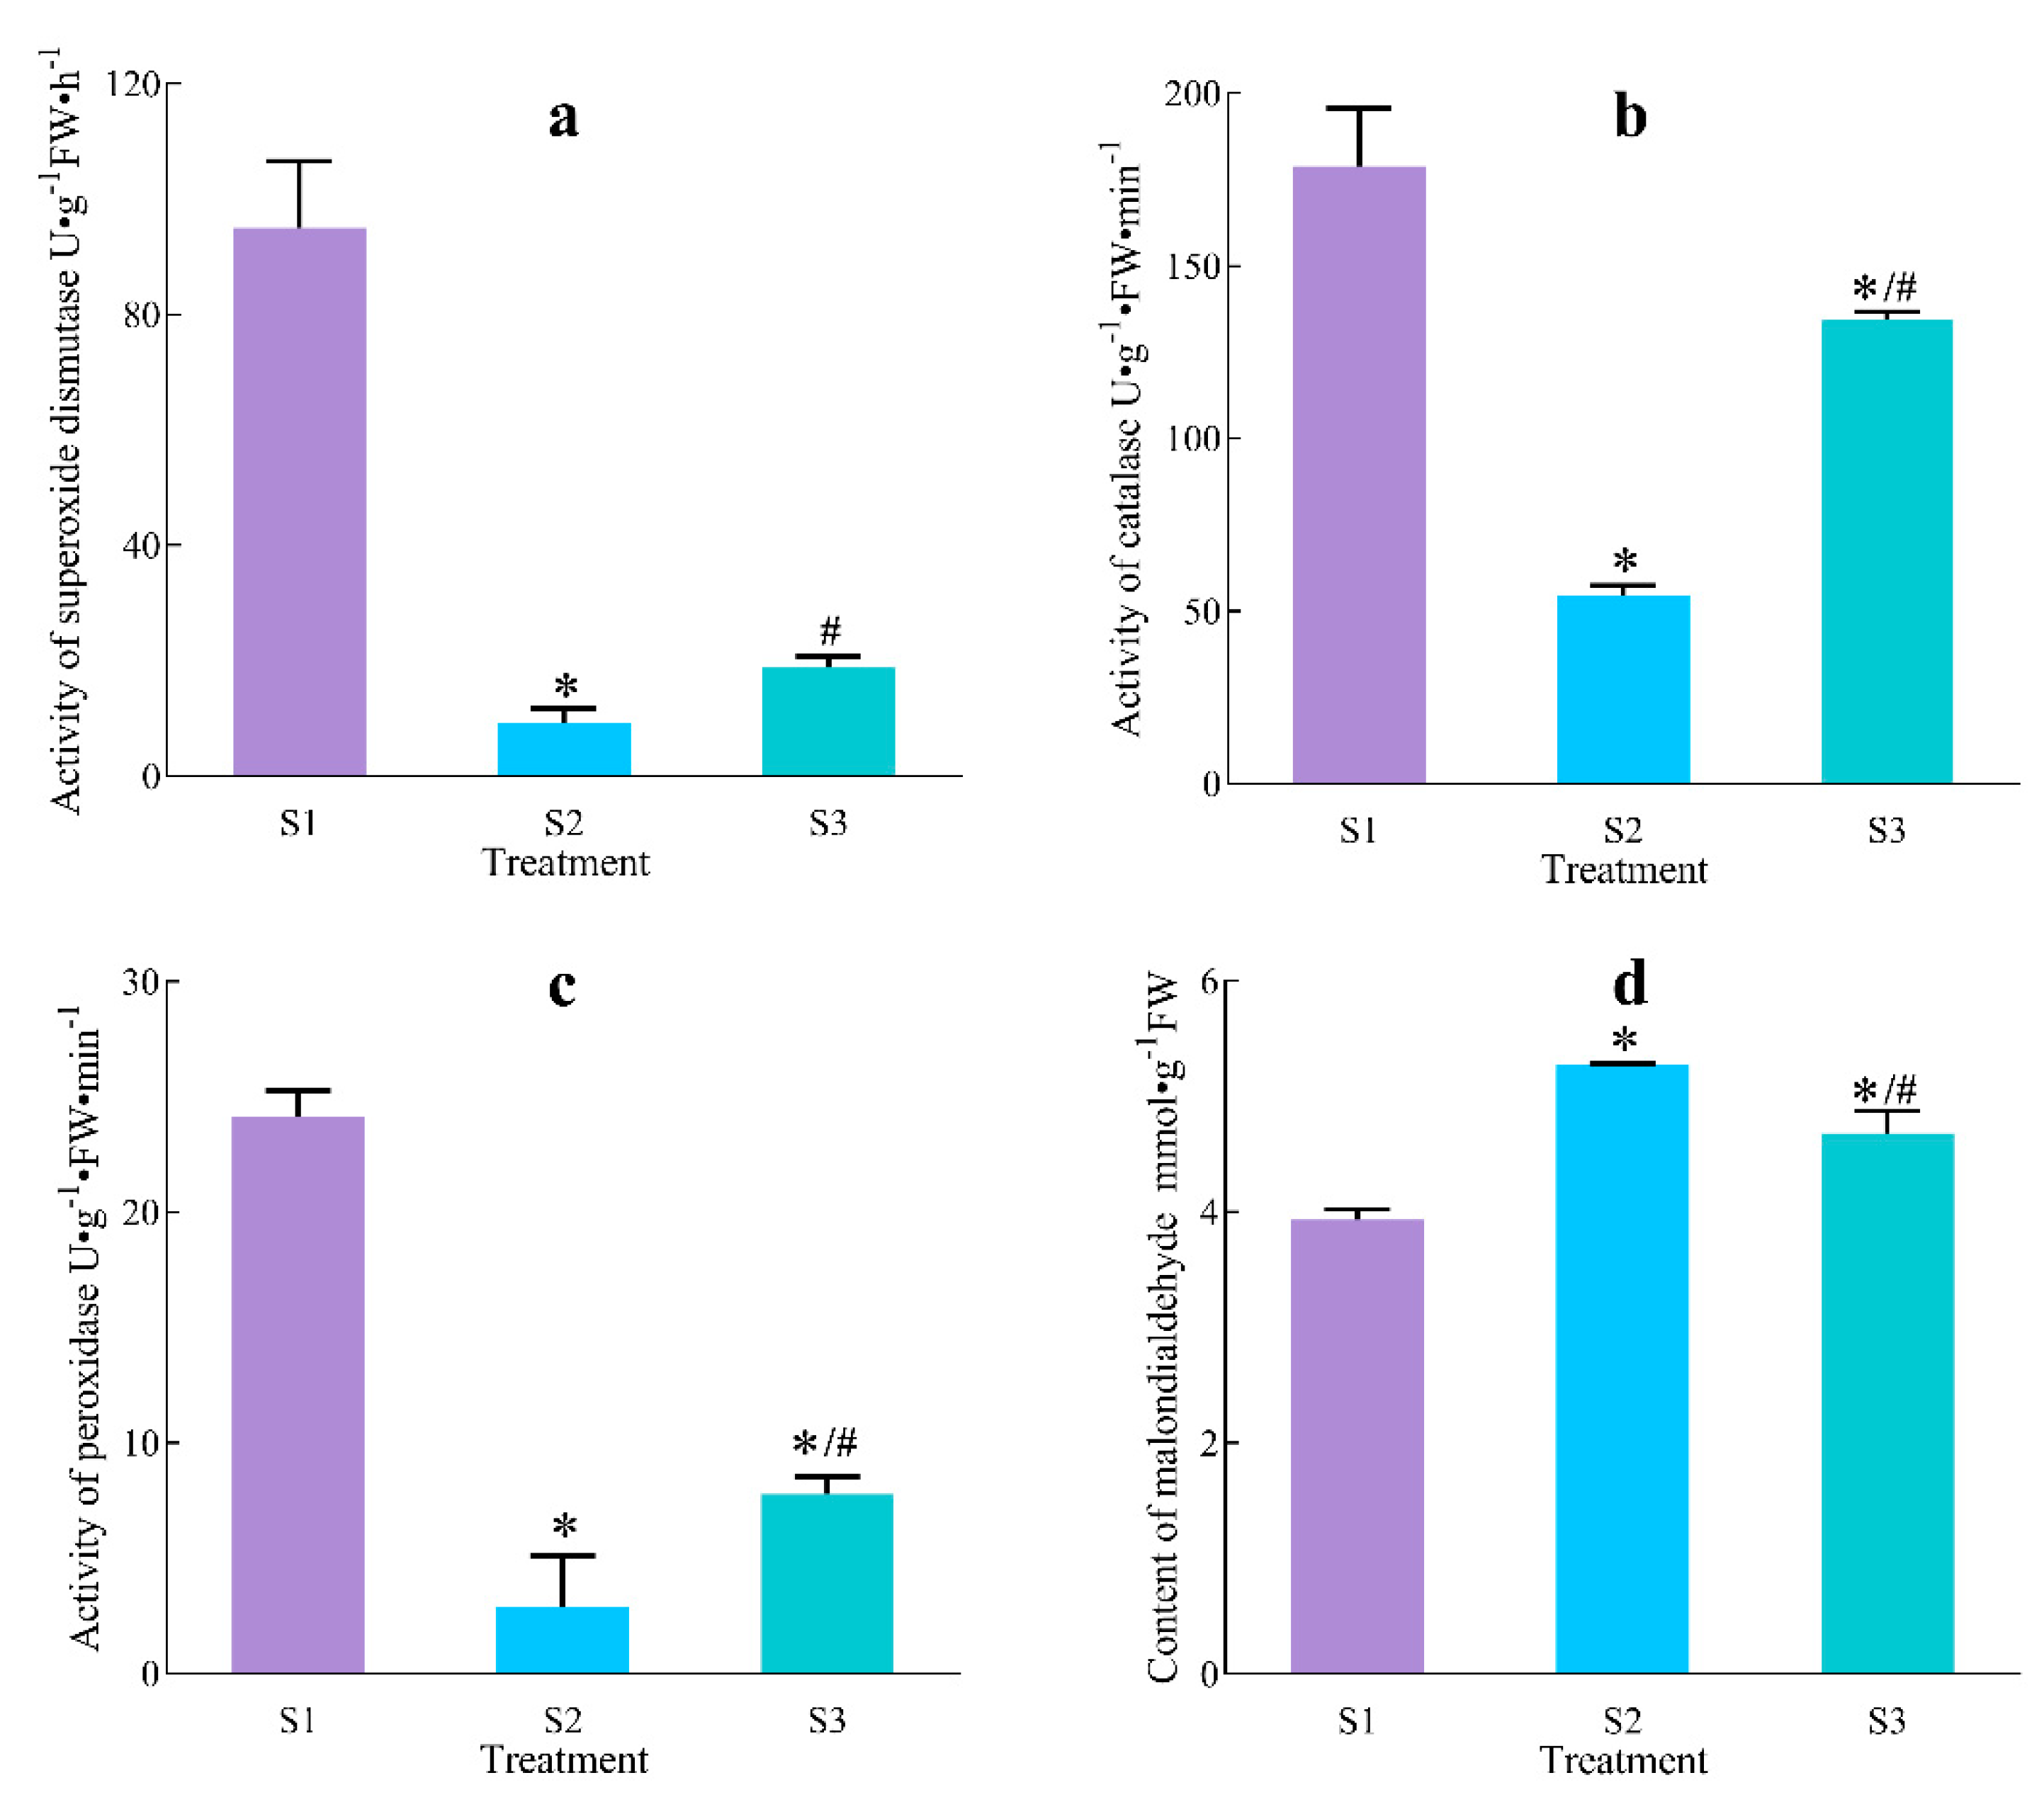
3.5. Colony Oxidant–Antioxidant Level

As shown in Figure 6, the activities of antioxidant enzymes such as SOD, CAT and POD and the MDA content, which indicates the level of cell membrane oxidation in the F. solani colony, were detected.
The SOD activities of S1, S2 and S3 were 95.04 ± 11.53 U g−1FW h−1, 9.13 ± 1.68 U g−1FW h−1 and 18.79 ± 1.52 U g−1FW h−1, respectively. Compared with S1, the SOD activities of S2 and S3 90.39% and 80.23% lower, respectively. Compared with S3, the SOD activity of S2 51.43% higher, but the upward trend was not significant (p = 0.53) (Figure 6a).
Compared with S1, the CAT activities of S2 and S3 were 69.51% and 24.91% lower, respectively. S3 was 59.40% higher than S2, with a significant upward trend (Figure 6b).
Compared with S1, the POD activities of S2 and S3 were 88.05% and 67.68% lower, respectively. Compared with S3, the POD activity of S2 was 63.02% higher (Figure 6c).
The change in trend in terms of MDA content in the colonies varied from that of the antioxidant enzymes such as SOD, CAT and POD. The MDA contents of S1, S2 and S3 were 3.93 ± 0.13 µg g−1FW, 5.28 ± 0.02 µg g−1FW and 4.68 ± 0.19 µg g−1FW, respectively. Compared with S1, the MDA contents of S2 and S3 were 27.73% and 10.19% higher, respectively. Compared with S2, the MDA content of S3 was 11.48% lower, with a significant downward trend (Figure 6d).

4. Discussion

As the most important enzyme in the ROS production system and the key enzyme of redox signals in eukaryotic cells, NADPH oxidase is specially located on the cell membrane [8,9,35]. NADPH oxidase is composed of multiple subunits. p47phox subunit are phosphorylated to form cytoplasmic complexes when the cells are stimulated, before being adsorbed to the cell membrane and then combining with the two membrane structures to assemble into the NADPH complex to produce O2 [11]. Subsequently, the O2 is decomposed into H2O2 under the action of iron-sulfur protein, and O2 as well as H2O2 are important ROS types.
ROS play a dual role in organisms, not only as by-products of cellular aerobic metabolism, cause cellular peroxidation [36,37], but also as signal molecules in cells to regulate cell proliferation and differentiation [38]. The content of ROS produced in the interaction process is related to the pathogenicity of fungi [5]. The pathogens may successfully infect and form interaction combinations or may fail and form plant immunity [39]. Therefore, changing the ROS content of a colony may convert the pathogenicity of the strain [6] and may affect the growth and macroconidia number of the isolate, as shown in this study. The addition of the NADPH oxidase inhibitor DPI can effectively reduce the extracellular O2 concentration of the marine diatom Thalassiosira oceanica and reduce the efficiency of PSII [40]. The knockout of key NADPH oxidase genes such as Nox1 and Nox2 in pathogenic bacteria can block the production of O2 and affect colony growth and expansion [41,42]. In this study, DPI was added to PDA medium, and, as a result, the O2 content of the F. solani decreased by 34.88% and 7.24%, respectively, as determined by NBT staining and the hydroxylamine hydrochloride method. The results of transcriptome sequencing and RT-qPCR showed that the mRNA expression of the NCF2 (p67phox) gene was inhibited, with the expression decreasing by 25.34% and 84.40%, respectively. Furthermore, the growth rate decreased by 19.43%, which indicates that by reducing O2 produced by colonies, NADPH oxidase can effectively inhibit colony growth, which is largely consistent with previous studies. The H2O2 content in the colonies was determined by the titanium sulfate precipitation method and DAB chemical staining after inhibition by DPI. The H2O2 content in the colonies did not decrease as reported above but increased by 13.17% and 16.97%, respectively, reaching a significant level in this study, which is inconsistent with most previous research results and was most likely due to the addition of DPI significantly inhibiting the gene expression and activities of antioxidant enzymes such as SOD, CAT and POD as well as greatly reducing the metabolic capability of H2O2, thus leading to the increase in H2O2 content. However, Libik-Konieczny et.al showed that adding DPI to the isolated vascular bundles of Mesembryanthemum crystallinum inhibited the activity of NADPH oxidase and reduced the H2O2 content [43], which is consistent with the results of this study. At the same time, the MDA content increased by 27.33% after the activity of NADPH oxidase was inhibited, resulting in higher values compared to the S1 treatment. Meanwhile, the oxidative stress on the cell membrane was intensified, which confirmed that the H2O2 content increased.
There are several enzymes that regulate the ROS balance and redox signals in organisms, such as NADPH oxidase, SOD, CAT, PRX and GPX [44,45], which can maintain the ROS content at a nontoxic level in cells [36]. When trying to break the balance between the production and clearance of reactive oxygen species, ROS-mediated redox reactions are usually initiated [46] to affect life processes. In this study, DPI inhibited the production of ROS, disrupted the redox balance of F. solani colonies and seriously affected the growth of the colonies. Previous studies have shown that DPI pretreatment of wild-type Arabidopsis or knockout of the atrbohD/F gene can reduce the activities of key enzymes, such as SOD, CAT, APX and GR, under salt stress, leading to a decline in long-term salt resistance [47]. Regarding the interaction between the pathogen F. thiocyanum and potato tubers, the activity of potato NADPH oxidase increased, the production rate of O2 increased significantly and the activities of CAT, POD, SOD, GR and APX rose steadily [48]. In this study, the relative expression of ROS metabolism and key genes such as NCF2, SOD1, CTA1 and PXMP4 decreased, which is consistent with previous research, confirming that the NADPH oxidase inhibitor DPI affected the activity of key ROS metabolism enzymes and the relative expression of genes.
In this study, H2O2 was added to F. solani colonies, and NADPH oxidase was inhibited by DPI. The O2 concentration increased to a high level, NCF2 gene expression increased dramatically and the colony growth rate recovered, with these results being the same as those for Arabidopsis under salt stress. It was established that the H2O2 produced by NADPH oxidase under salt stress at the inception phase was likely used as a signal substance to trigger the antioxidant response of Arabidopsis, activate the activities of antioxidant enzymes such as CAT, APX and GR and reduce the damage caused by salt stress [47]. Meanwhile, the H2O2 concentration increased when exogenous H2O2 was added to the normal cultured colony (S4) and displayed higher values compared to the inhibition treatment, indicating that the colonies inhibited by NADPH oxidase could utilize more exogenous H2O2 and that supplementation with exogenous H2O2 could significantly reduce the MDA content in the colonies to alleviate the oxidative stress of the colonies’ cell membranes. In F. solani, H2O2 is the key growth signal substance that can reverse regulate O2.
There are some problems that need to be further researched arising from this study. First, the DPI inhibited the production of O2 by NADPH oxidase, but the O2 content only decreased by 7.24%, a nonsignificant level, indicating that there are still other ways to produce O2 in F. solani. The most likely reason for this is that DPI is a noncompetitive inhibitor of NADPH oxidase and only reacts with reducible NADPH oxidase [49], so other ROS production pathways and their physiological functions in F. solani need to be further studied. In addition, comparing the transcriptome sequencing of the three treatments, the expression of genes related to cytochrome P450 such as cyp12, af510 and gsfF-1 were strongly inhibited, and their mechanism and relationship with ROS metabolism also need to be studied.

5. Conclusions

The addition of DPI and H2O2 can change the level of ROS in colonies, regulate the expression of NCF2 and its downstream genes SOD1, CTA1 and PXMP4 and change the activities of key metabolic enzymes such as SOD, CAT and POD and the level of MDA to change the degree of cell membrane oxidation and affect the growth of F. solani (Figure 7). In conclusion, the results provide a scientific breakthrough for further exploration of the interaction mechanism of NADPH oxidase, key ROS metabolic enzymes and MDA during the growth of F. solani.

Author Contributions

Conceptualization, J.L. and L.F.; methodology, D.L. and J.Z.; software, D.L.; validation, X.L., Y.P. and J.H.; formal analysis, X.L.; writing—original draft preparation, J.L.; writing—review and editing, J.L.; visualization, D.L. and J.L.; supervision, J.L.; project administration, J.L. All authors have read and agreed to the published version of the manuscript.

Funding

This research was funded by the Gansu Natural Science Foundation of China (18JR3RA177) and the Gansu University Innovation Fund Project of China (2020A-055). The funders had no role in the study design, data collection and analysis, decision to publish or preparation of the manuscript.

Institutional Review Board Statement

Not applicable.

Informed Consent Statement

Not applicable.

Data Availability Statement

We have uploaded the metadata spreadsheet, processed datafiles and raw datafiles to the GEO database and acquired the accession number GSE208534. We have created the reviewers link: https://www.ncbi.nlm.nih.gov/geo/query/acc.cgi?acc=GSE208534 (accessed on 19 July 2022).

Acknowledgments

The authors would like to acknowledge the technical support of Chengde Yang from the Plant Protection College of Gansu Agricultural University.

Conflicts of Interest

The authors declare no conflict of interest.

Abbreviations

APX: ascorbate peroxidase; CAT: catalase; DAB: 3,3′-diaminobenzidine; DPI: diphenyleneiodonium chloride; FPKM: fragments per kilobase of exon model per million mapped fragments; GPX: glutathione peroxidase; GR: glutathione reductase; MDA: malondialdehyde; NADPH: nicotinamide adenine dinucleotide phosphate; NBT: nitro-blue tetrazolium chloride; PDA: potato dextrose agar; POD: peroxidase; PRX: peroxiredoxin; ROS: reactive oxygen species; SOD: superoxide dismutase.

References

  1. Li, H.; Li, G.Y.; Fu, J.H. Identification of the causing agent of wolfberry root rot in Xinjiang. J. Plant Protect. 1998, 25, 253–257. [Google Scholar]
  2. Lu, Z.K.; Yang, J.N. Occurrence and control of wolfberry root rot. J. Plant Protect. 1994, 21, 249–254. [Google Scholar]
  3. Li, J.; Feng, L.D.; Wang, Y.K.; He, J.; Chen, X.R. Identification and biological characteristics of dominant pathogens of Lycium bararum root rot in Gansu Province. Arid Zone Res. 2017, 34, 1093–1100. [Google Scholar]
  4. Poljak, B.; Jamnik, P.; Raspor, P.; Miklós, P. Oxidation-Antioxidation-Reduction Processes in the Cell: Impacts of Environmental Pollution, 2nd ed.; Elsevier: Amsterdam, The Netherlands, 2019; pp. 831–837. [Google Scholar]
  5. Taheri, P.; Irannejad, A.; Goldani, M.; Tarighi, S. Oxidative burst and enzymatic antioxidant systems in rice plants during interaction with Alternaria alternata. Eur. J. Plant Pathol. 2014, 140, 829–839. [Google Scholar] [CrossRef]
  6. Segmüller, N.; Kokkelink, L.; Giesbert, S.; Kan, J.V.; Tudzynski, P. NADPH oxidases are involved in differentiation and pathogenicity in Botrytis cinerea. Mol. Plant-Microbe Interact. 2008, 21, 808–819. [Google Scholar] [CrossRef] [PubMed] [Green Version]
  7. Magnani, F.; Nenci, S.; Fananas, E.M.; Ceccon, M.; Romero, E.; Fraaije, M.W. Crystal structures and atomic model of NADPH oxidase. Proc. Natl. Acad. Sci. USA 2017, 114, 6764–6769. [Google Scholar] [CrossRef] [Green Version]
  8. Babior, B.M.; Lambeth, J.D.; Nauseef, W. The Neutrophil NADPH Oxidase. Arch. Biochem. Biophys. 2002, 397, 342–344. [Google Scholar] [CrossRef]
  9. Rossi, D.C.P.; Gleason, J.E.; Sanchez, H.; Mcnees, C.; Schatzman, S.; Culbertson, E. 294—Candida albicans FRE8 encodes a member of the NADPH oxidase family that produces a burst of ROS during fungal morphogenesis. Free Radic. Biol. Med. 2017, 112, 194–195. [Google Scholar]
  10. Grissa, I.; Frédérique, B.; Grognet, P.; Grossetete, S.; Silar, P. The Nox/Ferric reductase/Ferric reductase-like families of Eumycetes. Fungal Biol. 2010, 114, 766–777. [Google Scholar] [CrossRef]
  11. Heller, J.; Tudzynski, P. Reactive oxygen species in phytopathogenic fungi: Signaling, development, and disease. Annu. Rev. Phytopathol. 2011, 49, 369–390. [Google Scholar] [CrossRef]
  12. Takemoto, D.; Scott, T.B. A p67phox-like regulator is recruited to control hyphal branching in a fungal-grass mutualistic symbiosis. Plant Cell 2006, 18, 2807–2821. [Google Scholar] [CrossRef] [PubMed] [Green Version]
  13. Donofrio, N.M.; Wilson, R.A. Redox and rice blast: New tools for dissecting molecular fungala-plant interactions. New Phytol. 2014, 201, 367–369. [Google Scholar] [CrossRef] [PubMed]
  14. Schuermann, J.; Buttermann, D.; Herrmann, A.; Giesbert, S.; Tudzynski, P. Molecular characterization of the NADPH oxidase complex in the ergot fungus Claviceps purpurea: CpNox2 and CpPls1 are important for a balanced host-pathogen interaction. Mol. Plant-Microbe Interact. 2013, 26, 1151–1164. [Google Scholar] [CrossRef] [Green Version]
  15. Cudejkova, M.M.; Vojta, P.; Josef, V.; Galuszka, P. Quantitative and qualitative transcriptome analysis of four industrial strains of Claviceps purpurea with respect to ergot alkaloid production. New Biotechnol. 2016, 33, 743–754. [Google Scholar] [CrossRef] [PubMed]
  16. Roca, M.G.; Weichert, M.; Siegmund, U.; Tudzynski, P.; Fleissner, A. Germling fusion via conidial anastomosis tubes in the grey mould Botrytis cinerea requires NADPH oxidase activity. Fungal Biol. 2012, 116, 380–387. [Google Scholar] [CrossRef]
  17. Kim, H.J.; Chen, C.; Kabbage, M.; Dickman, M.B. Identification and characterization of Sclerotinia sclerotiorum NADPH Oxidases. Appl. Environ. Microb. 2011, 77, 7721–7729. [Google Scholar] [CrossRef] [Green Version]
  18. Brun, S.; Malagnac, F.; Bidard, F.; Lalucque, H.; Silar, P. Functions and regulation of the Nox family in the filamentous fungus Podospora anserina: A new role in cellulose degradation. Mol. Microbiol. 2010, 74, 480–496. [Google Scholar] [CrossRef]
  19. Egan, M.J.; Wang, Z.Y.; Jones, M.A.; Smirnoff, N.; Talbot, N.J. Generation of reactive oxygen species by fungal NADPH oxidases is required for rice blast disease. Proc. Natl. Acad. Sci. USA 2008, 104, 11772–11777. [Google Scholar] [CrossRef] [Green Version]
  20. Marschall, R.; Schumacher, J.; Siegmund, U.; Tudzynski, P. Chasing stress signals-exposure to extracellular stimuli differentially affects the redox state of cell compartments in the wild type and signaling mutants of Botrytis cinerea. Fungal Genet. Biol. 2016, 90, 12–22. [Google Scholar] [CrossRef]
  21. Nallely, C.D.; Karen, A.D.; Hansberg, W.; Jesús, A. NADPH oxidases NOX-1 and NOX-2 require the regulatory subunit NOR-1 to control cell differentiation and growth in Neurospora crassa. Eukaryot. Cell. 2008, 7, 1352–1361. [Google Scholar]
  22. Leslie, J.; Summerell, B. The Fusarium Laboratory Manual; Blackwell Publishing: Ames, IA, USA, 2016; pp. 28–29. [Google Scholar]
  23. Thakur, A.; Singh, V.; Kaur, A.; Kaur, S. Suppression of Cellular Immune Response in Spodoptera litura (Lepidoptera: Noctuidae) Larvae by Endophytic Fungi Nigrospora oryzae and Cladosporium uredinicola. Ann. Entomol. Soc. Am. 2014, 107, 674–679. [Google Scholar] [CrossRef]
  24. Yang, I.S.; Kim, S. Analysis of Whole Transcriptome Sequencing Data: Workflow and Software. Genom. Inform. 2015, 13, 119–125. [Google Scholar] [CrossRef] [PubMed]
  25. Livak, K.J.; Schmittgen, T.D. Analysis of relative gene expression data using real-time quantitative PCR. Methods 2002, 25, 402–408. [Google Scholar] [CrossRef] [PubMed]
  26. Tao, Y.; Van, P.A.F.; Huang, Q.; Shao, Y.; Zhang, L.; Xie, B. Identification of novel and robust internal control genes from Volvariella volvacea that are suitable for RT-qPCR in filamentous fungi. Sci. Rep. 2016, 6, 29236. [Google Scholar] [CrossRef] [Green Version]
  27. Hodges, D.M.; Delong, J.M.; Forney, C.F. Improving the thiobarbituric acid-reactive-substance assay for estimating lipid peroxidation in plant tissues containing anthocyanin and other interfering compounds. Planta 1999, 207, 604–611. [Google Scholar] [CrossRef]
  28. Wang, A.G.; Luo, G.H. Quantitative relation between the reaction of hydroxylamine and superoxide anion radicals in plants. Plant Physiol. Commun. 1990, 84, 2895–2898. [Google Scholar]
  29. Prochazkova, D.; Sairam, R.K.; Srivastava, G.C.; Singh, D.V. Oxidative stress and antioxidant activity as the basis of senescence in maize leaves. Plant Sci. 2001, 161, 765–771. [Google Scholar] [CrossRef]
  30. Rao, M.V.; Paliyath, G.; Ormrod, D.P. Ultraviolet-B- and ozone-induced biochemical changes in antioxidant enzymes of Arabidopsis thaliana. Plant Physiol. 2001, 110, 125e36. [Google Scholar] [CrossRef] [Green Version]
  31. Wang, Y.S.; Tian, S.P.; Xu, Y. Effects of high oxygen concentration on pro- and anti-oxidant enzymes in peach fruits during postharvest periods. Food Chem. 2005, 91, 99–104. [Google Scholar] [CrossRef]
  32. Venisse, J.S.; Gullner, G.; Brisset, M.N. Evidence for the involvement of an oxidative stress in the initiation of infection of pear by Erwinia amylovora. Plant Physiol. 2001, 125, 2164–2172. [Google Scholar] [CrossRef] [Green Version]
  33. Barceló, A.R. Hydrogen peroxide production is a general property of the lignifying xylem from vascular plants. Ann. Bot. 1998, 82, 97–103. [Google Scholar] [CrossRef] [Green Version]
  34. Shinogi, T.; Suzuki, T.; Kurihara, T.; Narusaka, Y.; Park, P. Microscopic detection of reactive oxygen species generation in the compatible and incompatible interactions of Alternaria alternata Japanese pear pathotype and host plants. J. Gen. Plant Pathol. 2003, 69, 7–16. [Google Scholar] [CrossRef]
  35. Lambeth, J.D.; Neish, A.S. Nox enzymes and new thinking on reactive oxygen: A double-edged sword revisited. Annu. Rev. Pathol. 2014, 9, 119–145. [Google Scholar] [CrossRef] [PubMed]
  36. Mittler, R.; Vanderauwera, S.; Gollery, M.; Van, B.F. Reactive oxygen gene network of plants. Trends Plant Sci. 2004, 9, 490–498. [Google Scholar] [CrossRef]
  37. Foyer, C.H.; Noctor, G. Redox Signaling in Plants. Antioxid. Redox Sign. 2013, 18, 2087–2090. [Google Scholar] [CrossRef] [PubMed]
  38. Mittler, R.; Vanderauwera, S.; Suzuki, N.; Miller, G.; Tognetti, V.B.; Vandepoele, K. ROS signaling: The new wave? Trends Plant Sci. 2011, 16, 300–309. [Google Scholar] [CrossRef]
  39. Ekanayake, G.; LaMontagne, E.D.; Heese, A. Never walk alone: Clathrin-coated vesicle components in plant immunity. Annu. Rev. Phytopathol. 2019, 57, 387–409. [Google Scholar] [CrossRef]
  40. Diaz, J.M.; Plummer, S.; Hansel, C.M.; Andeer, P.F.; Saito, M.A.; McIlvin, M.R. NADPH-dependent extracellular superoxide production is vital to photophysiology in the marine diatom Thalassiosira oceanica. Proc. Natl. Acad. Sci. USA 2019, 116, 201821233. [Google Scholar] [CrossRef] [Green Version]
  41. Malagnac, F.; Lalucque, H.; Lepère, G.; Silar, P. Two NADPH oxidase isoforms are required for sexual reproduction and ascospore germination in the filamentous fungus Podospora anserina. Fungal Genet. Biol. 2004, 41, 982–997. [Google Scholar] [CrossRef]
  42. Li, W.; Christopher, M.; Sean, W.; Joshi, M.; Subramaniam, R. Characterization of NADPH oxidase genes NoxA and NoxB in Fusarium graminearum. Can. J. Plant Pathol. 2014, 36, 12–21. [Google Scholar]
  43. Libik-Konieczny, M.; Kozieradzka-Kiszkurno, M.; Desel, C.; Michalec-Warzecha, Ż.; Miszalski, Z.; Konieczny, R. The localization of NADPH oxidase and reactive oxygen species in in vitro-cultured Mesembryanthemum crystallinum L. hypocotyls discloses their differing roles in rhizogenesis. Protoplasma 2015, 252, 477–487. [Google Scholar] [CrossRef] [PubMed] [Green Version]
  44. Passaia, G.; Margis-Pinheiro, M. Glutathione peroxidases as redox sensor proteins in plant cells. Plant Sci. 2015, 234, 22–26. [Google Scholar] [CrossRef]
  45. Mittler, R. ROS Are Good. Trends Plant Sci. 2016, 22, 11–19. [Google Scholar] [CrossRef] [PubMed] [Green Version]
  46. Vanderauwera, S.; Suzuki, N.; Miller, G.; van de Cotte, B.; Morsa, S.; Ravanat, J.-L.; Hegie, A.; Triantaphylidès, C.; Shulaev, V.; van Montagu, M.C.E.; et al. Extranuclear protection of chromosomal DNA from oxidative stress. Proc. Natl. Acad. Sci. USA 2011, 108, 1711–1716. [Google Scholar] [CrossRef] [Green Version]
  47. Ben, R.K.; Benzarti, M.; Debez, A.; Bailly, C.; Savouré, A.; Abdelly, C. NADPH oxidase-dependent H2O2 production is required for salt-induced antioxidant defense in Arabidopsis thaliana. J. Plant Physiol. 2015, 174, 5–15. [Google Scholar]
  48. Bao, G.H.; Bi, Y.; Li, Y.C.; Kou, Z.; Hu, L.; Ge, Y. Overproduction of reactive oxygen species involved in the pathogenicity of Fusarium in potato tubers. Physiol. Mol. Plant Pathol. 2014, 86, 35–42. [Google Scholar] [CrossRef]
  49. O’Donnell, B.V.; Tew, D.G.; Jones, O.T.; England, P.J. Studies on the inhibitory mechanism of iodonium compounds with special reference to neutrophil NADPH oxidase. Biochem. J. 1993, 290, 41–49. [Google Scholar] [CrossRef]
Figure 1. Colony growth and spore number after different treatments. (a) is the diameter of colonies and (b) is the number of spores (macroconidia). S1 group (n = 5): inoculation of F. solani on normal PDA; S2 group (n = 5): inoculation of F. solani on PDA containing 40 µmol/L DPI; S3 group (n = 5): inoculation of F. solani on PDA containing 40 µmol/L DPI. On the fourth day of cultivation, 5 mL of 0.0012% H2O2 was added to each dish. Data are expressed as the mean ± SD. * p < 0.05 S2 or S3 vs. S1, # p < 0.05 S3 vs. S2.
Agriculture 12 01840 g001
Figure 2. NBT staining photos of colony superoxide anion. The upper row is the shoot in the back light, and the lower row is the Image-pro software count picture. S1 group (n = 3): inoculation of F. solani on normal PDA; S2 group (n = 3): inoculation of F. solani on PDA containing 40 µmol/L DPI; S3 group (n = 3): inoculation of F. solani on PDA containing 40 µmol/L DPI. On the fourth day of cultivation, 5 mL of 0.0012% H2O2 was added to every dish.
Agriculture 12 01840 g002
Figure 3. DAB staining photos of colony hydrogen peroxide. The upper row shoot in back light, the lower row is the Image-Pro software count picture. S1 group (n = 3): inoculation of F. solani on normal PDA; S2 group (n = 3): inoculation of F. solani on PDA containing 40 µmol/L DPI; S3 group (n = 3): inoculation of F. solani on PDA containing 40 µmol/L DPI. On the fourth day of cultivation, 5 mL of 0.0012% H2O2 was added to each dish.
Agriculture 12 01840 g003
Figure 4. mRNA expression of NCF2, SOD1, CTA1 and PXMP4 in the F. solani colony. (a,c,e,g) are fragments per kilobase of exon model per million mapped fragments (FPKM) values from transcriptome sequencing data; (b,d,f,h) are relative expression values from RT-qPCR data. S1 group (n = 3): inoculation of F. solani on PDA; S2 group (n = 3): inoculation of F. solani on PDA containing 40 µmol/L DPI; S3 group (n = 3): inoculation of F. solani on PDA containing 40 µmol/L DPI. On the fourth day of cultivation, 5 mL of 0.0012% H2O2 was added to each dish. Data are expressed as mean ± SD. * p < 0.05 S2 or S3 vs. S1, # p < 0.05 S3 vs. S2.
Agriculture 12 01840 g004
Figure 5. The main ROS content in the F. solani colony. (a) Superoxide anion (O2); (b) hydrogen peroxide (H2O2). S1 group (n = 3): inoculation of F. solani on PDA; S2 group (n = 3): inoculation of F. solani on PDA containing 40 µmol/L DPI; S3 group (n = 3): inoculation of F. solani on PDA containing 40 µmol/L DPI; S4 group (n = 3): inoculation of F. solani on PDA and on the fourth day of cultivation, 5 mL of 0.0012% H2O2 was added to each dish. Data are expressed as mean ± SD. * p < 0.05 S2 or S3 vs. S1, # p < 0.05 S3 vs. S2, + p < 0.05 S4 vs. S1.
Agriculture 12 01840 g005
Figure 6. Oxidant-antioxidant parameters in the F. solani colony. (a) Superoxide dismutase (SOD). (b) Catalase (CAT). (c) Peroxidase (POD). (d) Malondialdehyde (MDA). S1 group (n = 3), inoculation of F. solani on PDA; S2 group (n = 3), inoculation of F. solani on PDA containing 40 µmol/L DPI; S3 group (n = 3), inoculation of F. solani on PDA containing 40 µmol/L DPI. On the fourth day of cultivation, 5 mL of 0.0012% H2O2 was added to each dish. Data are expressed as the mean ± SD. * p < 0.05 S2 or S3 vs. S1, # p < 0.05 S3 vs. S2.
Agriculture 12 01840 g006
Figure 7. The mode diagram of ROS on F. solani growth.
Agriculture 12 01840 g007
Table 1. List of oligonucleotide primers used for RT-qPCR studies.
GeneIDGenenameForward Primer SequenceReverse Primer Sequence
NECHADRAFT_57795CTA1AGCCAGACTACCATGTCAAAGGGAGCCTTCTTGATCTCTTCAG
NECHADRAFT_74783PXMP4CGATTCGCCGTCATCTACAACCAAAGACAAAGTAGCCTCCA
NECHADRAFT_81761NCF2GGCTACACTGTCTTCTCCATTCGTAGTCCTTGGTCTTGAGGTTTC
NECHADRAFT_59203SOD1CCCTCTTCAAGACTTGCTTCTGAGGATTGGGTATCTGGTTTGT
Publisher’s Note: MDPI stays neutral with regard to jurisdictional claims in published maps and institutional affiliations.

