Article

N Addition Mitigates Water Stress via Different Photosynthesis and Water Traits for Three Native Plant Species in the Qinghai–Tibet Plateau

1
College of Grassland Agriculture, Northwest A&F University, Yangling 712100, China
2
College of Resources and Environment, Tibet Agriculture and Animal Husbandry University, Nyingchi 860000, China
3
Qiangtang Alpine Grassland Ecosystem Research Station (Jointly Built with Lanzhou University), Tibet Agricultural and Animal Husbandry University, Nyingchi 860000, China
4
College of Animal Science, Tibet Agriculture and Animal Husbandry University, Nyingchi 860000, China
*
Authors to whom correspondence should be addressed.
Agriculture 2022, 12(11), 1873; https://doi.org/10.3390/agriculture12111873
Submission received: 23 September 2022 / Revised: 2 November 2022 / Accepted: 5 November 2022 / Published: 8 November 2022
(This article belongs to the Special Issue Agronomic Management of Crops in Arid and Semi-arid Environments)

Abstract

:
Reseeding with native plants to rebuild alpine meadow has become a popular way of ecological restoration. However, the harsh environment poses a great challenge to the establishment of native plants due to poor management of water and nutrients. How water–fertilizer interaction influences dominant grass species is still unclear, and reasonable water and fertilizer conditions are still not determined. Our results showed that addition of nitrogen could mitigate the photosynthetic and water-use traits caused by water stress, i.e., a reduction in Pn and water use results from fewer and thinner leaves, weak stomatal traits, etc. Compared to the control, the peak Pn values of Poa crymophila, Festuca coelestis, and Stipa purpurea increased significantly (71.2%, 108.4%, and 25.4%, respectively). Under drought stress, Pn tended to decrease due to reduced stomatal conductance (Gs). However, appropriate fertilization buffered against Pn decreases by altering the stomatal size and regulating the Gs. Based on reduced water consumption, the water-use efficiency of P. crymophila and F. coelestis decreased whereas that of S. purpurea increased. WHFH for P. crymophila and F. coelestis and WHFL for S. purpurea growth were suitable for the alpine region. WHFH for P. crymophila and F. coelestis and WHFL for S. purpurea were suitable for their establishment in the alpine region. A reasonable water–fertilizer combination could effectively reduce the risk of establishment failure in ecological restoration.

1. Introduction

The Qinghai–Tibet Plateau is the highest (average elevation of 4000 m) and largest plateau in the world [1]. The ecosystem is fragile and sensitive, and over the past three decades, the alpine grasslands have witnessed an increasing trend in temperature and the influence of climate change in combination with an uneven rainfall within the growing season and stress from overgrazing, resulting the suffering of a large area of grassland from drought stress and degradation [2,3,4]. These disturbances are challenging the sustainability of the Qinghai−Tibet Plateau’s grassland ecosystems [5]. Therefore, there is an urgent need for appropriate ecological restoration methods. Reseeding is a key method for restoring degraded grasslands [6]. The results of previous studies have shown that the degradation could be effectively mitigated via the planting of native plants due to their adaptability advantages [7]. However, the ratio of success is limited by the large variation in rainfall in degraded areas, which poses a further challenge for drought and nutrient management.
The absorption and use of nutrients of plants is closely related to the soil’s water content. Therefore, the soil moisture largely determines the effectiveness of fertilizers, and also becomes an important factor for plant growth and development [8]. The stomata is the main site for water and CO2 exchange between plant leaves and the external environment and it responds rapidly to water conditions. Drought stress can cause stomatal closure and may even damage mesophyll cells, which reduces the activity of photosynthetic enzymes and consequently retards photosynthesis [9,10]. Plants also respond to drought by regulating their physiological characteristics such as growth rates, cell osmotic potentials, and antioxidant defense systems [11]. Fertilizer application is a direct method for supplementing the vegetation of degraded grasslands with nutrients. The application of nitrogen fertilizer promotes plant root growth, which increases water absorption and in turn promotes photosynthesis and plant growth, thereby mitigating the effects of water deficiency. However, excessive nitrogen fertilizer application reduces photosynthesis and produces soil pollution issues [12,13,14,15,16]. Previous research has demonstrated that insufficient or excessive water and fertilizer inhibit plant growth and development [17]. Therefore, optimizing the water−fertilizer relationship to harness their combined advantages is essential for the success of reseeding and restoration of degraded grasslands.
Distributed over the northeastern parts of the Qinghai−Tibet Plateau is one of the largest areas of alpine meadow in China. Here, grassland degradation and reductions in the soil nutrient and soil water contents are particularly severe, caused by the poor management and overuse of grassland [18]. Native plants have a verified merit and potential for use in ecological restoration. A preliminary study on reseeding and fertilizer application demonstrated that different reseeding combinations with Melissitus rutenica, Puccinellia tenuiflora, Elymus nutans, Stipa aliena, and Koeleria cristata increased the community stability [19]. Fertilizer application and reseeding with Poa pratensis in a striped pattern effectively enhanced the community diversity and functional structure in an alpine meadow [20]. Previous research also revealed that using Kobresia species, Elymus nutans, Bromus inermis Layss, and P. crymophila as native dominant plants for reseeding clearly alleviated grassland degradation, which provided considerable economic and ecological value [21,22]. However, the adaptive capabilities of the major native dominant plant species under different environments still remains unclear.
Poa crymophila, Festuca coelestis, and Stipa purpurea are dominant species native to the alpine meadow, belong to perennial gramineous grasses, and have high adaptability in drought, low-temperature, strong radiation, and nutrient-deficient environments. They are important food sources for ruminants and very good candidates for ecological restoration. Currently, there are only a few studies on F. coelestis, and studies on P. crymophila and S. purpurea have been limited to the investigation of the effects of a single fertilizer [23,24] or drought [25]. Further exploration is required to determine the conditions and potential of these species for supplementary sowing applications in degraded grasslands and to elucidate the effects of water−fertilizer coupling combinations and the mechanisms of adaptation. Therefore, this study with a water- and fertilizer-controlled pot experiment was conducted to: (1) determine the photosynthetic response of P. crymophila, F. coelestis, and S. purpurea under different water−fertilizer treatments; (2) analyze the water−fertilizer coupling interactions in water use and dry matter production; and (3) determine the optimum water−fertilizer combination of the test plant species. Our results are conducive to the sustainability of alpine grassland ecosystems and provides new options for degraded grassland restoration.

2. Materials and Methods

2.1. Study Area and Experimental Design

A pot experiment was conducted at the Grassland Science Internship Base of the Tibet Agricultural and Animal Husbandry University located in the Bayi Subdistrict of Bayi District of Nyingchi City of the Tibet Autonomous Region (29.66° N, 94.34° E; 2969.64 m above sea level). The study site is characterized by a plateau temperate humid/semi-humid monsoon climate, with the peak phase of the rainy season generally occurring between the end of June and the end of August. The study area has an average annual temperature of 7−16 °C, an average annual precipitation of 650 mm, an annual total solar radiation of 5460−7530 MJ/m2, and an average annual relative humidity of 71%.
The major gramineous forage grass species of the North Tibetan alpine grassland, namely P. crymophila, F. coelestis, and S. purpurea, were selected for this experiment. Grass seeds were collected in September 2020 and stored at 5 °C before initiation of the experiment. A controlled pot experiment was conducted from August to December 2021. Cylindrical pots with a height of 20 cm and an internal diameter of 28.5 cm were used for the experiment. The pots were filled with sandy loam with a pH of 7.30, 25.73 mg·kg−1 of fast-release nitrogen fertilizer, and 9.30 mg·kg−1 of fast-release phosphorus fertilizer. Each pot was filled with 8.5 kg of sandy loam. The field capacity (FC) and bulk density of the soil were 30.27% and 1.32 g/cm3, respectively. A two-factor split-plot experimental design was employed, with water and nitrogen fertilizer treatment serving as the two factors. Three water level treatments were set, namely soil water contents of 75% (WH, adequate water), 55% (WM, mild water deficiency stress), and 35% (WL, moderate water deficiency stress). In terms of nitrogen fertilizer treatment, urea [CO(NH2)2] was used as the nitrogen fertilizer and four treatment levels were set, e.g., control (0 g/kg, CK), 0.11 g/kg (FL), 0.33 g/kg (FM), and 0.54 g/kg (FH). A control group was established with 0 g/kg of fertilizer treatment. Thirty-six different water−fertilizer treatments were used and six replicates were established for each treatment (for a total of 216 pots).
Sowing was performed on 6 August 2021, with ten seeds evenly sowed at the center of each pot. After the seedlings emerged, five seedlings with similar growth states were retained in each pot. On 6 August 2021, phosphorus pentoxide (0.07 g/kg) was applied to all pots for each treatment group. Potassium chloride (0.1 g/kg) was used as the base fertilizer, and the pots of all treatment groups were watered to achieve a soil water content of 60%. One week after applying the base fertilizer, urea was added to the various treatment groups. The amount of fertilizer applied to each pot was converted to dose per unit area, and urea supplementation was only performed once. From this point onwards (until the end of the experiment), the soil water contents of the various treatment groups were strictly controlled using the gravimetric method. The pot positions of the various treatment groups were changed once weekly to ensure the consistency of the experiment.

2.2. Measured Indicators and Measurement Methods

2.2.1. Photosynthetic Characteristics and Water−Use Efficiency (WUE) of Plants

Photosynthetic characteristics were measured once every 2 h between 9:00 and 19:00 on a sunny day (7 December 2021) using an LI−6400 portable photosynthesis system (LI−COR Corporation, Lincoln, NE, USA). Three replicates were randomly selected for each treatment, and two representative leaf blades were selected from each replicate to measure the net photosynthetic rate (Pn), transpiration rate (Tr), stomatal conductance (Gs), and WUE at approximately halfway up the leaf to the leaf tip. Three repeat measurements were taken for each indicator, and the average values were recorded as the measured values. The light intensity of the photosynthesis system was set as 800 μmol·m−2·s−1. The CO2 concentration within the leaf chamber was set as 350 μmol/mol, and the CO2−flow rates were set as 300 μmol·s−1 for P. crymophila or 250 μmol·s−1 for F. coelestis and S. purpurea.

2.2.2. Leaf Blade Stomatal Density and Size Measurements

The lower epidermis of leaf blades of the experimental plants was obtained to prepare temporary slices, which were placed under a microscope at high magnification (40×) to observe the leaf blade stomata. For each slice, 10 fields of view (FOVs) were randomly selected and photographed. The stomatal density was calculated using AutoCAD 2021 software (Autodesk Corporation, San Francisco, CA, USA) based on the microscopic magnification using the following formula: stomatal density = number of stomata in the FOV/area of the FOV.

2.2.3. Plant Traits

Measurements were performed with the leaf blades of all three plant species. Three replicates were obtained for each treatment group, and two plants were randomly selected for each replicate.
Two plants were selected from each pot to determine the leaf blade counts. Two leaf blades were selected from each plant to measure the leaf blade thicknesses at approximately halfway up the leaf tip using a Vernier caliper.

2.2.4. Water-Use Efficiency of Plants

Sample destruction was performed at the end of the experiment. Soil layer samples were obtained at 10 cm depth intervals (two layers in total), and three replicate samples were obtained for each treatment. The samples were dried in an oven at 65 °C for 48 h before measuring the gravimetric water content of the soil. The FC was measured using the ring knife method and calculated using the formula for soil water storage (SWS) [26]:
SWS = D × H × W × 10
where D, H, and W represent the bulk density (g/cm3), depth (cm), and gravimetric water content (%) of the soil, respectively.
Water consumption was calculated using the following formula [27]:
WU = SWS1 − SWS2 + I
where SWS1 and SWS2 represent the SWS (mm) during the sowing and harvesting stages, respectively, and I represents the irrigation level. Given that the pot experiment was conducted beneath a rain shelter, it was assumed that the water consumption by the crops mainly reflected SWS and irrigation, and other sources of water were not considered.

2.2.5. Plant Biomass

One plant was randomly selected from the replicates of each treatment group. Extraneous matter was removed by washing with water, and the aboveground and belowground parts of the plants were separated. Samples were dried in an oven at 65 °C until a constant weight was attained, and the plants were subsequently weighed.

2.3. Statistical Analysis

The measured data were consolidated using Microsoft Excel 2003. Univariate and bivariate significance testing was performed with SPSS (version 21.0, IBM Corp, Armonk, NY, USA) at the α = 0.05 significance level, and multiple comparison testing was performed using the least significant difference test. The results of our statistical analyses were plotted using Origin 2021 software (OriginLab Corporation, Northampton, MA, USA).

3. Results

Significant differences (* p < 0.05) were observed in terms of the effects of water, fertilizer, and their interactions on the Pn values of P. crymophila, F. coelestis, and S. purpurea.
The Pn values of P. crymophila and F. coelestis tended to exhibit double or single peaks under different water–fertilizer conditions, whereas the Pn values of S. purpurea exhibited double peaks under all water–fertilizer conditions. In P. crymophila, under the WH and WL conditions, the peak Pn values attained with FH treatment occurred from 11:00−13:00 and 15:00−17:00, respectively. The peak Pn value under the WHFH treatment was significantly higher than that under other treatments and 71.2% higher than that under the CK. Under the WM treatment, the amount of fertilizer applied had a smaller effect on Pn. For F. coelestis, the Pn exhibited a double-peak pattern under the WH and WM treatments, with peak values occurring from 11:00−13:00 and 15:00−17:00, respectively. Under the WHFH treatment, the Pn value was higher than under the other treatments, with the increase being as high as 108.4% when compared with that in the CK. Under the WL condition, the Pn value exhibited a single peak that occurred from 11:00–13:00. In S. purpurea, the highest Pn peak values occurred from 11:00−13:00 and 15:00−17:00 under the WHFL treatment, which is 41.3% higher than that observed under the CK.
Under different water content levels, differences were found in the responses of the daily average Pn to fertilizer applications. In P. crymophila, the main differences occurred under the WH and WL conditions, with the daily average Pn values under the FH treatment being 33.1% and 21.8% higher than that under the CK condition, respectively. The effects of the water content level also differed when different fertilizer levels were applied. For example, the water content levels under the CK was significantly different (p < 0.05) from those under the WM and WL treatments; furthermore, the water content levels were significantly different (p < 0.05) under the FM and FH treatments. For F. coelestis, the daily average Pn value increased with increasing fertilizer application levels. Under the WH condition, differences in the daily average Pn value existed across the various fertilizer application levels, with the difference between the FH and CK groups being the greatest (66.2% higher than that of the CK). Under the WM and WL conditions, the daily average Pn values under the FH and FM treatments increased by 56.7% and 58.5% and by 35.6% and 28.0%, respectively, when compared with those of the CK. Under the CK condition, differences in daily average Pn value between the WL, WH, and WM treatments were statistically significant; under the FL treatment, the differences in the daily average Pn values between WM treatment and the other two water treatments were significant (p < 0.05). In S. purpurea under the WH condition, the daily average Pn value was highest under the FL treatment. The daily average Pn value under the WLFM treatment was 25.4% higher than that under the CK; under the FM condition, the daily average Pn values decreased in the following order of water content levels: WL > WM > WH. Under other fertilizer treatments, the daily average Pn decreased as water content decreased (Figure 1).
The effects of water, fertilizer, and their interactions on leaf number and leaf thickness differed significantly among the P. crymophila (p < 0.05). In F. coelestis, water, fertilizer, and their interactions caused significant differences in leaf thickness, whereas only fertilizer caused significant differences in leaf number. In S. purpurea, only water and fertilizer caused significant differences in leaf number, whereas all factors except water caused significant differences in leaf thickness (p < 0.05).
The leaf number and leaf thickness of all three species decreased with an increase in fertilizer application level. Leaf number was highest under the WHFL treatment for all three species, with the values being 50.7, 37.2, and 24.3, which were increased by 198.1%, 43.9%, and 39.0%, respectively, compared those of the CK. At the same fertilizer application level, the leaf numbers of all three species decreased with the reduction in water content. Leaf thickness of P. crymophila and F. coelestis decreased gradually with a decrease in water content level, whereas leaf thickness of S. purpurea was greatest under the WHFL treatment, which increased by 115.4% compared with the control group (p < 0.05; Figure 2).
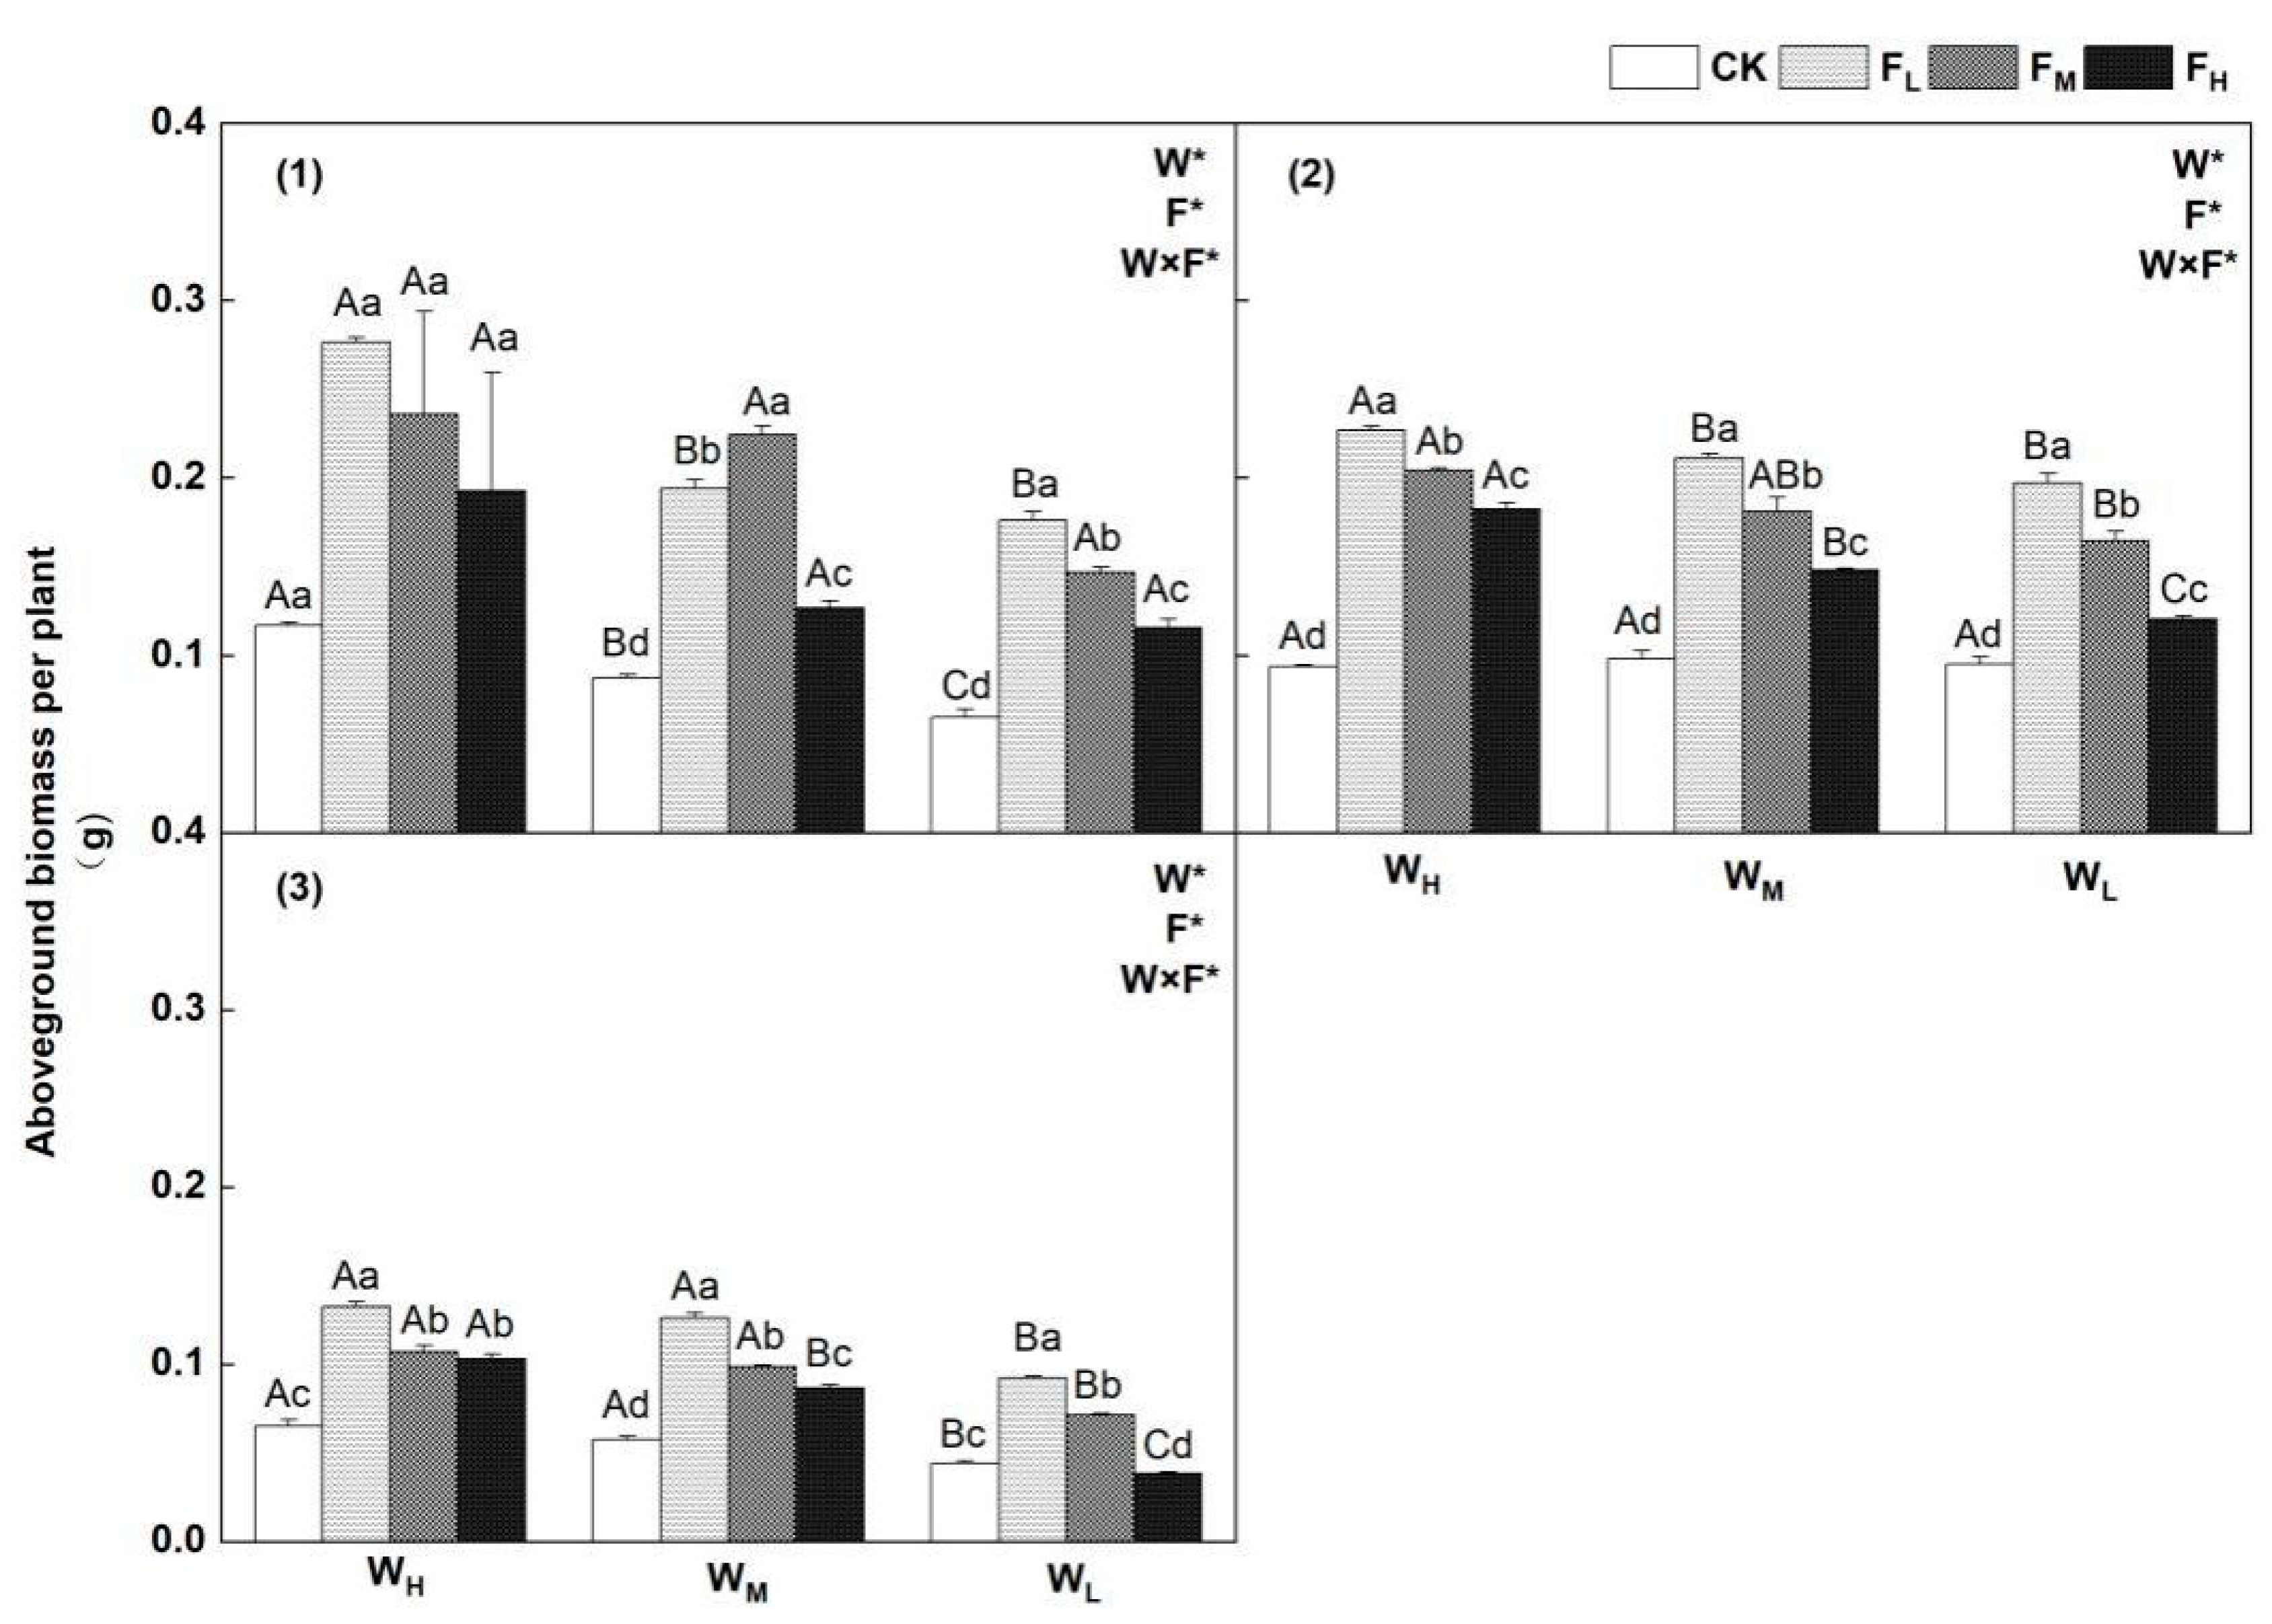
Water, fertilizer, and their interactions exerted significant effects on the aboveground biomass for all three species (p < 0.05).
The highest under the WHFL treatment for the three species, with the values for P. crymophila, F. coelestis, and S. purpurea being 0.2232, 0.1991, and 0.1327, respectively. For P. crymophila, under the WH and WL conditions, the aboveground biomass with the FL treatment increased by 137.1% and 273.1%, when compared with those under the CK. Under the WM condition, the aboveground biomass with FM treatment increased by 153.7% over the CK and did not differ significantly compared with other treatments. Under various fertilizer conditions, the aboveground biomass was highest under the WH condition. F. coelestis and S. purpurea exhibited identical trends in which decreased with increasing fertilizer application levels under various water content conditions and gradually decreased with drought stress under various fertilizer application conditions. For both species, the aboveground biomass was highest under the FL treatment, which were respectively increased by 142.8%, 115.4%, and 107.4% and by 104.6%, 118.0%, and 108.1%, when compared with the corresponding values in the CK. Under identical fertilizer application conditions, the aboveground biomass of F. coelestis under the FL, FM, and FH treatments were higher with WH than with WL by 15.2%, 3.6%, and 51.7%, respectively, whereas the corresponding trend for S. purpurea was WH > WL > WM (Figure 3).
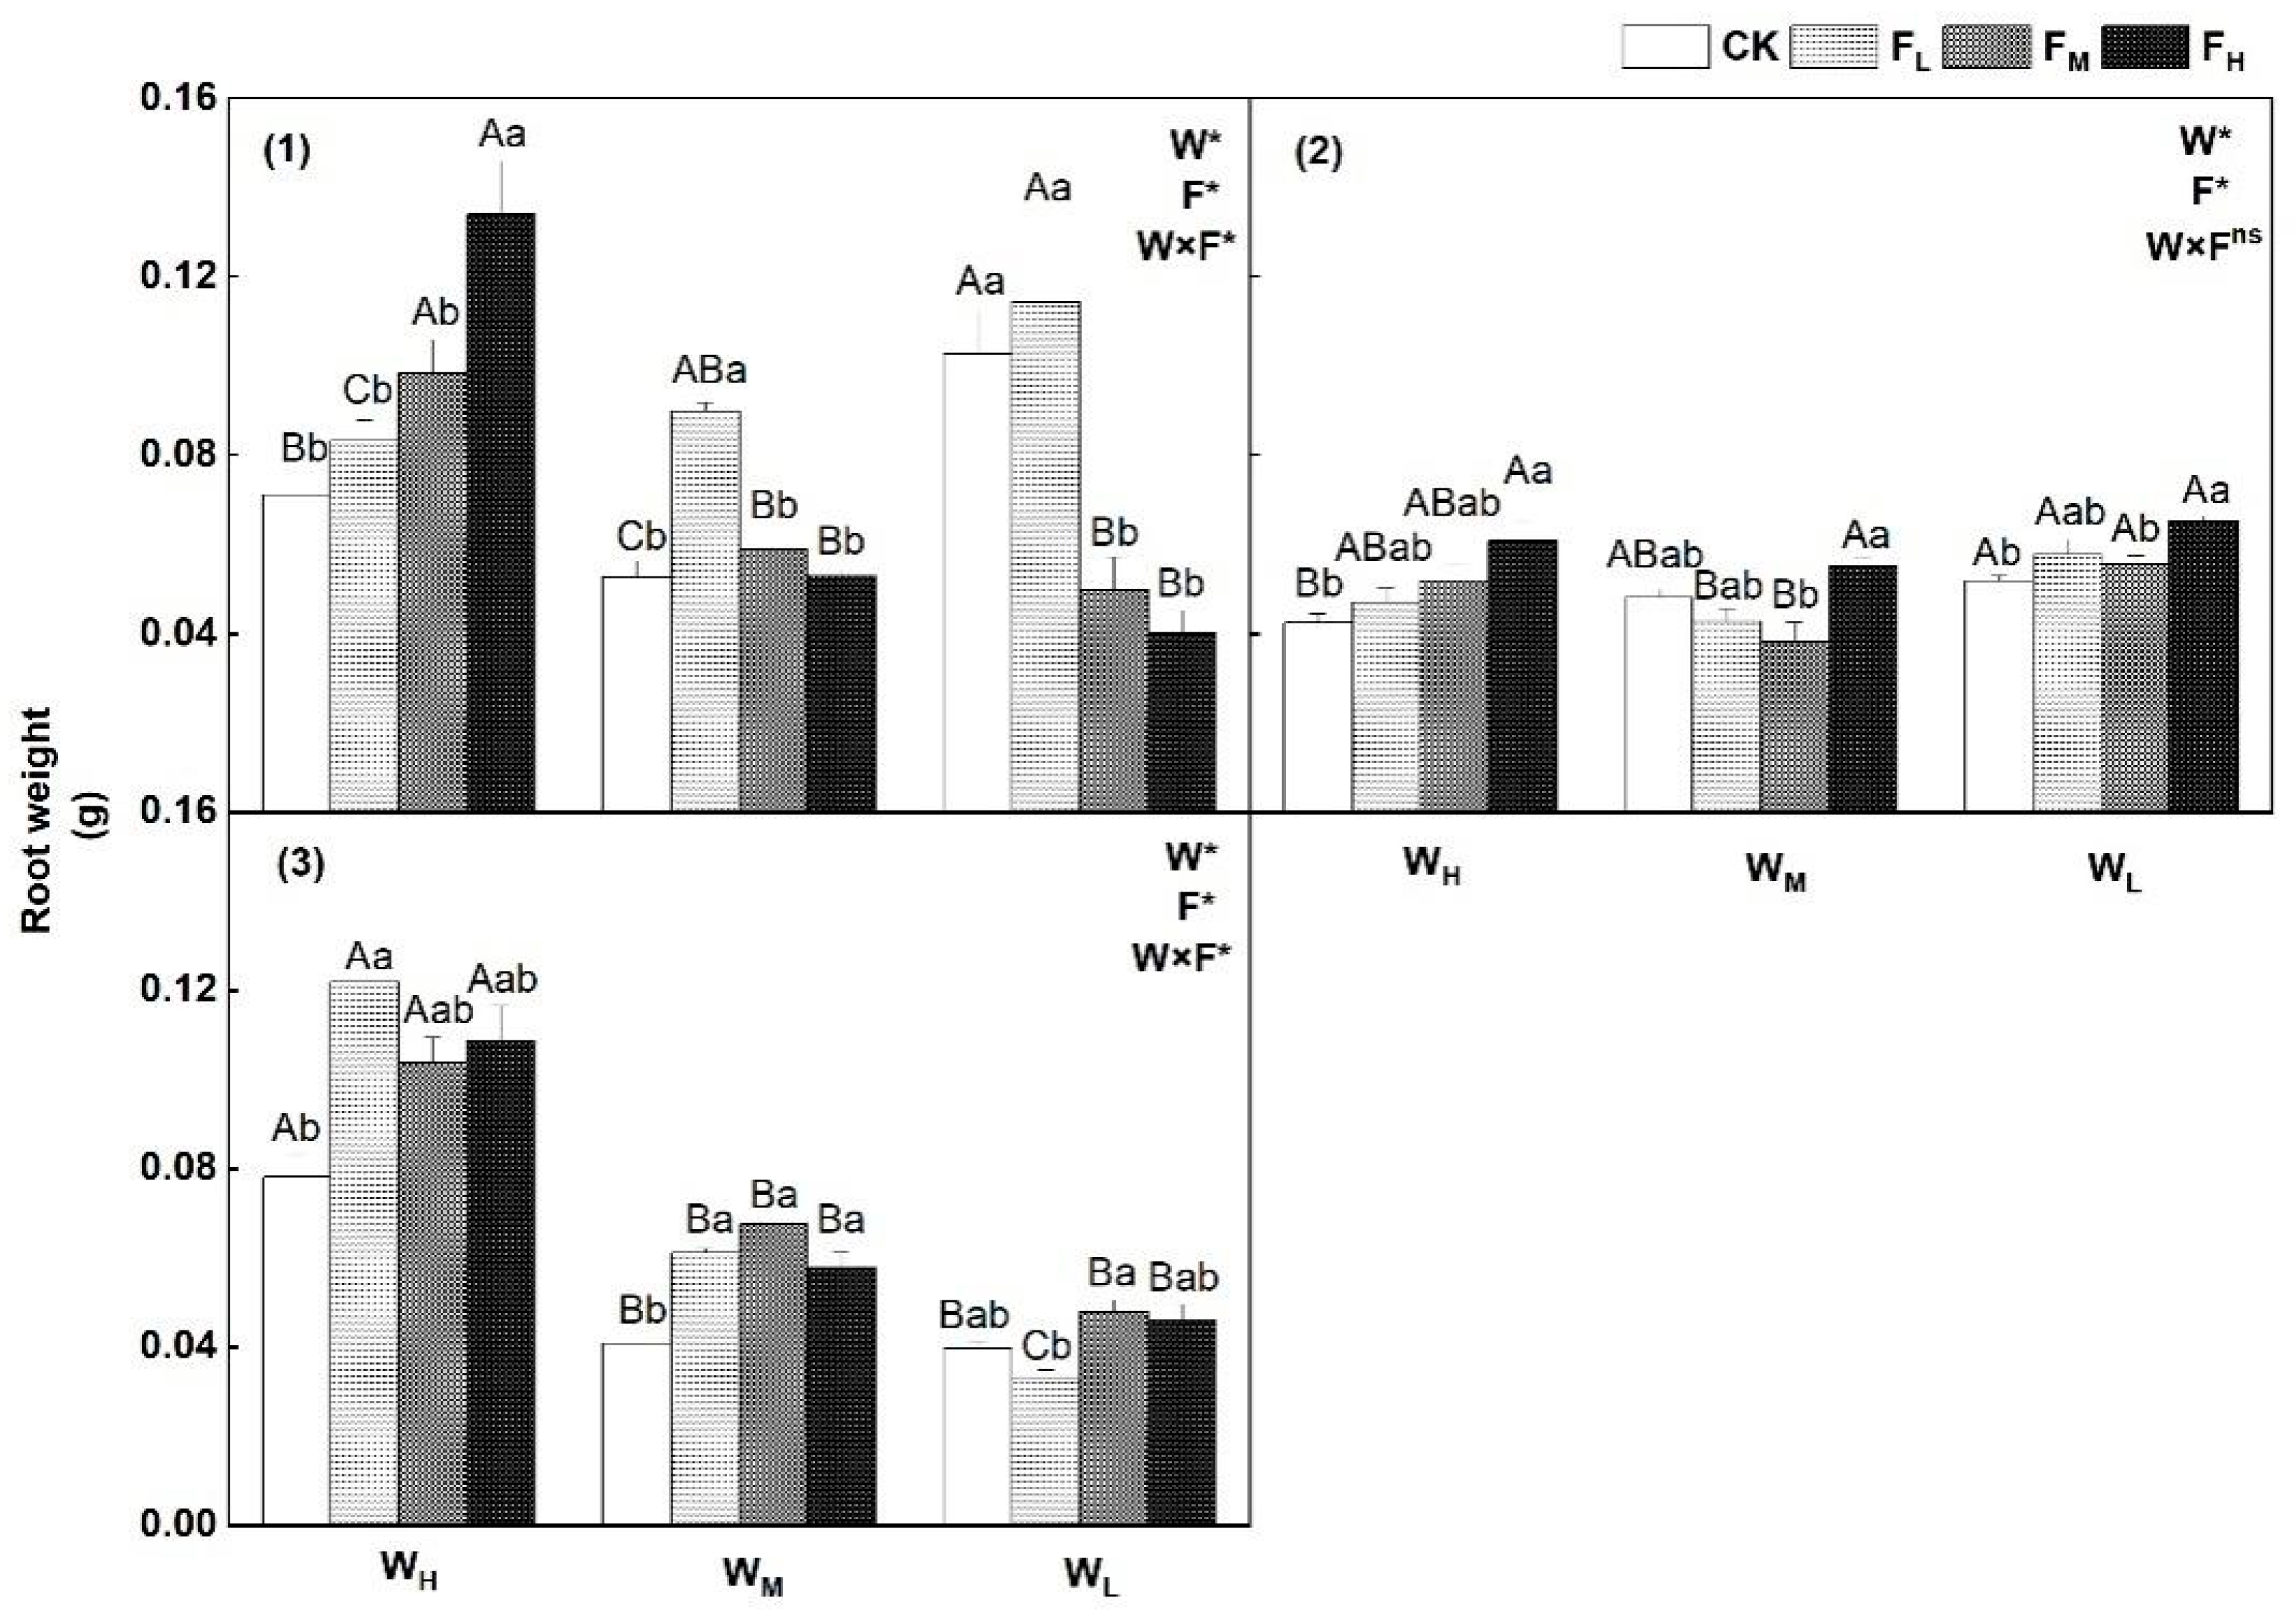
The effects of water, fertilizer, and their interactions on the root weight were significantly different for P. crymophila and S. purpurea. Water and fertilizer significantly affected the root weight for F. coelestis, whereas the effects of water−fertilizer interactions were not significant (p < 0.05).
Differences also existed in the root weight between all three species under different treatments. Under the WH condition, the root weight for P. crymophila and F. coelestis decreased in the following order in terms of the fertilizer application level: FH > FM > FL > CK, with the values of both species under the FH treatment being 88.7% and 45.2% higher than that of the CK, respectively. Under the WM and WL conditions, P. crymophila exhibited a progressive decrease in root weight as the fertilizer application level increased (except for the control treatment); the root weight under the WMFL treatment increased by 69.4% compared with that of the CK. For F. coelestis, the highest values were obtained under the FH condition, which were 14.6% and 25.5% higher, respectively, compared with those of the control group. For S. purpurea, the highest root weight value was attained under the WHFL conditions, which was 56.3% higher than that of the control group. Under the CK and FL conditions, the root weight was highest under the WL treatment for P. crymophila and F. coelestis. Under the FH and FM conditions, the root weights of P. crymophila under the WH treatment was higher than those of other water content levels, with the values being 234.2% and 98.2% higher, respectively, than that of the WL group. The root weight of F. coelestis was highest under the WL treatment, but the differences compared with other treatments were relatively small. Under identical fertilizer application levels, the root weight of S. purpurea was highest under the WH treatment and differed significantly from those of other treatments (p < 0.05; Figure 4).
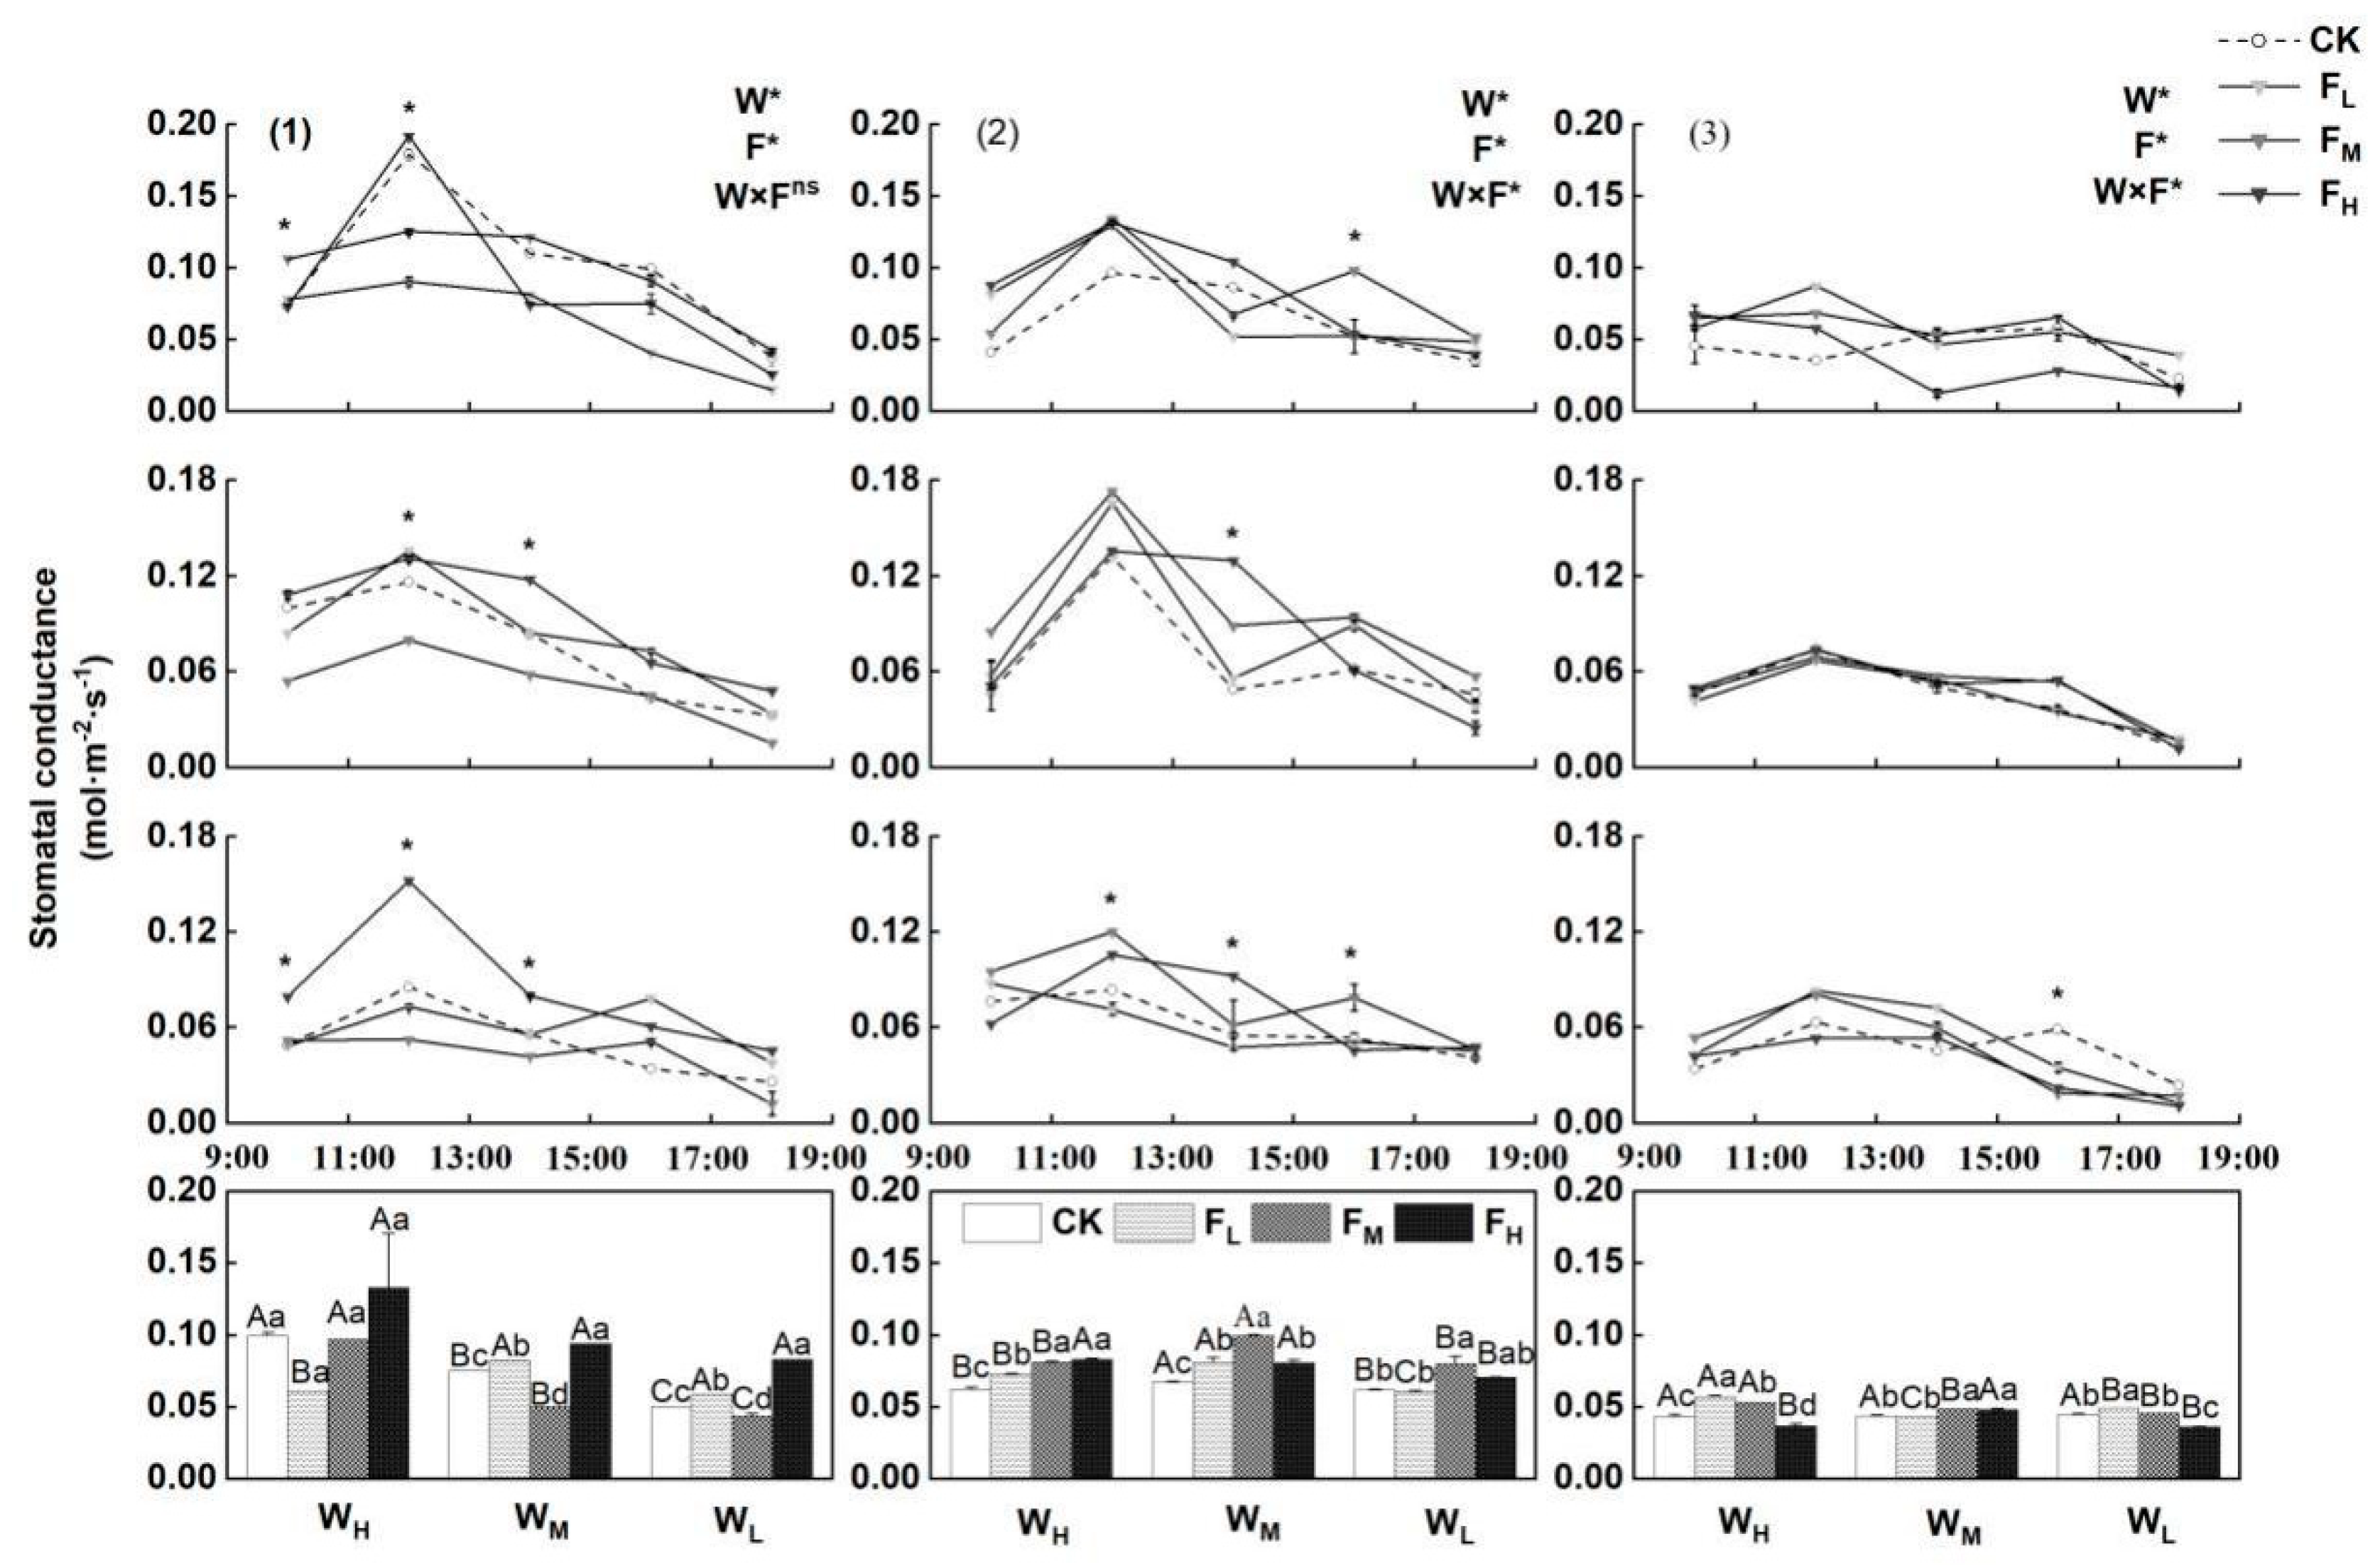
Water and fertilizer exerted effects on the Gs of P. crymophila, F. coelestis and S. purpurea. Different water and fertilizer conditions led to significant differences in the Gs values of P. crymophila, whereas the differences in the effects of water–fertilizer interactions were not significant. For F. coelestis and S. purpurea, the effects of water, fertilizer, and their interactions on Gs were significantly different (p < 0.05).
For P. crymophila, under the WH and WL conditions, the Gs values obtained after the FH treatment were higher than after the other treatments, with the Gs values being 55.6% and 78.8% higher than that of the CK, respectively. For F. coelestis, under the WH and WL conditions, the daily dynamic changes in the Gs values exhibited a double-peak pattern under the FM treatment. The peak values occurred from 11:00−13:00 and 15:00−17:00 and were higher than those of the other treatments, with the values being 39.4% and 43.5% higher than that of the CK, respectively. Under other treatments, the Gs values exhibited a single-peak pattern. For S. purpurea, the Gs values exhibited quite similar trends under different treatments. Under the WH and WL conditions, the peak values under the FL treatment occurred from 11:00−13:00 and 15:00−17:00 and were higher than those found with other treatments. Under the WH condition, the Gs value obtained under the FL treatment was 57.7% higher than that found under the CK. Under WM treatment, fertilizer application had a smaller effect on the Gs values.
The effects of different water−fertilizer treatments on daily average Gs values differed significantly following the various treatments. In P. crymophila and F. coelestis, under the WH condition, the daily average Gs value observed under the FH treatment was higher than those observed under other treatments. Under the WM and WL conditions, the trends in the daily average Gs values of P. crymophila were identical, with the daily average Gs being highest after FH treatment and 24% and 66% higher than that of the CK, respectively. The daily average Gs value attained under the WHFM condition was 92.2% and 122.0% higher than those attained after the WMFM and WLFM treatments, respectively. For F. coelestis, the highest daily average Gs value under the FM condition was 47.8% and 29.0% higher than that of the CK, respectively. Under identical fertilizer application levels, the daily average Gs values of P. crymophila and F. coelestis decreased in the following order of water content levels: WH > WM > WL and WM > WH > WL, respectively. In S. purpurea, the Gs values exhibited identical trends under the WH and WL conditions. Under the WH condition, the highest daily average Gs value observed after the FL treatment was 34.3% higher than that of the CK. Under identical fertilizer application levels, the daily average Gs values observed after the FL treatment were in the following order: WH > WL > WM, with these differences being statistically significant. Under the FH condition, the daily average Gs values found after the WM treatment were 32.4% and 36.1% higher than those observed after the WH and WL treatments, respectively (p < 0.05; Figure 5).
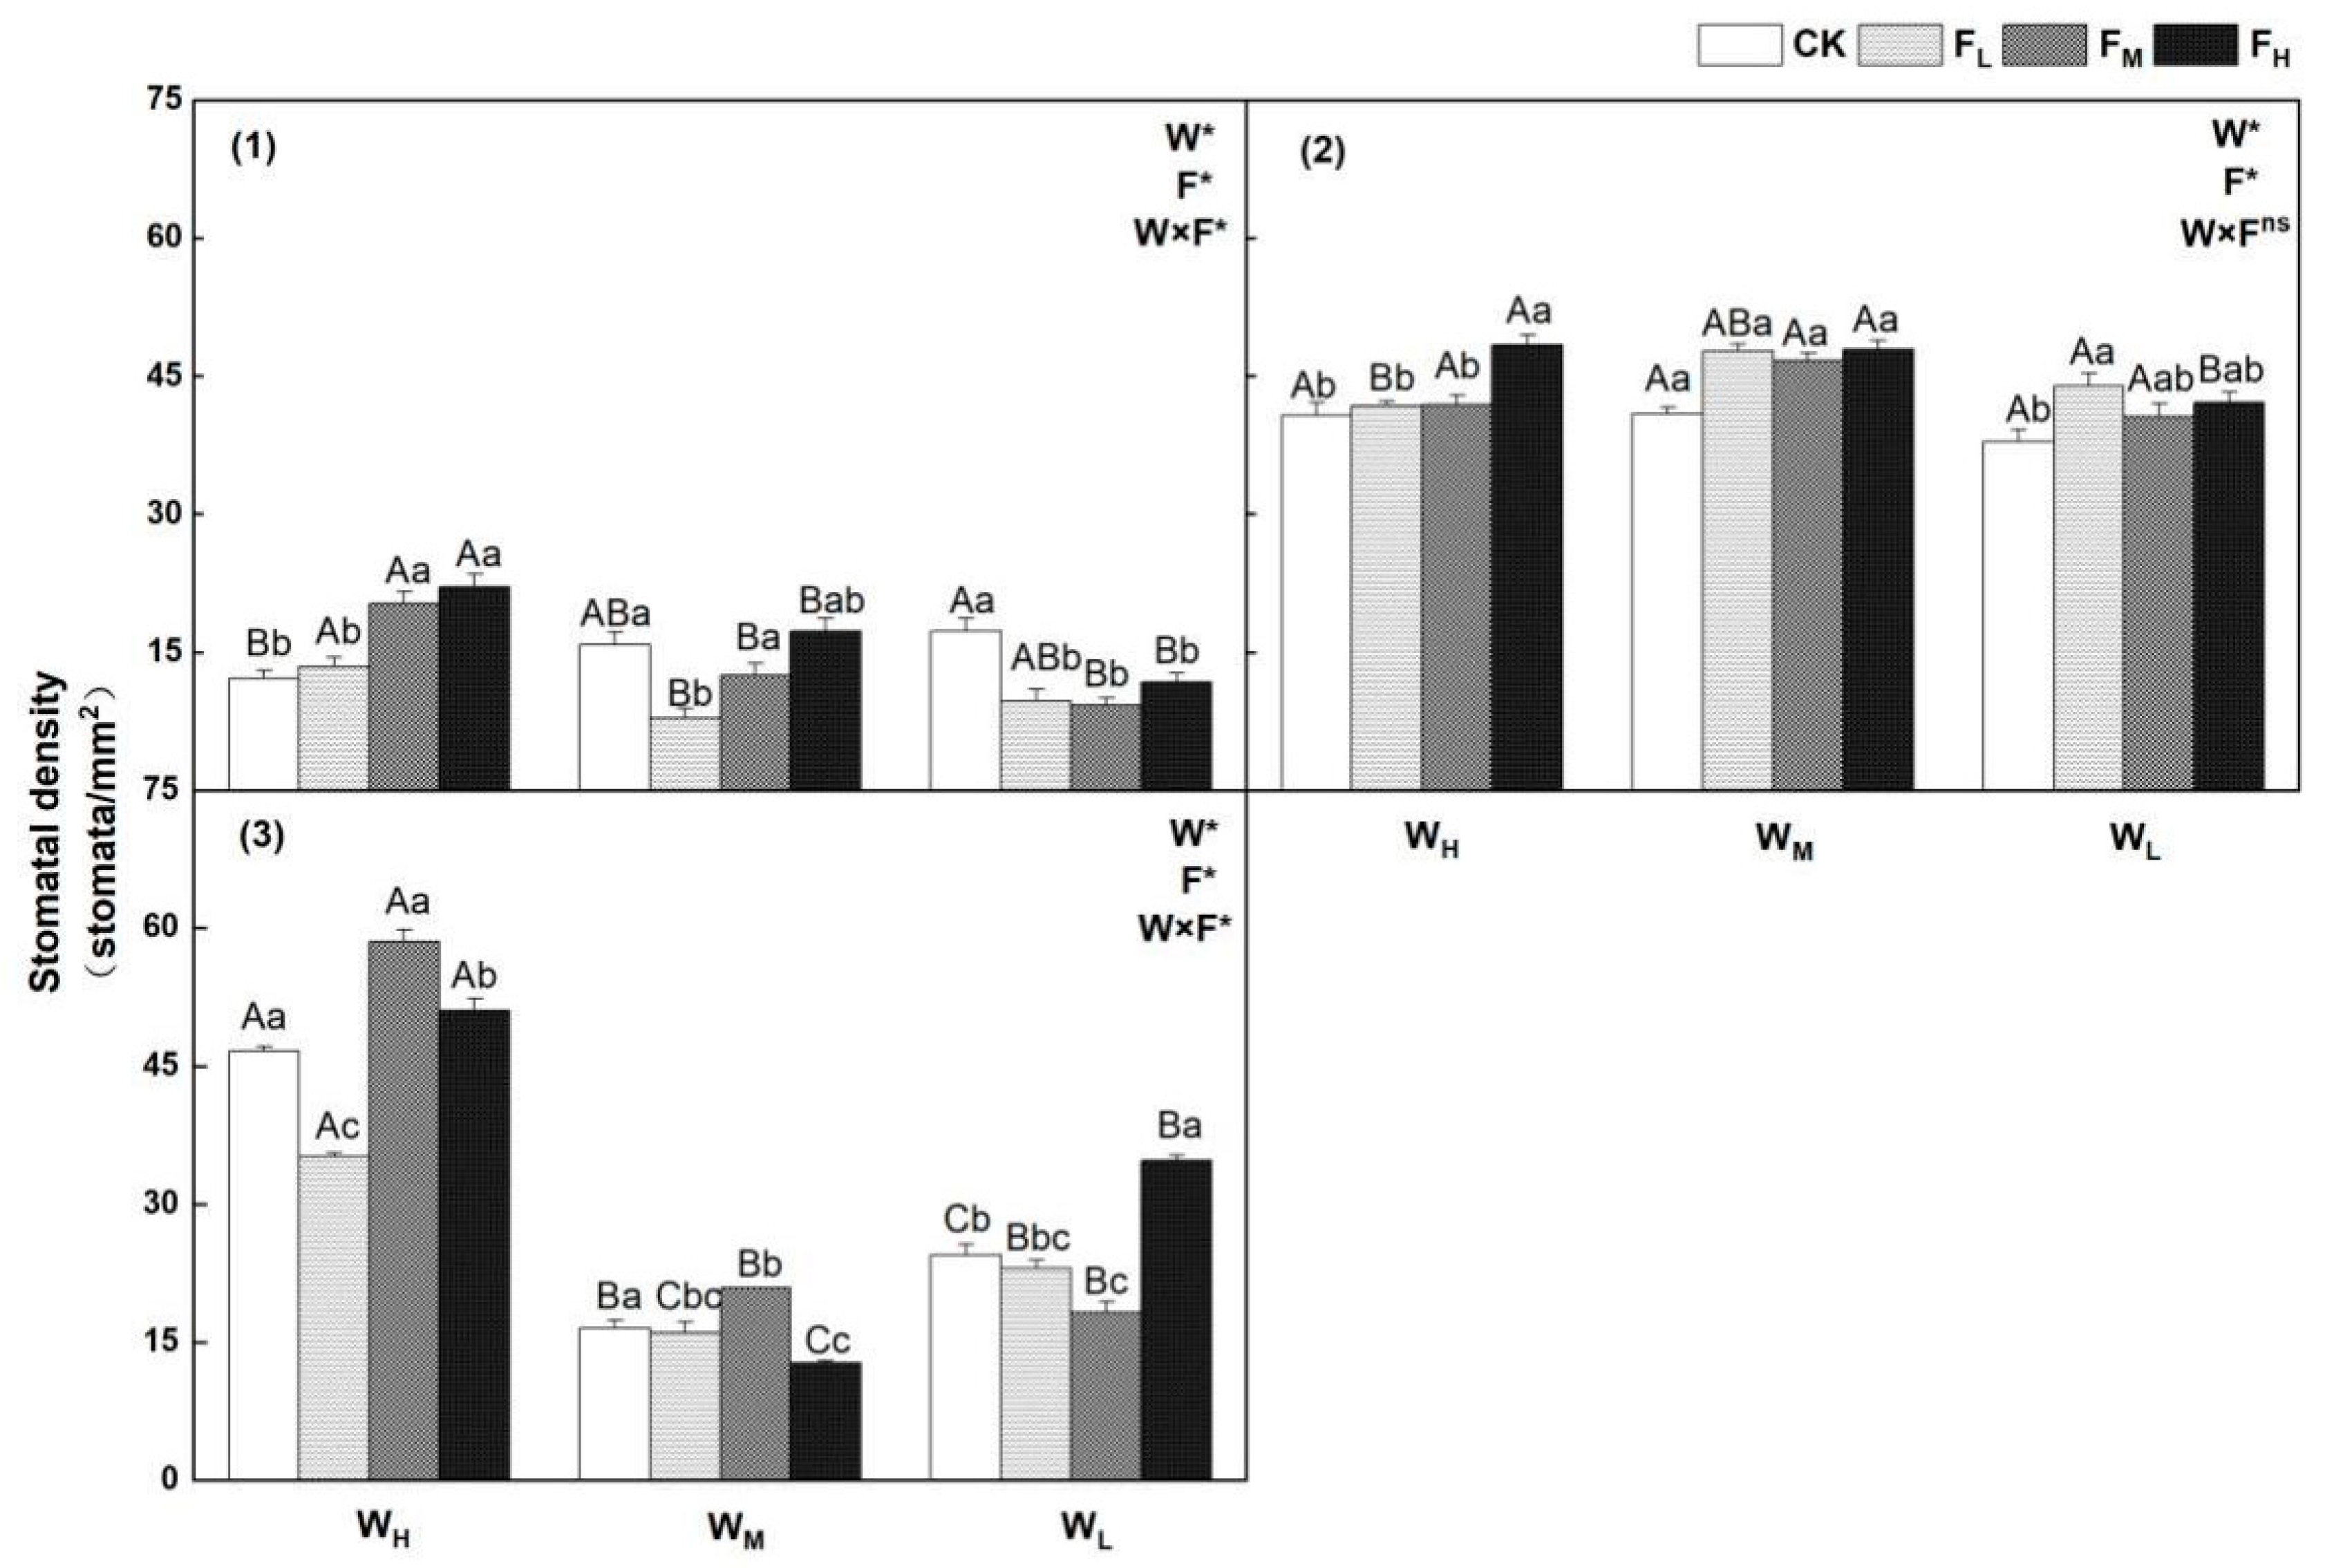
Water−fertilizer treatments exerted different effects on the stomatal frequency of the three species. The effects of water, fertilizer, and their interactions on the stomatal frequency were significantly different between P. crymophila and S. purpurea. For F. coelestis, the effects of water and fertilizer were significantly different (p < 0.05), whereas the effects of water–fertilizer interactions were not significant. In P. crymophila and F. coelestis, under the WH condition, the stomatal frequencies found under the FH treatment were 81.4% and 18.7% higher than those of the CK, respectively. Under conditions of identical fertilizer application levels, the stomatal frequency was highest under the WL treatment (versus that of the CK) but highest under the WH treatment under all other fertilizer application conditions. For F. coelestis, under the WL condition, the stomatal frequency found after the FL treatment was 15.8% higher than that found in the CK. Under identical fertilizer application level conditions, the stomatal frequency values generally decreased in the following order in terms of water content levels: WM > WH > WL. For S. purpurea, under the WH and WM conditions, the stomatal frequency was highest after the FM treatment. Under the WL condition, the stomatal frequency found after the FH treatment was 42.0% higher than that of the CK. Under conditions of identical fertilizer application levels, the stomatal frequency was always highest after WH treatment (Figure 6).
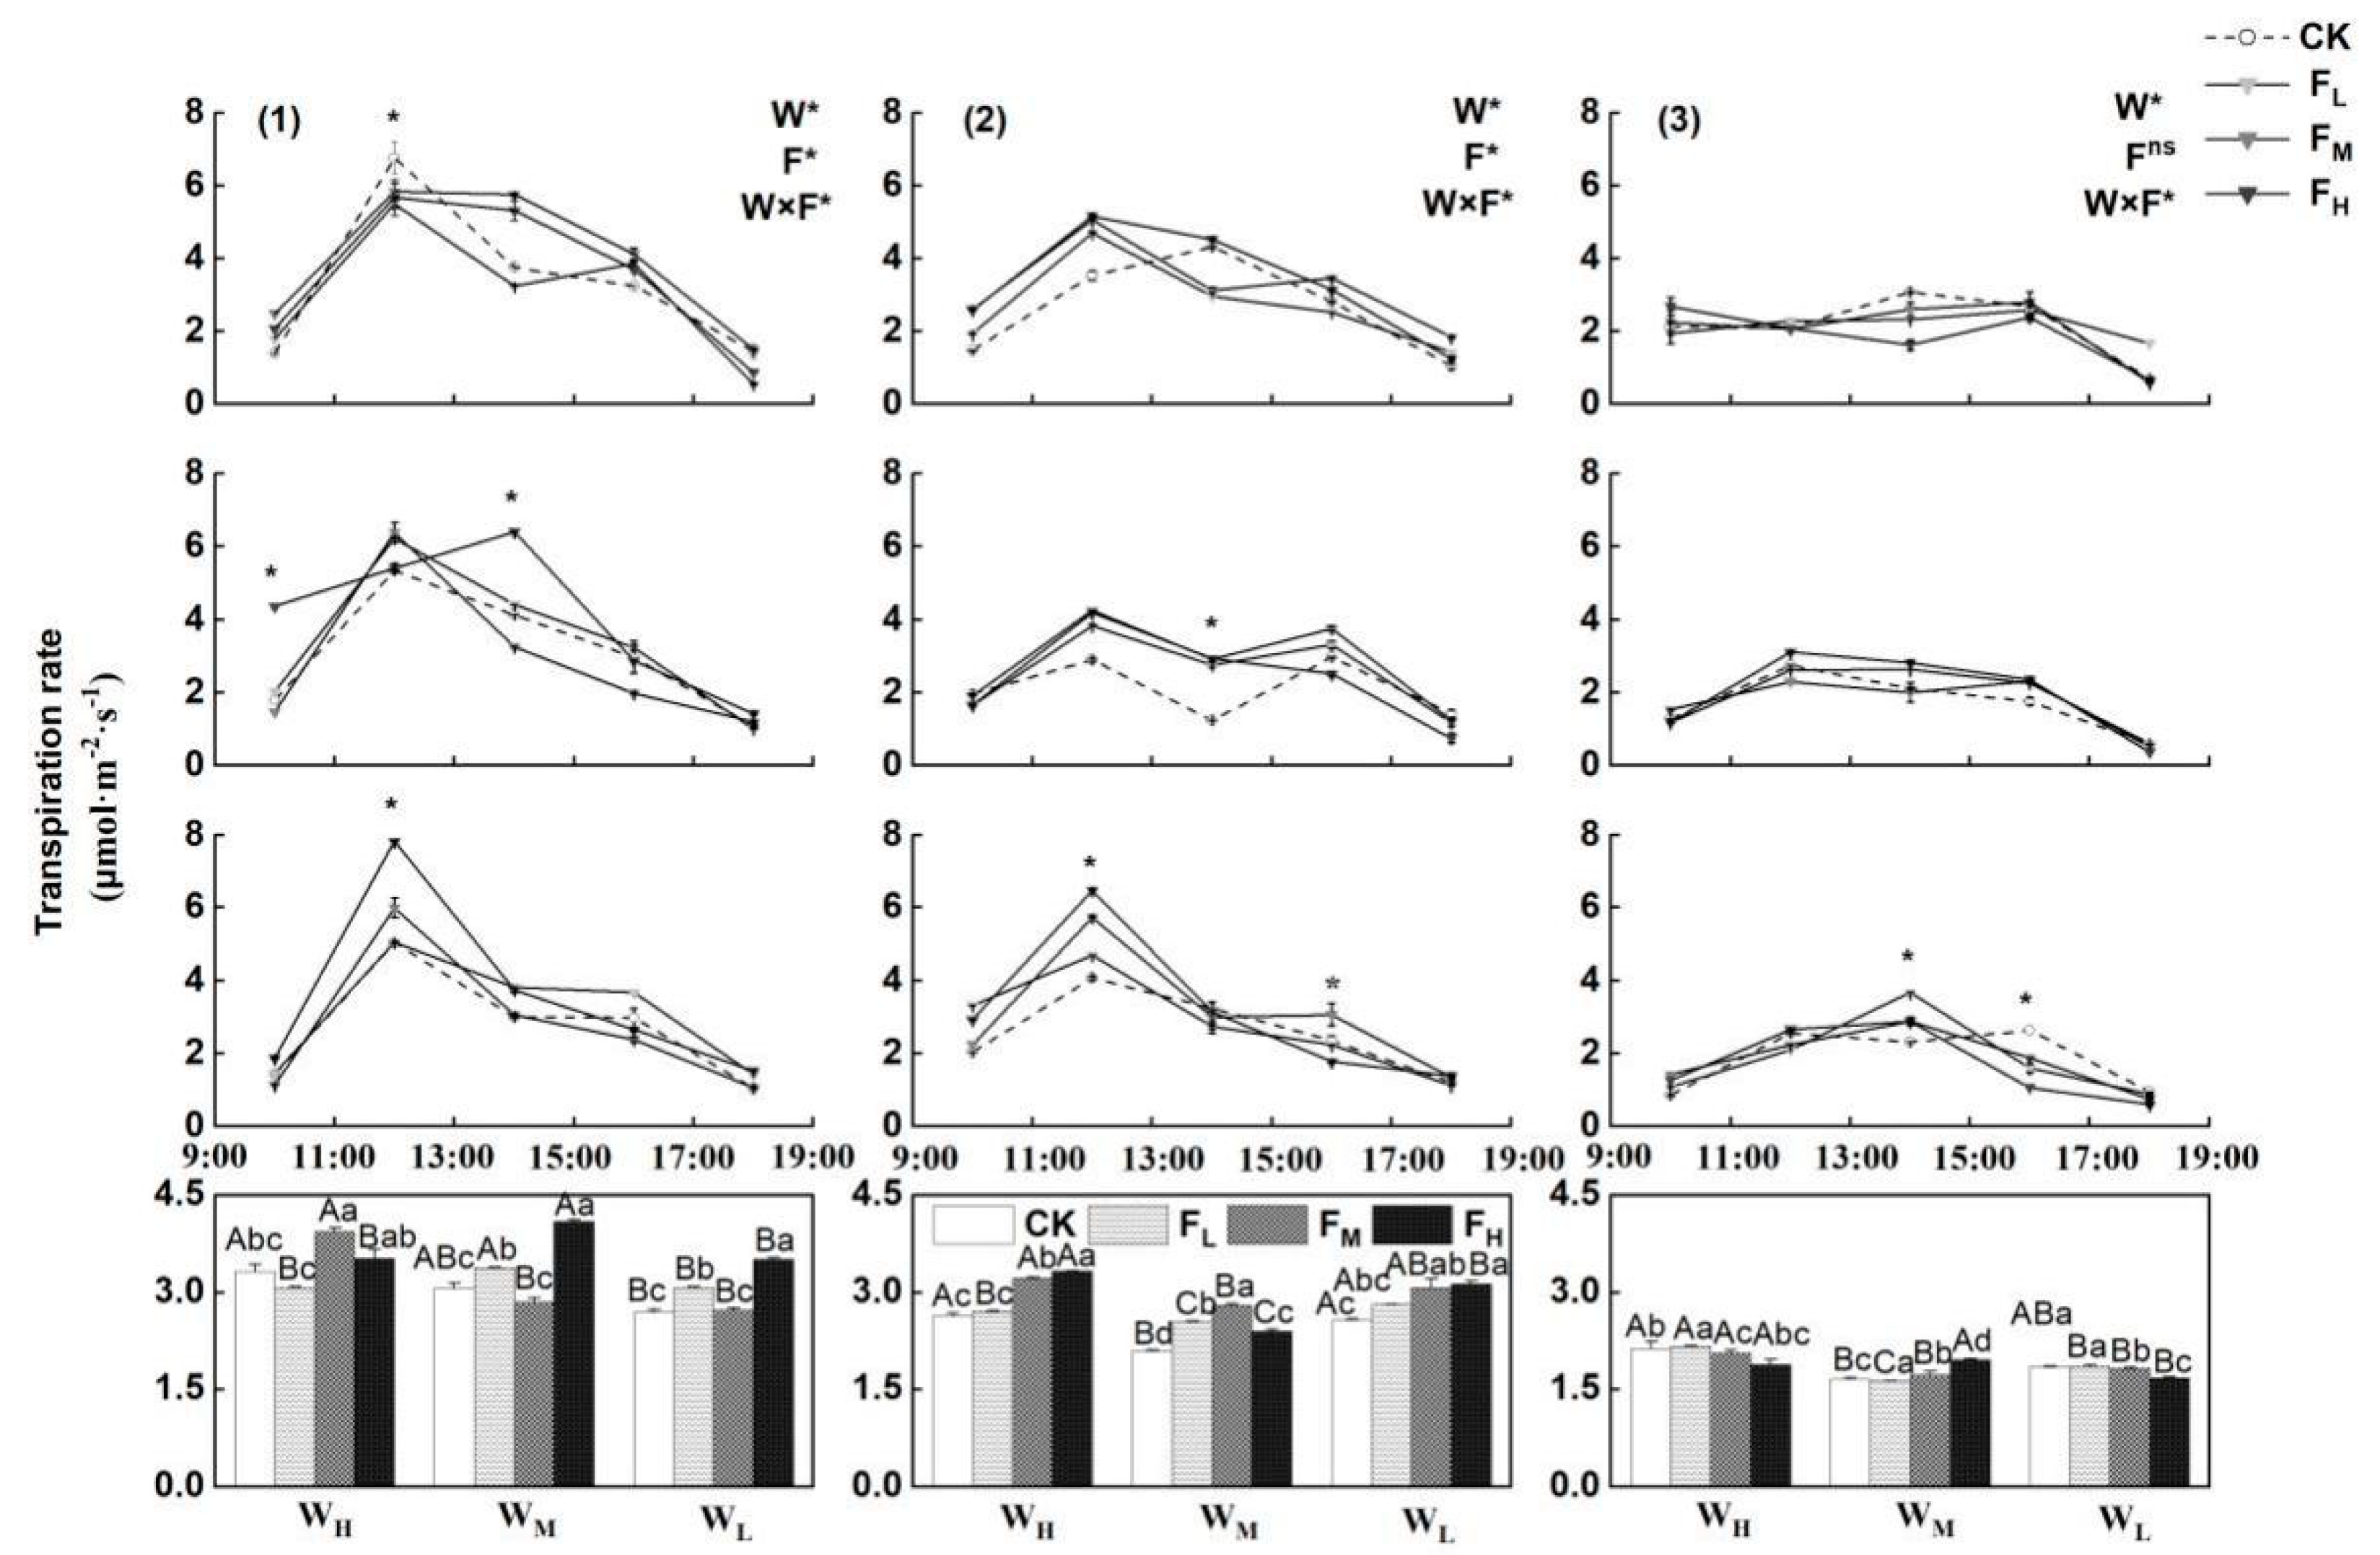
Different water−fertilizer treatments affected the Tr values of P. crymophila, F. coelestis, and S. purpurea. Water, fertilizer, and their interactions significantly affected the Tr values of P. crymophila and F. coelestis. For S. purpurea, water and water–fertilizer interactions caused significant differences in the Tr values (p < 0.05), whereas different fertilizer conditions did not significant affect the Tr values.
Under the WH and WL conditions, the daily dynamic changes in the Tr values of P. crymophila and F. coelestis generally exhibited a single-peak pattern. Under the WLFH condition, the peak Tr value that occurred from 11:00−13:00 was significantly higher than those of the other treatments, which showed 55.4% and 59.6% higher Tr values than the CK, respectively. At the WM water content level, the Tr value of F. coelestis showed a double-peak pattern, and the Tr values observed with other treatments were higher than that of the CK. Under different water content levels, the Tr of S. purpurea generally exhibited a single-peak pattern, with the respective peak values occurring from 11:00−13:00, 13:00−15:00, or 15:00−17:00. The Tr value was highest after the WLFL treatment, with the value being 39.4% higher than that of the CK (p < 0.05). The effects of fertilizer treatment on the daily average Tr value differed across different water-treatment conditions. For P. crymophila, under the WM and WL conditions, the daily average Tr values observed under the FH treatment were higher than those of the other treatments, with the Tr values increasing by 33.7% and 30.9%, respectively, compared with that of the CK. Under the WH condition, the daily average Tr values decreased in the following order in terms of the fertilizer application level: FM > FH > CK > FL, with the Tr values of the CK and FM groups under the WH and WM conditions being significantly different from those under the WL condition. Under the FL and FH conditions, the daily average Tr value found after the WM treatment differed from those after the WH and WL treatments. For F. coelestis, the daily average Tr increased with an increasing fertilizer application level under the WH and WL conditions, with the value observed after the WHFH treatment being 26.1% higher than that under the CK. Under the WM condition, the daily average Tr value was highest after the FM treatment and differed significantly from the values found after the other treatments. For S. purpurea, the effect on the daily average Tr was higher for the CK than for the other treatments under the WH and WL conditions. The daily average Tr was highest after the FH treatment under the WM conditions, being 17.4% higher than the CK (p < 0.05). Under the CK, FL, and FM conditions, the daily average Tr value decreased in the following order in terms of the water content level: WH > WL > WM. Under the FH condition, the daily average Tr value was highest in the WM group (Figure 7).
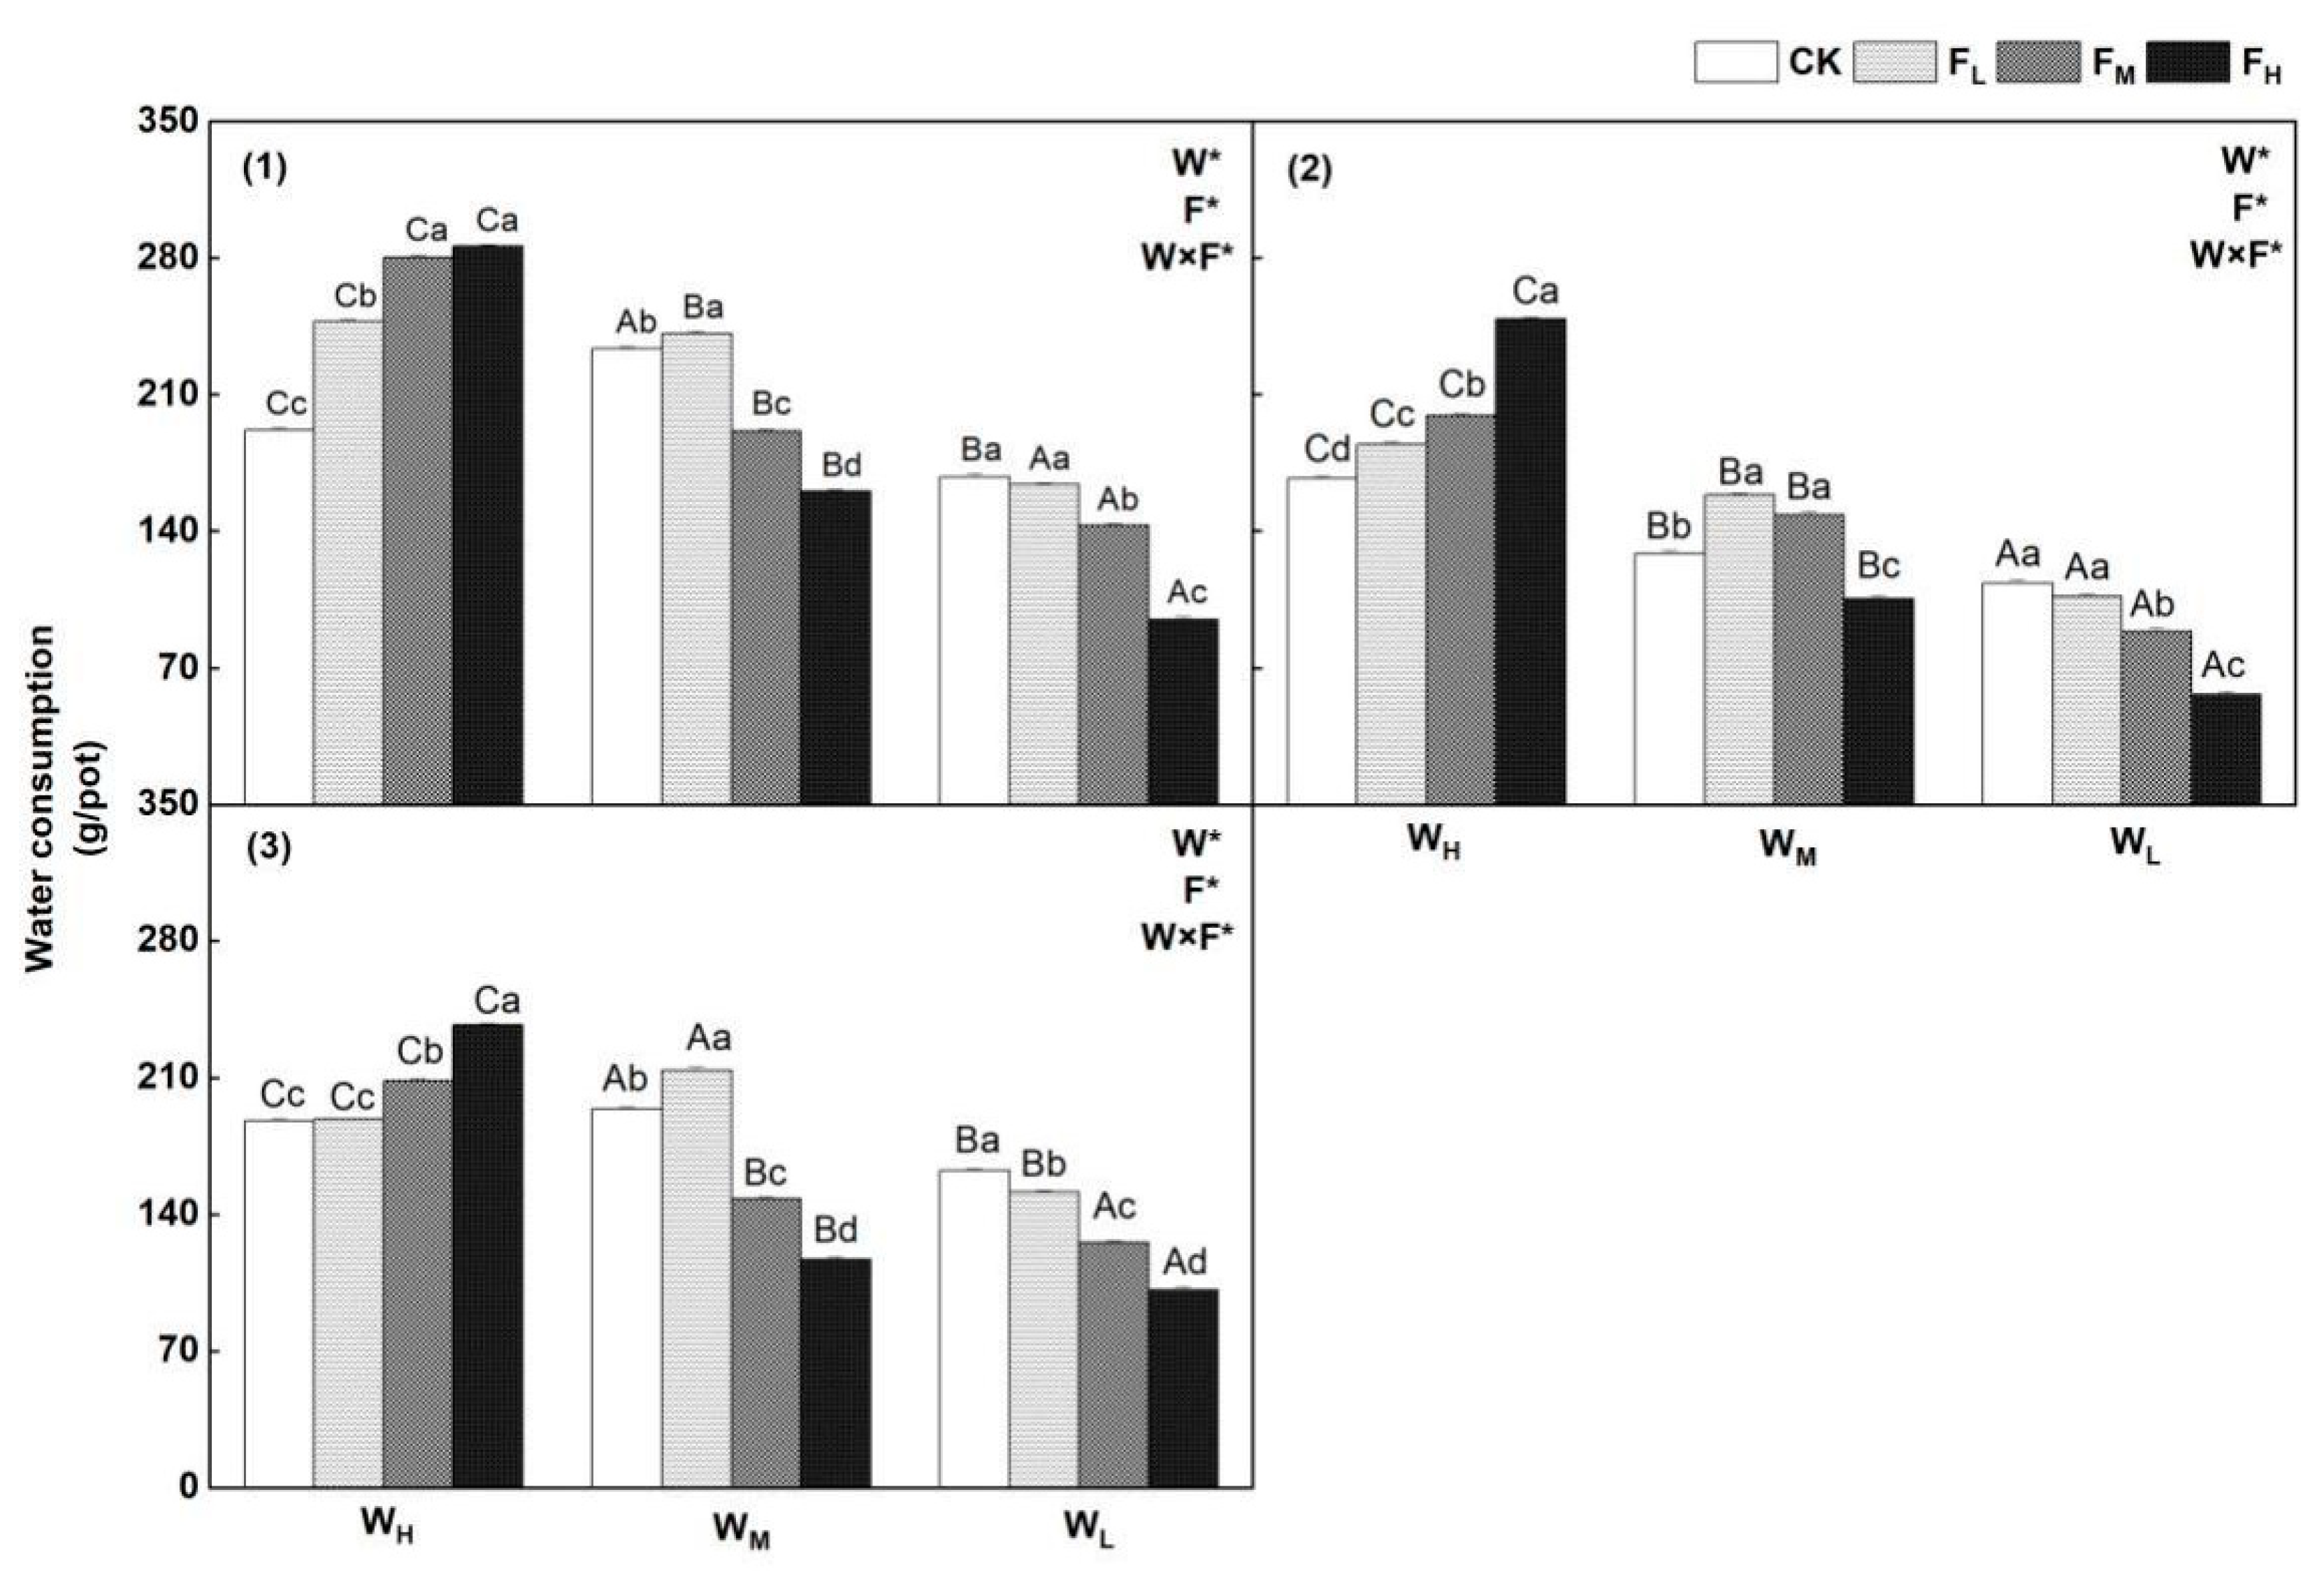
Water consumption of the three species decreased when the water content level decreased. With an increase in the fertilizer application level, water consumption increased under the WH treatment and decreased under the WM and WL treatments. The water consumption levels of P. crymophila, F. coelestis, and S. purpurea were 200.2 g/pot, 142.3 g/pot, and 169.9 g/pot, respectively, with the water consumption of P. crymophila being the highest of the three species.
In P. crymophila, under the WH condition, water consumption after the FH treatment was 49.2% higher than that of the CK. If water consumption under the WM treatment was set to 100%, then water consumption under the CK at the WH and WL water content levels would be 78.2% and 60.9%, respectively. The corresponding water consumption values under the FL, FM, and FH treatments would be 102.7% and 53.1%, 146.2% and 66.2%, and 178.1% and 31.0%, respectively. For F. coelestis and S. purpurea, under the WH condition, water consumptions after the FH treatment were 49.0% and 25.9% higher than that under the CK, respectively. Under an identical fertilizer application level, the water consumption of F. coelestis significantly decreased (p < 0.05) with decreasing water content levels (Figure 8).
Water–fertilizer treatments affected the WUE of P. crymophila, F. coelestis, and S. purpurea. The effects of water, fertilizer, and their interactions on the WUE were significant for S. purpurea and F. coelestis (p < 0.05). For P. crymophila, the effects of water and water–fertilizer interactions on the WUE were significant, whereas the effects of different fertilizer levels were not significant.
For P. crymophila, under the WH and WM conditions, the WUE exhibited a double-peak pattern under the FH treatment and a single-peak pattern under all other treatments. Under the WHFL treatment, the peak WUE value from 17:00−19:00 was higher than that of other treatments and was 46.1% higher than that of the CK. For F. coelestis, the daily dynamic trends of the WUE were generally identical under the WH and WM conditions, indicating that variations in the fertilizer application had a small effect on the WUE. Under the WLFH treatment, the peak value occurring from 15:00−17:00 was 85.4% higher than that under the CK. For S. purpurea, under the WH and WL conditions, the WUE exhibited a generally identical double-peak pattern, with peak values occurring from 11:00−13:00 and 15:00−17:00. Water–fertilizer treatments had a smaller effect under the WM condition. Differences were found in the effects of different water–fertilizer treatments on the daily average WUE. For P. crymophila, under the WH condition, the daily average WUE with FH treatment was 34.5% higher than that with FM treatment; under the WL condition, the effects of various treatments were relatively small; under the FH condition, the WUE observed with WH treatment was 47.3% higher than that found with WM treatment. For F. coelestis, the daily average WUE generally increased with increasing fertilizer application levels. The highest daily average WUE was attained under the WMFH treatment, which was 47.2% higher than that under the CK. Under an identical fertilizer application level, the daily average WUE values decreased in the following order in terms of the water content level: WM > WL > WH. For S. purpurea, under the WL condition, the daily average WUE increased with increasing fertilizer application levels, with the WUE value being 31.1% higher under the FH treatment than under the CK (p < 0.05). Under the CK and FL conditions, the daily average WUE was highest under the WM treatment. Under the FH and FM conditions, the daily average WUE decreased in the following order in terms of the water content level: WL > WM > WH (Figure 9).
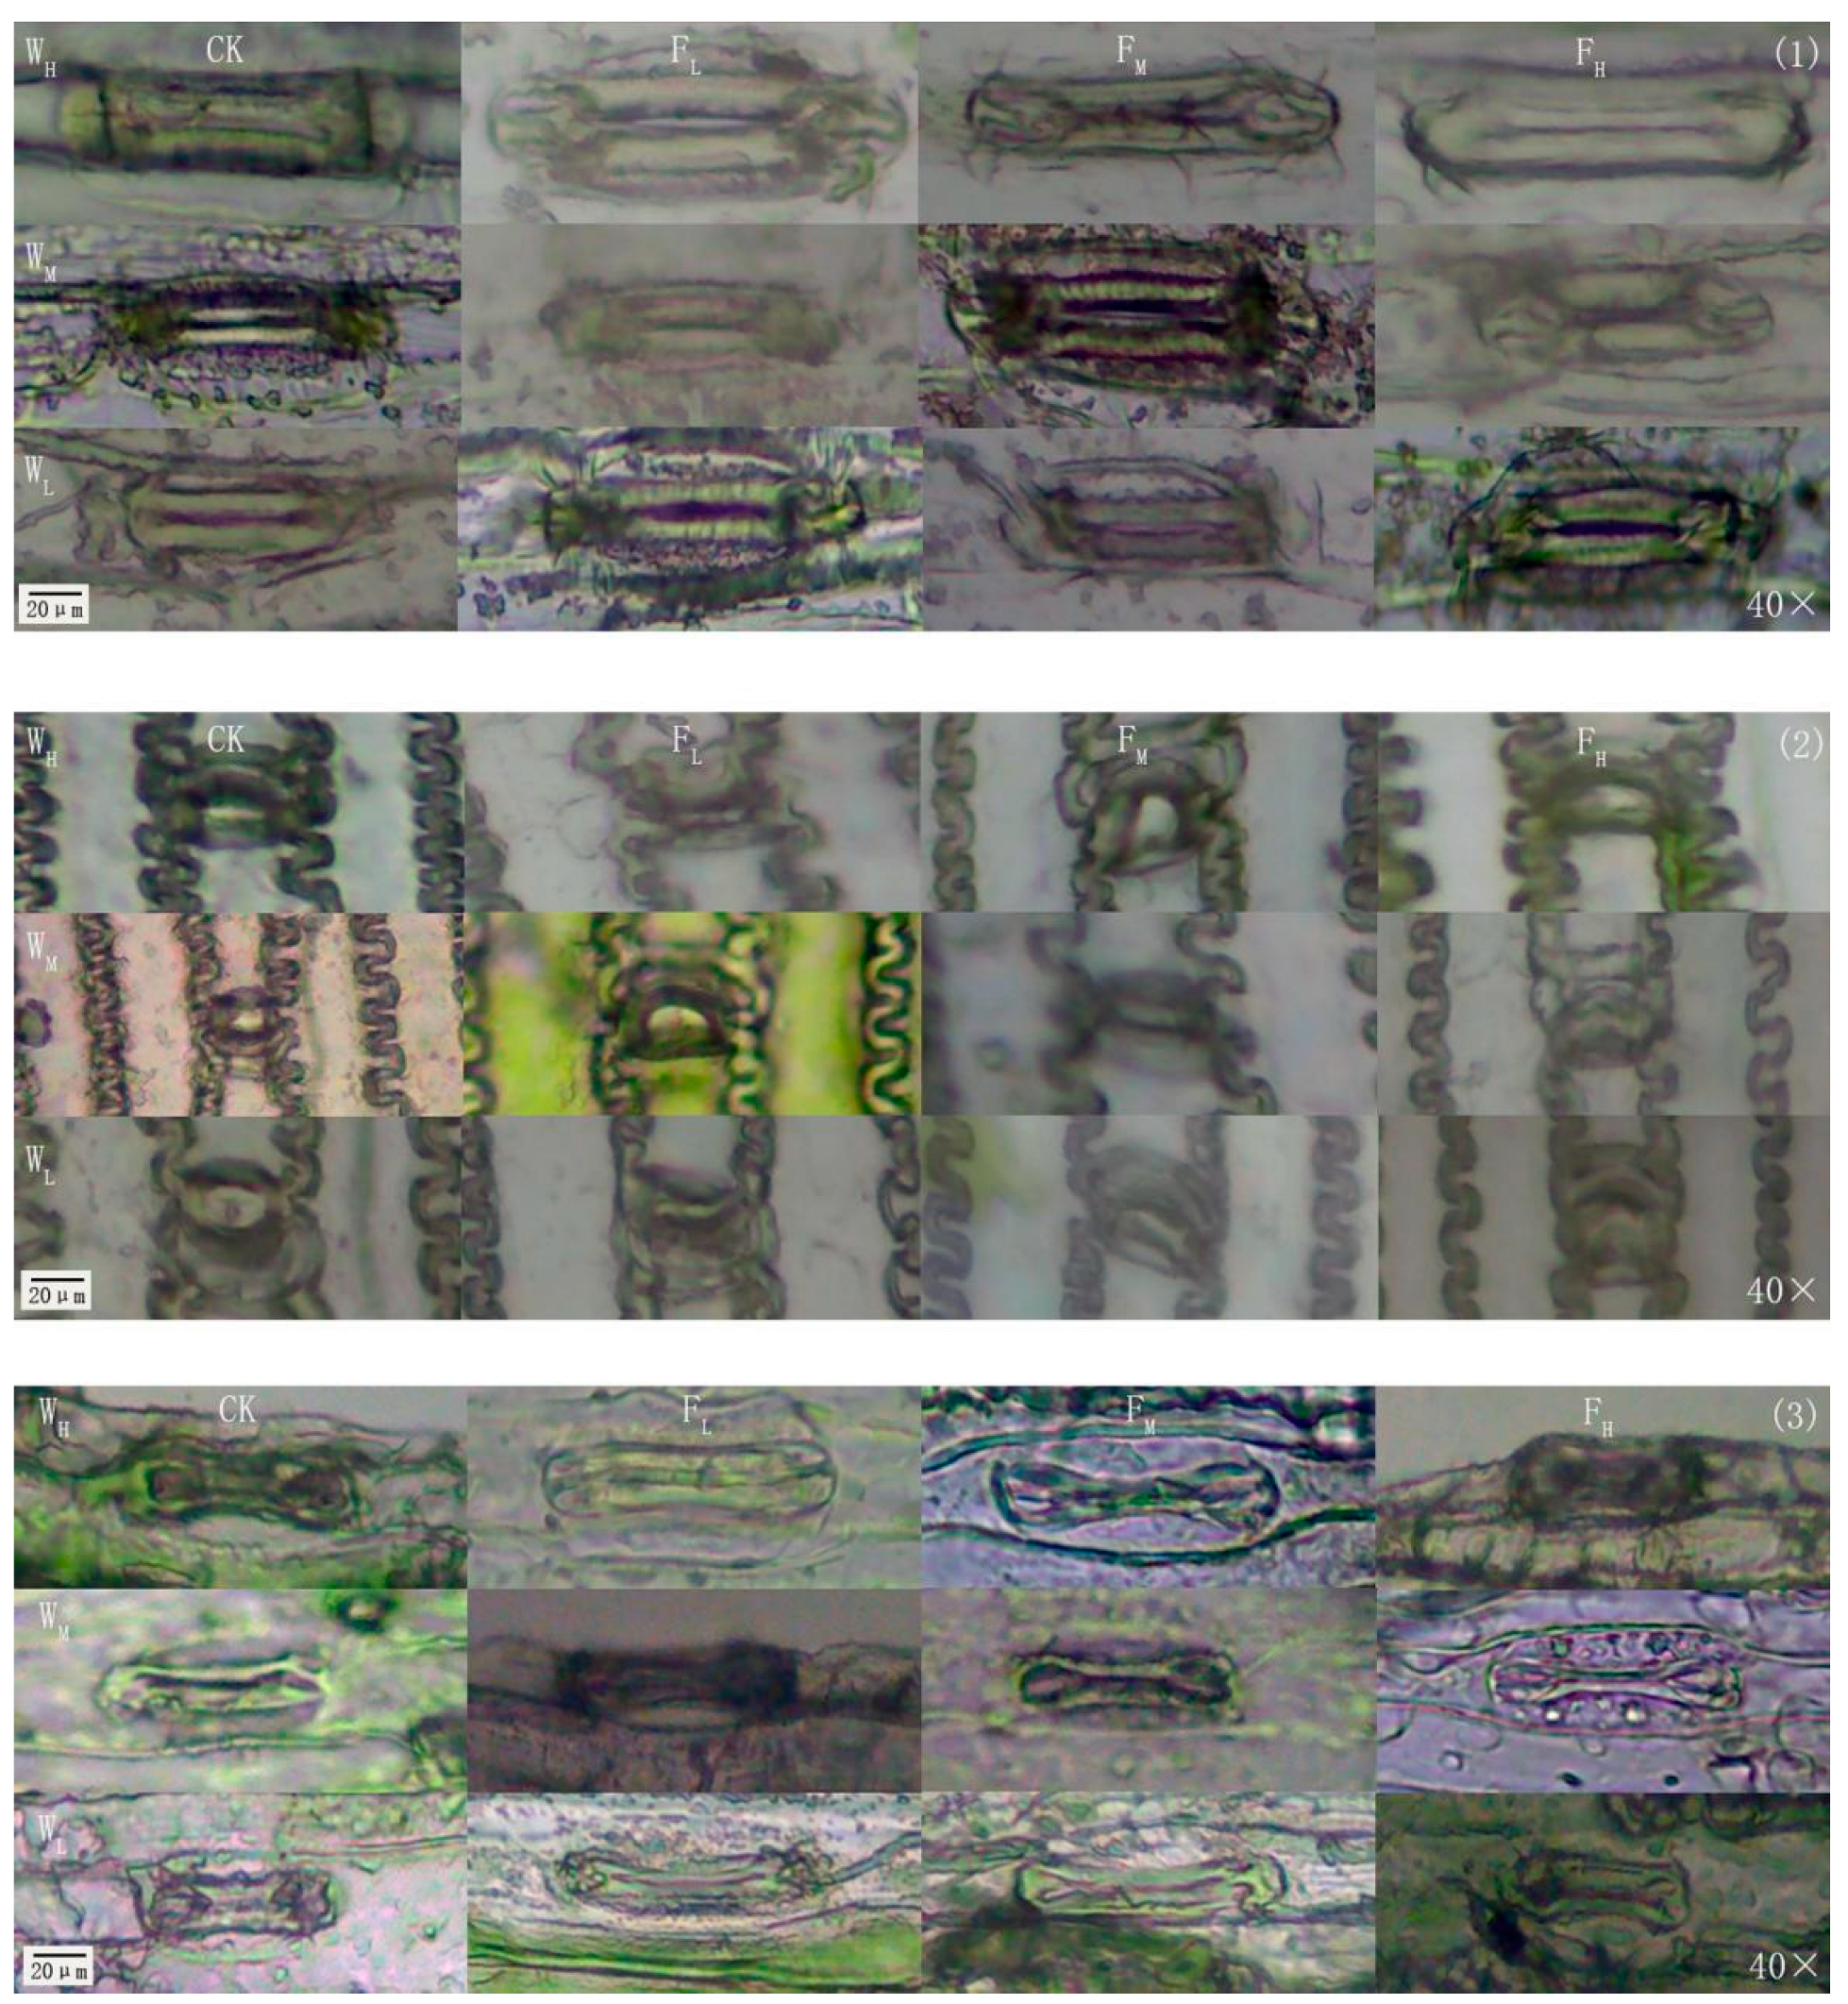
The stomatal sizes of the three species were the largest under WH. Specifically, stomatal sizes decreased with the stress of water deficiency for all P. crymophila plants under fertilizer treatments, F. coelestis under FM and FH, and S. purpurea under the CK condition. The stomatal size of P. crymophila increased with the application rate of fertilizer, whereas F. coelestis and S. pupurea had little effect (Figure 10).

4. Discussion

4.1. Effects of Different Water−Fertilizer Treatments on the Biomass

Different water–fertilizer conditions effectively increased the aboveground biomass, with the biomass of P. crymophila being higher than those of the other two species. The leaf number and leaf thickness of the three species generally decreased with reductions in the water content level, consistent with the trend exhibited with the aboveground biomass. Therefore, it is evident that the increase in aboveground biomass was limited by water conditions. This conclusion is consistent with the results reported by Zhang [28] in a study on Puelia sinese Roxb conducted on the Sichuan Plateau, which may be ascribed to the fact that plants invest less in stems and leaves under conditions of drought [29,30]. For F. coelestis and S. purpurea, appropriate fertilizer application under drought stress favored an increase in the aboveground biomass. However, an increase in the fertilizer application level increased the osmotic potential of water, leading to a reduced nutrient absorption ability of plants that ultimately resulted in a lower plant biomass. The root weight differed after the WH and WM treatments. The root weight for all S. purpurea plants with added fertilizer was higher than that of the plants under the CK, which demonstrates that fertilizer application enabled better nutrient absorption and transport to other plant parts [31]. For F. coelestis, under the WM condition, only the root weight observed after FH treatment was higher than that after the CK. Under the WL condition, the root weight values of all treatment groups were higher than those of the CK.
These findings indicate that under drought conditions, the assimilated materials generated in the aboveground parts of plants were mainly transported to the belowground parts, thereby promoting root growth. Consequently, water absorption by roots was enhanced, which benefited the adaptation of plants to drought stress. Compared with the other two species, P. crymophila exhibited greater differences after the WM and WL treatments. Under the WM condition, fertilizer application led to decreasing trends in aboveground biomass and in the root weight, which further exemplified the existence of a parallel relationship, i.e., biomass accumulation and allocation are characteristics of environmental adaptation in plants [32]. Under the WL treatment, drought stress may have caused a decrease in antioxidant enzyme activities in the plants [33], which can affect the metabolic ability. Consequently, most assimilated materials in the aboveground parts were not transported to the belowground parts, which lowered the biomass.

4.2. Effects of Different Water−Fertilizer Treatments on the Pn, Leaf Number and Leaf Thickness

Photosynthesis in leaves is a basic physiological process of plants [34], and both water and fertilizer significantly affect the physiological characteristics of growth, development, and photosynthesis in plants [35]. Photosynthesis is affected through the effects exerted on multiple factors such as the stomata [36] and photosynthetic pigment content [37]. Such changes in turn affect the leaf number, leaf thickness, and biomass accumulation of plants, which are indirect manifestations of the Pn value. An increase in the leaf number leads to an increased total plant area that is capable of receiving light energy; with the increase in leaf thickness, stomata and palisade cell layers become common on both leaf sides, thereby broadening the zone of light and CO2 inside the leaf and increasing the amount of photosynthesis per unit leaf area [38]. Under drought stress, plant roots absorb less water and photosynthetic activity is reduced. However, these changes can be regulated to a certain extent through changes in soil nutrients [39]. Our results indicate that different water–fertilizer-coupling combinations exerted significant effects on the Pn values of all three species, which agrees with previous findings [40]. The Pn of P. crymophila was more sensitive to changes in water−fertilizer treatments than the other two species and exhibited a larger range in peak values with various treatments under the WH and WL conditions. This may be explained by the fact that suitable water content conditions contribute to an increase in the Gs value, which in turn causes an increase in the Pn value [41]. With aggravated water deficiency stress, the original double-peak pattern exhibited by the daily dynamic changes of Pn of F. coelestis changed to a single-peak pattern. This outcome may be related to the decrease in Gs under drought conditions, which increased photosynthesis and alleviated midday depression. The daily average Pn value was highest under the WHFH treatment for P. crymophila and F. coelestis and under the WHFL treatment for S. purpurea. These findings may reflect the response of S. purpurea under adverse habitat conditions.
Our findings further demonstrate differences in the adaptability of the three plant species under different water and fertilizer conditions. Reasonable water and fertilizer conditions can improve the water contents of crops, enhance the ability of plants to regulate the osmotic potential and stomata, and increase the photosynthesis rate [42,43]. The leaf number and leaf thickness of the three species were largest under the WHFL treatment and decreased in all fertilizer treatment groups with lower water and fertilizer contents. These results demonstrate that photosynthesis in plant leaves is not clearly associated with the leaf number but is related to the chloroplast number and photosynthetic rate. Both P. crymophila and F. coelestis possess more tillers and leaves and shading is largely prevalent and reduces the number of plant cells and causes leaf thinning during leaf growth [44]. Thinner leaves contain thinner palisade tissue and fewer chloroplasts, which hinders CO2 transport and dissolution [45]. Therefore, thinner leaves do not have strong photosynthetic and biomass accumulation abilities [46]. Compared with the two aforementioned species, S. purpurea exhibited significantly fewer leaves, less shading, and thicker leaves, which increased the photosynthesis efficiency [47].

4.3. Effects of Different Water−Fertilizer Treatments on the Gs, Stomatal Frequency, and Stomatal Size

Stomata are channels through which water and CO2 within plants are exchanged with the external environment. The stomatal size, stomatal frequency, and Gs significantly affect plant transpiration [48]. In general, a decreased stomatal aperture and an increased stomatal density are characteristic plant responses to drought environments [49]. However, the response of the stomatal density to drought is not merely related to the plant type but is also related to the degree of drought stress [50]. The adaptation of stomata to drought is usually manifested as a decreased stomatal size and an increased stomatal density, with consistent lengths and widths or an increased size and sparsity. Our results indicate that the daily average Gs of the three species under different irrigation and fertilizer application conditions were higher than the corresponding CK values. Under identical fertilizer application levels, the Gs decreased with increasing water deficiency, which agrees with previous findings [51]. Stomatal sizes decreased with water deficiency stress for all P. crymophila plants subjected to fertilizer treatment, F. coelestis plants subjected to FM and FH treatment, and S. purpurea plants under the CK condition (Figure 10). As stomatal growth and development were limited by the water content, P. crymophila and S. purpurea plants under CK showed decreasing Gs and Tr values with decreasing stomatal sizes under drought stress, which affected photosynthesis and provided an adaptive mechanism under drought conditions. Similar patterns were observed previously with Arabidopsis thaliana [52]. However, under the FM and FH conditions, the results found for F. coelestis were inconsistent with those found for the other two species. Under drought conditions, the stomatal size decreased but the Tr increased, leading to a decrease in WUE. Therefore, excessive fertilizer application under drought conditions did not attenuate the detrimental effects of water deficiency.
For P. crymophila and F. coelestis, the daily average Gs and stomatal frequency were highest under the WHFH treatment. A higher Gs promotes the greater CO2 uptake into cells, which leads to higher photosynthetic activity. Under the WH condition, the Gs correlated positively with the stomatal frequency. An increased stomatal frequency led to an increased Gs, which facilitated water and CO2 exchange between plant leaves and the external environment, thereby increasing the Pn. Under the WL condition, the daily average Gs was generally low, which was a common adaptation characteristic of both species to drought conditions. The stomatal frequency was not related to the Gs, which may reflect the combined effects of multiple factors such as environmental conditions. For P. crymophila, the Gs exhibited a single-peak pattern under different water–fertilizer treatments, with the peak value decreasing with increasing water deficiency stress. These results indicate that soil water deficiency led to decreased water absorption by roots, which lowered the leaf water contents and led to leaf guard cell shrinkage, ultimately resulting in a decreased Gs [53]. Under identical water content conditions, the daily average Gs was highest under the FH treatment, demonstrating that nitrogen could regulate the Gs, consistent with findings reported by Li et al. [54]. Our findings also showed that the stomatal frequency of P. crymophila decreased with increasing water deficiency stress under all fertilizer treatments (except for CK), which agrees with the Gs results. These data indicate that the P. crymophila leaves exhibited some trait plasticity when adapting to drought stress [55].
Fertilizer application under drought stress led to a significant decrease in the stomatal frequency. This finding may reflect the low stomatal density caused by nutrient limitations imposed by nitrogen on early guard cell development during drought stress [56,57]. The Gs of F. coelestis was highest under the WMFM treatment, which demonstrates that applying an appropriate amount of nitrogen fertilizer under suitable water conditions can contribute to an increased Gs. The stomatal frequency generally increased with added fertilizer under identical irrigation conditions. Although the stomatal frequency was highest under the WHFH treatment, it was also close to the values attained with various fertilizer treatments under the WM condition, which may relate to other factors, such as the environment, temperature, or light intensity. In general, the Gs of S. purpurea was significantly lower than those of P. crymophila and F. coelestis, which may reflect differences in the inherent characteristics of the different species. The rangeability of Gs under the WH and WL conditions was greater than that under the WM condition, indicating that fertilizer applications under WH and WL exerted a greater effect on Gs. The daily average Gs decreased with increasing fertilizer application levels under the WH and WL conditions and was highest under the WHFL treatment. These results show that excessive fertilizer application under adequate water content or drought stress limited the increase in Gs of S. purpurea, which is consistent with previous results reported by Maggard et al. [58]. The relationship between Gs and Pn in S. purpurea was also consistent with the corresponding relationship in P. crymophila. The stomatal frequency also differed depending on the plant type and degree of stress [55]. The stomatal frequency of S. purpurea exhibited a V−shaped trend with decreasing water content. Under the three different water conditions, excessive fertilizer application favored an increase in the stomatal frequency, with the value being highest under the WHFM treatment.

4.4. Effects of Different Water−Fertilizer Treatments on the Tr, Water Consumption and WUE

The soil water content is an important indicator of water and fertilizer use by plants. Soil water is mainly consumed by evaporation, transpiration, and plant absorption. Tr is an essential physiological function of plant leaves, and its relationship with the environment is key for plants to adapt to drought conditions. Our results indicated that the Tr and water consumption values were higher in P. crymophila and F. coelestis and lower in S. purpurea. Under identical water content conditions, total water consumption differed significantly with different fertilizer application levels. In the presence of sufficient water, the water consumption of all three species increased with increasing fertilizer application levels, but the opposite trend was observed under conditions of appropriate water content and drought stress. For P. crymophila, the Tr exhibited a single-peak pattern, and the daily average value was highest under an appropriate water content. These findings indicate that both excessively low and excessively high soil water contents caused decreased transpiration. An excessively low soil water content causes plant roots to generate signals that are subsequently transmitted to leaf stomata, which promotes decreased Gs and transpiration levels. When the soil water content is excessively high, the air permeability of soil becomes poorer, and the decreased root respiration reduces the water absorption capability of roots, thereby reducing transpiration [59]. Water consumption and the WUE were highest under the WHFH treatment, indicating that fertilizer application in the presence of an appropriate water content can enhance the ability of plants to regulate osmosis. In particular, the application of nitrogen fertilizer significantly reduced the Tr and increased the WUE [60].
The peak Tr value of F. coelestis changed significantly under different water content conditions. As the water content decreased, the Tr trend generally exhibited a double peak−single peak−double peak transition. The daily average Tr values under the WH and WL conditions were higher than those under the WM condition, which did not correlate positively with changes in the Gs, in contrast to the findings of Liu [61]. Our findings may have been due to changes in the atmospheric evaporative demand and soil water content, leading to changes in leaf water potential and a lack of effective regulation of the plant stomata. A decreased soil water content promotes abscisic acid synthesis in plant roots, which is transported to leaves via the water transport route and induces stomatal closure [62]. The highest daily average Tr value was attained under the WHFH treatment, which is consistent with the highest water consumption value observed under the same treatment. These data show that water consumption and transpiration were highest for F. coelestis with a sufficient water content, which led to an increase in the Pn value.
For S. purpurea, the rangeability of the daily dynamic changes of the Tr value was smaller under identical water content conditions. The daily average Tr value was highest under the WHFL treatment, which is consistent with the highest Pn and Gs values being observed under the same condition. Such a result indicates that the transpiration rate was largely determined by the state of stomatal activity and that fluctuations in stomatal activity were caused by plant adaptation to the water content state [63], which is consistent with the findings of Qiao [64]. The daily average WUE under the WL condition was generally higher than that under the WH condition, which is consistent with the results reported by Jaleel [65]. Given that the Gs value decreased in plants under water deficiency stress, which caused a decreased transpiration rate and increased WUE, our results demonstrate the adaptability of plants to adversity. However, a higher WUE under drought conditions is not favorable for increased production, as an increased WUE contributed to a reduction in yield. Drought stress severely inhibits plant growth and reduces water consumption, thereby causing a relative increase in the WUE [66].

5. Conclusions

Drought and nutrient deficiency has become a serious ecological problems in the alpine grassland of the Qinghai−Tibet Plateau. Our results showed that drought stress reduced the biomass of test plants via limiting photosynthesis and water use, but the influence could be mitigated by nitrogen addition through a complementary effect owing more on photosynthesis than to water−related traits. The test plants displayed different tolerances to environmental stress in biomass production and physiological sensitivity. Specifically, both above- and belowground P. crymophila and S. purpurea were influenced by water−fertilizer interaction. In contrast, the aboveground biomass of F. coelestis was mainly controlled by fertilizer, whereas the belowground biomass was not sensitive. P. crymophila and S. purpurea showed regulatory changes in both photosynthesis and water use, with less stomatal frequency and reduced stomatal size, but the latter had a lower transpiration rate and water consumption; therefore, although the WUE of S. purpurea was higher than that of P. crymophila, it resulted in a lower biomass. With regard to F. coelestis, it is characterized by a stable stomatal size but a higher stomatal frequency; therefore, the water−fertilizer interaction had a larger effect on water consumption than on photosynthesis. Consequently, the three tested species could effectively reduce the risk of establishment failure in ecological restoration with reasonable water−fertilizer combinations. WHFH for P. crymophila and F. coelestis and WHFL for S. purpurea are suitable for the reseeding of the Tibetan Plateau or other alpine regions. This work provides useful information for the sustainable management of alpine grasslands and understanding of the water−nutrient relationship in herbaceous plants in harsh alpine regions.

Author Contributions

Writing−original draft preparation, N.Z.; writing−original draft preparation, data curation, X.S. and S.H.; data curation, software, G.C., H.Z., Y.H. and J.Z.; supervision, validation, writing−review and editing, X.W. and Z.Z. All authors have read and agreed to the published version of the manuscript.

Funding

This work was financially supported by the National Natural Science Foundation of China (42161012); the Fund Project for Central and Local Universities in 2022 (KY2022ZY-01), and the Northwest A&F University & Tibet Agricultural and Animal Husbandry University Collaborative Fund (2452020044).

Institutional Review Board Statement

Not applicable.

Data Availability Statement

Not applicable.

Conflicts of Interest

The authors declare no conflict of interest.

References

  1. Feng, W.; Lu, H.; Yao, T. Drought characteristics and its elevation dependence in the Qinghai–Tibet plateau during the last half-century. Sci. Rep. 2020, 10, 1–11. [Google Scholar] [CrossRef]
  2. Wen, L.; Dong, S.; Li, Y.; Li, X.Y.; Shi, J.J.; Wang, Y.L.; Liu, D.M.; Ma, Y.S. Effect of degradation intensity on grassland ecosystem services in the alpine region of Qinghai-Tibetan Plateau, China. PLoS ONE 2013, 8, e58432. [Google Scholar] [CrossRef] [PubMed] [Green Version]
  3. Zhang, W.; Xue, X.; Peng, F.; You, J.; Hao, H. Meta-analysis of the effects of grassland degradation on plant and soil properties in the alpine meadows of the Qinghai-Tibetan Plateau. Glob. Ecol. Conserv. 2019, 20, e00774. [Google Scholar] [CrossRef]
  4. Xu, M.; Zhang, T.; Zhang, Y.; Chen, N.; Zhu, J.; He, Y.; Zhao, T.; Yu, G. Drought limits alpine meadow productivity in northern Tibet. Agric. For. Meteorol. 2021, 303, 108371. [Google Scholar] [CrossRef]
  5. Dong, S.; Shang, Z.; Gao, J.; Boone, R.B. Enhancing sustainability of grassland ecosystems through ecological restoration and grazing management in an era of climate change on Qinghai-Tibetan Plateau. Agric. Ecosyst. Environ. 2020, 287, 106684. [Google Scholar] [CrossRef]
  6. Ren, Y.; Lü, Y.; Fu, B. Quantifying the impacts of grassland restoration on biodiversity and ecosystem services in China: A meta-analysis. Ecol. Eng. 2016, 95, 542–550. [Google Scholar] [CrossRef]
  7. Dong, S.K.; Li, J.P.; Li, X.Y.; Wen, L.; Zhu, L.; Li, Y.Y.; Ma, Y.S.; Shi, J.J.; Dong, Q.M.; Wang, Y.L. Application of design theory for restoring the “black beach” degraded rangeland at the headwater areas of the Qinghai-Tibetan Plateau. Afr. J. Agric. Res. 2010, 5, 3542–3552. [Google Scholar]
  8. Djebbar, R.; Rzigui, T.; Pétriacq, P.; Caroline, M.; Pierrick, P.; Chantal, F.; Marianne, D.P.; Igor, F.S.; Ghouziel, B.K.; Peter, S.; et al. Respiratory complex I deficiency induces drought tolerance by impacting leaf stomatal and hydraulic conductances. Planta 2012, 235, 603–614. [Google Scholar] [CrossRef]
  9. Krishna, R.; Ansari, W.A.; Jaiswal, D.K.; Singh, A.K.; Prasad, R.; Verma, J.P.; Singh, M. Overexpression of AtDREB1 and BcZAT12 genes confers drought tolerance by reducing oxidative stress in double transgenic tomato (Solanum lycopersicum L.). Plant Cell Rep. 2021, 40, 2173–2190. [Google Scholar] [CrossRef]
  10. Krishna, R.; Ansari, W.A.; Jaiswal, D.K.; Singh, A.K.; Verma, J.P.; Singh, M. Co-overexpression of AtDREB1A and BcZAT12 increases drought tolerance and fruit production in double transgenic tomato (Solanum lycopersicum) plants. Environ. Exp. Bot. 2021, 184, 104396. [Google Scholar] [CrossRef]
  11. Chandra, P.; Wunnava, A.; Verma, P.; Chandra, A.; Sharma, R.K. Strategies to mitigate the adverse effect of drought stress on crop plants—Influences of soil bacteria: A review. Pedosphere 2021, 31, 496–509. [Google Scholar] [CrossRef]
  12. Nishimura, E.; Suzaki, E.; Irie, M.; Nagashima, M.; Hirose, T. Architecture and growth of an annual plant Chenopodium album in different light climates. Ecol. Res. 2010, 25, 383–393. [Google Scholar] [CrossRef]
  13. Perakis, S.S.; Sinkhorn, E.R.; Catricala, C.E.; Bullen, T.D.; Fizpatrick, J.A. Forest calcium depletion and biotic retention along a soil nitrogen gradient. Ecol. Appl. 2013, 23, 1947–1961. [Google Scholar] [CrossRef] [PubMed]
  14. Rasmussen, I.S.; Dresbøll, D.B.; Thorup-Kristensen, K. Winter wheat cultivars and nitrogen (N) fertilization—Effects on root growth, N uptake efficiency and N use efficiency. Eur. J. Agron. 2015, 68, 38–49. [Google Scholar] [CrossRef]
  15. Gai, Z.; Zhang, J.; Li, C. Effects of starter nitrogen fertilizer on soybean root activity, leaf photosynthesis and grain yield. PLoS ONE 2017, 12, e0174841. [Google Scholar] [CrossRef] [PubMed] [Green Version]
  16. Liu, S.; Zamanian, K.; Schleuss, P.-M.; Mohsen, Z.; Yakov, K. Degradation of Tibetan grasslands: Consequences for carbon and nutrient cycles. Agric. Ecosyst. Environ. 2018, 252, 93–104. [Google Scholar] [CrossRef]
  17. Shen, Y.F.; Li, S.Q.; Shao, M.A. Effects of spatial coupling of water and fertilizer applications on root growth characteristics and water use of winter wheat. J. Plant Nutr. 2013, 36, 515–528. [Google Scholar] [CrossRef]
  18. Dai, L.; Yuan, Y.; Guo, X.; Du, Y.; Xun, K.; Zhang, F.; Li, Y.; Li, Q.; Lin, L.; Zhou, H.K.; et al. Soil water retention in alpine meadows under different degradation stages on the northeastern Qinghai-Tibet Plateau. J. Hydrol. 2020, 590, 125397. [Google Scholar] [CrossRef]
  19. Duan, L.H.; Liu, X.L.; Han, B.; Wei, X.T.; Cai, R.C.; Shao, X. Effects of reseeding with native species on community stability of alpine meadow on the Qinghai-Tibet Plateau. Grassl. J. 2021, 29, 1793–1800. (In Chinese) [Google Scholar]
  20. Yin, Y.L.; Li, S.X.; Ma, Y.S. Effects of artificial reseeding on soil fungal community characteristics in degraded alpine meadow. Grassl. J. 2020, 28, 1791–1797. (In Chinese) [Google Scholar]
  21. Wang, B.S.; Ga, M.J.; Zhang, Y. Research progress on formation mechanism and management methods of degraded alpine meadow steppe in “black soil flat” on Qinghai-Tibet Plateau. Grassl. Lawns 2007, 2, 72–77. (In Chinese) [Google Scholar]
  22. Wei, X.H.; Yang, F.Y.; Sun, L. Effect of reseeding and fertilization on alpine degraded grassland in northern Tibet. Anhui Agric. Sci. 2010, 38, 18155–18156. (In Chinese) [Google Scholar]
  23. Pornaro, C.; DalMaso, M.; Macolino, S. Drought resistance and recovery of kentucky bluegrass (Poa Pratensis, L.) cultivars under different nitrogen fertilisation rates. Agronomy 2021, 11, 1128. [Google Scholar] [CrossRef]
  24. Sun, X.; Guo, Z.; Jiang, Y.; Qin, L.G.; Shi, Z.J.; Dong, L.L.; Xiong, L.B.; Eun, L.Y.; Deng, W.J.; Wu, H.F.; et al. Differential Metabolomic Responses of Kentucky Bluegrass Cultivars to Low Nitrogen Stress. Front. Plant Sci. 2021, 12, 808772. [Google Scholar] [CrossRef] [PubMed]
  25. Yang, D.; Ni, R.; Yang, S.; Pu, P.; Qian, M.; Yang, Y. Functional Characterization of the Stipa purpurea P5CS gene under drought stress conditions. Int. J. Mol. Sci. 2021, 22, 9599. [Google Scholar] [CrossRef] [PubMed]
  26. Dam, R.F.; Mehdi, B.B.; Burgess, M.S.E.; Madramootooa, C.A.; Mehuys, G.R.; Calluma, I.R. Soil bulk density and crop yield under eleven consecutive years of corn with different tillage and residue practices in a sandy loam soil in central Canada. Soil Tillage Res. 2005, 84, 41–53. [Google Scholar] [CrossRef]
  27. Huang, Y.; Chen, L.; Fu, B.; Huang, Z.; Gong, J. The wheat yields and water-use efficiency in the Loess Plateau: Straw mulch and irrigation effects. Agric. Water Manag. 2005, 72, 209–222. [Google Scholar] [CrossRef]
  28. Zhang, M.J.; Chen, L.H.; Zhang, J.; Hu, X.W.; Xu, R. Effects of drought stress and fertilization on biomass and C, N, P accumulation and allocation of Macrophyte. J. Northwest A F Univ. 2016, 44, 105–112. (In Chinese) [Google Scholar]
  29. Méndez, M.; Karlsson, P.S. Equivalence of three allocation currencies as estimates of reproductive allocation and somatic cost of reproduction in Pinguicula vulgaris. Plant Biol. 2007, 9, 462–468. [Google Scholar] [CrossRef] [Green Version]
  30. Farooq, M.; Hussain, M.; Wahid, A.; Siddique, K.H.M. Drought stress in plants: An overview. Plant Responses Drought Stress 2012, 1, 1–33. [Google Scholar]
  31. Guretzky, J.; Kering, M.; Mosali, J.; Funderburg, E.; Biermacher, J. Fertilizer rate effects on forage yield stability and nutrient uptake of midland bermudagrass. J. Plant Nutr. 2010, 33, 1819–1834. [Google Scholar] [CrossRef] [Green Version]
  32. Wu, F.Z.; Lu, Y.J.; Yang, W.Q. Effects of density on nutrient storage, accumulation and distribution of Arro phyllostachys spp. Acta Ecol. Sin. 2005, 25, 1663–1669. (In Chinese) [Google Scholar]
  33. Terzi, R.; Kadioglu, A. Drought stress tolerance and the antioxidant enzyme system. Acta Biol. Crac. Ser. Bot. 2006, 48, 89–96. [Google Scholar]
  34. Yao, H.; Zhang, Y.; Yi, X.; Zhang, X.; Fan, D.; Zhou, W.; Zhang, W. Diaheliotropic leaf movement enhances leaf photosynthetic capacity and photosynthetic light and nitrogen use efficiency via optimising nitrogen partitioning among photosynthetic components in cotton (Gossypium hirsutum L.). Plant Biol. 2018, 20, 213–222. [Google Scholar] [CrossRef] [PubMed] [Green Version]
  35. Hafeez, S.; Jin, T.; Zhou, Y. Factors affecting yield and yield components of main and ratoon rice: A review. Agric. Sci. Technol. 2017, 18, 1228. [Google Scholar]
  36. Harrison, E.L.; Cubas, L.A.; Gray, J.E.; Hepworth, C. The influence of stomatal morphology and distribution on photosynthetic gas exchange. Plant J. 2020, 101, 768–779. [Google Scholar] [CrossRef] [Green Version]
  37. Benavente-Valdés, J.R.; Aguilar, C.; Contreras-Esquivel, J.C.; Méndez-Zavala, A.; Montañez, J. Strategies to enhance the production of photosynthetic pigments and lipids in chlorophycae species. Biotechnol. Rep. 2016, 10, 117–125. [Google Scholar] [CrossRef] [Green Version]
  38. Yang, H.; Chai, Q.; Yin, W.; Hu, F.; Qin, A.; Fan, Z.; Yu, A.; Zhao, C.; Fan, H. Yield photosynthesis and leaf anatomy of maize in inter-and mono-cropping systems at varying plant densities. Crop J. 2022, 10, 893–903. [Google Scholar] [CrossRef]
  39. Song, Y.; Li, J.; Liu, M.; Meng, Z.; Liu, K.; Sui, N. Nitrogen increases drought tolerance in maize seedlings. Funct. Plant Biol. 2019, 46, 350–359. [Google Scholar] [CrossRef]
  40. Wang, Y.; He, X.; Li, F.; Deng, H.; Wang, Z.; Huang, C.; Han, Y.; Ba, Y.; Lei, L.; Zhang, C. Effects of water and nitrogen coupling on the photosynthetic characteristics, yield, and quality of Isatis indigotica. Sci. Rep. 2021, 11, 1–7. [Google Scholar] [CrossRef]
  41. Guo, X.; Li, S.; Wang, D.; Huang, Z.; Sarwar, N.; Mubeen, K.; Shakeel, M.; Hussain, M. Effects of water and fertilizer coupling on the physiological characteristics and growth of rabbiteye blueberry. PLoS ONE 2021, 16, e0254013. [Google Scholar] [CrossRef] [PubMed]
  42. Suiqi, Z.; Lun, S. Research progress on water use efficiency of plant. Agric. Res. Arid Areas 2002, 20, 1–5. [Google Scholar]
  43. Wang, X.J.; Jia, Z.K.; Li, L.; Ding, R.; Wang, M. Effects of organic fertilizer application rate on leaf photosynthetic characteristics and grain yield of dryland maize. Yingyong Shengtai Xuebao 2012, 23, 419–425. [Google Scholar] [PubMed]
  44. Yang, M.; Liu, M.; Lu, J.; Yang, H. Effects of shading on the growth and leaf photosynthetic characteristics of three forages in an apple orchard on the Loess Plateau of eastern Gansu China. PeerJ 2019, 7, e7594. [Google Scholar] [CrossRef] [PubMed] [Green Version]
  45. Evans, J.R.; Kaldenhoff, R.; Genty, B.; Terashima, I. Resistances along the CO2 diffusion pathway inside leaves. J. Exp. Bot. 2009, 60, 2235–2248. [Google Scholar] [CrossRef] [PubMed] [Green Version]
  46. Wu, Y.; Gong, W.; Yang, W. Shade inhibits leaf size by controlling cell proliferation and enlargement in soybean. Sci. Rep. 2017, 7, 1–10. [Google Scholar] [CrossRef] [PubMed]
  47. Niinemets, U. Photosynthesis and resource distribution through plant canopies. Plant Cell Environ. 2007, 30, 1052–1071. [Google Scholar] [CrossRef]
  48. Casson, S.; Gray, J.E. Influence of environmental factors on stomatal development. New Phytol. 2008, 178, 9–23. [Google Scholar] [CrossRef]
  49. Galmés, J.; Medrano, H.; Flexas, J. Photosynthetic limitations in response to water stress and recovery in Mediterranean plants with different growth forms. N. Phytol. 2007, 175, 81–93. [Google Scholar] [CrossRef]
  50. Hamanishi, E.T.; Thomas, B.R.; Campbell, M.M. Drought induces alterations in the stomatal development program in Populus. J. Exp. Bot. 2012, 63, 4959–4971. [Google Scholar] [CrossRef] [Green Version]
  51. Hong-hai, L.; Hong-zhi, Z.; Xian-ping, T.; Ya-li, Z.; Wang-feng, Z. Effects of water and nitrogen management modes on the leaf photosynthetic characters and yield formation of cotton with under-mulch drip irrigation. Yingyong Shengtai Xuebao 2013, 24, 407–415. [Google Scholar]
  52. Doheny-Adams, T.; Hunt, L.; Franks, P.J.; Beerling, D.J.; Gray, J.E. Genetic manipulation of stomatal density influences stomatal size, plant growth and tolerance to restricted water supply across a growth carbon dioxide gradient. Philoso. Trans. Royal Soc. B Biol. Sci. 2012, 367, 547–555. [Google Scholar] [CrossRef] [PubMed]
  53. Luo, Y.Z.; Cheng, Z.Y. Effects of water stress on leaf water potential, transpiration rate and stomatal conductance of Alfalfa. Grassl. J. 2011, 19, 215–221. (In Chinese) [Google Scholar]
  54. Li, F.; Kang, S.; Zhang, J. Interactive effects of elevated CO2, nitrogen and drought on leaf area, stomatal conductance, and evapotranspiration of wheat. Agric. Water Manag. 2004, 67, 221–233. [Google Scholar] [CrossRef]
  55. Xu, Z.; Zhou, G. Responses of leaf stomatal density to water status and its relationship with photosynthesis in a grass. J. Exp. Bot. 2008, 59, 3317–3325. [Google Scholar] [CrossRef] [Green Version]
  56. Yin, X.L.; Wang, J.X.; Duan, Z.Q.; Wen, J.; Wang, H.; Wen, J. Study on stomatal density and diurnal variation of wheat. Chin. Agric. Sci. Bull. 2006, 2, 237–242. (In Chinese) [Google Scholar]
  57. Qi, X.; Torii, K.U. Hormonal and environmental signals guiding stomatal development. BMC Biol. 2018, 16, 1–11. [Google Scholar] [CrossRef] [Green Version]
  58. Maggard, A.O.; Will, R.E.; Wilson, D.S.; Wilson, D.R.; Meek, C.R.; Vogel, M.G. Fertilization reduced stomatal conductance but not photosynthesis of Pinus taeda which compensated for lower water availability in regards to growth. For. Ecol. Manag. 2016, 381, 37–47. [Google Scholar] [CrossRef] [Green Version]
  59. Ma, J.; Luo, Z.Z.; Niu, Y.N. Effects of water and nitrogen levels on photosynthetic characteristics and water use of spring wheat. Crop Res. 2020, 34, 308–314. (In Chinese) [Google Scholar]
  60. Wu, B.; Gao, Y.H.; Li, P.H.; Yan, B.; Cui, Z.J.; Niu, J.Y. Effects of nitrogen fertilizer and density on water, nitrogen utilization and yield of flax. Agric. Res. Arid Reg. 2020, 38, 163–171. (In Chinese) [Google Scholar]
  61. Liu, F.; Stutzel, H. Leaf expansion, stomatal conductance, and transpiration of vegetable amaranth (Amaranthus sp.) in response to soil drying. J. Am. Soc. Hortic. Sci. 2002, 127, 878–883. [Google Scholar] [CrossRef] [Green Version]
  62. Liu, L.M.; Qi, H.; Luo, X.L. Research progress on the interaction between stomatal gas water loss and liquid water supply in SPAC system. Chin. J. Appl. Ecol. 2008, 19, 2067–2073. (In Chinese) [Google Scholar]
  63. Hetherington, A.M.; Woodward, F.I. The role of stomata in sensing and driving environmental change. Nature 2003, 424, 901–908. [Google Scholar] [CrossRef] [PubMed]
  64. Qiao, Y.N.; Liu, K.; Deng, Z.W.; Su, J.L.; Rong, J.D.; Chen, L.G. Photosynthetic Characteristics of Phyllostachys edulis under Different Water and Fertilizer Coupling Treatment. J. Trop. Crops 2020, 41, 2253–2258. (In Chinese) [Google Scholar]
  65. Jaleel, C.A.; Gopi, R.; Sankar, B.; Gomathayagam, M.; Panneerselvam, R. Differential responses in water use efficiency in two varieties of Catharanthus roseus under drought stress. Comptes Rendus. Biol. 2008, 331, 42–47. [Google Scholar] [CrossRef] [PubMed]
  66. Liu, X.H.; Xiao, H.L.; Zhao, L.J. Water consumption and water utilization of spring wheat under different water and fertilizer conditions. Agric. Res. Arid Reg. 2006, 24, 56–59. (In Chinese) [Google Scholar]
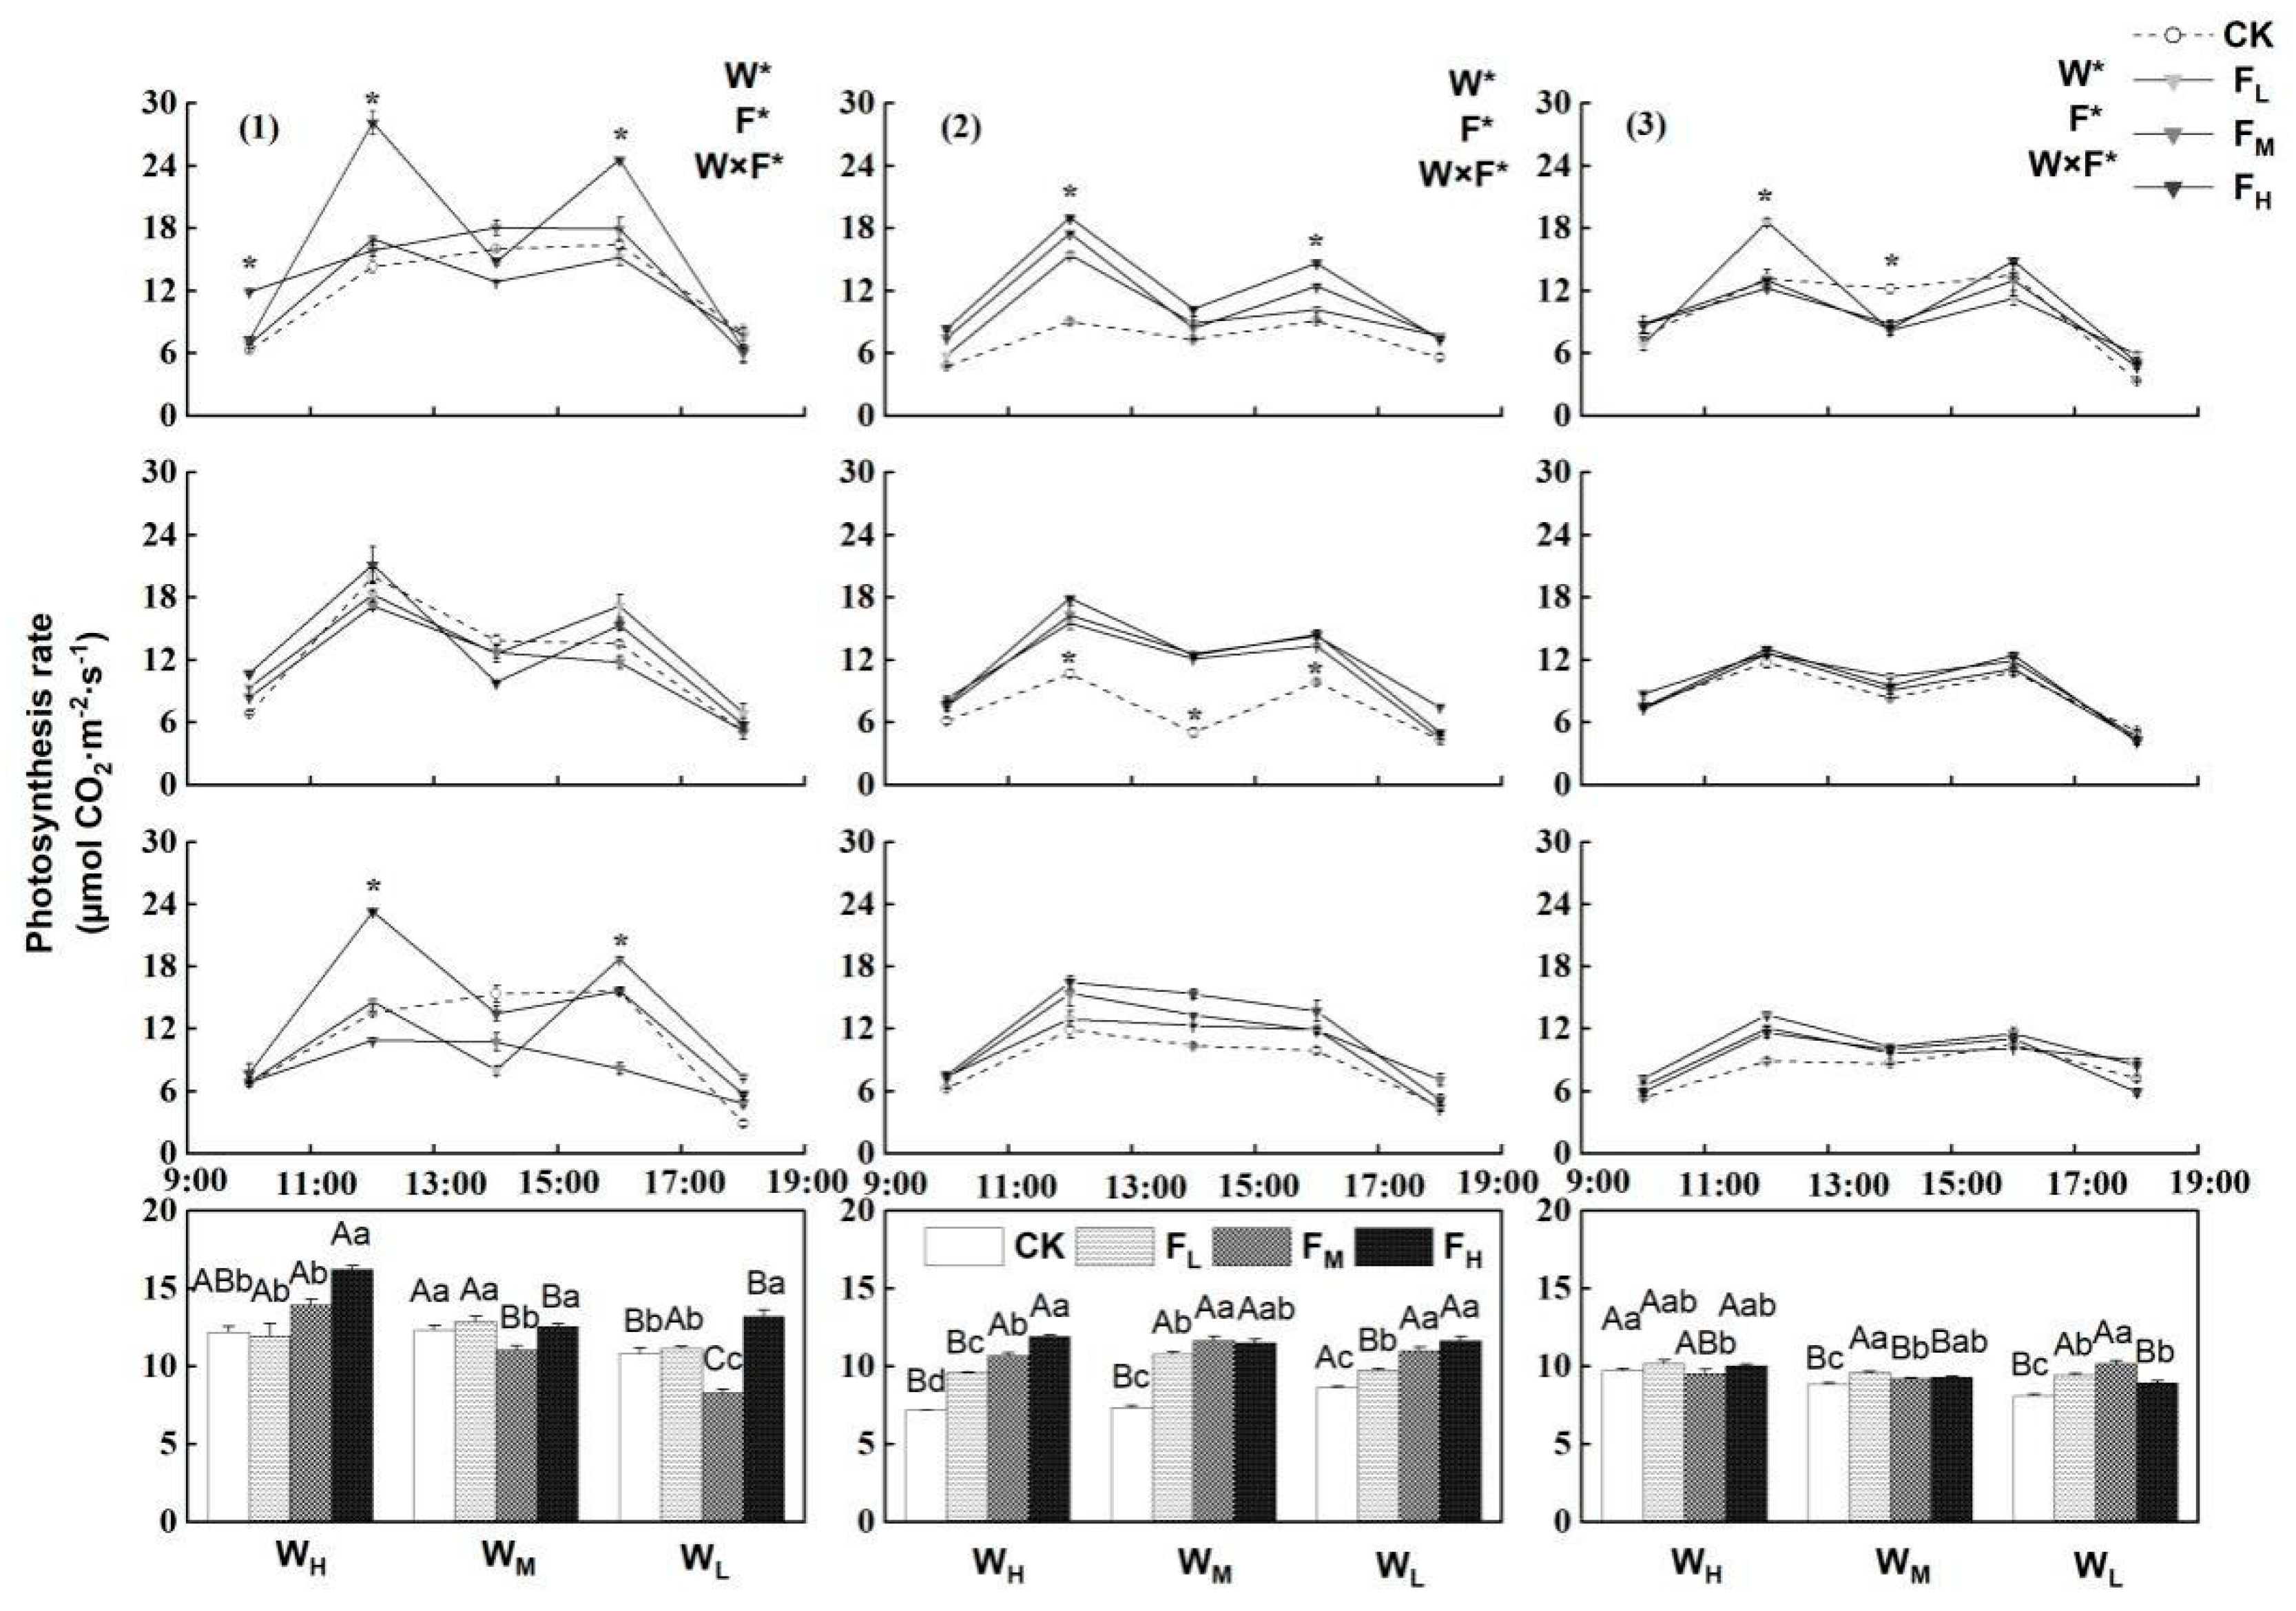
Figure 1. Changes in Pn values of test plant species under different water–fertilizer treatments. Numbers (1)−(3) in brackets indicate P. crymophila, F. coelestis, and S. purpurea, respectively. W, F, and W×F indicate the results of ANOVAs (p < 0.05) for the effects of water, fertilizer, and their interactions. Asterisk (*) and ns indicate significant difference and non-significant. The uppercase letters and lowercase letters represent the difference between water and fertilizer treatments.
Agriculture 12 01873 g001
Figure 2. Changes in leaf number and leaf thickness values of test plant species under different water–fertilizer treatments. Numbers (1)−(3) in brackets indicate P. crymophila, F. coelestis, and S. purpurea, respectively. W, F, and W×F indicate the results of ANOVAs (p < 0.05) for the effects of water, fertilizer, and their interactions. Asterisk (*) and ns indicate significant difference and non-significant. The uppercase letters and lowercase letters represent the difference between water and fertilizer treatments.
Agriculture 12 01873 g002
Figure 3. Changes in aboveground biomass values of test plant species under different water–fertilizer treatments. Numbers (1)−(3) in brackets indicate P. crymophila, F. coelestis, and S. purpurea, respectively. W, F, and W×F indicate the results of ANOVAs (p < 0.05) for the effects of water, fertilizer, and their interactions. Asterisk (*) and ns indicate significant difference and non-significant. The uppercase letters and lowercase letters represent the difference between water and fertilizer treatments.
Agriculture 12 01873 g003
Figure 4. Changes in root weight values of test plant species under different water–fertilizer treatments. Numbers (1)−(3) in brackets indicate P. crymophila, F. coelestis, and S. purpurea, respectively. W, F, and W×F indicate the results of ANOVAs (p < 0.05) for the effects of water, fertilizer, and their interactions. Asterisk (*) and ns indicate significant difference and non-significant. The uppercase letters and lowercase letters represent the difference between water and fertilizer treatments.
Agriculture 12 01873 g004
Figure 5. Changes in Gs values of test plant species under different water–fertilizer treatments. Numbers (1)−(3) in brackets indicate P. crymophila, F. coelestis, and S. purpurea, respectively. W, F, and W×F indicate the results of ANOVAs (p < 0.05) for the effects of water, fertilizer, and their interactions. Asterisk (*) and ns indicate significant difference and non-significant. The uppercase letters and lowercase letters represent the difference between water and fertilizer treatments.
Agriculture 12 01873 g005
Figure 6. Changes in stomatal frequency values of test plant species under different water–fertilizer treatments. Numbers (1)−(3) in brackets indicate P. crymophila, F. coelestis, and S. purpurea, respectively. W, F, and W×F indicate the results of ANOVAs (p < 0.05) for the effects of water, fertilizer, and their interactions. Asterisk (*) and ns indicate significant difference and non-significant. The uppercase letters and lowercase letters represent the difference between water and fertilizer treatments.
Agriculture 12 01873 g006
Figure 7. Changes in Tr values of test plant species under different water–fertilizer treatments. Numbers (1)−(3) in brackets indicate P. crymophila, F. coelestis, and S. purpurea, respectively. W, F, and W×F indicate the results of ANOVAs (p < 0.05) for the effects of water, fertilizer, and their interactions. Asterisk (*) and ns indicate significant difference and non-significant. The uppercase letters and lowercase letters represent the difference between water and fertilizer treatments. F. coelestis, and S. purpurea were significantly different (p < 0.05).
Agriculture 12 01873 g007
Figure 8. Changes in water consumption values of test plant species under different water–fertilizer treatments. Numbers (1)−(3) in brackets indicate P. crymophila, F. coelestis, and S. purpurea, respectively. W, F, and W×F indicate the results of ANOVAs (p < 0.05) for the effects of water, fertilizer, and their interactions. Asterisk (*) and ns indicate significant difference and non-significant. The uppercase letters and lowercase letters represent the difference between water and fertilizer treatments.
Agriculture 12 01873 g008
Figure 9. Changes in WUE values of test plant species under different water–fertilizer treatments. Numbers (1)−(3) in brackets indicate P. crymophila, F. coelestis, and S. purpurea, respectively. W, F, and W×F indicate the results of ANOVAs (p < 0.05) for the effects of water, fertilizer, and their interactions. Asterisk (*) and ns indicate significant difference and non-significant. The uppercase letters and lowercase letters represent the difference between water and fertilizer treatments.
Agriculture 12 01873 g009
Figure 10. Changes in stomatal size values of test plant species under different water–fertilizer treatments. Numbers (1)−(3) in brackets indicate P. crymophila, F. coelestis, and S. purpurea, respectively.
Agriculture 12 01873 g010
Publisher’s Note: MDPI stays neutral with regard to jurisdictional claims in published maps and institutional affiliations.