Article

Ozone in Droplets and Mist in Inhibition of Phytopathogenic Microbiota

by
Irina Tanuwidjaja
and
Mirna Mrkonjic Fuka
*
Department of Microbiology, University of Zagreb Faculty of Agriculture, Svetošimunska c. 25, 10000 Zagreb, Croatia
*
Author to whom correspondence should be addressed.
Agriculture 2022, 12(11), 1875; https://doi.org/10.3390/agriculture12111875
Submission received: 30 September 2022 / Revised: 4 November 2022 / Accepted: 7 November 2022 / Published: 9 November 2022
(This article belongs to the Special Issue Integrated Pest Management of Field Crops: Series II)

Abstract

:
Ozon is considered an environmentally friendly, low-cost antimicrobial treatment and an effective alternative to chemical pesticides. Ozonated water in the form of droplets and mist has been used in two concentrations (4 and 2 mg/L) against three biomasses (102, 104, and 106 CFU/mL) of phytopathogenic bacteria Erwinia amylovora, Pseudomonas syringae, and Agrobacterium tumefaciens and fungus Botrytis cinerea that infest a wide range of crops worldwide and pose a threat to global food production. Regardless of concentration, ozone dissolved in water showed a pronounced inhibitory effect on phytopathogenic bacteria when applied in the form of droplets. However, the effect was only detected when the bacterial load was not higher than 104 CFU/mL, indicating the necessity to treat the crops and plant materials when the bacterial load is still manageable. Unlike bacterial phytopathogens, B. cinerea was the most susceptible to treatment with aqueous ozone, regardless of the applied biomass, ozone concentration, or type of application. Total removal of high biomass of B. cinerea was achieved even with the lowest ozonated water concentration thus underlying the power of ozone in treating this particular fungal contamination.

1. Introduction

Food losses caused by microorganisms affect our ability to produce food, harm the economy, and lead to human health risks due to food shortages. It is estimated that more than 20% of global food production is lost due to plant diseases and postharvest microbial contamination [1,2], resulting in over 220 billion USD in losses to the global economy [3]. As the world population is expected to reach 9.6 billion by 2050, crop production will need to increase by 80–110% [4,5] to feed the growing world population. To achieve these yields, the impact of plant diseases and microbial contamination of food plants during storage, processing, and distribution must be significantly reduced without harming the environment.
Already, the demand for food contributes to intensive crop protection and the use of 2 million tons of bactericides, fungicides, and other chemical pesticides worldwide [6]. Many of the currently available antimicrobial agents used as pesticides are highly toxic and non-biodegradable, causing severe environmental pollution [7]. Moreover, the overuse of antimicrobial substances has facilitated the emergence and spread of antimicrobial resistance in pathogenic bacteria, which is one of the most pressing global public health problems [8].
Overall, there are over 150 bacterial [9] and over 8000 fungal species [10] that damage the plants during growing, storage, processing, or distribution. Amongst those, Pseudomonas syringae, Ralstonia solanacearum, Agrobacterium tumefaciens, Xanthomonas oryzae pv. oryzae, Xanthomonas campestris pathovars, Xanthomonas axonopodis pathovars, Erwinia amylovora, Xylella fastidiosa, Dickeya dadantii, and Pectobacterium carotovorum, as well as Magnaporthe oryzae, Botrytis cinerea, Puccinia spp., Fusarium graminearum, Fusarium oxysporum, Blumeria graminis, Mycosphaerella graminicola, Colletotrichum spp., Ustilago maydis, and Melampsora lini are considered the most important [11,12]. In the last two centuries, those pathogens have spread worldwide [13] and are extremely difficult to control without a negative impact on environmental and human health.
Because of the limited ability to control microbial contamination during plant growth, storage, processing, or transport by chemical pesticides, along with the great potential for environmental pollution and the development of microbial resistance, complementary methods of controlling microbial growth are needed. One of the methods which have proven effective in inhibiting the growth of Gram-positive and Gram-negative bacteria, as well as fungi, is the use of ozone [14,15,16]. Ozone (O3) is a gas composed of three oxygen atoms that occurs naturally in the upper atmosphere in small amounts, with a maximum concentration not exceeding 0.001%. Ozone has a half-life of about 30 min [17] before it decomposes into diatomic oxygen (O2) and a single free oxygen atom [18]. This single free oxygen is highly reactive and acts on cellular components of microorganisms such as fatty acids, enzymes, and nucleic acids, and disrupts their normal activity [19]. Cell membrane destruction or the combination of increased cytoplasmic membrane permeability and cytoplasm coagulation are the primary mechanisms that cause cell lysis and death of microbial cells [15,20].
As ozone can be generated at the treatment site using only electricity and air, ozone treatment offers several safety advantages over chemical pesticides [21]. Because of its short half-life and conversion to naturally occurring oxygen, there are no residues or toxic compounds on products. In addition, there is no risk of mixing toxic chemicals, and there are no problems with the disposal of pesticide residues or packaging waste. Because of its proven effectiveness and advantages over other antimicrobial compounds, ozone was declared by the US Food and Drug Administration (FDA) in 2001 as an “antimicrobial agent for the treatment, storage, and processing of foods in gaseous and aqueous phases” [22]. In the EU, it was declared as an active ingredient under the EU Biocidal Products Regulation (BPR) No. 528/2012 in 2013 [23]. Ozone has also been approved by the US Department of Agriculture (USDA) for organic crop production and food processing [24]. Globally, ozone is used with promising results in agriculture as an alternative to conventional chemical pesticides, for soil remediation, in the food industry, for drinking water disinfection, wastewater treatment, medical disinfection, air freshening, and reduction of aflatoxin contamination [25,26,27,28,29,30,31]. However, the effect of ozone treatment depends on many intrinsic and extrinsic factors, such as type of microbial cells, and microbial load, as well as ozone concentration, type of treatment, and duration of application [32], all of which must be determined before in situ application.
Apart from a few publications, little is known about the effects of ozone on Erwinia amylovora, Pseudomonas syringae, Agrobacterium tumefaciens, and Botrytis cinerea [14,32,33,34], and even less is known about the influence of microbial biomass, ozone concentration, and type of application on the survival rate of the respective microorganisms. Since they significantly contribute to crop diseases and plant food spoilage worldwide [11,12], these microorganisms are among the top 10 plant pathogenic bacteria and fungi, which is why there is great interest in inhibiting their growth and preventing contamination.
Based on everything above, the hypothesis of this study is that ozone is a powerful tool in controlling the growth of plant pathogens. Its effect depends on many factors e.g., concentration of ozone, method of application, pathogen species, and biomass. Based on the hypothesis, the objective of this study was to compare the effect of two concentrations of ozonated water (2 and 4 mg/L), applied in the form of droplets and mist on three different biomasses (102, 104, and 106 CFU/mL) of E. amylovora, P. syringae, A. tumefaciens, and B. cinerea, and to determine the optimum values for the biocidal effect of ozonated water.

2. Materials and Methods

2.1. The Preparation of Ozonated Water

The ozonated water for all experiments in this study was prepared in the same way, and under the same conditions, only differing in the end concentrations of aqueous ozone. Tap water was selected for all experiments due to its availability, easy obtainment, and low costs.
In brief, the ozonated water was prepared by dissolving the ozone in tap water by using an ozone generator (SIHON; Vez Farmachem, Zagreb, Croatia) at 22 °C. Ozone gas was pumped into tap water at a controlled flow rate of 8 g/L for up to 30 min or until the required ozone concentration was achieved.
The concentration of aqueous ozone was measured by the Portable Dissolved Ozone Analyzer DOZ-30 (Guangzhou Qili Environmental Equipment Co., Guangzhou, China) under static conditions. The ozonated water was used immediately after the ozone concentration reached target values.

2.2. Preliminary Experiments (First Phase)

To optimize the microbial reduction with aqueous ozone, the influence of several factors was analyzed, including the stability of ozone in tap water, ozone concentration, and the ozone exposure time. During the whole first phase experiment, the bacterial load was kept constant.

2.2.1. The Assessment of Ozone Stability in Tap Water

The decay of ozone concentration in tap water was measured under static conditions. The ozonated water was prepared as described in chapter 2.1. When the ozone concentration reached 4 mg/L, thirty milliliters of ozonated water were placed in 50 mL Falcon tubes and left at 22 °C. The ozone concentration was measured after 0, 1, 5, 10, 20, 30, 45, and 60 min by the Portable Dissolved Ozone Analyzer DOZ-30 (Guangzhou Qili Environmental Equipment Co., Guangzhou, China). At least three tubes for each time point were tested. The concentration of ozone in tap water is shown as mean value with standard deviation.

2.2.2. The Optimization of Microbial Reduction by Aqueous Ozone

To evaluate the antibacterial effect of aqueous ozone concentration and the duration of exposure, the survival of a model organism, Escherichia coli, was monitored. In brief, E. coli (DSM 6969) was treated with ozone concentrations of 4 and 2 mg/L by mixing bacterial suspension (bacterial load of 106 CFU/mL) with ozonated water in a 1:1 ratio and exposed to the aqueous ozone for 1 and 20 min at 22 °C. Since the ozone decay experiment has shown that the ozone concentration of at least 2 mg/L is maintained in tap water for 20 min, the ozone exposure times of 1 and 20 min were selected for this experiment.
At the end of the treatment, treated bacterial suspensions and controls (E. coli cell concentration of 106 CFU/mL) were serially diluted in a sterile saline solution (0.85%) in a 1:10 ratio. An aliquot (0.1 mL) of each dilution was inoculated on brain heart infusion agar (BHI agar, Biolife, Monza, Italy) and incubated at 37 °C overnight. All experiments were performed in triplicates. The viable cell number was determined by counting CFUs for each experiment, and the microbial reduction was calculated according to Equation (1):
Microbial   reduction   [ % ] = 100   ×   ( 1 C F U 1 C F U 2 )
where CFU1 is the number of viable bacterial or fungal cells after the ozone treatment, and CFU2 is the number of microbial cells in controls. The viable cells and microbial reduction are expressed as mean value with standard deviation.

2.3. Main Experiment (Second Phase)

The effects of two different aqueous ozone concentrations (4 and 2 mg/L) and two different types of applications (droplet vs. mist) on three different microbial loads (102,104, and 106 CFU/mL) of selected phytopathogen (E. amylovora, P. syringae, A. tumefaciens, and B. cinerea) were determined in this study.

2.3.1. Microbial Strains and Media

The phytopathogenic strains used in this study included E. amylovora (DSM 50901), P. syringae (DSM 10604), A. tumefaciens (DSM 30205), and B. cinerea (DSM 877) and were purchased from the German Collection of Microorganisms and Cell Cultures. All isolates were stored as glycerol (25%) culture at −20 °C at the Department of Microbiology, University of Zagreb Faculty of Agriculture, until the analyses.
All bacterial strains were cultivated on the commercially available brain heart infusion agar (BHI agar; Biolife, Monza, Italy) and fungal strain on potato dextrose agar (PDA; 20.0 g glucose, Kemika, Croatia; 15.0 g agar, Biolife, Monza, Italy; 1000 mL potato infusion from 200 g of unpeeled potato).

2.3.2. In Vitro Treatment of Selected Phytopathogens with Aqueous Ozone

To obtain the monoculture of each phytopathogen, all bacterial strains were streaked on the BHI agar (Biolife, Monza, Italy), and incubated overnight at 30 °C, whereas the fungal strain was cultivated on the PDA agar and incubated at 25 °C for 7 days. After the incubation, different microbial loads were prepared for each strain by adding several single colonies to the 10 mL of sterile saline solution (0.85%) until cell turbidity corresponding to the McFarland standard 0.5 (1.5 × 10⁸ CFU/mL) was achieved. Microbial suspensions were further diluted in the sterile saline solution until target microbial loads were obtained.
Before the treatment with aqueous ozone, each target microbial load and control biomass (106, 104, and 102 CFU/mL) were serially diluted in a sterile saline solution (0.85%). Exactly one ml of each microbial suspension was transferred aseptically into a sterile empty Petri dish and treated with aqueous ozone (4 and 2 mg/L) in the form of droplets (applied by a sprayer) or mist (applied by a pressure mist sprayer, 3 bar) within one minute, since the preliminary experiment showed that the exposure time (1 or 20 min) to the ozone did not significantly influence the ozone biocidal effect. After the treatment with aqueous ozone, each target microbial load and control biomass were serially diluted in a sterile saline solution (0.85%) and overlayed with 20 mL of BHI (Biolife, Italy) or PDA agar. All experiments were performed three times. For each ozone concentration and application, controls were prepared in the same way as the treatment, except, instead of aqueous ozone, sterile tap water was used. The plates were incubated at 30 °C for 24 h (E. amylovora, P. syringae, and A. tumefaciens) or 25 °C for 7 days (B. cinerea). At the end of the incubation, the viable cell count was determined by counting CFUs, and the microbial reduction was calculated according to Equation (1). The viable cells and microbial reduction are expressed as mean value with standard deviation.

2.4. Statistical Analysis

All data were expressed as mean value ± standard deviation of the mean (SD). Prior to the statistical analyses, the viable cell counts were log10 transformed. For the data that did not show normal (Shapiro–Wilks test, p < 0.001) and homogeneous (Levane test, p < 0.001) distribution, the significant differences between groups were determined by the non-parametric Kruskal–Wallis test followed by the Tukey HSD post hoc test, whereas for the data with normal and homogenous distribution, Analysis of Variance (ANOVA) and Bonferroni test were performed. The differences with p < 0.05 were considered significant. All statistical analyses were performed in R environment version 3.0.2 (R Core Team, Vienna, Austria) [35].

3. Results

3.1. The Stability of Aqueous Ozone and Reduction of Viable E. coli

To determine the ozone degradation tendency in water, the ozone concentration was measured over 60 min (Figure 1).
Even though the aqueous ozone (initial concentration at 0 min: 4.1 ± 0.1 mg/L) started to break down significantly after 5 min (3.7 ± 0.1 mg/L; Kruskal–Wallis test, p = 0.038; Tukey HSD test, p = 0.001) at 22 °C, the ozone concentration was always higher than 2 mg/L in the first 20 min. Another significant drop in ozone concentration occurred after 30 (1.7 ± 0.1 mg/L; Kruskal–Wallis test, p = 0.038; Tukey HSD test, p < 0.001), and 45 min (1.1 ± 0.1 mg/L; Kruskal–Wallis test, p = 0.038; Tukey HSD test, p < 0.001). After 30 min, the ozone concentrations dropped below 2 mg/L and remained stable.
Moreover, the preliminary experiment has shown that aqueous ozone significantly decreased microbial survival of E. coli when compared to the control (Kruskal–Wallis test, p < 0.001), regardless of the concentration or the time of exposure (Figure 2).
Even though the microbial removal of E. coli was enhanced with the increasing aqueous ozone concentration and time of exposure (4 mg/L, 20 min—99.92 ± 0.01%; 4 mg/L, 1 min—99.84 ± 0.03%; 2 mg/L, 20 min—99.61 ± 0.05%; 2 mg/L, 1 min—99.05 ± 0.05%), the differences were not significant (Supplementary Figure S1).
Therefore, to determine the biocidal effect of ozonated water on phytopathogenic microorganisms, aqueous ozone concentrations of 4 and 2 mg/L and ozone exposure time of one minute were chosen for the main experiment since a stable ozone concentration of 4 mg/L can be maintained within one minute.

3.2. The Biocidal Effect of Aqueous Ozone on the Selected Phytopathogens

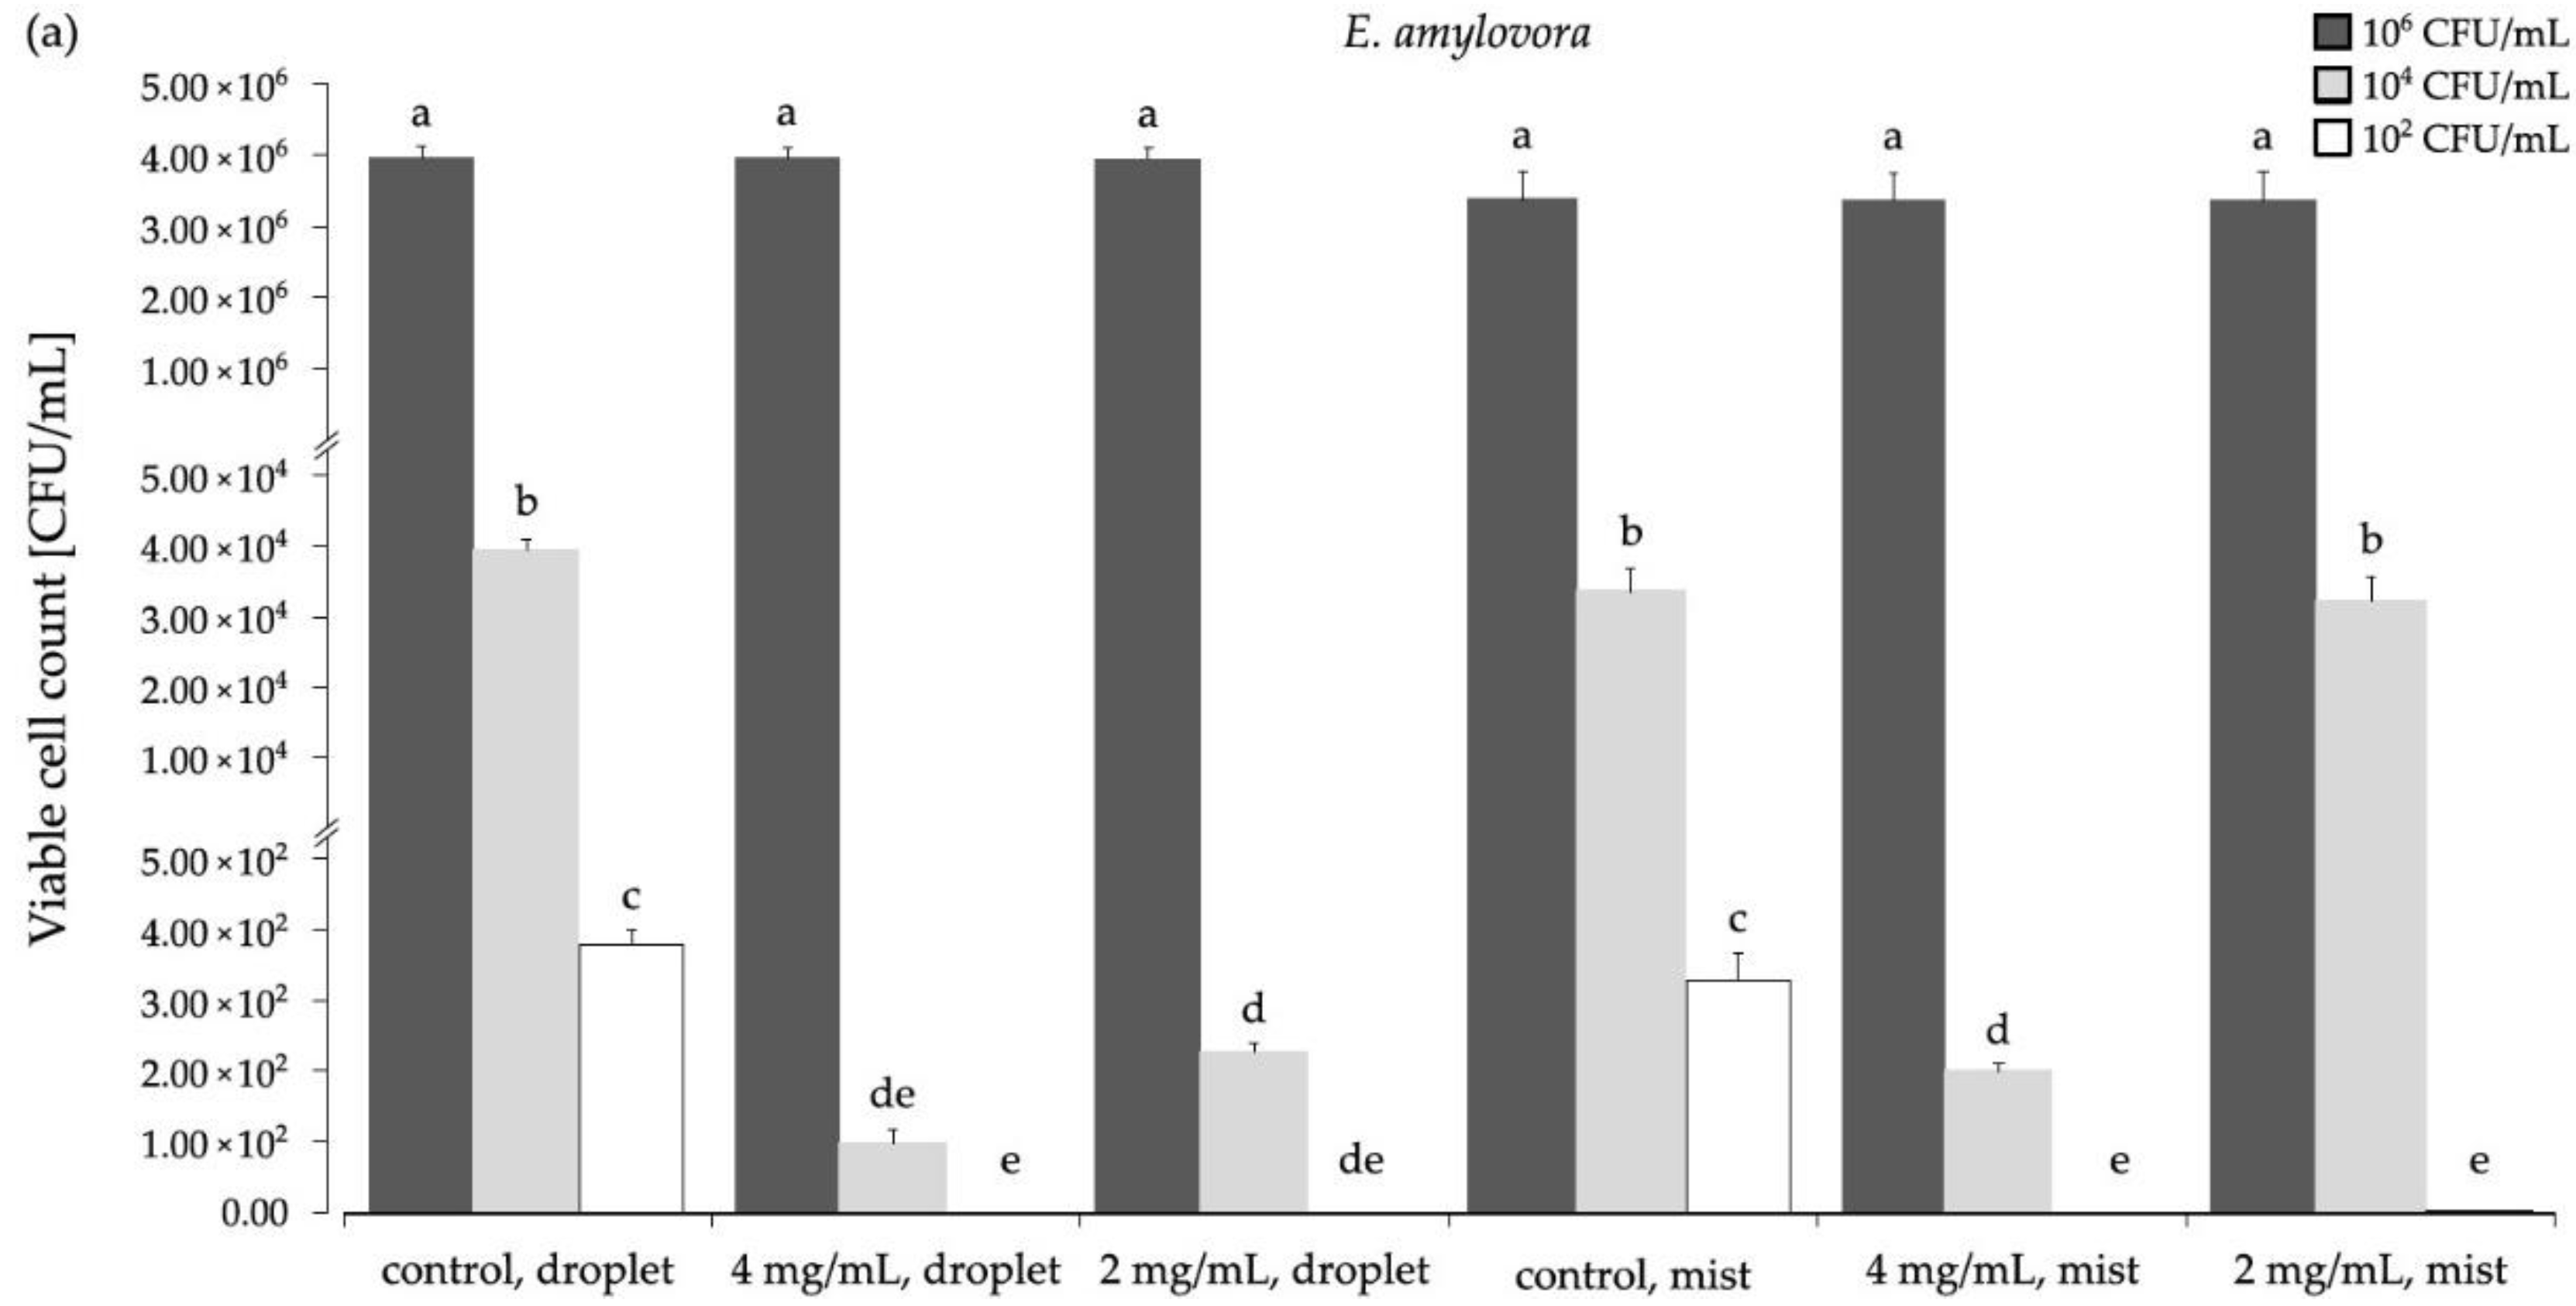
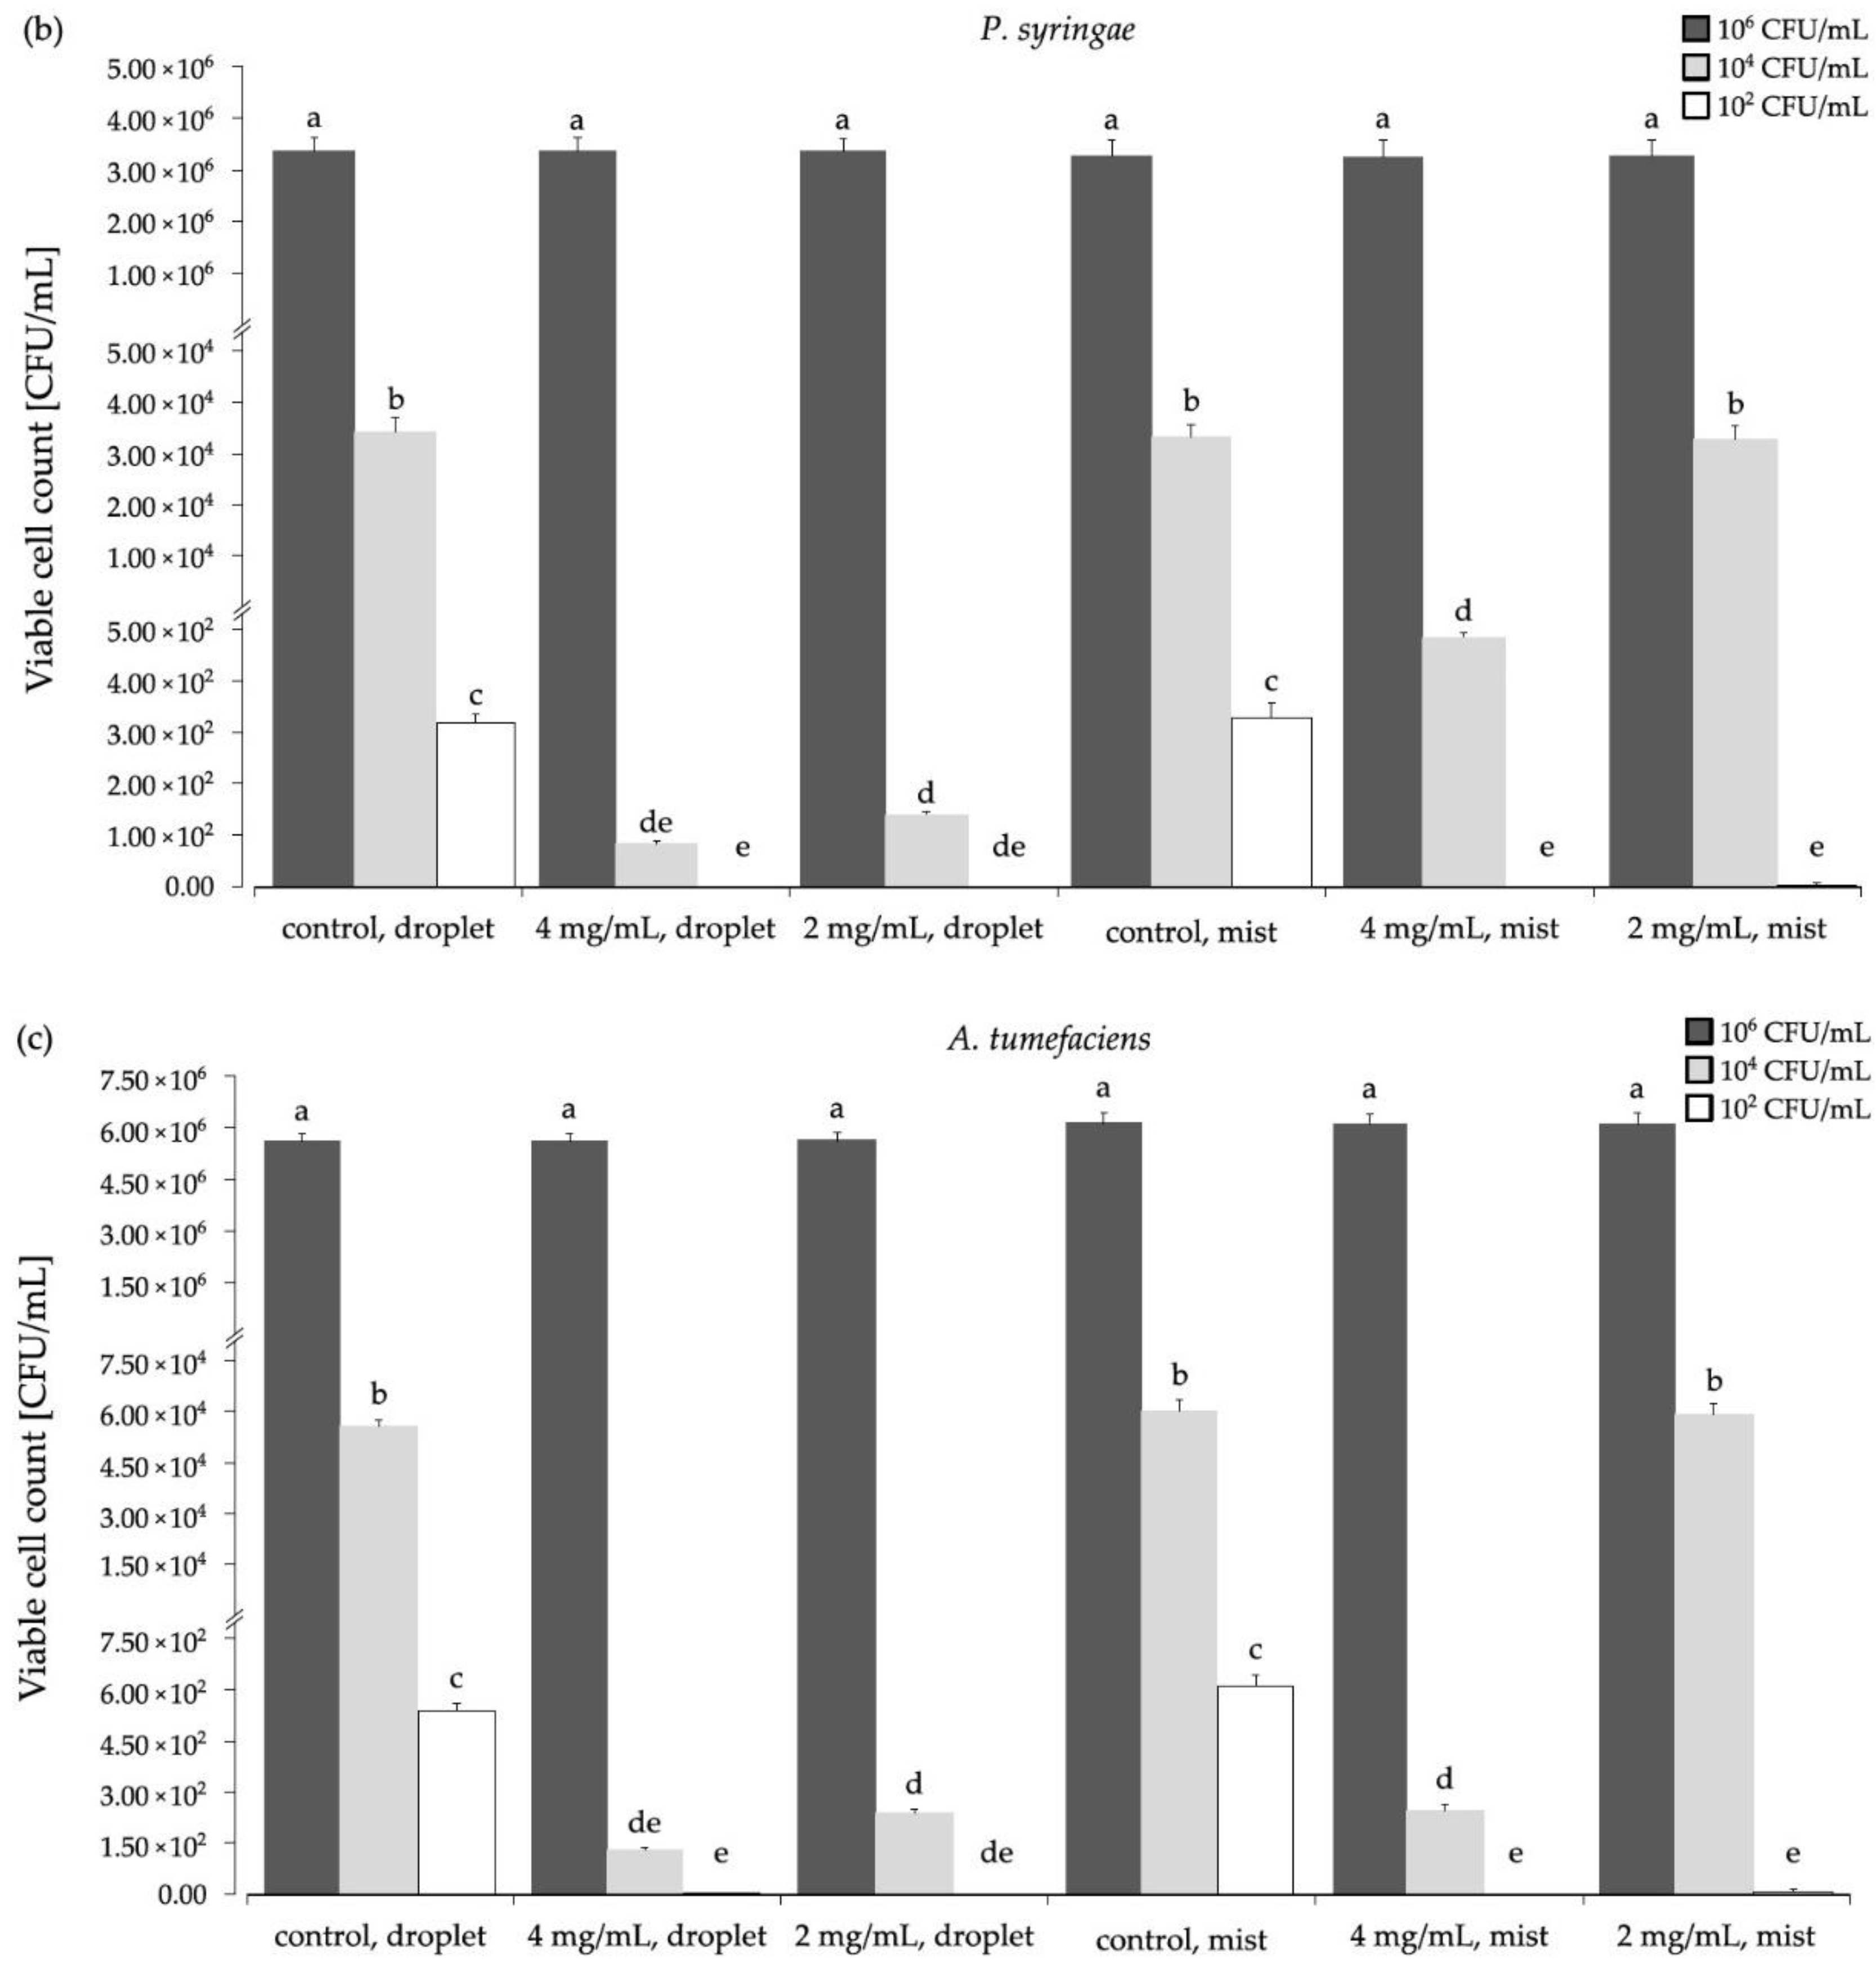
The effect of aqueous ozone on different microbial loads (102, 104, and 106 CFU/mL) of E. amylovora, P. syringae, A. tumefaciens, and B. cinerea was evaluated by estimating their survival and removal after the application of different concentrations of ozonated water (4 and 2 mg/L) in form of droplets or mist.
In general, the initial microbial load was identified as the most important factor that significantly influenced the survival of all tested phytopathogens, followed by the mode of application (Supplementary Tables S1–S4). Furthermore, with exception of P. syringae (Supplementary Table S2), a significant interaction between microbial load and application mode was detected where the biocidal effect of the application depends on the initial microbial load.
Even though aqueous ozone concentration did not significantly influence the removal of tested phytopathogens, a similar trend in the efficacy of different ozone concentrations was detected. The higher concentration of aqueous ozone (4 mg/L) applied in the form of droplets showed the strongest inhibitory effect, whereas the lower concentrations (2 mg/L) in the form of mist had the weakest effect regardless of the microbial load or the species. The aforementioned inhibitory effect is shown as a more or less pronounced decrease in CFUs depending on the combination of concentration and application (data not shown).
The efficacy of different applications and different ozone concentrations in bacterial removal is shown in Figure 3 and fungal in Figure 4.
Aqueous ozone showed a similar effect on all tested bacterial species (E. amylovora, P. syringae, and A. tumefaciens). It showed no inhibitory effect against the high initial bacterial load (106 CFU/mL), regardless of application or concentration. At medium initial microbial load (104 CFU/mL), similar microbial removal ranging between 98 and almost 100% was achieved for all tested bacterial phytopathogens (E. amylovora—4 mg/L, droplet: 99.75 ± 0.04%; 4 mg/L, mist: 99.40 ± 0.03%; 2 mg/L, droplet: 99.42 ± 0.00%; P. syringae—4 mg/L, droplet: 99.74 ± 0.02%; 4 mg/L, mist: 98.53 ± 0,11%; 2 mg/L, droplet: 99.57 ± 0.04%; and A. tumefaciens—4 mg/L, droplet: 99.77 ± 0.01%; 4 mg/L, mist: 99.59 ± 0.04%; 2 mg/L, droplet: 99.57 ± 0.01%; Supplementary Figures S2–S4). Moreover, the ozone concentration of 2 mg/L in the form of mist did not exert any bactericidal effect on E. amylovora, P. syringae, and A. tumefaciens at high (106 CFU/mL) or medium (104 CFU/mL) cell concentrations. At a low initial microbial load (102 CFU/mL), complete removal was achieved with aqueous ozone concentrations of 4 mg/L in the form of droplets and mist, and 2 mg/L in the form of droplets. Even though 2 mg/L in the form of mist was not as efficient as other combinations, it caused the reduction of viable cells equal to 1.5 log for E. amylovora, 0.9 log for P. syringae, and 0.8 log A. tumefaciens (Figure 3).
The aqueous ozone, on the other hand, strongly inhibits the growth of fungus B. cinerea at both concentrations, regardless of the type of application or the initial microbial load. Already at the initial fungal load of 106 CFU/mL, all combinations of aqueous ozone concentration and application significantly reduced the number of viable cells of B. cinerea by more than 98.0%, whereas at lower microbial loads (104 and 102 CFU/mL), the fungal removal was 100.0% (Figure 4, Supplementary Figure S5).
In summary, the initial microbial load and ozone application are significant factors that affected the effectiveness of aqueous ozone in reducing viable cell counts. Finally, the application of aqueous ozone in the form of droplets was slightly more effective in controlling bacterial growth, while this was the case with mist in fungal growth control, regardless of the concentrations used.

4. Discussion

Controlling the growth or elimination of major plant pathogens during all phases of plant food production including crop growth, storage, processing, and distribution, is a critical step in reducing food losses, thus enabling sustainable food production. Since ozone treatment is recognized as an environmentally friendly technology that does not leave harmful residuals in food products [36], and due to its antimicrobial effectiveness on a wide variety of microorganisms [14,15,16], ozone represents a valuable alternative to other antimicrobial agents for decontaminating different categories of plant food products [37,38].
The reports on the stability of aqueous ozone vary and are often contradictory. However, this is not surprising since the stability of aqueous ozone is affected by a plethora of factors such as the purity of water, initial ozone concentration, temperature, pH, presence of organic compounds and metal ions, and UV exposure. For example, Feng et al. [39] have reported that the aqueous ozone starts to break down dramatically in the first 20 min at room temperature, which is contrary to our study where the first significant drop in aqueous ozone concentrations was detected within the first 5 min. In the studies of Marino et al. [38] and Santos et al. [40], on the other hand, the aqueous ozone in tap water started to degrade in the first 5 min, which is in line with our study. Despite the greater stability of ozone in ultrapure water [40], the use of tap water would considerably reduce costs and facilitate the development and application of aqueous ozone technology. Even though some studies have shown that the presence of organic compounds in tap water can cause a severe reduction in ozone concentrations [41,42], other studies have shown that organic acids can postpone ozone degradation, e.g., the addition of only 5 mmol/L of citric acid can prolong the ozone half-life from 0.2 to 28 min [43].
Altogether, this underlines that even minuscule variations in experimental conditions may greatly influence the ozone′s tendency towards degradation, and thus highlight the need to test ozone stability before the application.
Since the antimicrobial effect of both aqueous and gaseous ozone on E. coli is well documented [36,44,45,46], E. coli was used as a model organism in identifying the optimal conditions for evaluating the antimicrobial efficacy of ozonated tap water in our study. The removal of close to 100% of viable E. coli cells was achieved at all tested concentrations of ozone during the first minute of exposure. This is in line with the studies of Białoszewsk et al. [47,48] where it was observed that ozonated water (1.3–1.5 ppm) rapidly kills all tested strains of E. coli within one minute. Contrary to our study, the study of Ersoy et al. [49] has shown that the inactivation of E. coli cells is achieved slowly where an almost total inactivation of E. coli cells is achieved after 20 min of contact time with aqueous ozone. However, in that study, a lower concentration of ozone in sterile distilled water was used (1 mg/L) when compared to our study (2 and 4 mg/L of aqueous ozone in tap water).
Even though the antimicrobial effectiveness of ozone on the various Gram-positive and Gram-negative microorganisms is well established, the studies on the bacterial phytopathogens used in this study are still scarce, and not a lot of data are available on the effect of ozone concentration on different microbial biomass, and the type of application.
To our knowledge, only a couple of studies of ozone bacteriostatic/biocidal effect on the members of Pseudomonas, Agrobacterium, and Erwinia genera [34,40,50,51,52] were conducted. Sarron et al. [50] have reported the loss of cultivability of P. syringae, as shown by a plate count method, achieved by an ozone concentration of 0.45 mg/L after 14 min, and the loss of viability, as shown by flow cytometry after 16 min. The stark difference in time needed to effectively inactivate the P. syringae when compared to our study can be explained by an almost 100 times lower ozone concentration. In contrast, Santos et al. [40] have reported that a total inactivation of P. aeruginosa can be achieved by ozone concentrations of 0.4, 0.6, and 0.8 ppm after 1 min. The lower aqueous ozone concentrations needed for the total inactivation of P. syringae when compared to our study can be attributed to the different species used, as several researchers have demonstrated that different microbial groups show varying susceptibility to ozone [53,54,55].
Unlike the studies on the ozone effect on Pseudomonas spp., studies on A. tumefaciens are extremely scarce, and to our knowledge, only one study was published so far. Contrary to our study, Younis et al. [51] have shown that high concentrations of ozonated water (15–135 ppm) exert only a bacteriostatic effect on A. tumefaciens, whereas total inactivation was achieved by exposure to gaseous ozone (50–450 ppm). Such differences have most likely risen from the different methodologies used, e.g., Kirby–Bauer method, used by Younis et al. [51] vs. the plate count method used in our study.
Furthermore, to our knowledge, only a couple of studies have been published so far on the ozone effect on E. carotovora [34,52], while none are published on E. amylovora. Shelake et al. [34] have demonstrated that very low concentrations of gaseous ozone (0.21, 0.42, and 0.63 mg/L) can reduce the microbial load of E. carotovora from 0.72 to 2.99 log CFU/g. In addition, they have shown that repeated exposure to the ozone increases the ozone efficacy. Contrary to the aforementioned study, Fan et al. [52] have demonstrated a higher efficacy of gaseous ozone when used in combination with NAI (negative air ions; 100 nL/L ozone + 106 mL−1 NAI) in comparison to the sole ozone treatment (100 nL/L ozone), where a 96% and 31% reduction of E. carotovora were achieved, respectively.
Altogether, the detected differences in ozone effectiveness in the inactivation of bacterial phytopathogens may be explained by several extrinsic parameters, including gaseous vs. aqueous ozone, pH, temperature, and humidity [50,56,57], and intrinsic characteristics of microbial populations, such as the cell age, physiological state of the culture, and the species used [54,58]. For example, Sarron et al. [50] have demonstrated that Pseudomonas spp. show higher resistance to the ozone when submitted to low temperatures before the ozone exposure, whereas Wani et al. [54] have observed that the older colonies of Pseudomonas spp. are more resistant to gaseous ozone than younger ones.
Moreover, a similar effect of ozone treatments on different initial bacterial loads was noticed in all phytopathogenic bacteria, i.e., the efficiency of removal of E. amylovora, P. syringae, and A. tumefaciens cells was strongly dependent on the bacterial load. At the inoculum concentration of 106 CFU/mL, the growth of bacteria was not reduced when compared to the control. However, at lower biomass densities of 104 and 102 CFU/mL, almost total bacterial removal (98.53–100.00%) was achieved. These results indicate considerable effectiveness of aqueous ozone when a bacterial load is below 106 CFU/mL and greater resistance of bacterial phytopathogens to the aqueous ozone treatment when present in higher biomass.
The strong dependence of the bacteriostatic/biocidal effect of aqueous ozone on the bacterial load was also reported in other studies [40,48]. For example, Santos et al. [40] have shown that ozonated tap water (0.4, 0.6, and 0.8 ppm) was not effective when bacterial biomass was above 108 CFU/mL. However, growth reduction of almost 100% of both Gram-positive (S. aureus, E. faecalis) and Gram-negative (E. coli, P. aeruginosa) bacteria was achieved at the lower bacterial number (103–105 CFU/mL). In contrast, Białoszewski et al. [48] reported that ozone concentrations of 1.2–3.6 ppm reduced the growth of microorganisms with a density of 1.5–5.0 × 10⁸ CFU/mL up to ninefold.
Moreover, our study has shown that the type of application of aqueous ozone has significantly influenced its efficacy, thus underlying the importance of choosing the appropriate parameters for the application. However, we are not familiar with any of the studies having investigated the different types of ozonated water application (droplets vs. mist), although that parameter has been tested for other compounds, such as conventional pesticides [59]. Surprisingly, our study has shown that aqueous ozone applied with a low-pressure sprayer in the form of droplets is more efficient in inhibiting bacterial growth than in the form of a mist, which is contrary to the studies that have shown that sprayers at low pressure usually provide high-volume application but with a coarse spray quality and uneven distribution of the droplets [60]. In contrast, mist sprayers provide better coverage and are thus considered more efficient. However, Rincon et al. [61] have shown that mist sprays at high pressures do not increase adherence and distribution uniformity of the mist compared with the low-pressure sprays. In addition, Massoti et al. [62] have shown that increased air humidity can negatively affect the efficiency of different disinfectants applied in the form of mist. Together, this could account for the higher efficacy of aqueous ozone applied in the form of droplets, as found in our study.
In contrast to the research that focuses on the susceptibility of Erwinia and Pseudomonas species to ozone, the studies of ozone antimicrobial activity on B. cinerea are much more prevalent, but the majority of those studies concentrate on the application of gaseous ozone [14,63,64,65,66,67], and only a few on aqueous ozone treatment [33,68,69] in preventing postharvest storage spoilage. The aforementioned studies confirmed the effectiveness of gaseous ozone in controlling spore viability and mycelial growth of B. cinerea [14,66], as well as in reducing the incidence and severity of different fruit diseases during postharvest storage [63,65]. However, improper use of gaseous ozone can cause deleterious effects on plant products, such as physical and physiological damage, and losses in sensory quality [32,70,71]. On the other hand, aqueous ozone is prone to degradation during which oxygen is produced without any harmful residues [72], thus making it a good antimicrobial agent.
In our study, B. cinerea was identified as the most susceptible phytopathogen to ozone treatment. A remarkable fungistatic/fungicidal effect, i.e., removal of more than 98% of the initial fungal load of 106 CFU/mL and total removal (100%) at lower loads (104 and 102 CFU/mL), was achieved with all combinations of ozone concentrations and types of application. Due to the different methodologies used, we cannot directly compare our results to the other studies on the antifungal efficiency of aqueous ozone on B. cinerea. However, other studies have also confirmed the antifungal effect of aqueous ozone, albeit with a seemingly lesser effect. For example, Pagès et al. [69] have shown that exposure to aqueous ozone (1 g/L) for 0.5 min inactivates B. cinerea and reduces spore germination to 12.8%. Contrary, in the study of Zhou et al. [68] similar effects (reduction of spore germination to 18.7% and inhibition of mycelium growth) were achieved at much lower aqueous ozone concentrations (0.3 mg/L) but longer exposure (5 min). Contigiani et al. [33] have demonstrated that ozone washing (3.5 mg/L) for 5 min delays the onset of B. cinerea infection and reduces its incidence without affecting the sensory properties of strawberries.
Unlike bacterial phytopathogens, the fungistatic/fungicidal effect of ozone on B. cinerea was not dependent on the fungal biomass, ozone concentration, or the type of application. The rapid removal of B. cinerea, regardless of the biomass or the application, when compared to the bacterial phytopathogens, may be explained by the different mechanisms of ozone action, i.e., through the oxidation of the membrane’s phospholipids. Moreover, the disulfide bonds in the fungal cell wall allow ozone to enter its cytoplasm and negatively alter vital cell functions [73].
In general, unlike other studies, we have not detected the dependence between the aqueous ozone concentration (4 and 2 mg/L) and biocidal effect on any of the plant pathogens used in this study (E. amylovora, P. syringae, A. tumefaciens, and B. botrytis) which might be tentatively attributed to the intrinsic factors of microbial species used, i.e., the use of young microbial cultures that make them more susceptible to the ozone treatment [54].
Finally, in water, ozone is susceptible to oxidation/reduction reactions during which the monoatomic oxygen hydroxyl and hydroxyl radicals with strong oxidation potential are formed. Therefore, aqueous ozone can break down strong molecular polar bonds in organic compounds, such as pesticides, and enables efficient removal of various organic micropollutants and pesticide residues [30,37,74], which is an additional advantage of ozonated water in treating plant material besides its antimicrobial properties. However, even though aqueous ozone is considered less harmful than gaseous form, due to its unspecific mode of action, it may exhibit deleterious effects, such as phytotoxicity, and adverse effects on beneficial soil microbiota. For example, Graham et al. [75] have shown that high residual aqueous ozone (62.5 µmol/l or greater) negatively affects the growth of perennial nursery crops. Contrary to that study, Romeo-Oliván et al. [76] reported that irrigation with ozonated water had no negative effects on the growth of young plants in grapevine nurseries. Although Díaz-López et al. [77] have shown that intermittent and continuous irrigation with ozonated water decreases the biomass of Gram-negative bacteria and fungi, respectively, it does not affect the diversity, structure, and composition of the soil microbial communities. Therefore, aqueous ozone treatment should be adjusted not only according to the phytopathogenic microorganisms but also with respect to the particular plant host and soil–plant system, preferably in a long-term experiment.

5. Conclusions

The results of our study clearly show that ozone in aqueous form is a potent antimicrobial agent. Even though ozonated water has inactivated both bacterial and fungal phytopathogens, ozone exhibited the strongest biocidal effect on fungi B. cinerea. Furthermore, ozone efficacy strongly depends on the initial microbial loads and the type of application (droplets vs. mist), regardless of the ozone concentration. We have demonstrated that the strongest biocidal effect on the bacterial phytopathogens (E. amylovora, P. syringae, and A. tumefaciens) is achieved by applying ozone in the form of droplets, whereas fungal inactivation is easily achieved by both types of ozone applications (droplets and mist).
In addition, the use of tap water not only reduces the costs of producing the ozonated water, but it simplifies the field manipulation and application. Moreover, the fast decay of aqueous ozone to non-toxic components greatly reduces the health risks for the operators.
Altogether, our study has demonstrated that ozonated water is a powerful tool for controlling the growth of plant pathogens such as E. amylovora, P. syringae, A. tumefaciens, and B. cinerea. However, in order to truly evaluate the potential of ozonated water as a replacement for conventional biocidal agents that are considered highly toxic, detrimental to human health, and cause severe environmental pollution, its antimicrobial effect on additional plant pathogens, including viruses, should be analyzed. Furthermore, it is extremely important to treat the crops and plant materials before the bacterial load achieves non-treatable values (higher than 104 CFU/g) to ensure the full power of ozonated water in preventing the contamination and/or the negative impact of phytopathogens on plant tissue. As we did not notice dependence between the aqueous ozone concentration (4 and 2 mg/L) and biocidal effect, and since the ozone stability at 2 mg/L concentration can be ensured only within the first 20 min of application, based on our results, it is recommended to apply ozone (in form of droplets) in the first 20 min of production.

Supplementary Materials

The following supporting information can be downloaded at: https://www.mdpi.com/article/10.3390/agriculture12111875/s1. Figure S1: The effect of different aqueous ozone concentrations (4 and 2 mg/L) and exposure time (1 and 20 min) on the removal of E. coli when the microbial load is fixed (106 CFU/mL). Figure S2: The effect of different aqueous ozone concentrations (4 and 2 mg/L) on the removal of E. amylovora. Significant change (p < 0.05) is indicated by lowercase letters. Figure S3: The effect of different aqueous ozone concentrations (4 and 2 mg/L) on the removal of P. syringae. Significant change (p < 0.05) is indicated by lowercase letters. Figure S4: The effect of different aqueous ozone concentrations (4 and 2 mg/L) on the removal of A. tumefaciens. Significant change (p < 0.05) is indicated by lowercase letters. Figure S5: The effect of different aqueous ozone concentrations (4 and 2 mg/L) on the removal of B. cinerea. Significant change (p < 0.05) is indicated by lowercase letters. Table S1: The effect of bacterial biomass and ozone concentration and application on the bactericidal effect of aqueous ozone on E. amylovora as shown by Analysis of Variance (ANOVA). Table S2: The effect of bacterial biomass and ozone concentration and application on the bactericidal effect of aqueous ozone on P. syringae as shown by Analysis of Variance (ANOVA). Table S3: The effect of bacterial biomass and ozone concentration and application on the bactericidal effect of aqueous ozone on A. tumefaciens as shown by Analysis of Variance (ANOVA). Table S4: The effect of fungal biomass and ozone concentration and application on the fungicidal effect of aqueous ozone on B. cinerea as shown by Analysis of Variance (ANOVA).

Author Contributions

Conceptualization, I.T. and M.M.F.; methodology, I.T. and M.M.F.; software, I.T.; validation, I.T. and M.M.F.; formal analysis, I.T. and M.M.F.; investigation, I.T.; resources, M.M.F.; data curation, I.T.; writing—original draft preparation, I.T. and M.M.F.; writing—review and editing, M.M.F.; visualization, I.T.; supervision, M.M.F.; project administration, M.M.F.; funding acquisition, M.M.F. All authors have read and agreed to the published version of the manuscript.

Funding

This research received no external funding.

Institutional Review Board Statement

Not applicable.

Informed Consent Statement

Not applicable.

Data Availability Statement

Not applicable.

Acknowledgments

We would like to acknowledge the company VEZ Farmachem d. o. o., Zagreb, Croatia that provided the instrument for the production of ozonated water.

Conflicts of Interest

The authors declare no conflict of interest.

References

  1. Oerke, E.C. Crop Losses to Pests. J. Agric. Sci. 2006, 144, 31–43. [Google Scholar] [CrossRef]
  2. Bhattarai, D.R. Postharvest Horticulture in Nepal. Hortic. Int. J. 2018, 2, 458–460. [Google Scholar] [CrossRef] [Green Version]
  3. Food and Agriculture Organization of the United Nations. The State of Food and Agriculture—Moving Forward on Food Loss and Waste Reduction; Food and Agriculture Organization of the United Nations: Rome, Italy, 2019. [Google Scholar]
  4. Buttimer, C.; McAuliffe, O.; Ross, R.P.; Hill, C.; O’Mahony, J.; Coffey, A. Bacteriophages and Bacterial Plant Diseases. Front. Microbiol. 2017, 8, 34. [Google Scholar] [CrossRef] [PubMed] [Green Version]
  5. Ray, D.K.; Mueller, N.D.; West, P.C.; Foley, J.A. Yield Trends Are Insufficient to Double Global Crop Production by 2050. PLoS ONE 2013, 8, e66428. [Google Scholar] [CrossRef] [PubMed] [Green Version]
  6. Abhilash, P.C.; Singh, N. Pesticide Use and Application: An Indian Scenario. J. Hazard. Mater. 2009, 165, 1–12. [Google Scholar] [CrossRef]
  7. Rajmohan, K.S.; Chandrasekaran, R.; Varjani, S. A Review on Occurrence of Pesticides in Environment and Current Technologies for Their Remediation and Management. Indian J. Microbiol. 2020, 60, 125–138. [Google Scholar] [CrossRef]
  8. Miller, S.A.; Ferreira, J.P.; Lejeune, J.T. Antimicrobial Use and Resistance in Plant Agriculture: A One Health Perspective. Agriculture 2022, 12, 289. [Google Scholar] [CrossRef]
  9. Kannan, V.R.; Bastas, K.K.; Devi, R.S. Scientific and Economic Impact of Plant Pathogenic Bacteria. In Sustainable Approaches to Controlling Plant Pathogenic Bacteria; Kannan, V.R., Bastas, K.K., Eds.; CRC Press: Boca Raton, FL, USA, 2015; pp. 369–392. [Google Scholar]
  10. Agrios, G.N. Plant Pathology, 5th ed.; Academic Press: San Diego, CA, USA, 2005. [Google Scholar]
  11. Dean, R.; Van Kan, J.A.L.; Pretorius, Z.A.; Hammond-Kosack, K.E.; Di Pietro, A.; Spanu, P.D.; Rudd, J.J.; Dickman, M.; Kahmann, R.; Ellis, J.; et al. The Top 10 Fungal Pathogens in Molecular Plant Pathology. Mol. Plant Pathol. 2012, 13, 414–430. [Google Scholar] [CrossRef] [Green Version]
  12. Mansfield, J.; Genin, S.; Magori, S.; Citovsky, V.; Sriariyanum, M.; Ronald, P.; Dow, M.; Verdier, V.; Beer, S.V.; Machado, M.A.; et al. Top 10 Plant Pathogenic Bacteria in Molecular Plant Pathology. Mol. Plant Pathol. 2012, 13, 614–629. [Google Scholar] [CrossRef] [Green Version]
  13. Martins, P.M.M.; Merfa, M.V.; Takita, M.A.; De Souza, A.A. Persistence in Phytopathogenic Bacteria: Do We Know Enough? Front. Microbiol. 2018, 9, 1099. [Google Scholar] [CrossRef]
  14. Sharpe, D.; Fan, L.; McRae, K.; Walker, B.; MacKay, R.; Doucette, C. Effects of Ozone Treatment on Botrytis Cinerea and Sclerotinia Sclerotiorum in Relation to Horticultural Product Quality. J. Food Sci. 2009, 74, M250–M257. [Google Scholar] [CrossRef] [PubMed]
  15. Thanomsub, B.; Anupunpisit, V.; Chanphetch, S.; Watcharachaipong, T.; Poonkhum, R.; Srisukonth, C. Effects of Ozone Treatment on Cell Growth and Ultrastructural Changes in Bacteria. J. Gen. Appl. Microbiol. 2002, 48, 193–199. [Google Scholar] [CrossRef] [PubMed] [Green Version]
  16. Fontes, B.; Cattani Heimbecker, A.M.; de Souza Brito, G.; Costa, S.F.; van der Heijden, I.M.; Levin, A.S.; Rasslan, S. Effect of Low-Dose Gaseous Ozone on Pathogenic Bacteria. BMC Infect. Dis. 2012, 12, 358. [Google Scholar] [CrossRef] [PubMed] [Green Version]
  17. Vitali, G.; Valdenassi, L. Use of Ozone in Water, Agriculture and Zootechnics: Relationships between Dysbiosis and Mental Disorders. Ozone Ther. 2019, 4, 8182. [Google Scholar] [CrossRef]
  18. Batakliev, T.; Georgiev, V.; Anachkov, M.; Rakovsky, S.; Zaikov, G.E. Ozone Decomposition. Interdiscip. Toxicol. 2014, 7, 47–59. [Google Scholar] [CrossRef] [Green Version]
  19. Greene, A.K.; Güzel-Seydim, Z.B.; Seydim, A.C. Chemical and Physical Properties of Ozone. In Ozone in Food Processing; O’Donnell, C., Tiwari, B.K., Cullen, P.J., Rice, R.G., Eds.; Blackwell Publishing Ltd.: Chichester, UK, 2012; pp. 19–32. [Google Scholar]
  20. Zhang, Y.Q.; Wu, Q.P.; Zhang, J.M.; Yang, X.H. Effects of Ozone on Membrane Permeability and Ultrastructure in Pseudomonas Aeruginosa. J. Appl. Microbiol. 2011, 111, 1006–1015. [Google Scholar] [CrossRef]
  21. Jian, F.; Jayas, D.S.; White, N.D.G. Can Ozone Be a New Control Strategy for Pests of Stored Grain? Agric. Res. 2013, 2, 1–8. [Google Scholar] [CrossRef]
  22. Rice, R.G.; Graham, D.M.U.S. FDA Regulatory Approval of Ozone as an Antimicrobial Agent—What Is Allowed and What Needs to Be Understood. Ozone News 2001, 29, 22–31. [Google Scholar]
  23. Regulation (EU) No 528/2012 of the European Parliament and of the Council of 22 May 2012 concerning the making available on the market and use of biocidal products. Off. J. Eur. Union 2012, 49, 181–303. Available online: https://eur-lex.europa.eu/legal-content/EN/TXT/PDF/?uri=CELEX:32012R0528&from=EN (accessed on 16 September 2022).
  24. The United States Department of Agriculture. Ozone Technical Evaluation Report. 2021. Available online: https://www.ams.usda.gov/sites/default/files/media/USDANOPTechnicalReport_Ozone.pdf (accessed on 16 September 2022).
  25. Díaz-López, M.; Nicolás, E.; López-Mondéjar, R.; Galera, L.; Garrido, I.; Fenoll, J.; Bastida, F. Combined Ozonation and Solarization for the Removal of Pesticides from Soil: Effects on Soil Microbial Communities. Sci. Total Environ. 2021, 758, 143950. [Google Scholar] [CrossRef]
  26. Prudente, A.D.; King, J.M. Efficacy and Safety Evaluation of Ozonation to Degrade Aflatoxin in Corn. J. Food Sci. 2002, 67, 2866–2872. [Google Scholar]
  27. Raudales, R.E.; Parke, J.L.; Guy, C.L.; Fisher, P.R. Control of Waterborne Microbes in Irrigation: A Review. Agric. Water Manag. 2014, 143, 9–28. [Google Scholar] [CrossRef]
  28. Tiwari, B.K.; Brennan, C.S.; Curran, T.; Gallagher, E.; Cullen, P.J.; O’ Donnell, C.P. Application of Ozone in Grain Processing. J. Cereal Sci. 2010, 51, 248–255. [Google Scholar] [CrossRef]
  29. Veronico, P.; Paciolla, C.; Sasanelli, N.; De Leonardis, S.; Melillo, M.T. Ozonated Water Reduces Susceptibility in Tomato Plants to Meloidogyne Incognita by the Modulation of the Antioxidant System. Mol. Plant Pathol. 2017, 18, 529–539. [Google Scholar] [CrossRef] [Green Version]
  30. Özen, T.; Koyuncu, M.A.; Erbaş, D. Effect of Ozone Treatments on the Removal of Pesticide Residues and Postharvest Quality in Green Pepper. J. Food Sci. Technol. 2021, 58, 2186–2196. [Google Scholar] [CrossRef] [PubMed]
  31. Paul, A.; Radhakrishnan, M.; Anandakumar, S.; Shanmugasundaram, S.; Anandharamakrishnan, C. Disinfestation Techniques for Major Cereals: A Status Report. Compr. Rev. Food Sci. Food Saf. 2020, 19, 1125–1155. [Google Scholar] [CrossRef] [PubMed] [Green Version]
  32. Sarron, E.; Gadonna-Widehem, P.; Aussenac, T. Ozone Treatments for Preserving Fresh Vegetables Quality: A Critical Review. Foods 2021, 10, 605. [Google Scholar] [CrossRef]
  33. Contigiani, E.V.; Kronberg, M.F.; Jaramillo Sánchez, G.; Gómez, P.L.; García-Loredo, A.B.; Munarriz, E.; Alzamora, S.M. Ozone Washing Decreases Strawberry Susceptibility to Botrytis Cinerea While Maintaining Antioxidant, Optical and Sensory Quality. Heliyon 2020, 6, e05416. [Google Scholar] [CrossRef]
  34. Shelake, P.S.; Mohapatra, D.; Tripathi, M.K.; Giri, S.K.; Kate, A.; Kumar, M. Inactivation of Aspergillus Niger and Erwinia Carotovora in Onion (Allium Cepa L.) Bulbs Subjected to Pulsed Ozone Treatment. Postharvest Biol. Technol. 2022, 192, 111998. [Google Scholar] [CrossRef]
  35. R Core Team. R: A Language and Environment for Statistical Computing; R Foundation for Statistical Computing: Vienna, Austria, 2013. [Google Scholar]
  36. Panebianco, F.; Rubiola, S.; Di Ciccio, P.A. The Use of Ozone as an Eco-Friendly Strategy against Microbial Biofilm in Dairy Manufacturing Plants: A Review. Microorganisms 2022, 10, 162. [Google Scholar] [CrossRef] [PubMed]
  37. Guo, Z.; Wang, Q. Efficacy of Ozonated Water against Erwinia Carotovora Subsp. Carotovora in Brassica Campestris Ssp. Chinensis. Ozone Sci. Eng. 2017, 39, 127–136. [Google Scholar] [CrossRef]
  38. Marino, M.; Maifreni, M.; Baggio, A.; Innocente, N. Inactivation of Foodborne Bacteria Biofilms by Aqueous and Gaseous Ozone. Front. Microbiol. 2018, 9, 2024. [Google Scholar] [CrossRef] [PubMed] [Green Version]
  39. Feng, L.; Zhang, K.; Gao, M.; Shi, C.; Ge, C.; Qu, D.; Zhu, J.; Shi, Y.; Han, J. Inactivation of Vibrio Parahaemolyticus by Aqueous Ozone. J. Microbiol. Biotechnol. 2018, 28, 1233–1246. [Google Scholar] [CrossRef] [PubMed]
  40. Santos, L.M.C.; da Silva, E.S.; Oliveira, F.O.; Rodrigues, L.D.A.P.; Neves, P.R.F.; Meira, C.S.; Moreira, G.A.F.; Lobato, G.M.; Nascimento, C.; Gerhardt, M.; et al. Ozonized Water in Microbial Control: Analysis of the Stability, In Vitro Biocidal Potential, and Cytotoxicity. Biology 2021, 10, 525. [Google Scholar] [CrossRef]
  41. Kim, J.-G.; Youself, A.E.; Khadre, M.A. Ozone and Its Current and Future Application in the Food Industry. In Advances in Food and Nutrition Research; Taylor, S.L., Ed.; Academic Press: San Diego, CA, USA, 2003; pp. 168–218. [Google Scholar]
  42. Rahman, M.F.; Jasim, S.Y.; Yanful, E.K.; Ndiongue, S.; Borikar, D.; Jasim, S.Y.; Yanful, E.K.; Ndiongue, S.; Borikar, D. Advanced Oxidation Treatment of Drinking Water: Part II. Turbidity, Particles and Organics Removal from Lake Huron Water. Ozone Sci. Eng. 2010, 32, 295–304. [Google Scholar] [CrossRef]
  43. Hirahara, Y.; Iwata, K.; Nakamuro, K. Effect of Citric Acid on Prolonging the Half-Life of Dissolved Ozone in Water. Food Saf. 2019, 7, 90–94. [Google Scholar] [CrossRef] [Green Version]
  44. Alexander, J.; Knopp, G.; Dötsch, A.; Wieland, A.; Schwartz, T. Ozone Treatment of Conditioned Wastewater Selects Antibiotic Resistance Genes, Opportunistic Bacteria, and Induce Strong Population Shifts. Sci. Total Environ. 2016, 559, 103–112. [Google Scholar] [CrossRef]
  45. Martinelli, M.; Giovannangeli, F.; Rotunno, S.; Trombetta, C.M.; Montomoli, E. Water and Air Ozone Treatment as an Alternative Sanitizing Technology. J. Prev. Med. Hyg. 2017, 58, E48–E52. [Google Scholar] [CrossRef] [Green Version]
  46. Failor, K.C.; Silver, B.; Yu, W.; Heindl, J.E. Bio Film Disruption and Bactericidal Activity of Aqueous Ozone Coupled with Ultrasonic Dental Scaling. JADA Found. Sci. 2022, 1, 100003. [Google Scholar] [CrossRef]
  47. Bialoszewski, D.; Pietruczuk-Padzik, A.; Kalicinska, A.; Bocian, E.; Czajkowska, M.; Bukowska, B.; Tyski, S. Activity of Ozonated Water and Ozone against Staphylococcus Aureus and Pseudomonas Aeruginosa Biofilms. Med. Sci. Monit. 2011, 17, BR339–BR344. [Google Scholar] [CrossRef] [Green Version]
  48. Białoszewski, D.; Bocian, E.; Bukowska, B.; Czajkowska, M.; Sokół-Leszczyńska, B.; Tyski, S. Antimicrobial Activity of Ozonated Water. Med. Sci. Monit. 2010, 16, MT71-5. [Google Scholar] [PubMed]
  49. Ersoy, Z.G.; Barisci, S.; Turkay, O. Mechanisms of the Escherichia Coli and Enterococcus Faecalis Inactivation by Ozone. LWT—Food Sci. Technol. 2019, 100, 306–313. [Google Scholar] [CrossRef]
  50. Sarron, E.; Cochet, N.; Gadonna-Widehem, P. Effects of Aqueous Ozone on Pseudomonas Syringae Viability and Ice Nucleating Activity. Process Biochem. 2013, 48, 1004–1009. [Google Scholar] [CrossRef]
  51. Younis, A.M.; Shoeib, A.A.; Elsaedy, M.A.; Osman, K.A. Efficacy of Ozone and Hydrogen Peroxide on Controlling Crown Gall Bacterium and Root Knot Nematode Infected Guava Plants in Egypt. Alex. J. Agric. Sci. 2016, 61, 517–527. [Google Scholar]
  52. Fan, L.; Song, J.; Hildebrand, P.D.; Forney, C.F. Interaction of Ozone and Negative Air Ions to Control Micro-Organisms. J. Appl. Microbiol. 2002, 93, 144–148. [Google Scholar] [CrossRef]
  53. Marsili, L.; Espie, S.; Anderson, J.G.; Macgregor, S.J. Plasma Inactivation of Food-Related Microorganisms in Liquids. Radiat. Phys. Chem. 2002, 65, 507–513. [Google Scholar] [CrossRef]
  54. Wani, S.; Barnes, J.; Singleton, I. Investigation of Potential Reasons for Bacterial Survival on ‘Ready-to-Eat’ Leafy Produce during Exposure to Gaseous Ozone. Postharvest Biol. Technol. 2016, 111, 185–190. [Google Scholar] [CrossRef] [Green Version]
  55. Gibson, K.E.; Almeida, G.; Jones, S.L.; Wrught, K.; Lee, J.A. Inactivation of Bacteria on Fresh Produce by Batch Wash Ozone Sanitation. Food Control. 2019, 106, 106747. [Google Scholar] [CrossRef]
  56. Kim, J.; Yousef, A.E.; Dave, S. Application of Ozone for Enhancing the Microbiological Safety and Quality of Foods: A Review. J. Food Prot. 1999, 62, 1071–1087. [Google Scholar] [CrossRef]
  57. Epelle, E.I.; Emmerson, A.; Nekrasova, M.; Macfarlane, A.; Cusack, M.; Burns, A.; Mackay, W.; Yaseen, M. Microbial Inactivation: Gaseous or Aqueous Ozonation? Ind. Eng. Chem. Res. 2022, 61, 9600–96101. [Google Scholar] [CrossRef]
  58. Kroupitski, Y.; Pinto, R.; Brandl, M.T.; Belausov, E.; Sela, S. Interactions of Salmonella Enterica with Lettuce Leaves. J. Appl. Microbiol. 2009, 106, 1876–1885. [Google Scholar] [CrossRef] [PubMed]
  59. Wang, S.; Xu, T.; Li, X. Development Status and Perspectives of Crop Protection Machinery and Techniques for Vegetables. Horticulture 2022, 8, 166. [Google Scholar] [CrossRef]
  60. Lee, A.W.; Miller, P.C.H.; Power, J.D. The Application of Pesticide Sprays to Tomato Crops. Asp. Appl. Biol. 2000, 57, 383–390. [Google Scholar]
  61. Rincon, V.J.; Sanchez-Hermosilla, J.; Paez, F.; Perez-Alonso, J.; Callejon, A.J. Assessment of the Influence of Working Pressure and Application Rate on Pesticide Spray Application with a Hand-Held Spray Gun on Greenhouse Pepper Crops. Crop Prot. 2017, 96, 7–13. [Google Scholar] [CrossRef]
  62. Masotti, F.; Cattaneo, S.; Stuknytė, M.; Noni, I. De Airborne Contamination in the Food Industry: An Update on Monitoring and Disinfection Techniques of Air. Trends Food Sci. Technol. 2019, 90, 147–156. [Google Scholar] [CrossRef]
  63. Testempasis, S.; Tanou, G.; Minas, I.; Samiotaki, M.; Molassiotis, A.; Karaoglanidis, G. Unraveling Interactions of the Necrotrophic Fungal Species Botrytis Cinerea with 1-Methylcyclopropene or Ozone-Treated Apple Fruit Using Proteomic Analysis. Front. Plant Sci. 2021, 12, 644255. [Google Scholar] [CrossRef]
  64. Tzortzakis, N.; Taybi, T.; Antony, E.; Singleton, I.; Borland, A.; Barnes, J. Profiling Shifts in Protein Complement in Tomato Fruit Induced by Atmospheric Ozone-Enrichment and/or Wound-Inoculation with Botrytis Cinerea. Postharvest Biol. Technol. 2013, 78, 67–75. [Google Scholar] [CrossRef]
  65. Luo, A.; Bai, J.; Li, R.; Fang, Y.; Li, L.; Wang, D.; Zhang, L.; Liang, J.; Huang, T.; Kou, L. Effects of Ozone Treatment on the Quality of Kiwifruit during Postharvest Storage Affected by Botrytis Cinerea and Penicillium Expansum. J. Phytopathol. 2019, 167, 470–478. [Google Scholar] [CrossRef]
  66. Nadas, A.; Olmo, M.; Garcia, J.M. Growth of Botrytis Cinerea and Strawberry Quality in Ozone-Enriched Atmospheres. J. Food Sci. 2003, 68, 1798–1802. [Google Scholar] [CrossRef]
  67. Ozkan, R.; Smilanick, J.L.; Karabulut, O.A. Toxicity of Ozone Gas to Conidia of Penicillium Digitatum, Penicillium Italicum, and Botrytis Cinerea and Control of Gray Mold on Table Grape. Postharvest Biol. Technol. 2011, 60, 47–51. [Google Scholar] [CrossRef]
  68. Zhou, D.; Wang, Z.; Tu, S.; Chen, S.; Peng, J.; Tu, K. Effects of Cold Plasma, UV-C or Aqueous Ozone Treatment on Botrytis Cinerea and Their Potential Application in Preserving Blueberry. J. Appl. Microbiol. 2019, 127, 175–185. [Google Scholar] [CrossRef] [PubMed]
  69. Pagès, M.; Kleiber, D.; Pierron, R.J.G.; Violleau, F. Ozone Effects on Botrytis Cinerea Conidia Using a Bubble Column: Germination Inactivation and Membrane Phospholipids Oxidation. Ozone Sci. Eng. 2015, 38, 62–69. [Google Scholar] [CrossRef] [Green Version]
  70. Liew, C.L.; Prange, R.K. Effect of Ozone and Storage Temperature on Postharvest Diseases and Physiology of Carrots (Daucus Carota L.). J. Am. Soc. Hortic. Sci. 1994, 119, 563–567. [Google Scholar] [CrossRef] [Green Version]
  71. Calatayud, A.; Barreno, E. Response to Ozone in Two Lettuce Varieties on Chlorophyll a Fluorescence, Photosynthetic Pigments and Lipid Peroxidation. Plant Physiol. Biochem. 2004, 42, 549–555. [Google Scholar] [CrossRef]
  72. Seki, M.; Ishikawa, T.; Terada, H.; Nashimoto, M. Microbicidal Effects of Stored Aqueous Ozone Solution Generated by Nano-Bubble Technology. In Vivo 2017, 31, 579–583. [Google Scholar] [PubMed]
  73. Ouf, S.A.; Moussa, T.A.; Abd-Emegeed, A.M.; Eltahlawy, S.R. Anti-Fungal Potential of Ozone against Some Dermatophytes. Brazilian J. Microbiol. 2016, 47, 697–702. [Google Scholar] [CrossRef] [Green Version]
  74. Liu, C.; Chen, C.; Jiang, A.; Zhang, Y.; Zhao, Q.; Hu, W. Effects of Aqueous Ozone Treatment on Microbial Growth, Quality, and Pesticide Residue of Fresh-Cut Cabbage. Food Sci. Nutr. 2021, 9, 52–61. [Google Scholar] [CrossRef]
  75. Graham, T.; Zhang, P.; Zheng, Y.; Dixon, M.A. Phytotoxicity of Aqueous Ozone on Five Container-Grown Nursery Species. HortScience. 2009, 44, 774–780. [Google Scholar] [CrossRef]
  76. Romeo-Oliván, A.; Pagès, M.; Breton, C.; Lagarde, F.; Cros, H.; Yobrégat, O.; Violleau, F.; Jacques, A. Ozone Dissolved in Water: An Innovative Tool for the Production of Young Plants in Grapevine Nurseries? Ozone Sci. Eng. 2021, 44, 521–535. [Google Scholar] [CrossRef]
  77. Díaz-López, M.; Siles, J.A.; Ros, C.; Bastida, F.; Nicolás, E. The Effects of Ozone Treatments on the Agro-Physiological Parameters of Tomato Plants and the Soil Microbial Community. Sci. Total Environ. 2022, 812, 151429. [Google Scholar] [CrossRef]
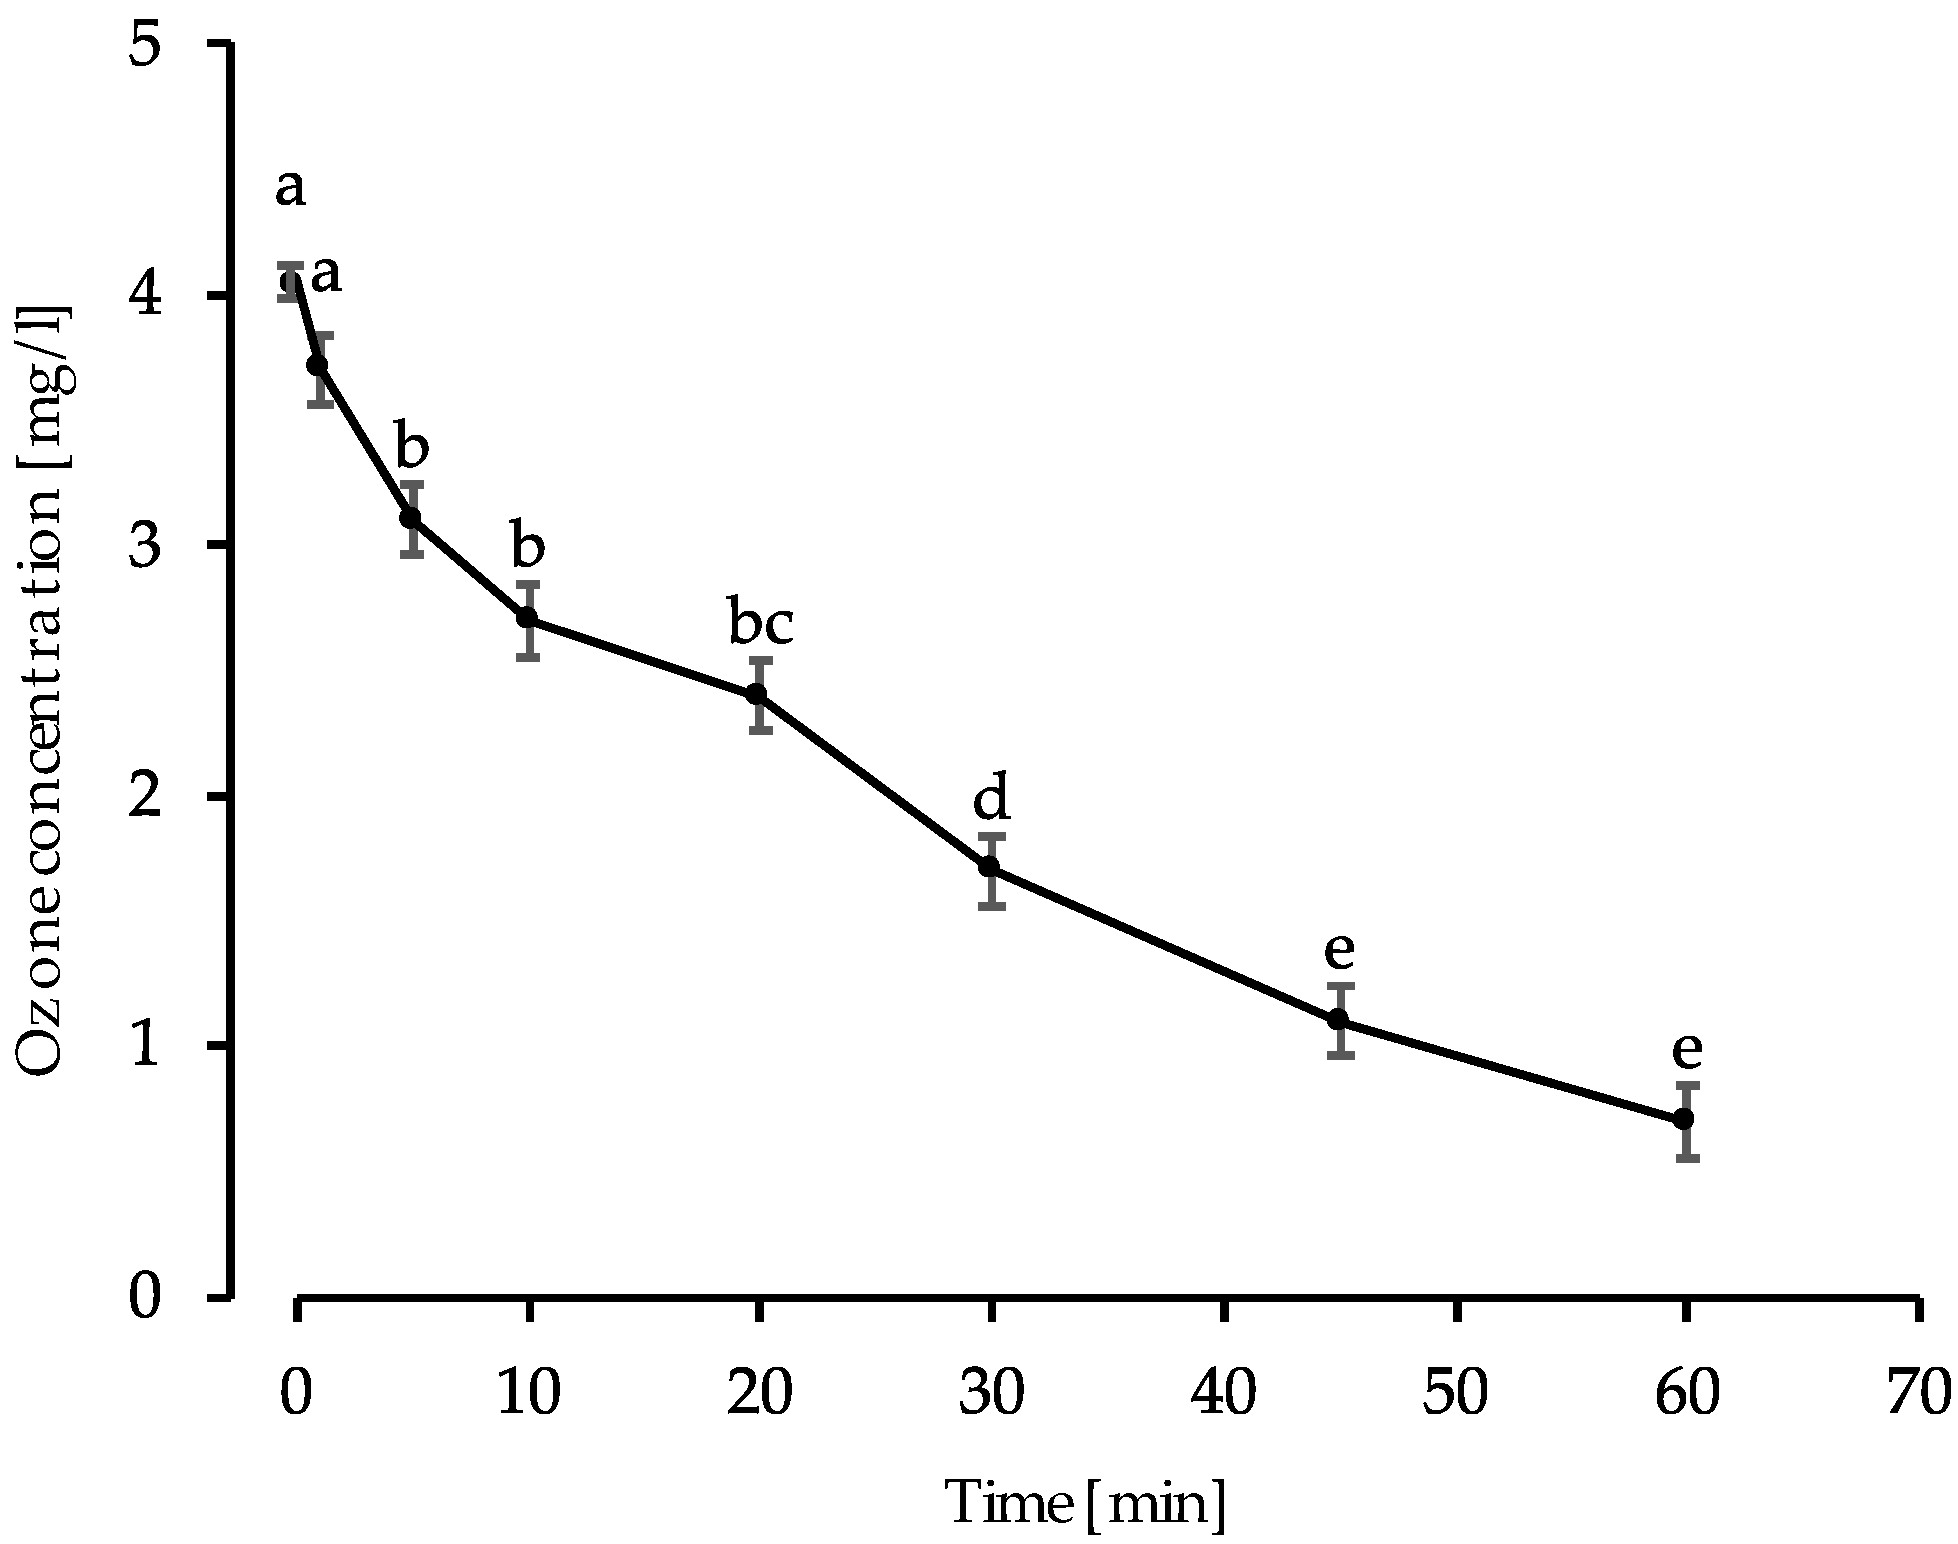
Figure 1. The degradation of ozone in tap water at 22 °C. Significant change (p < 0.05) in ozone concentration is indicated by lowercase letters (a–e).
Agriculture 12 01875 g001
Figure 2. Effect of different aqueous ozone concentrations (4 and 2 mg/L) and exposure times (1 and 20 min) on the survival of E. coli when the microbial load is fixed (106 CFU/mL). Significant change (p < 0.05) is indicated by lowercase letters (a,b).
Agriculture 12 01875 g002
Figure 3. The effect of different aqueous ozone concentrations (4 and 2 mg/L) and application (droplet vs. mist) on the survival of bacterial phytopathogens with variable microbial load (106, 104, and 102 CFU/mL): (a) the absolute count of viable E. amylovora; (b) the absolute count of viable P. syringae; (c) the absolute count of viable A. tumefaciens. Significant change (p < 0.05) is indicated by lowercase letters.
Agriculture 12 01875 g003aAgriculture 12 01875 g003b
Figure 4. The effect of different aqueous ozone concentrations (4 and 2 mg/L) and application (droplet vs. mist) on the survival of fungal phytopathogen with variable microbial load (106, 104, and 102 CFU/mL): the absolute count of viable B. cinerea. Significant change (p < 0.05) is indicated by lowercase letters.
Agriculture 12 01875 g004
Publisher’s Note: MDPI stays neutral with regard to jurisdictional claims in published maps and institutional affiliations.