Article

Sustainability of Farms in EU Countries in the Context of Income Indicators: Regression Analysis Based on a New Classification

1
Faculty of Economics, Department of Finance, Technical University of Košice, 04200 Kosice, Slovakia
2
Faculty of Economics, Department of Banking and Investment, Technical University of Košice, 04200 Kosice, Slovakia
*
Author to whom correspondence should be addressed.
Agriculture 2022, 12(11), 1884; https://doi.org/10.3390/agriculture12111884
Submission received: 6 September 2022 / Revised: 18 October 2022 / Accepted: 6 November 2022 / Published: 9 November 2022
(This article belongs to the Special Issue Application of Econometrics in Agricultural Production)

Abstract

:
The sustainability of agriculture in the common market of the European Union is mainly influenced by the income of agricultural enterprises, which reflects the development potential of the entire sector. The present contribution deals with the importance of income indicators for the long-term sustainability of agricultural enterprises. We aimed to identify and quantify statistically significant determinants of the main income indicators of agricultural enterprises in individual countries of the European Union—namely, the net added value of the farm expressed per unit of agricultural work, the family farm income per family work unit, and the net farm income. We performed a linear regression analysis, in which the statistical significance of independent variables was gradually tested, including economic and environmental indicators, the economic size of the enterprise, total subsidies per hectare, depreciation, taxes, and wages. The established goal was complemented by a correlation analysis tracking the dependence between the economic size of enterprises—which is presented in the literature as a decisive indicator—and the tax burden in EU countries. We used the Farm Accountancy Data Network’s harmonised database for 2009–2018. The regression analysis results confirmed the environmental indicators’ statistical significance. Furthermore, the results of the correlation analysis confirmed the proposed hypothesis that the size of the company is a strong indicator and affects the tax burden of agricultural enterprises.

1. Introduction

The incomes of agricultural enterprises are among the most important economic factors in agriculture, as they reflect the development potential of this sector. Agricultural entities in the European Union are characterised by their diversity in terms of legal form, size, technological equipment, natural conditions, and the tax systems of their specific countries, which affect their results in the area of income. According to Bayramoglu et al. [1] and Vrolijk and Poppe [2], one of the main challenges of research on agricultural income in the European Union is that agricultural holdings in the EU are very heterogeneous. This is mainly due to natural, environmental, historical, social, cultural, and economic factors. However, here, in addition to the diversity of factors, it is necessary to focus on monitoring sustainable agricultural production systems, which will be successful provided that such systems are economically viable, socially acceptable, and environmentally sensitive [3,4,5]. It is generally known that agricultural producers’ incomes are lower than those achieved in other sectors of the economy. Despite the wide range of intervention tools applied within the framework of the Common Agricultural Policy (CAP), it is possible to observe the problem of income disparity in most EU countries [6,7].
For this reason, agricultural incomes are a perpetual area of interest for agricultural policy. At the same time, a clear identification of their determinants should precede increases in the incomes of agricultural producers. Therefore, in this study, we focused on the identification and detailed analysis of three income indicators of the European Union—namely, the net added value of the farm expressed per agricultural labour unit (FNVA/AWU), the family farm income expressed per family labour unit (FFI/FWU), and the farms’ net income (FNI)—which are defined and monitored by the European Commission [8]. For this reason, we chose these indicators and used them as dependent variables in linear regression models and correlation analyses, and followed them between 2009 and 2018.

2. Literature Review

Companies operate in an open environment and have constant contact with stakeholders [9], where their management determines their economic, managerial, and social goals [10]. Enterprise income has many economic functions, and so it should be considered an essential determinant in agriculture. However, in general, agricultural income is susceptible to long-term pressure, leading to a decline. Moreover, according to Will [11], these incomes are associated with short-term instability, since agricultural enterprises have some geographical and other indirect differences.
Despite the EU’s Common Agricultural Policy mechanisms, one of the main challenges in farm income research is that agricultural enterprises are remarkably diverse. This is partially due to natural and environmental indicators, as well as historical, social, cultural, and economic indicators. All of these elements form an agricultural model in the observed area. The type of agricultural model that is dominant in the geographical or administrative region may influence the potential determinants of farm income—as stated by Kryszak [12]—and income levels. However, it is questionable as to whether representative agricultural enterprises in various agricultural types and models also differ in terms of profit (i.e., income) efficiency, understood as transforming inputs in different types of costs for a profit effect (i.e., net farm income). We assume that in those regions where agriculture is more intensive and developed, farm income is higher. Still, the efficiency of its generation may be lower as a result of the law of diminishing marginal returns. In other words, an increase in expenditures (i.e., costs) no longer results in a satisfactory increase in efficiency (in this case, revenue).
Over the past two decades, the EU’s Common Agricultural Policy (CAP) has developed from market intervention instruments to untied farm-specific measures that seek to enhance the environmental performance of the EU’s agricultural sector. The basis of this policy was the introduction of the Single Payment Scheme (SPS) in 2005. In 2013, another CAP reform proposed a mandatory component of direct payments—“greening”—to support climate-friendly farming practices. Other farm-specific measures introduced by the CAP reform include restrictions on direct payments and schemes for young farmers and small farmers [13].
One of the aims of the CAP is the stability of farm income [14]. The argument for this aim is based on the adverse effects of instability on farmers’ decisions, their ability to expand operations, and secondary effects on agribusinesses and creditors [15,16].
The barriers to monitoring and designing instruments introduced by the CAP reform to support farmers in overcoming risks can be attributed to the lack of empirical evidence of income volatility in the EU [17,18,19].
In addition, farms are characterised by short-term instability, as there are geographical and other indirect differences between farms, as discussed by Will [11].
Because of the limited availability of data and analysis focused on agricultural policy, the EU primarily focuses on family farm income. However, this does not apply to the recent Swiss Farm Accountancy Data Network analysis, which also collects data on income outside of farms [11].
The agricultural model that dominates a given geographical or administrative region can influence the role of potential determinants of income in agriculture—as mentioned by Kryszak [12]—as well as the levels of income itself.
Although many studies have dealt with price and return volatility, relatively little research has specifically focused on the stability of total farm income. According to Mishra and Sandretto [14], this represents a significant knowledge gap, and “farmers are ultimately concerned more about their net incomes than about prices and costs”.
Severini, Tantari, and Di Tommaso [20] focused on net farm income as remuneration for fixed production indicators of the family (i.e., labour, land, capital) and remuneration for business risk. Kołoszko-Chomentowska [21] dealt with the levels of family farm income and reinvestment of fixed assets; based on their results, the level of family farm income was mainly dependent on subsidies and subventions, while there was a low correlation between family farm income and net investment value.
Based on the ordinary least squares method, Galluzzo [22] used a multiple regression model focusing on all Romanian farms for which there were FADN data in 2007–2015. He examined the relationships between the dependent variable—the variation in the levels of farmers’ wealth (expressed as net income)—and other independent variables, such as total payments and financial assistance granted by the CAP, as well as payments from the second pillar of CAP to the national rural development programmes.
Średzińska [6] identified determinants of farm enterprises in the EU-15 and Central and Eastern Europe, and evaluated how these determinants had changed over the studied period. Due to the complexity of the research, we decided to use multiple regression to analyse determinants of farm income.
Podruzsik et al. [23] examined the variability of farm income in Hungary and compared it with the wider situation in Europe; their research devoted specific attention to the function of agricultural subsidies under the CAP—i.e., to the single payment per agricultural area, single farm payment, and the complementary national direct payments—and whether they could contribute to stabilising farm income. The dichotomous structure of agriculture in Hungary includes private farms and agricultural enterprises. Various business forms are possible, such as limited liability companies, cooperatives, depository companies, and joint-stock companies. As far as private farms are concerned, many small units are classified as non-commercial. The FADN survey provides economic and financial information for eight types of agricultural enterprises: small arable land; medium and large arable land; bovine animals; sheep, goats, and pigs; poultry; permanent crops; mixed agriculture; and horticulture. The analysis focuses on the net value added and gross farm income, representing two measures of the economic performance of farms.
Špička [24] analysed farm income in the new and old EU member states from 2001 to 2011. Based on the economic performance of the agricultural sectors, he identified three clusters; the Slovak Republic and the Czech Republic were members of the second-biggest cluster. The following variables were under consideration when creating the clusters: enterprise size, number of employees, livestock, and income per worker. Finally, Kočišová and Dobrovič [25,26] examined the technical efficiency of EU agriculture based on FADN data for 2007–2011 and the DEA method.

3. Materials and Methods

This study aimed to identify and quantify statistically significant determinants of leading farm income indicators in the EU. To meet this aim, we used data from the European Commission and the farm survey by the FADN (Farm Accountancy Data Network) from 2009 to 2018.
The selection of indicators was conditioned by the theoretical starting points of the monitored issue. Many authors have examined the income of agricultural enterprises at the national level [18,27] as well as the environmental impact in terms of sustainability [28] or from an aggregate point of view [2,12,14]. Current procedures for assessing sustainability at the farm level take into account quantitative data and ratio indicators. The first step was to use regression analysis to identify and quantify the impact of 11 variables—namely, economic indicators (i.e., tangible assets/assets and liabilities/assets), environmental indicators (i.e., fertilisers/hectares, energy/hectares, grasslands/hectares, and livestock units/hectares), the economic size of the enterprise, total subsidies per hectare, depreciation, taxes, and wages—on the income indicators of the European Union’s member states. Another part of the empirical analysis was a correlation analysis, which was used to quantify the tax burden in relation to the economic size of the company. We determined the size of the companies based on theoretical studies by Gocht and Britz [13]; Vrolijk and Poppe [2]; Severini, Tantari, and Di Tommaso [20]; Średzińska [6]; and van der Veen et al. [29], in which the authors found that as the size of the enterprise increases, farm income also increases. The tax burden on agricultural enterprises in individual EU states differs significantly [29,30]. Using correlation analysis, we wanted to identify the relationship between the tax burden of agricultural enterprises and their size, which would contribute to the long-term sustainability of EU agricultural production and the allocation of investments.
Hypothesis H1. 
The size of the enterprise is a solid macroeconomic indicator in the analysis of income indicators in the EU member states, and it affects the level of the tax burden.
The European Commission defines three leading income indicators, which represent the three dependent variables in our linear regression models:
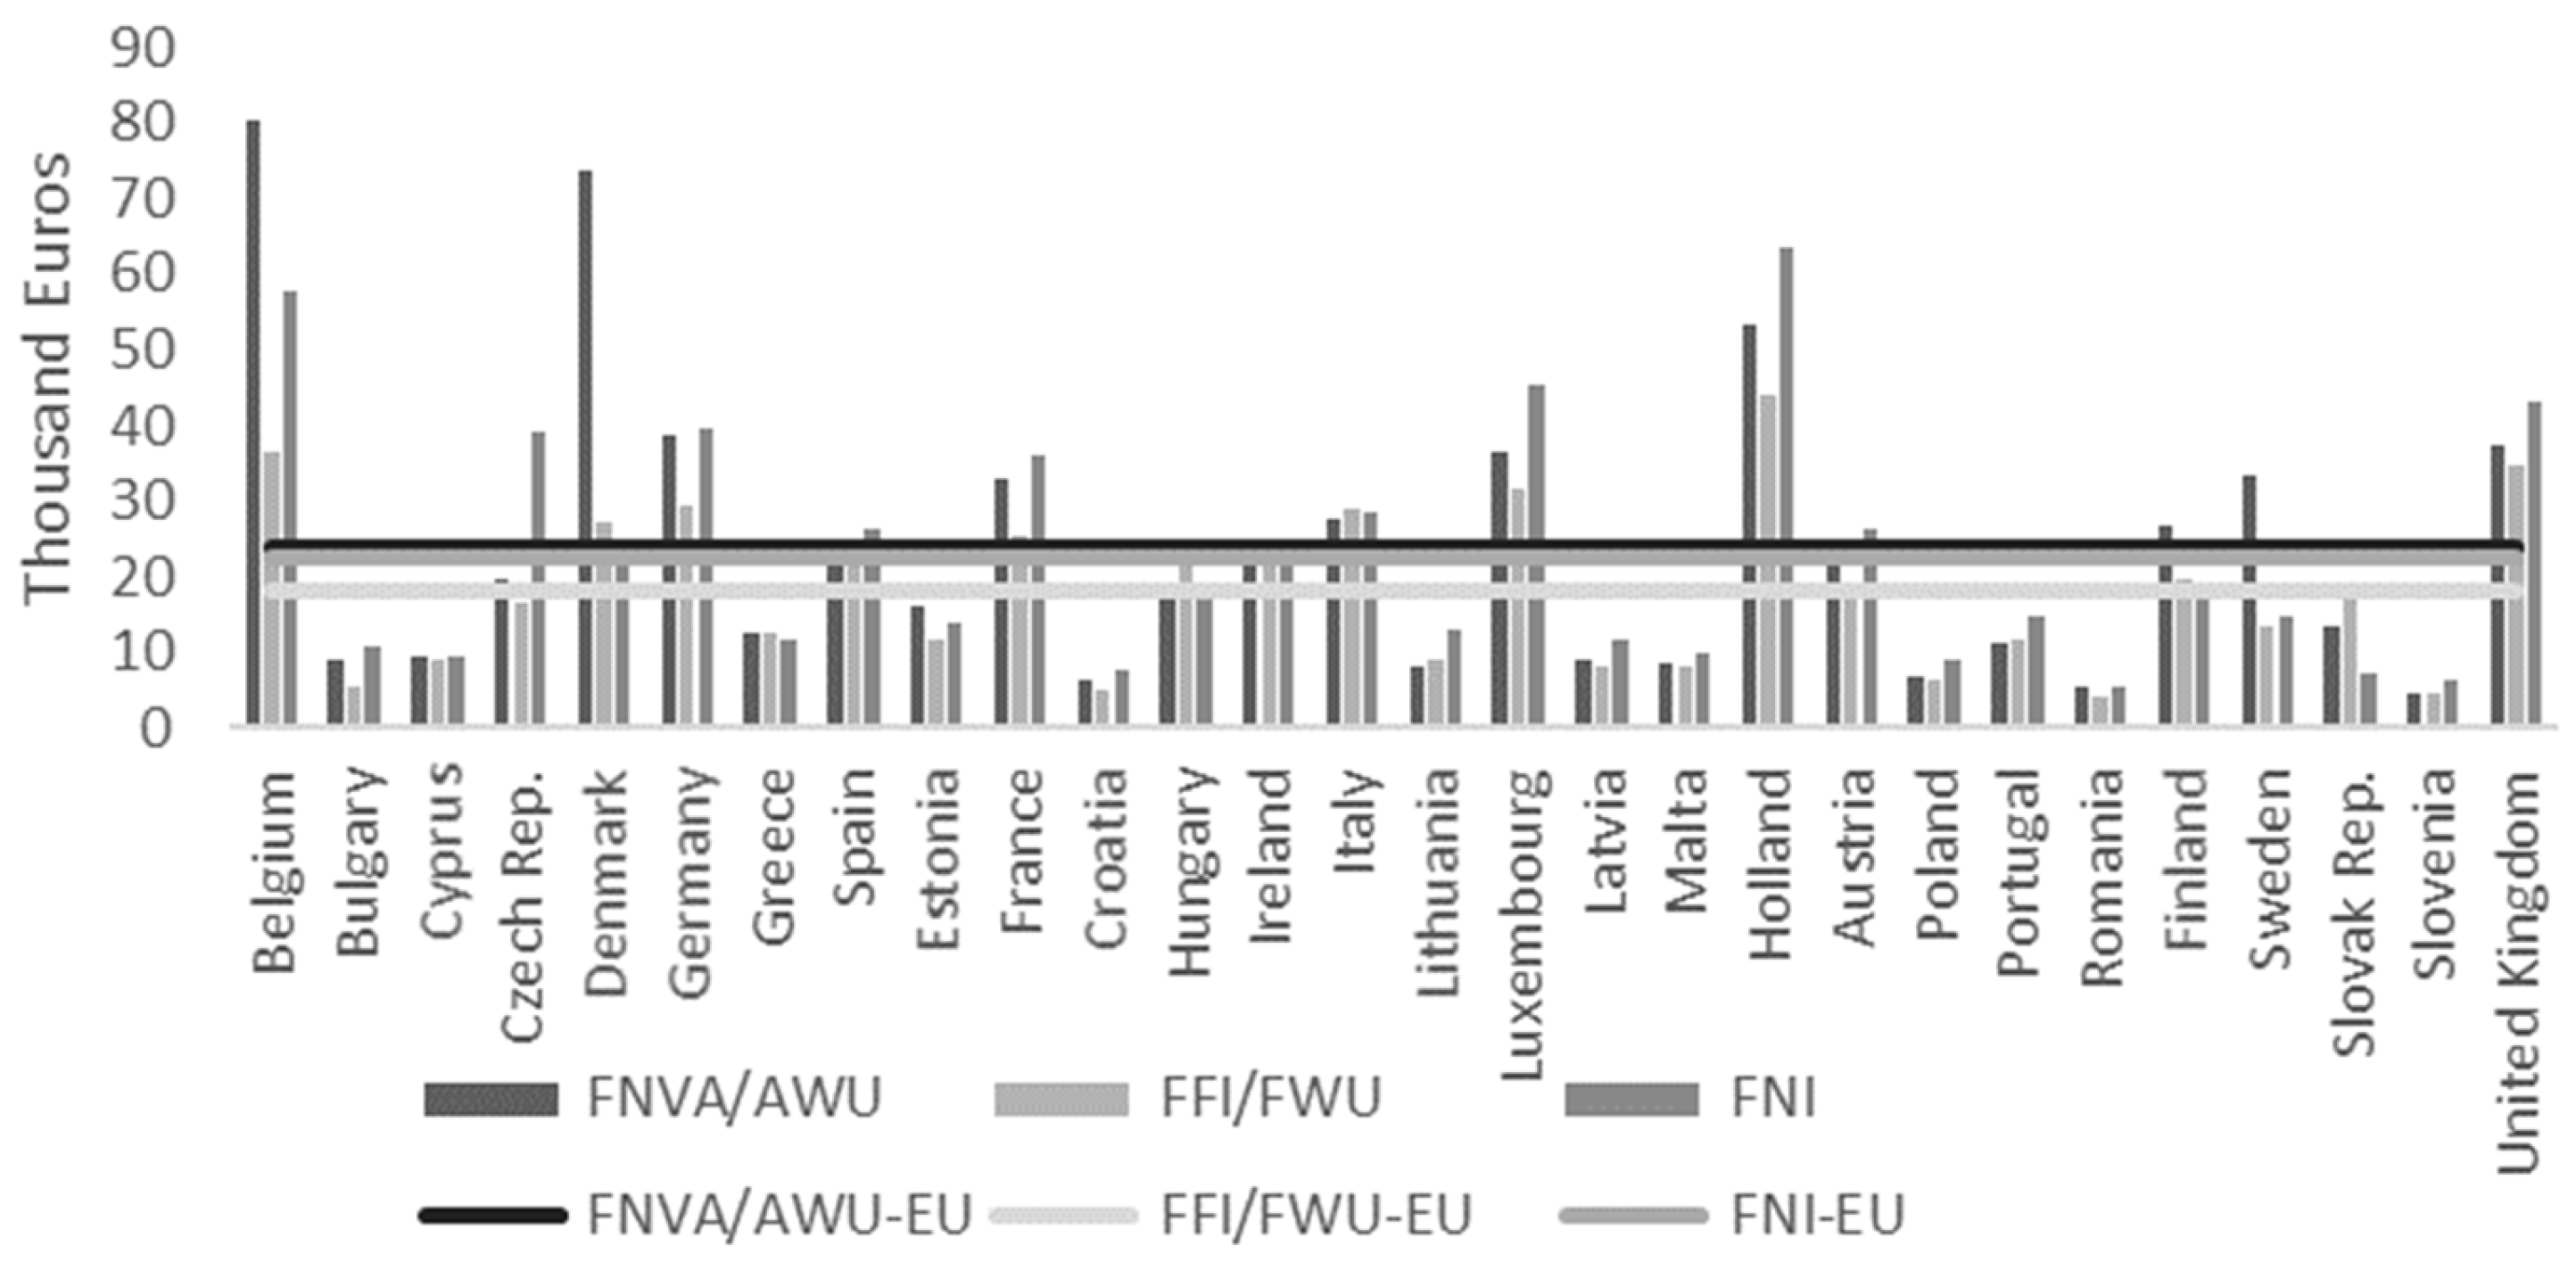
  • FNVA/AWU—Farm net value added expressed per agricultural work unit;
  • FFI/FWU—Family farm income expressed per family work unit;
  • FNI—Farm net income.
As mentioned above, procedures for assessing income sustainability at the level of farm enterprises consider quantitative data and ratios. Therefore, we tested the statistical significance of the following independent variables: economic indicators, environmental indicators, the economic size of the enterprise, total subsidies per hectare, depreciation, taxes, and wages. For detail description see the Table 1, below.
The choice of the FADN farm methodology was intended to provide representative data in three dimensions: region, economic size, and agricultural type. In addition, it provided standardised aggregated data collected across the EU.
We used multiple models of regression analysis based on the statistical software program R, version i386 3.6.3.
The general formula of the multiple regression model is as follows:
Y = β 0 + β 1 X 1 + β 2 X 2 + β k X k + ε t
where Y is the explained variable, X1, X2, …, Xk are explanatory variables, and εt is a random variable of the regression model.
Linear regression models examining the income indicators of EU agriculture were defined as follows:
F N V A / A W U = b 0 + b 1   E C 1 + b 2 E C 2 + b 3 E N V 1 + b 4 E N V 2 + b 5 E N V 3 + b 6 E N V 4 + b 7 S i z e + b 8 T s u b h + b 9 D E P R E C + b 10 T A X E S + b 11 w a g e s _ e m p l + ε t  
F F I / F W U = b 0 + b 1   E C 1 + b 2 E C 2 + b 3 E N V 1 + b 4 E N V 2 + b 5 E N V 3 + b 6 E N V 4 + b 7 S i z e + b 8 T s u b h + b 9 D E P R E C + b 10 T A X E S + b 11 w a g e s _ e m p l + ε t
F N I = b 0 + b 1   E C 1 + b 2 E C 2 + b 3 E N V 1 + b 4 E N V 2 + b 5 E N V 3 + b 6 E N V 4 + b 7 S i z e + b 8 T s u b h + b 9 D E P R E C + b 10 T A X E S + b 11 w a g e s _ e m p l + ε t
We identified the linear correlation between variables X and Y based on Pearson’s correlation coefficient. The estimate of the theoretical value ρ (X, Y) was Pearson’s correlation coefficient r (X, Y), defined as follows:
r = i = 1 n ( x i x ¯ ) ( y i y ¯ ) i = 1 n ( x i x ¯ ) 2 i = 1 n ( y i y ¯ ) 2
The correlation coefficient returns values between −1 and 1. If r = 1, then there is a positive linear correlation between variables X and Y, i.e., the large values of X correspond to the large values of Y, and vice versa. If r = −1, then there is a negative correlation between variables X and Y, i.e., the large values of X correspond to the small values of Y, and vice versa. In the event of linear independence, the correlation coefficient is equal to zero (r = 0), and values of variables X and Y are scattered independently of one another. The correlation coefficient can be zero even if there is a nonlinear statistical dependency between variables X and Y [31].

4. Results

Farm income represents one of the most important economic categories in agriculture, because it reflects the development potential of this sector. In developed economies, agriculture is affected by price and cost pressures. On the one hand, the prices that farmers receive for their production are declining in the long term, as the supply of agricultural products has grown faster than the demand for them. This downward pressure on agricultural incomes shows that a competitive market is playing its part in the economy. From the farmers’ point of view, the most important element of the CAP is ensuring an adequate level of income. On the other hand, farm income increases subsidies, which sometimes represent a substantial part of said income. Subsidies affect income inequality between agricultural enterprises, the variability of farm income levels, and income convergence between the EU member states.
Figure 1 shows the average values of income indicators of the EU member states in the years 2009–2018, along with the average values of the EU-28.
According to the average values of the income indicators (see Figure 1), we identified three groups of member states with above-average, average, and below-average results. The above-average results were recorded mainly for the old member states, i.e., Belgium, Germany, Denmark, Italy, France, Luxemburg, the Netherlands, and the United Kingdom. Compared to the EU-28 average, the best result was recorded for Belgium, where the income indicator FFVA/AWU exceeded 3.4 times the average, FFI/FWU exceeded 2.0 times the average, and the value of FNI exceeded 2.5 times the average. In the case of the income indicator FNVA/AWU, Belgium and Denmark had the best results, with 3.0 times the average. In the case of the income indicators FFI/FWU and FNI, the Netherlands recorded the best values, at 2.4 and 2.8 times the average, respectively. The average values of the income indicators were recorded in the following member states: Finland, Sweden, Austria, Hungary, Ireland, and Spain. Finally, the biggest group consisted of the member states with below-average values of the income indicators; this group included Bulgaria, Cyprus, Greece, Estonia, Croatia, Lithuania, Latvia, Malta, Poland, Portugal, Romania, the Slovak Republic, and Slovenia. It is interesting to note that the Czech Republic was one of the countries with an above-average result for FNI, recording 1.73 times the average, while its net income was at the same level as Germany’s. In contrast, for the income indicators FNVA/AWU and FFI/FWU, the Czech Republic’s values did not reach the averages for the EU-28.

Regression Analysis of Income Indicators

The first step of the regression analysis was to identify statistically significant determinants of the main income indicators of the EU’s agricultural enterprises. Thus, we gradually tested the statistical significance of the following independent variables: economic indicators (EC1, EC2), environmental indicators (ENV1, ENV2, ENV3, ENV4), the economic size of the enterprises (size), total subsidies per hectare (Tsubh), depreciation (DEPREC), taxation (TAXES), and wages per employee (wage_empl). The results are shown in Table 2, Table 3 and Table 4.
The regression analysis results (Table 2, Table 3 and Table 4) confirmed the significant function of the environmental indicators. All environmental indicators that significantly impacted the dependent variables FNVA/AWU, FFI/FWU, and FNI were statistically significant.
A negative impact on the income indicator FNVA/AWU was identified in the case of the environmental indicator ENV2, which represents energy consumption (e.g., fuels, electricity, gas) per hectare of agricultural land. If energy consumption/ha increased by 1 unit, FNVA/AWU would decrease by −97.6577 units with 99% probability. If fertiliser consumption/ha increased by 1 unit, FFI/FWU would increase by 109.958 units with 99% probability, and net income would increase by EUR 120.044 with 95% probability. The environmental indicator ENV3, defined as the area of grassland and pastures per hectare, had a positive impact on the income indicators FFI/FWU and FNI, as did the environmental indicator ENV1. The environmental indicator ENV4—large livestock units per hectare—had a positive impact on the income indicator FNVA/AWU, and if ENV4 increased by 1 unit, then the dependent variable FNVA/AWU would increase by 18,525.0682 units with 99% probability.
Wrzaszcz and Zegar [32], and Bertoni et al. [33] presented proposals for measuring the economic sustainability of agricultural enterprises in Poland; they used the following indicators of economic sustainability: land productivity, labour profitability, activity in the farmers’ market, sources of income, and maintenance of households. Based on their results, we can state that economic and environmental targets are complementary at the level of agricultural enterprise, but they are not infinite. The authors concluded that economically sustainable units are more likely to carry out pro-environmental agricultural activities.
The results of the regression analysis confirmed the statistical significance of the economic indicator EC1, with a negative impact on the income indicators FFI/FWU and FNI. EC1 was defined as the proportion of tangible assets to total assets. The choice of this indicator was mainly influenced by the fact that the activity of agricultural entities relates to land, which represents a significant proportion of tangible fixed assets. Moreover, the economic indicator EC2—defined as the proportion of liabilities to total assets—was also statistically significant. If the EC2 increased by 1 unit, the income indicator would increase by 3924.7217 units with 99% probability. The correlations between assets (current and fixed assets) or the extent to which assets are covered by equity can also play an important role [34].
The economic size was expressed in European size units (ESU) and positively impacted the dependent variables FNVA/AWU and FNI. For example, if the size of the enterprise was larger by 1 unit, then the income indicator FNVA/AWU would increase by 208.9745 units with 99% probability, and the net income would increase by 166.686 units with 99% probability. However, in the case of the income indicator FFI/FWU, the size of the enterprise was not statistically significant.
According to the results of the correlation analysis, between the size and the tax burden of agricultural enterprises in the EU member states (Table 5), a high positive correlation was identified in the following countries: Romania, 0.976 (the size of farm enterprises was at the level of 10.4 ESU, and the average tax burden was EUR 190); Finland, 0.956 (the size of farm enterprises was at the level of 86 ESU, and the average tax burden was EUR 664); Portugal, 0.932 (the size of farm enterprises was at the level of 36 ESU, and the average tax burden was EUR 195); Poland, 0.918 (the size of farm enterprises was at the level of 28 ESU, and the average tax burden was EUR 344); Belgium, 0.837 (the size of farm enterprises was at the level of 277 ESU, and the average tax burden was EUR 2366); Luxemburg, 0.833 (the size of farm enterprises was at the level of 202 ESU, and the average tax burden was EUR 1298); and Latvia, 0.848 (the size of farm enterprises was at the level of 42 ESU, and the average tax burden was EUR 567).
A slight positive correlation was visible in Germany (size of farm enterprises: 234 ESU; tax burden: EUR 2570). Very similar results were found in Italy (size of farm enterprises: 76 ESU; tax burden: EUR 1743) and Sweden (size of farm enterprises: 153 ESU; tax burden: EUR 153), where the value of Pearson’s correlation coefficient ranged from 0.402 to 0.469. A slight negative correlation was identified in the Czech Republic (size of farm enterprises: 256 ESU; tax burden: EUR 1937), Denmark (size of farm enterprises: 351 ESU; tax burden: EUR 4620), and the United Kingdom (size of farm enterprises: 212 ESU; tax burden: EUR 788), where Pearson’s correlation coefficient ranged from −0.471 to −0.353.
The smallest dependency between the size of the agricultural enterprises and the tax burden was recorded in the following countries: Bulgaria (size of farm enterprises: 40 ESU; tax burden: EUR 263); Croatia (size of farm enterprises: 24 ESU; tax burden: EUR 646); Ireland (size of farm enterprises: 50 ESU; tax burden: EUR 185); Lithuania (size of farm enterprises: 29 ESU; tax burden: EUR 137); Malta (size of farm enterprises: 35 ESU; tax burden: EUR 14); the Netherlands (size of farm enterprises: 439 ESU; tax burden: EUR 4077); the Slovak Republic (size of farm enterprises: 419 ESU; tax burden: EUR 6589); and Slovenia (size of farm enterprises: 22 ESU; tax burden: EUR 48), and the values of the correlation coefficients were less than 0.3 in absolute terms.
In the case of the EU-28, the correlation coefficient was 0.88, while the average size of agricultural enterprises was 128 ESU, with a corresponding tax burden of EUR 1234 on average. Thus, the results of the correlation analysis confirmed differences in the tax burden of agricultural enterprises within the EU member states.
As we see from the results, our hypothesis the size of the enterprise is a solid macroeconomic indicator in the analysis of income indicators in the EU member states, and it affects the level of tax burden has been confirmed.

5. Discussion

Wages represent a significant part of the cost of EU agriculture. The average wage per employee was the most statistically significant variable of the income indicator FFI/FWU. If the average wage per employee increased by 1 unit, FFI/FWU would increase by 1.204 with 99% probability. According to Średzińska [6] and Špička [24], wage growth also contributes to income growth.
Within the agricultural sector, the greatest attention is paid to how depreciation affects the levels of investment in agricultural capital. If depreciation increased by EUR 1, the dependent variable FNVA/AWU would decrease by −0.8758 units with 99% probability. If taxes increased by EUR 1, the net income would decrease by EUR −9.152 with 99% probability. The EU’s agricultural sector is characterised by specific treatments that follow interests at the national level. Investment decisions are also made at the level of enterprises. It should be noted that these decisions are not fully autonomous—they may also be conditioned by the current economic situation or the availability of investment support under the agricultural policy. Investments that exceed depreciation rates lead to extended production, as mentioned by Grzelak and Kiełbasa [34], Inkabova et al. [35] or Gradzewicz and Growiec [36], and contribute to an increase in agricultural assets and, thus, an increase in the capital–labour ratio. At the same time, they form a potentially endogenous variable, as they can be a determinant of income on the one hand and an effect of income on the other.
Some authors—such as Gradzewicz et al. [27], Da-Rocha and Restuccia [37] or Wojciechowska-Solis and Barska [38]—describe agriculture as a countercyclical sector, because the basic economic variables that characterise this sector (e.g., production levels and employment) are subject to greater fluctuations in agriculture than in other sectors of the economy, while at the same time being negatively correlated with the values for the economy.
The EU subsidy policy was a statistically significant determinant of the income indicator FFVA/AWU. If total subsidies per hectare of agricultural land increased by 1 unit, then FNVA/AWU would increase by 37.0574 units with 99% probability. The first pillar of the EU subsidy policy aims to support the income derived from agriculture, primarily in the form of direct payments per hectare of agricultural land. The first pillar is financed from the EU budget and from the budgets of the individual member states. It is evident that subsidies affect the income and profitability of farmers, and many agricultural enterprises would record losses without subsidies [39]. Subsidies simplify credit constraints and reduce risk aversion, positively impacting farm productivity [40]. Chrastinová et al. [41] identified reasons for the positive correlation between subsidies and farm productivity. As payments help recipient enterprises with technical development, they provide an innovation incentive and new technologies, improving performance.
Policymakers and interested parties in agriculture will have greater efficiency and effectiveness in decision-making if they include accounting information in their farm income analysis [42]. In addition, the EU policies—particularly the CAP—require reliable statistical data on farmers’ economic situation, which can be used as an instrument in policy design and for performance monitoring [43]. For this reason, the European Commission applies the Common Monitoring and Evaluation Framework to assess the performance of the Common Agricultural Policy and improve its efficiency [44].
The whole comparison of the selected empirical studies with our analysis is summarized in Table 6, below.

6. Conclusions

Despite the mechanisms of the EU’s Common Agricultural Policy, one of the main challenges in farm income research is that farms are remarkably diverse. It is necessary to maintain a stable agricultural sector; therefore, it is important to examine the income indicators and identify the variables that affect this sector. The European Commission defines three main income indicators, which represent the three dependent variables in our linear regression models. The development of income indicators fundamentally impacts the long-term sustainability of agricultural enterprises and, thus, rural areas. The results of our regression analysis identified the impacts of 11 investigated factors on the levels of income indicators. A positive impact on the first income indicator (FNVA/AWU) was identified in the case of the environmental indicator ENV4 (large livestock units per hectare), the economic indicator EC2 (defined as the share of liabilities in total assets), the size of the enterprise, and the number of subsidies per hectare of agricultural land.
Conversely, the environmental indicator ENV2—energy consumption per hectare of agricultural land and depreciation—negatively impacted the amount of net added value.
A statistically significant variable of the second income indicator (FFI/FWU) was the average wage per employee, as wages represent a significant proportion of the costs in agriculture. The economic size of the enterprise had a positive effect on the third income indicator (FNI). At the same time, we must not forget that the differences in the economic size of the companies in individual EU member states are determined by the average size of farms, their production focus and, in particular, the achieved production intensity. Furthermore, despite these differences, whether we observe small, medium, or large farms, their size is generally statistically significant for the net income of agricultural entities. For this reason, we analysed the correlation between the economic size of the company and the tax burden. This dependence divided the countries into three extremely diverse groups. In contrast, the composition of the groups surprised us, as the countries in the individual groups were not similar to one another geographically, economically, fiscally, or in terms of size or subsidies. In general, however, it is impossible to determine a clear, universally optimal size of an agricultural enterprise, due to differences in natural conditions, technologies, production quality, state tax policies, production risks, regulations in the field of ecology, and many other factors.
Interestingly, the results of the regression analysis confirmed the statistical significance of the environmental indicator ENV1 (consumption of fertilisers per hectare) and ENV3 (the area of grasslands and pastures on the total cultivated area) with both having positive effects on the income indicators FFI/FWU and FNI. This is because the consumption of industrial and organic fertilisers is one of the basic intensification factors in plant production. Therefore, higher doses of nutrients per hectare of agricultural land are positively correlated with the level of plant production, which increases the income of agricultural producers. On the other hand, the indicator ENV3—the area of grasslands and pastures in the total farmed area—was statistically positively correlated with the income indicators. However, in practice, we encountered the exact opposite phenomenon, as the expansion of areas of non-productive grasslands negatively affects the total plant production and, thus, income levels. At the same time, we must not forget that the subsidies aimed at supporting permanent grasslands bring additional income to agricultural enterprises, which are conditioned by large livestock units per hectare of grasslands.
Therefore, the analysis of income indicators confirmed their importance, identifying competitive advantages and influencing investors’ decisions on investment allocation. At the same time these analysed indicators contribute to the assessment of sustainability and are important determinants for a more transparent and permanent assessment of agricultural subjects. However, it should be noted here that the process by which sustainability assessment indicators are established can be much more complex and, therefore, should be given more attention in the future to ensure the agricultural sector’s stability.

Author Contributions

Conceptualisation, methodology, software, validation, formal analysis, investigation, resources, data curation, writing—original draft preparation, writing—review and editing, visualisation, supervision, project administration, funding acquisition: A.A. and J.G. All authors have read and agreed to the published version of the manuscript.

Funding

This research was funded by the Slovak Grant Agency of the Ministry of Education of the Slovak Republic and Slovak Academy of Sciences (VEGA), project No. 1/0673/21.

Institutional Review Board Statement

Not applicable.

Informed Consent Statement

Not applicable.

Data Availability Statement

The European Commission publicly available database The Farm Accountancy Data Network (FADN) has been used for the study.

Acknowledgments

We gratefully acknowledge the funding of this paper by the Slovak Grant Agency of the Ministry of Education of the Slovak Republic, and by the Slovak Academy of Sciences (VEGA), project No. 1/0673/21 on Analysis of Economic Perspectives of Industry 4.0 in Terms of the Impact of Intangibles on the Profitability and Market Value of Industrial Companies.

Conflicts of Interest

The authors declare no conflict of interest. The funders had no role in the study’s design; in the collection, analyses, or interpretation of data; in the writing of the manuscript; or in the decision to publish the results.

References

  1. Bayramoglu, Z.; Oguz, C.; Karakayaci, Z.; Arısoy, H. Identification of the income level needed for agricultural enterprises to achieve economic sustainability. Econ. Res.-Ekon. Istraž. 2018, 31, 510–520. [Google Scholar] [CrossRef]
  2. Vrolijk, H.; Poppe, K. Impact of off-farm income and paid taxes on the composition and volatility of incomes and wealth of dairy farmers in the Netherlands. Stud. Agric. Econ. 2020, 122, 57–65. [Google Scholar]
  3. Shiri, N.; Motamedinia, Z.; Hashemi, S.M.K.; Asadi, A. Agricultural researchers’ attitudes toward sustainable agriculture and its determinants in Ilam Province, Iran. Int. J. Agric. Sci. Res. 2012, 2, 121–137. [Google Scholar]
  4. Thanh, N.V.; Sukprasert, P.; Yapwattanaphun, C. Farmers’ sustainable agriculture perception in the Vietnam uplands: The case of banana farmers in Quang Tri province. Res. J. Appl. Sci. Eng. Technol. 2015, 10, 960–967. [Google Scholar] [CrossRef]
  5. Röös, E.; Fischer, K.; Tidåker, P.; Nordström Källström, H. How well is farmers’ social situation captured by sustainability assessment tools? A Swedish case study. Int. J. Sustain. Dev. World Ecol. 2019, 26, 268–281. [Google Scholar] [CrossRef] [Green Version]
  6. Średzińska, J. Determinants of the Income of Farms in EU Countries. Stud. Oeconomica Posnaniensia 2018, 6, 54–65. [Google Scholar] [CrossRef]
  7. Pe’er, G.; Bonn, A.; Bruelheide, H.; Dieker, P.; Eisenhauer, N.; Feindt, P.H.; Hagedorn, G.; Hansjürgens, B.; Herzon, I.; Lomba, Â.; et al. Action needed for the EU Common Agricultural Policy to address sustainability challenges. People Nat. 2020, 2, 305–316. [Google Scholar] [CrossRef] [Green Version]
  8. EC—European Commission. CAP towards 2020 Impact Assessment: Greening–Results of Partial Analysis on Farm Income Using FADN; EC: Brussels, Belgium, 2011. [Google Scholar]
  9. Gallo, P.; Balogova, B.; Mihalcova, B. The Influence of Intercultural Management Factors as Elements of Management Innovation. Mark. Manag. Innov. 2021, 2, 65–73. [Google Scholar] [CrossRef]
  10. Gallo, P.; Balogová, B.; Čabinová, B.; Dobrovič, J. The perception of gender stereotypes in managerial positions of industrial companies. Pol. J. Manag. Stud. 2021, 23, 149–164. [Google Scholar] [CrossRef]
  11. Will, M. Promoting Value Chains of Neglected and Underutilised Species for Pro-Poor Growth and Biodiversity Conservation: Guidelines and Good Practices; Bioversity International: Rome, Italy, 2008; Available online: https://www.bioversityinternational.org/fileadmin/_migrated/uploads/tx_news/Promoting_value_chains_of_neglected_and_underutilized_species_for_pro-poor_growth_and_biodiversity_conservation_1294.pdf (accessed on 22 May 2021).
  12. Kryszak, Ł. Profit Efficiency in EU FADN Farms under Different Types of Agriculture. Probl. World Agric. Probl. Rol. Światowego 2018, 18, 196–207. [Google Scholar] [CrossRef]
  13. Gocht, A.; Britz, W.; Ciaian, P.; Paloma, S.G.Y. Farm type effects of an EU-wide direct payment harmonisation. J. Agric. Econ. 2013, 64, 1–32. [Google Scholar] [CrossRef]
  14. Mishra, A.K.; Sandretto, C.L. Stability of farm income and the role of nonfarm income in US agriculture. Appl. Econ. Perspect. Policy 2002, 24, 208–221. [Google Scholar]
  15. Kráľ, P.; Kanderová, M.; Kaščáková, A.; Nedelová, G.; Valenčáková, V. Viacrozmerné Štatistické Metódy so Zameraním na Riešenie Problémov Ekonomickej Praxe; UMB: Banská Bystrica, Slovakia, 2009; pp. 1–175. [Google Scholar]
  16. Matthews, A. How Might the EU’s Common Agricultural Policy Affect Trade and Development after 2013: An Analysis of the European Commission’s November 2010 Communication; Issue paper No. 29; ICTSD: Geneva, Switzerland, 2010; pp. 1–22. [Google Scholar]
  17. Tangermann, S. Risk Management in Agriculture and the Future of the EU’s Common Agricultural Policy; Issue paper No. 34; ICTSD: Geneva, Switzerland, 2011; pp. 1–50. [Google Scholar]
  18. El Benni, N.; Finger, R.; Mann, S. Effects of agricultural policy reforms and farm characteristics on income risk in Swiss agriculture. Agric. Financ. Rev. 2012, 72, 301–324. [Google Scholar] [CrossRef]
  19. Vargová Dzurov, T.; Gallo, P.; Matušíková, D.; Švédová, M.; Gburová, J. Quality Management System as a Non-Financial Indicator in Tourism Enterprises. Qual.-Access Success 2020, 21, 69–73. [Google Scholar]
  20. Severini, S.; Tantari, A.; Di Tommaso, G. The instability of farm income. Empirical evidences on aggregation bias and heterogeneity among farm groups. Bio-Based Appl. Econ. 2016, 5, 63–81. [Google Scholar]
  21. Kołoszko-Chomentowska, Z. Selected effects of financing of agricultural holdings in new member states of the European Union. Finans. Kwart. Internetowy e-Finans. 2014, 10, 65–72. [Google Scholar]
  22. Galluzzo, N. Preliminary findings in Italian farms part of FADN dataset by the PLS-SEM. Bulg. J. Agric. Sci. 2018, 24, 927–932. [Google Scholar]
  23. Podruzsik, S.; Hubbard, C.; Keszthelyi, S.; Hubbard, L.J. Farm income variability in Hungary: A comparison with the EU based on FADN records. In Proceedings of the 108th Seminar, Warszaw, Poland, 8–9 February 2008; European Association of Agricultural Economists: Madrid, Spain, 2008. [Google Scholar]
  24. Špička, J. The economic disparity in european agriculture in the context of the recent EU enlargement. J. Econ. Sustain. Dev. 2013, 4, 125–133. [Google Scholar]
  25. Dobrovič, J.; Čabinová, V.; Gallo, P.; Partlová, P.; Váchal, J.; Balogová, B.; Orgonáš, J. Application of the DEA Model in Tourism SMEs: An Empirical Study from Slovakia in the Context of Business Sustainability. Sustainability 2021, 13, 7422. [Google Scholar] [CrossRef]
  26. Kočišová, K. Application of the DEA on the measurement of efficiency in the EU countries. Agric. Econ. 2015, 61, 51–62. [Google Scholar] [CrossRef] [Green Version]
  27. Hill, S.B.; MacRae, R.J. Conceptual framework for the transition from conventional to sustainable agriculture. J. Sustain. Agric. 1996, 7, 81–87. [Google Scholar] [CrossRef]
  28. Juríčková, Z.; Lušňáková, Z.; Hallová, M.; Horská, E.; Hudáková, M. Environmental impacts and attitudes of agricultural enterprises for environmental protection and sustainable development. Agriculture 2020, 10, 440. [Google Scholar] [CrossRef]
  29. Van der Veen, H.B.; Van der Meulen, H.A.B.; Van Bommel, K.H.M.; Doorneweert, R.B. Exploring Agricultural Taxation in Europe; LEI: The Hague, The Netherlands, 2007; pp. 1–207. [Google Scholar]
  30. EC—European Commission. Tax Policies in the European Union 2017 Survey; EC: Brussels, Belgium, 2017; ISBN 978-92-79-72282-0. [Google Scholar]
  31. Wrzaszcz, W.; Zegar, J.S. Economic sustainability of Farms in Poland. Eur. J. Sustain. Dev. 2014, 3, 165. [Google Scholar]
  32. Kulawik, J.; Płonka, R. Subsidies, financial and economic efficiency and the type of farming of the agricultural holdings of natural persons. Zagadnienia Ekon. Rolnej 2014, 340, 3–19. [Google Scholar]
  33. Bertoni, D.; Cavicchioli, D.; Donzelli, F.; Ferrazzi, G.; Frisio, D.G.; Pretolani, R.; Ricci, E.C.; Ventura, V. Recent contributions of agricultural economics research in the field of sustainable development. Agriculture 2018, 8, 200. [Google Scholar] [CrossRef] [Green Version]
  34. Grzelak, A.; Kiełbasa, B. Assessment of the use of the European union funds to support investments on polish farms in the regional perspective. Acta Sci. Pol. Oeconomia 2014, 13, 49–60. [Google Scholar]
  35. Inkabova, M.; Andrejovska, A.; Glova, J. The Impact of Environmental Taxes on Agriculture—The Case of Slovakia. Pol. J. Environ. Stud. 2021, 4, 3085–3097. [Google Scholar] [CrossRef]
  36. Gradzewicz, M.; Growiec, J.; Kolasa, M.; Postek, Ł.; Strzelecki, P. Poland’s Exceptional Performance during the World Economic Crisis: New Growth Accounting Evidence. September 2014. Available online: https://ssrn.com/abstract=2646562 (accessed on 10 June 2021).
  37. Da-Rocha, J.M.; Restuccia, D. The role of agriculture in aggregate business cycles. Rev. Econ. Dyn. 2006, 9, 455–482. [Google Scholar] [CrossRef]
  38. Wojciechowska-Solis, J.; Barska, A. Exploring the preferences of consumers’ organic products in aspects of sustainable consumption: The case of the Polish consumer. Agriculture 2021, 11, 138. [Google Scholar] [CrossRef]
  39. Rizov, M.; Oskam, A.; Walsh, P. Is there a limit to agglomeration? Evidence from productivity of Dutch firms. Reg. Sci. Urban Econ. 2012, 42, 595–606. [Google Scholar] [CrossRef] [Green Version]
  40. Markechová, D.; Tirpáková, A.; Stehlíková, B. Základy Štatistiky Pre Pedagógov; FPV UK: Nitra, Slovakia, 2011; pp. 1–405. [Google Scholar]
  41. Chrastinová, Z.; Burianová, V. Economic development in Slovak agriculture. Agric. Econ. 2009, 55, 67–76. [Google Scholar] [CrossRef]
  42. Chrastinová, Z.; Krížová, S.; Zbranek, P. Comparison of production performance of agriculture in EU countries. Ekon. Poľnohospodárstva 2017, 1, 53–76. [Google Scholar]
  43. Argilés, J.M. Accounting information and the prediction of farm non-viability. Eur. Account. Rev. 2001, 10, 73–105. [Google Scholar] [CrossRef]
  44. EC—European Commission. Common Monitoring and Evaluation Framework. Common Agricultural Policy 2014–2020. 2017. Available online: https://agriculture.ec.europa.eu/common-agricultural-policy/cap-overview/cmef_en (accessed on 22 September 2021).
  45. Gocht, A.; Britz, W. EU-wide farm type supply models in CAPRI—How to consistently disaggregate sector models into farm type models. J. Policy Model. 2011, 33, 146–167. [Google Scholar] [CrossRef]
  46. Trnkova, G.; Mala, Z.; Vasilenko, A. Analysis of the effects of subsidies on the economic behavior of agricultural businesses focusing on animal production. Agris-Line Pap. Econ. Inform. 2012, 4, 115–126. [Google Scholar]
  47. Parsche, R.; Radulescu, D.M. Taxing means of agricultural production in Germany: A relatively high tax burden compared to other important EU competitors. CESifo DICE Rep. 2004, 2, 48–54. [Google Scholar]
  48. Dziemianowicz, R.; Budlewska, R. Preferencje podatkowe jako instrument polityki rolnej–na przykładzie wybranych państw Unii Europejskiej Tax expenditures as an instrument of the agriculture policy—An example of selected European Union Member States. In Problemy Rolnictwa Światowego; SGGW: Warszawa, Poland, 2014; pp. 43–58. [Google Scholar]
  49. Wasilewski, M.; Ganc, M. Funkcjonowanie systemu podatkowego w rolnictwie oraz propozycje zmian w opinii rolników indywidualnych. Zesz. Nauk. Uniw. Szczec. Finans. Rynk. Finans. Ubezpieczenia 2012, 50, 725–734. [Google Scholar]
Figure 1. Income indicators of the EU member states (average of 2009–2018). Source: own calculations.
Agriculture 12 01884 g001
Table 1. Dependent and independent variables in models of the EU’s income indicators.
VariableDescription
FNVA/AWU (model 1) *Farm net value added expressed per agricultural work unit
FFI/FWU (model 2) *Family farm income expressed per family work unit
FNI (model 3) *Farm net income
EC1Tangible assets/total assets
EC2Liabilities/total assets
ENV1Fertilisers/total agricultural area in hectares
ENV2Energy (fuels, gas, electricity)/total agricultural area in hectares
ENV3Permanent grassland and pastures/total agricultural area in hectares
ENV4Total livestock units/total agricultural area in hectares
SizeEconomic size of enterprise, expressed in European size units
TsubhTotal subsidies/total agricultural area in hectares
DEPRECDepreciation of long-term fixed assets and intangible assets
TAXESIncome tax, property tax, and other commission
wages_empl(Wages + levies)/total workforce
* Dependent variables.
Table 2. Results of regression analysis for the income indicator FNVA/AWU.
EstimateStd. Errort-ValuePr (>|t|)
(Intercept)−4998.20854202.6503−1.1890.247596
ENV2−97.657714.5159−6.7281.18 × 10−6***
Tsubh37.057410.60523.4940.002161**
Size208.974534.61736.0375.44 × 10−6***
DEPREC−0.87580.1873−4.6770.000129***
ENV418,525.06823510.34545.2773.12 × 10−5***
EC23924.72171288.30273.0460.006134**
Standard codes of significance: 0 ‘***’ 0.001 ‘**’ 0.01 ‘*’ 0.05 ‘.’ 0.1 ‘ ’ 1; the stars flag level of significance. If a p-value is less than 0.05 (*); if a p-value is less than 0.01 (**); and if a p-value is less than 0.001 (***).
Results of the statistically significant income indicator FNVA/AWU:
Autocorrelation: Durbin–Watson test, p-value > α;
Heteroscedasticity: studentised Breusch–Pagan test, p-value > α;
Multicollinearity: VIF value < 10 for all variables.
The statistical significance of the income model was confirmed by the F-statistic, p-value < α (3.537 × 10⁻⁹ < 0.05), and by the REST test, p-value > α (0.831 > 0.05). The Jarque–Bera normality test confirmed that the residuals were normally distributed, p-value = 0.921. Based on the determination coefficient R 2 , the income model explained 89.36% of the total variability. In this case, 89.36% correctly explained the dependent variable, i.e., the income indicator FNVA/AWU; the remaining 10.64% explained a random variable.
Source: Own calculations using R software.
Table 3. Results of regression analysis for the income indicator FFI/FWU.
EstimateStd. Errort-ValuePr (>|t|)
(Intercept)14,876.55810,157.2971.4650.156561
ENV1109.95834.4713.1900.004076**
wages_empl1.2040.2544.7418.87 × 10−5***
ENV332,086.5907435.5064.3150.000257***
EC1−31,434.24014,798.893−2.1240.044631*
Standard codes of significance: 0 ‘***’ 0.001 ‘**’ 0.01 ‘*’ 0.05 ‘.’ 0.1 ‘ ’ 1; the stars flag level of significance. If a p-value is less than 0.05 (*); if a p-value is less than 0.01 (**); and if a p-value is less than 0.001 (***).
Results of the statistically significant income indicator FFI/FWU:
Autocorrelation: Durbin–Watson test, p-value > α;
Heteroscedasticity: studentised Breusch–Pagan test, p-value > α;
Multicollinearity: VIF value < 2 for all variables.
The statistical significance of the income model was confirmed by the F-statistic, p-value < α (2.64 × 10⁻⁵ < 0.05), and by the REST test, p-value > α (0.7132 > 0.05). The Jarque–Bera normality test confirmed that the residuals were distributed normally, p-value = 0.493. Based on the determination coefficient R2, the income model explains 66.87% of the total variability. In this case, 66.87% correctly explained the dependent variable, i.e., the income indicator FFI/FWU; the remaining 33.13% explained a random variable.
Source: own calculations using R software.
Table 4. Results of regression analysis for the income indicator FNI.
EstimateStd. Errort-ValuePr (>|t|)
(Intercept)23,359.17015,061.4421.5510.13519
ENV1120.04449.7572.4130.02462*
Size166.68635.7654.6610.00012***
TAXES−9.1522.837−3.2260.00389**
ENV330,014.67310,834.2922.7700.01116*
EC1−41,580.21322,014.773−1.8890.07218.
Standard codes of significance: 0 ‘***’ 0.001 ‘**’ 0.01 ‘*’ 0.05 ‘.’ 0.1 ‘ ’ 1; the stars flag level of significance. If a p-value is less than 0.05 (*); if a p-value is less than 0.01 (**); and if a p-value is less than 0.001 (***).
Results of the statistically significant income indicator FNI.
Autocorrelation: Durbin–Watson test, p-value > α.
Heteroscedasticity: studentised Breusch–Pagan test, p-value > α.
Multicollinearity: VIF value < 7 for all variables.
The statistical significance of the income model was confirmed by the F-statistic, p-value < α (1.67 × 10⁻⁵ < 0.05), and by the REST test, p-value > α (0.381 > 0.05). The Jarque–Bera normality test confirmed that the residuals were normal distributed, p-value = 0.728. Based on the determination coefficient R2, the income model explained 72.07% of the total variability. In this case, 72.07% correctly explained the dependent variable, i.e., the income indicator FNI; the remaining 27.93% explained a random variable.
Source: own calculations using R software.
Table 5. Correlation analysis between the size of the enterprise and the tax burden of the EU member states.
CountryCorrelation coefficientCountryCorrelation coefficientCountryCorrelation coefficient
Belgium0.837Croatia0.239Poland0.918
Bulgaria0.160Hungary0.778Portugal0.932
Cyprus0.788Ireland−0.181Romania0.976
Czech Republic−0.353Italy0.402Finland0.953
Denmark−0.410Lithuania−0.205Sweden0.445
Germany0.469Luxemburg0.883Slovak Republic−0.231
Greece0.789Latvia0.848Slovenia−0.271
Spain0.880Malta−0.240United Kingdom−0.471
Estonia0.936The Netherlands0.276
France0.634Austria0.530
Source: own calculations.
Table 6. The comparison of the selected empirical studies with our analysis.
VariablesRecent Empirical StudiesResults of Analysis
AuthorYearRelationship between Income and VariableExpected CorrelationIdentified CorrelationInterpretation
Economic indicatorsVrolijk and Poppe [2]2020Positive+
+
The higher proportion of tangible assets decreases income.
Indebtedness contributes to income growth.
Kołoszko-Chomentowska [21]2014None
Mishra and Sandretto [14]2002Negative
Environmental indicatorsWrzaszcz and Zegar [31]2014Positive++
Environmental indicators (e.g., fertilisers/ha, grasslands/ha, livestock units/ha) contribute to income growth. On the other hand, the growth of energy consumption per hectare decreases the level of income.
Gocht and Britz [45]2011Positive
Severini, Tantari and Di Tommaso [20]2016Positive
Galluzo [22]2018Positive
Średzińska [6]2018Positive
Podruzsik et al. [23]2008Positive
SubsidiesKulawik and Płonka [32]2014Negative++Subsidies contribute to farm income growth.
Gocht et al. [13]2013Positive
Vrolijk and Poppe [2]2020Positive
Severini, Tantari and Di Tommaso [20]2016Positive
Kołoszko-Chomentowska [21]2014Positive
Galluzo [22]2018Positive
Podruzsik et al. [23]2008Positive
Trnková et al. [46]2012Negative
SizeGocht and Britz [45]2011Positive++As the size of the enterprise increases, the farm’s income increases.
Vrolijk and Poppe [2]2020Positive
Severini, Tantari and Di Tommaso [20]2016Positive
Średzińska [6]2018Positive
Van Der Veen et al. [29]2007Positive
Tax burdenVrolijk and Poppe [2]2020None-As the tax burden increases, the level of income decreases.
Van Der Veen et al. [29]2007Negative
Parsche and Radulescu [47]2004Negative
Kulawik and Płonka [32]2014None
Dziemianovicz and Budlewska [48]2014Negative
Wasilewski and Ganc [49]2012Negative
WagesVrolijk and Poppe [2]2020Positive++Wage growth contributes to income growth.
Średzińska [6]2018Positive
Špička [24]2013Positive
Publisher’s Note: MDPI stays neutral with regard to jurisdictional claims in published maps and institutional affiliations.

