Article

Differentiation of Yeast-Inoculated and Uninoculated Tomatoes Using Fluorescence Spectroscopy Combined with Machine Learning

1
Fruit and Vegetable Storage and Processing Department, The National Institute of Horticultural Research, Konstytucji 3 Maja 1/3, 96-100 Skierniewice, Poland
2
Department of Plant Breeding, Maritsa Vegetable Crops Research Institute, Agricultural Academy Bulgaria, 32, Brezovsko shosse St., 4003 Plovdiv, Bulgaria
3
Department of Electrical and Electronics Engineering, Karamanoglu Mehmetbey University, 70100 Karaman, Turkey
4
Department of Plant Genetic Resources, Institute of Plant Genetic Resources “Konstantin Malkov”—Sadovo, Agricultural Academy Bulgaria, 2, Drouzhba Str., 4122 Sadovo, Bulgaria
5
Department of Microbiology and Environmental Biotechnology, Agricultural University, 12 Mendeleev St, 4002 Plovdiv, Bulgaria
*
Author to whom correspondence should be addressed.
Agriculture 2022, 12(11), 1887; https://doi.org/10.3390/agriculture12111887
Submission received: 12 October 2022 / Revised: 5 November 2022 / Accepted: 9 November 2022 / Published: 9 November 2022
(This article belongs to the Section Agricultural Technology)

Abstract

:
Artificial-intelligence-based analysis methods can provide objective and accurate results. This study aimed to evaluate the performance of machine learning algorithms to classify yeast-inoculated and uninoculated tomato samples using fluorescent spectroscopic data. For this purpose, three different tomato types were used: ‘local dwarf’, ‘Picador’, and ‘Ideal’. Discrimination analysis was applied with six different machine learning (ML) algorithms. Confusion matrices, average accuracies, F-Measure, Precision, ROC (receiver operating characteristic) Area, MCC (Matthews Correlation Coefficient), and precision-recall area values obtained as a result of the application of different ML algorithms were compared. Based on the fluorescence spectroscopic data, the application of six ML algorithms showed that the first two tomato types were classified with 100% accuracy and the last type was classified with 95% accuracy. The results of the study show that the fluorescence spectroscopy data are strongly representative of tomato species. ML methods fed with these data provide high-performance discrimination.

1. Introduction

Tomato (Solanum Lycopersicum L.) fruit, which belongs to the nightshade family, has health benefits and it can be used in the food industry. The tomato can be consumed as a fruit drink, fruit salad, condiment for sauces, soup, and different dishes. Tomatoes are rich in beta-carotene (lycopene), which is beneficial due to its free radical scavenging effect, and it is useful for cell growth and activity. Beta-carotene and gamma-carotene affect the activity of provitamin-A in tomatoes [1]. Because of their high consumption, fresh fruit and tomato-based products make up an important part of the total dietary intake of lycopene [2]. It may decrease of risk of cardiovascular diseases, chronic kidney disease, stomach, lung, or prostate cancer [3]. Additionally, tomato is a source of vitamin C, vitamin B, and minerals (calcium, potassium, phosphorous, magnesium, manganese, zinc, and sodium) [4]. Tomato crops are intensively cultivated. The life cycle and yield losses of a tomato can be affected by environmental conditions, e.g., drought and salinity stresses [5]. Tomato crops can also be infested with insect pests [6]. Tomato is a climacteric fruit. Postharvest ripening of the fruit initiated by ethylene biosynthesis takes place [7]. In the case of perishables, postharvest losses can occur. For this reason, tomato is a highly sensitive food commodity against external loads during the ripening stage. The storage life directly depends on the handling of fresh tomatoes [1,8]. Furthermore, the tomato may be susceptible to postharvest diseases, including fungal infection [9]. The rapid postharvest ripening and softening usually cause susceptibility of the fruit to infection by pathogens, among others, Alternaria alternate [10]. Fruit suffering from postharvest diseases may require the induction of disease resistance, e.g., by yeast mannan treatment [11,12] or the application of the antagonist yeast as a strategy to control diseases caused by fungal pathogens, e.g., Botrytis cinerea [13]. The other strategy to control fruit decay may be the induction of disease resistance by bio-based compounds, e.g., the application of mitogen-activated protein kinase regulating the resistance to B. cinerea [14].
The yeast endophytes can be distributed locally or systemically in a variety of plants where they are protected from abiotic and biotic stress [15]. Endophytic yeast is ecologically adaptable to host plants and is also robust to plant defense responses [16,17]. They synthesize physiologically active substances such as vitamins and auxins, and then supply them to the plant, increase the efficiency of photosynthesis, and improve enzymatic processes in plants. They also improve the water regime, induce the activity of other soil microorganisms, and act as antagonists of phytopathogenic microorganisms, increasing the protective functions of plants [18].
Finding alternative and safe approaches for managing agricultural production systems and controlling plant diseases and mycotoxin contamination that do not rely on the use of synthetic fertilizers and chemical pesticides has thus become an important target for consumers, legislators, and agriculture as a whole. As an integral part of the agroecosystem, yeasts are an attractive option for plant production and protection applications because they are versatile in their action, can be grown in cheap media, and often exhibit minor or no biosafety concerns [19]. Although yeasts exhibit numerous, highly beneficial properties for agricultural production, only a few yeast-based products for agricultural applications have reached the market and have been successfully implemented on a wide scale. Relatively few yeast-based products for plant protection have reached advanced developmental stages and been suggested as commercial products for postharvest applications (e.g., Candida oleophila as Aspire and Nexy, C. sake as Candifruit, Metschnikowia fructicola as Shemer/NOLI, Aureobasidium pullulans as BoniProtect and BlossomProtect, or Cryptococcus albidus as YieldPlus) [20,21,22,23]. The current article covers AI aspects related to the successful application of beneficial yeasts in agricultural plant production systems with tomatoes.
In this paper, three yeast strains, YE1, YP6, and YBS14, were isolated from different plant tissues. YE1 and YP6 were isolated from the seeds of Triticum aestivum L., while YBS14 was isolated from the roots of Helichrysum italicum L., which was used because of its importance as a medicinal plant and limited habitat. Partial sequence analysis of the ITS5-5.8-ITS4 region of nuclear ribosomal DNA with universal primers identified YE1 as Zygosaccharomyces bailii [24], YP6 as Pichia fermentans, and YBS14 as Saccharomyces cerevisiae. The nucleotide sequences attained in this study were deposited in the GenBank with accession numbers OL904963, MZ798453, and MZ798454, respectively. Z. bailii YE1 was able to colonize endophyticaly tobacco plants with a high frequency of colonization. YE1 was reported to exhibit PGPR activities including indole-3 acetic acid production from tryptophan, and simulated the development and growth of the tobacco plants. Their antimicrobial activities against various plant pathogenic fungi (Rhizoctonia solani, Alternaria solani, and Fusarium solani) were detected. The inhibition of the growth of all of the tested pathogens by Z. bailii YE1 may be due to the production of siderophores on the Chrome Azurol S (CAS) agar based on their affinity for ferric iron.
Fluorescence spectroscopy is widely used in the food industry for quantitative analysis. It is sensitive and specific enough to detect even small concentrations of compounds [25,26]. It can, for example, detect changes in the structures of proteins, carbohydrates, and lipids in oils. This is useful for verifying the authenticity of food products [27]. Advances in fiber optic technology offer exceptional opportunities to develop a wide range of highly sensitive fiber optic sensors in many new areas of applications. The fiber-optic components are successfully adapted to compilations with elements of micro-optics such as lenses, mirrors, prisms, and gratings [28,29]. Fluorescence spectroscopy in the agricultural sciences is applied to the analysis of tomatoes [30] and cereals [31]. Their qualification by means of this technique is performed by grouping objects with similar characteristics for establishing methods related to their classification.
The agricultural industry has to handle various issues, such as the depletion of natural resources, the rapid increase in the need for food, climate changes, securing production continuity, and health anxieties. The appropriate solution for these critical challenges is to make use of computer-aided systems. The increase in studies involving remote sensing applications and unmanned aerial vehicles has provided new studies in different fields [32,33]. In this context, one of the areas where the most applications were developed has been agriculture. Such applications include remote sensing as well as image processing, artificial intelligence, and computer vision [34]. The success of approaches such as artificial-intelligence-based expert systems, machine learning, and deep learning depends on the quality of the remotely obtained images. In this sense, different methods can be used to increase the quality of the image [35].
This study presents an application of machine learning (ML) methods using fluorescent spectroscopic data to distinguish between uninoculated and yeast-inoculated tomato samples. As traditional classification techniques are both cumbersome and difficult, computer vision and artificial intelligence methods, which offer easy, more accurate, and fast solutions in classification studies of agricultural products, have recently been frequently preferred. Among the artificial intelligence methods, ML includes a large number of algorithms with a robust discrimination ability if strong features are extracted from agricultural products. ML is a method that aims to improve itself by using experience and data [36]. Although it occupies a common area with artificial intelligence, it is also a standalone subject. ML algorithms predict future data using previous data on a subject for which they are not specifically programmed. The previous data mentioned here are called training data in the literature. The accuracy of the model created using training data is examined using test data [37].
When previous studies are examined, it can be seen that ML algorithms are used to classify many different agricultural products besides tomatoes. Kumar et al. [38] proposed a machine-vision-based tomato grading and sorting system using a support vector machine (SVM) classifier. The system was constructed on an embedded standalone system. The performance of the proposed system was compared in terms of various performance metrics. It was reported that the system has good results and creates suggestions such as Non-Tomato/Tomato and Good/Defective. Iraji [39] proposed soft computing and machine vision methods for the determination of tomato quality in 2019. In that study, a multilayer sub-adaptive neuro-fuzzy inference system architecture was applied to determine quality. Some neural networks, extreme learning machines, and regression model combinations were investigated. The deep-stack sparse autoencoders method has been reported to be more successful. The achieved accuracy was specified as 95.5%. Li, Sun, Liu, and Shi [11] proposed a machine-vision-based tomato volume measurement method. First, the geometric feature parameters of the tomatoes were collected from the tomato images. It was reported that the average error of volume prediction was about 8.22%. Ropelewska and Piecko [40] investigated various ML methods to discriminate tomato seeds. The seed images were converted into various color spaces and their color channels were used as features. Although for various seed types, higher accuracy rates were achieved up to 99.75%, the best result in an average accuracy of 97% was achieved with the multilayer perceptron. Slavova et al. [41] investigated various ML methods to determine the breeding method effects on different potato types by using spectroscopic data. ML methods such as Hoeffding Tree, Naive Bayes, SMO, Multi-Class Classifier, IBk, and PART were compared using performance metrics such as precision, F-measure, MCC, and PCR-ROC Area. It was reported that the best result of 95% was achieved by SMO. Koklu et al. [42] classified pumpkin seeds using ML methods. To create a dataset, 2500 pumpkin seeds were photographed. The classification was conducted using logistic regression, multilayer perceptron, SVM, random forest, and k-nearest neighbor. The best ML method in terms of accuracy rate was SVM with 88.64%. Ropelewska et al. [43] investigated ML methods to classify various onion samples’ fluorescence spectroscopic data. Performance metrics such as confusion matrices, average accuracies, F-measure, precision, ROC, and PRC area were used for comparisons. The multilayer perceptron, Naive Bayes, LMT, and JRip classifiers were employed in the classification stage. It was stated that the best average accuracy was determined as being 90% with the LMT classifier. Yasmin et al. [44] proposed a one-class classification method for tomato seeds. They created an imaging system containing a conveyor, a black box with a camera, and self-lighting. The samples were lined up with four rows on the conveyor manually. They were photographed in RGB color space. The final attributes obtained from the image color channels were classified by using the multivariate data analysis method of DD-SIMCA. It was reported that the performance of this method was 97.7% in terms of accuracy.
This study aims to classify the investigated tomatoes for different purposes using ML algorithms. Unlike previous studies, this study will present an ML-based application to discriminate between uninoculated and yeast-inoculated tomato samples. The types of tomatoes used were ‘local dwarf’, ‘Ideal’, and ‘Picador’. They were examined spectrally using fluorescence spectroscopy and the obtained spectra were analyzed with six different ML algorithms, namely Hoeffding Tree, PART, IBk, Filtered Classifier, Logistic, and Bayes Net. The results of the analysis are expected to demonstrate the strong ability of the different ML methods to discriminate between uninoculated and yeast-inoculated tomato cultivars. The contributions of this study can be summarized as follows.
  • Various ML methods are used for the analysis of the spectroscopic data.
  • Computer aided systems are used to distinguish uninoculated and yeast-inoculated tomato samples.
  • Different ML methods distinguish between uninoculated and yeast-inoculated tomato varieties with a high accuracy.
This paper is organized as follows. After the introduction, Section 2 explains in detail the tomato species used, growing conditions, information on the inoculation of tomatoes, fluorescence spectroscopy data obtained from tomatoes, and discriminant analysis. Section 3 interprets the results obtained from the different ML methods as a result of the classification of each tomato species. Finally, Section 4 evaluates and concludes the study.

2. Materials and Methods

2.1. Material

The plant material utilized in this work consisted of three tomato accessions, namely COE0158-local dwarf tomato; COE0159-determinate cultivar ‘Pikador’; COE0160-indeterminate cultivar ‘Ideal’ reserved at the genebank of the Institute of Plant Genetics Resources, Sadovo. The COE0158-local dwarf tomato is compact, with the plant growing up to 40–50 cm tall, potato-type leaves, bright red fruits of a flat round shape, with the weight of the tomatoes grown being 100–120 g. The determinate cultivar ‘Pikador’ is a high productive cultivar producing fruit with intensely red flesh and is great for preserves. They produce nice, slightly elongated tomatoes that resemble pears in shape, are firm and hard, and weigh 50–60 g. They develop in clusters and thanks to their resistance to breaking, the crops are always of high quality and resistant to mold. The indeterminate cultivar ‘Ideal’ is a medium-early tomato cultivar with large fruits 130–180 g, flat-round to round, slightly ridged, multi-chambered, orange-red in color, with a pleasant taste. The sample images representing the ‘local dwarf’, ‘Picador’, and ‘Ideal’ types used in this study are shown in Figure 1.
The seeds were sown in seedling trays filled with a peat-pearlitic substrate and were placed at a temperature of 25–28 °C for germination. Tomato seedlings were planted after they were 15–25 cm tall and had 3–5 true leaves, assuming all danger of frost had passed (May 15). Indeterminate COE0160 were planted at a distance between rows of 75–80 cm and 35–40 cm between plants in the row. The stems were attached to a supporting structure. Determinate tomatoes COE0159 and dwarf COE0158 were planted 25–30 cm between the tomato plants, and space rows 60–90 cm apart. The samples were grown at the Institute of Plant Genetics Resources, Sadovo. The field experiment is based on the block method with three replications, ten (10) plants in repetition

2.2. Isolation and Molecular Identification of Yeast

The yeast was isolated from surface-sterilized roots and wheat seeds grown in the Plovdiv Agricultural University training experiment field, spread over an area of 185 hectares around the city of Plovdiv, Southern Bulgaria. Molecular identification of the isolated yeast was reported by [24].

2.3. Colonization on the Development of Tomato in Field Experiments

The experimental design was set up to monitor and evaluate the effect of the yeast strain on the growth of tomatoes. These tomato plants were inoculated individually with soil or leaf treatment, and the uninoculated plants were used as the controls. Soil application was done by pipetting close to the root and leaf spraying was done to all leaves with a suspension at 1 × 10⁴ yeast cell concentration for each strain separately. The yeast suspension was not applied to the control plants. An additional second application was made for tomato plants on the 14th day after the first inoculation. NIR measurements were made to monitor the effect of yeast colonization on tomatoes.

2.4. Fluorescence Spectroscopy

The optical features of tomato fruits were obtained by their energy structure, which contained both the free electronic energy levels and the occupied ones, as well as the energy levels of the atomic oscillations of the molecules or the crystal lattice. The possible transitions between these energy levels as a function of the energy of the photons were specific to the biological object. As a result, the spectrum and optical properties were unique to it. The fruit contained particles smaller than the wavelength of visible light. Particles in turbid environments (e.g., hems) play the role of independent light sources, emitting inconsistently and visibly fluorescence samples.
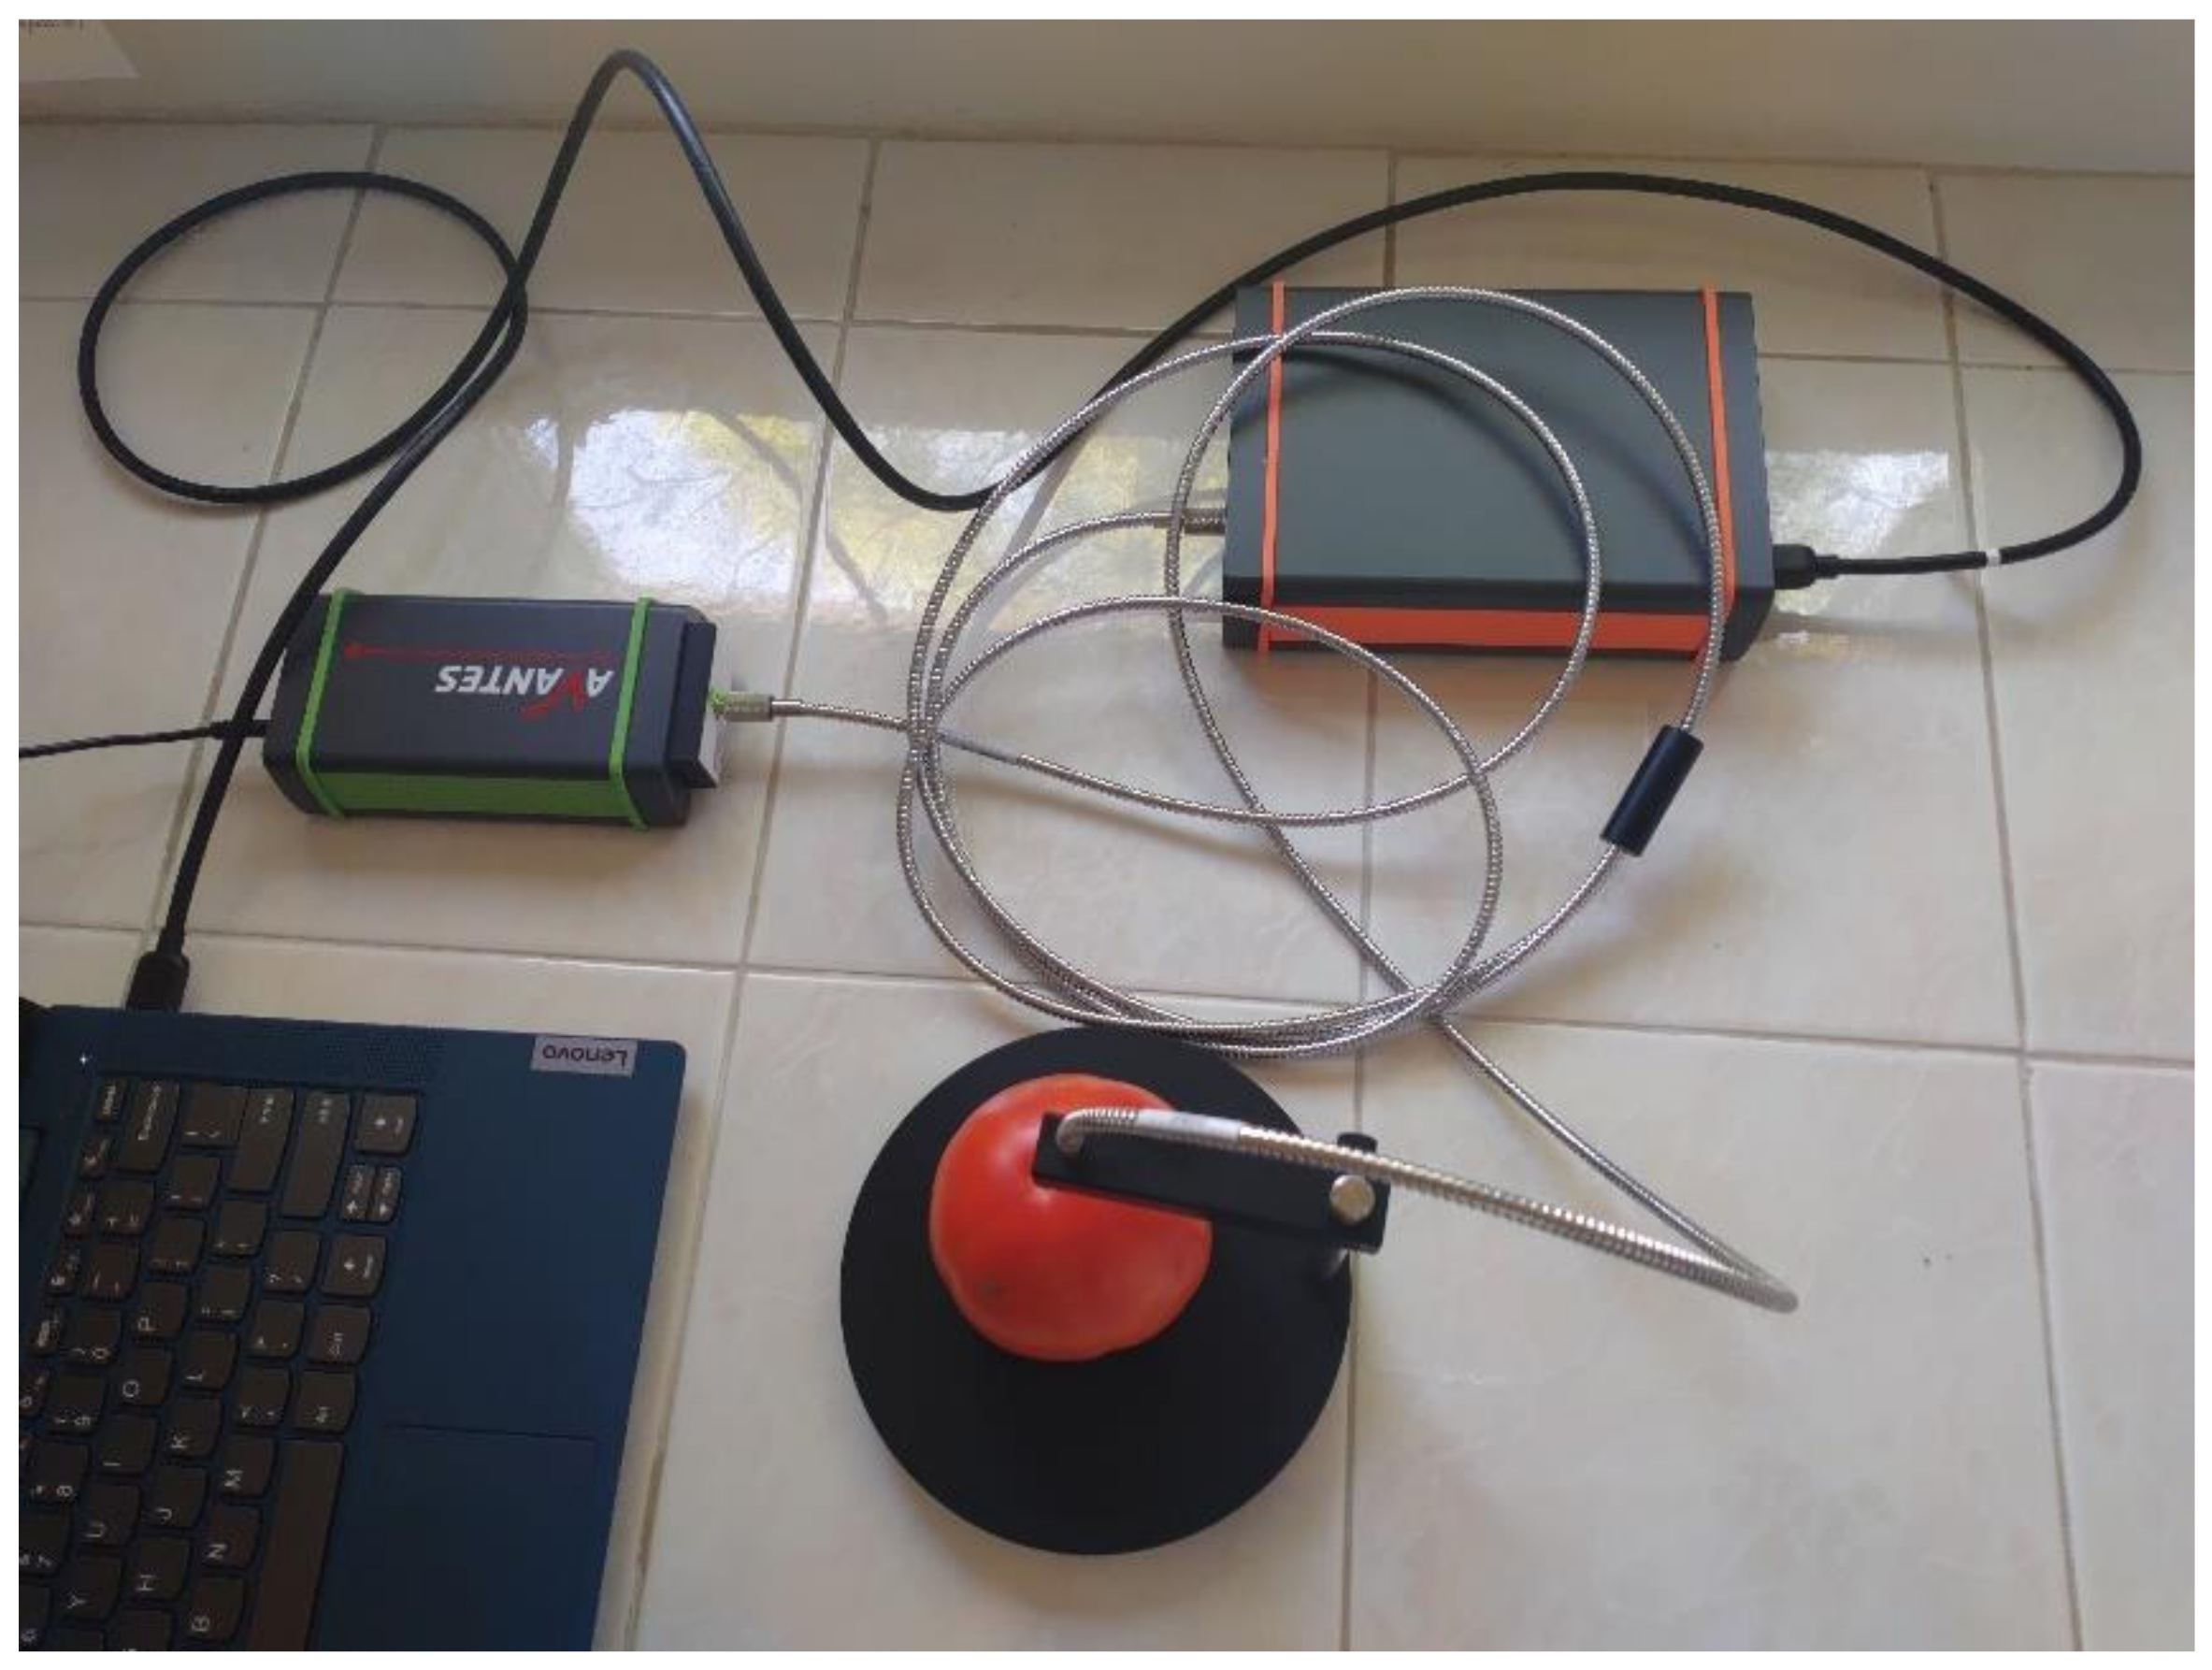
The study was carried out with a fiber optic spectrometer that allowed for the generation of fluorescent emission signals from 200 nm to 1200 nm. The device was used to perform fluorescence spectroscopy of solid samples in a photosensitive area of 1.9968 × 1.9968 mm. The experimental setup consisted of a laser diode with an emission wavelength of 285 nm and optical power of 16 mW, DC. In addition, the portable spectrometer model AvaSpec-ULS2048CL-EVO was used. AvaSpec-ULS2048CL-EVO is a portable spectrometer manufactured by Avantes-Apeldoorn(Apeldoorn, The Netherlands). Using CMOS instead of conventional CCD technology, this spectrometer owes its key advantage over others with a similar configuration to the dominant position of the CMOS detector in its construction. Technologies such as CMOS have evolved and become a suitable alternative. AvaSpec-ULS2048CL-EVO offers the latest technology providing a high signal sensitivity. The spectrometer is combined with the latest electronics in the industry AS-7010. By purchasing AvaSpec-ULS0248CL-EVO, a universal device was purchased, including USB3.0 communication with 10 times higher speed compared with USB2 and a second communication port that offers a Gigabit Ethernet for network integration and long-distance communication capability. In addition to high-speed communication options, the spectrometer also comes with a fast microprocessor and 50 times more memory capacity, which will help store a large batch of spectra. The tomato samples were placed on a duralumin stand, reducing aberrations and allowing for the emission of fluorescent signals of a better quality (Figure 2).
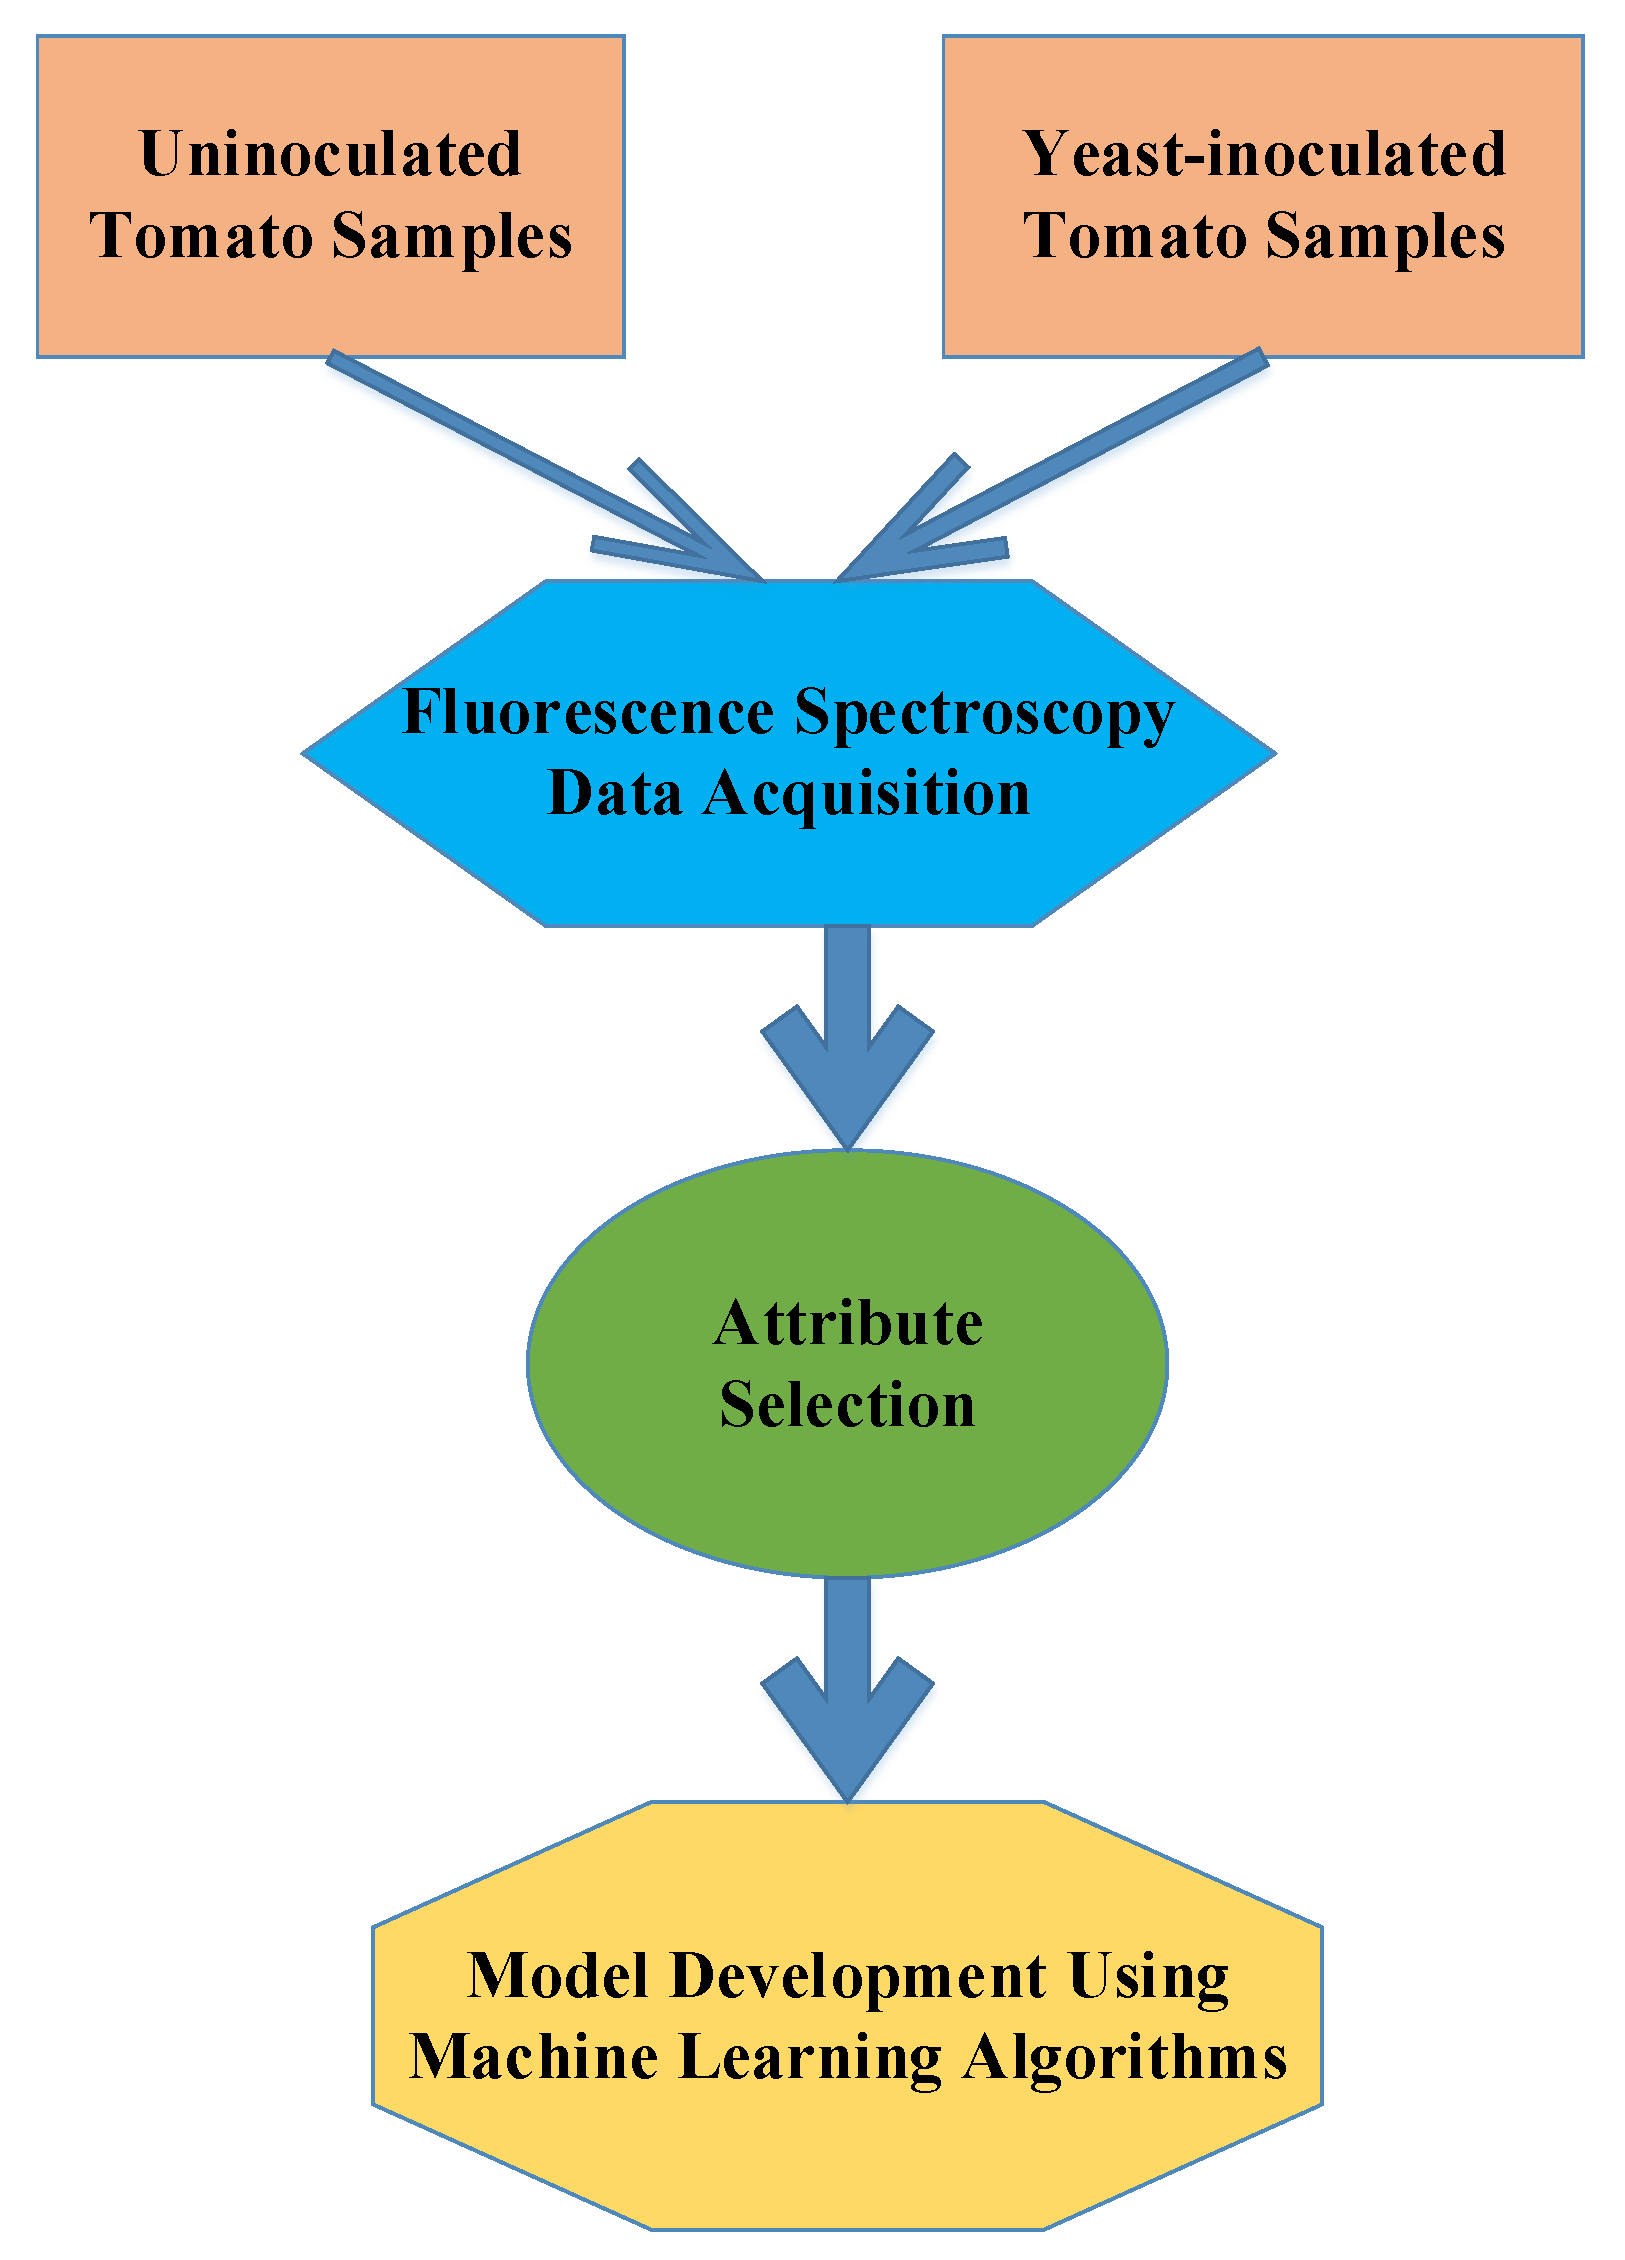
The resolution of the spectrometer was 0.09 nm. The useful fluorescence signal was measured in a direction 180° below the excitation radiation. The laser diode used had a relatively wide spectral radiation width (30–40 nm) and the angular distribution of the radiation was +/− 30°. The sensitivity of the spectrometer was in the range of 200 nm to 1200 nm and the resolution was δλ = 5 nm. Using the spectral installation based on fluorescent signals, the measurements of the emission spectrum and the spectrum of the excitation source were possible. The photodetector of the CMOS type, model S9132, was used for the specific circuit. Model S9132 was chosen because of the possibility of detecting emission radiation from a tomato sample with a very low loss of water content. The laser radiation was removed from the source and fell on the sample. After the sample fluoresces, the emission signal fell on a U-shaped optical fiber with a numerical aperture of 0.22, a core diameter of 200 µm, and a step-index of the refractive index. In the spectrometer, the light signal was converted to electrical-digital via a USB 2.0 wire, then downloaded to a computer with AvaSoft8 software, and finally exported to Excel. The discriminative models were built based on the fluorescence data to distinguish the uninoculated and yeast-inoculated tomato samples. The schematic approach to data acquisition and analysis is shown in Figure 3.

2.5. Discriminant Analysis

The statistical analysis of the fluorescence spectroscopic data was carried out using the WEKA application (Machine Learning Group, University of Waikato, Hamilton, New Zealand) [45,46,47]. The analysis was performed for ‘local dwarf’, ‘Ideal’, and ‘Picador’ tomatoes. In the case of each type of tomato, the discrimination analysis was carried out to distinguish the control and yeast-inoculated tomato samples. In the first step of the analysis, attribute selection was performed. The Best First with the CFS (correlation-based feature selection) algorithm was used. The chosen spectroscopic data at selected wavelengths [nm] characterized by the highest discriminative power were used to build the model for the discrimination of the control and inoculated tomato classes. The models were developed using a 10-fold cross-validation mode and ML algorithms. One algorithm from the groups of Trees, Rules, Meta, Lazy, Functions, and Bayes, providing the most satisfactory results, was chosen. The following algorithms were selected as the most successful: Hoeffding Tree, PART, Filtered Classifier, Logistic, and Bayes Net, respectively. In the case of each model, the confusion matrices, average accuracy, and the values of true positive rate (TP Rate), precision, receiver operating characteristic area (ROC area), precision-recall area (PRC Area), F-measure, and Matthews correlation coefficient (MCC) were determined [48,49].

3. Results and Discussion

The models developed based on fluorescence spectroscopic data using ML algorithms were used to distinguish the uninoculated (control) and yeast-inoculated tomato samples. The discrimination analysis was performed separately for each of the three types of tomato. In the case of the local dwarf tomato (Table 1), the average accuracy for the discrimination of the control and inoculated tomato reached 100% for the models developed using the Hoeffding Tree from the group of Trees and Bayes Net from the group of Bayes. Both the uninoculated and yeast-inoculated tomatoes were completely distinguished from each other and there was no mixing of cases between classes. In addition, other performance measures showed complete differentiation between yeast-inoculated and uninoculated tomatoes. The values of the TP rate, precision, ROC area, PRC area, F-measure, and MCC were equal to 1.000. The remaining algorithms also produced very satisfactory results. The average accuracy for models built using PART (group of Rules), Filtered Classifier (group of Meta), IBk (group of Lazy), and Logistic (group of Functions) reached 95%. In the case of each algorithm, the control samples were correctly discriminated 100% of the time, whereas the inoculated samples were discriminated with an accuracy of 90%, and the remaining 10% of the tomato cases belonging to the actual class ‘inoculated’ were incorrectly included in the predicted class ‘control’. The obtained confusion matrices influenced lower values of the other discrimination performance metrics. The TP rate was equal to 1.000 for the control and 0.900 for inoculated samples in the case of each algorithm. The control and yeast-inoculated tomatoes were characterized by precision equal to 0.909 the 1.000, respectively. The ROC area for both the control and inoculated tomato samples ranged from 0.990 for IBk to 1.000 for Logistic. In addition, PRC area for both classes reached 1.000 for the Logistic algorithm. The lowest value of PRC area was 0.909 for the control tomatoes for the PART and Filtered Classifier algorithms. In the case of PART, Filtered Classifier, IBk, and Logistic, the value of the F-measure was equal to 0.952 for the control samples and 0.947 for the inoculated samples, and MCC reached 0.905 for both tomato samples.
The results of the discrimination of the yeast-inoculated and uninoculated tomato ‘Pikador’ are presented in Table 2. In the case of this cultivar, an average accuracy of 100% was also obtained. The inoculated and uninoculated (control) classes were completely correctly discriminated in the case of the models built using the Hoeffding Tree, PART, and IBk algorithms. The accuracies were equal to 100% and the values of other metrics, i.e., TP rate, precision, ROC area, PRC area, F-measure, and MCC reached 1.000. In the case of other algorithms (Filtered Classifier, Logistic, and Bayes Net), the discrimination performance metrics were also high. An average accuracy of 95% was determined. The control samples were distinguished with a higher accuracy. The accuracy for the control tomato class was equal to 100% and for the inoculated class it was 90%. For the Filtered Classifier, Logistic, and Bayes Net algorithms, the TP rate (1.000) and F-measure (0.952) were also higher for the control than for the inoculated samples (TP rate: 0.900, F-Measure: 0.947). However, the class ‘inoculated’ was characterized by higher precision and PRC area values.
In the case of the discrimination of the control and yeast-inoculated tomato ‘Ideal’, an average accuracy of 100% was not observed (Table 3). Two classes were distinguished with an average accuracy of up to 95% for the model built based on fluorescence spectroscopic data using the KStar algorithm from the group of Lazy. For this model, the control tomatoes and inoculated tomatoes were discriminated with accuracies of 100% and 90%, respectively. The KStar algorithm produced also the highest values for the TP rate (control: 1.000, inoculated: 0.900), precision (control: 0.909, inoculated: 1.000), F-measure (control: 0.952, inoculated: 0.947), and MCC (control: 0.905, inoculated: 0.905). A slightly lower average accuracy of 90% (an accuracy of 90% for both control and inoculated classes) was determined in the case of the Filtered Classifier and Logistic. The lowest average accuracy of 80% (90% for control tomatoes and 70% for inoculated tomatoes) was found for the model developed using the PART algorithm. In addition, the values for the TP Rate (control: 0.900, inoculated: 0.700), precision (control: 0.750, inoculated: 0.875), ROC area (control: 0.830, inoculated: 0.830), PRC area (control: 0.775, inoculated: 0.813), F-measure (control: 0.818, inoculated: 0.778), and MCC (control: 0.612, inoculated: 0.612) were the lowest for the PART algorithm.
The obtained results reveal that selected fluorescence spectroscopy data combined with ML allowed for the discrimination of yeast-inoculated and uninoculated tomatoes with correctness reaching 100%. However, the correctness depended on the type of tomato. In the case of two (‘local dwarf’ and ‘Pikador’) of the three types examined, the average accuracy reached 100%, while the control and yeast-inoculated tomato samples belonging to the third type (‘Ideal’) were discriminated with correctness reaching 95%. The usefulness of the approach involving fluorescence spectroscopy and ML for the discrimination of samples was confirmed in previous studies performed, e.g., by Slavova, Ropelewska, Sabanci, Aslan, and Nacheva [41], who proved that selected fluorescence spectroscopic data can be useful for the discrimination of the potato lines and varieties with the correctness of up to 100% and precision, F-measure, ROC area, PRC area, and MCC of 1.000. Ropelewska, Slavova, Sabanci, Aslan, Cai, and Genova [43] successively discriminated different onion samples using models built based on selected fluorescence spectroscopic data and ML algorithms. The onion cultivated under normal watering and drought were distinguished with an average accuracy reaching 100%.

4. Conclusions

This work discussed how effective ML techniques were for classifying yeast-inoculated and uninoculated tomato cultivars based on fluorescent spectroscopic data. Three different tomato cultivars, ‘local dwarf’, ‘Pikador’, and ‘Ideal’, were used. ML algorithms were applied to perform the discrimination analysis. Tomato samples were distinguished as yeast-inoculated and uninoculated with different classifiers. Based on the classification results obtained using ML algorithms, the performance metric values for each ML algorithm were compared. The results indicated that ML methods provided a successful classification for uninoculated and yeast-inoculated tomato sample discrimination. Of the six different ML algorithms studied, HoeffdingTree and BayesNet distinguished ‘local dwarf’ tomato samples from yeast-inoculated and uninoculated, with the highest average accuracy equal to 100%. The ‘Picador’ tomato samples were distinguished by the HoeffdingTree, PART and IBk classifiers with the highest accuracy. ‘Ideal’ tomato samples were distinguished by the KStar classifier with the highest accuracy of 95%. Considering the results attained, it seems that combining fluorescence spectroscopy and discriminant analysis using various classifiers can be a promising differentiation procedure to distinguish different tomato samples. Moreover, the developed procedures can be applied to a larger number of cultivars. In future studies, deep-learning-based long short-term memory (LSTM) networks can be used to distinguish tomato samples.

Author Contributions

Conceptualization, E.R., V.S., K.S., M.F.A., V.M. and M.P.; methodology, E.R., V.S., K.S. and M.F.A.; software, E.R., K.S. and M.F.A.; validation, E.R., K.S. and M.F.A.; formal analysis, E.R., V.S., V.M. and M.P.; investigation, E.R., K.S. and M.F.A.; resources, V.S., V.M. and M.P.; data curation, E.R., K.S. and M.F.A.; writing—original draft preparation, E.R., V.S., K.S. and M.F.A.; writing—review and editing, E.R., V.S., K.S. and M.F.A.; visualization, E.R., V.S., K.S., M.F.A., V.M. and M.P.; supervision, E.R., K.S. and M.F.A. All authors have read and agreed to the published version of the manuscript.

Funding

This research received no external funding.

Institutional Review Board Statement

Not applicable.

Data Availability Statement

The data presented in this study are available upon request from the corresponding author.

Conflicts of Interest

The authors declare no conflict of interest.

References

  1. Osae, R.; Apaliya, M.T.; Alolga, R.N.; Kwaw, E.; Otu, P.N.Y.; Akaba, S. Influence of shea butter, bee wax and cassava starch coatings on enzyme inactivation, antioxidant properties, phenolic compounds and quality retention of tomato (Solanum lycopersicum) fruits. Appl. Food Res. 2022, 2, 100041. [Google Scholar] [CrossRef]
  2. Saini, R.K.; Moon, S.H.; Keum, Y.-S. An updated review on use of tomato pomace and crustacean processing waste to recover commercially vital carotenoids. Food Res. Int. 2018, 108, 516–529. [Google Scholar] [CrossRef]
  3. Vallecilla-Yepez, L.; Ciftci, O.N. Increasing cis-lycopene content of the oleoresin from tomato processing byproducts using supercritical carbon dioxide. LWT 2018, 95, 354–360. [Google Scholar] [CrossRef]
  4. Vigneshwaran, G.; More, P.R.; Arya, S.S. Non-thermal hydrodynamic cavitation processing of tomato juice for physicochemical, bioactive, and enzyme stability: Effect of process conditions, kinetics, and shelf-life extension. Curr. Res. Food Sci. 2022, 5, 313–324. [Google Scholar] [CrossRef]
  5. Akbudak, M.A.; Filiz, E.; Çetin, D. Genome-wide identification and characterization of high-affinity nitrate transporter 2 (NRT2) gene family in tomato (Solanum lycopersicum) and their transcriptional responses to drought and salinity stresses. J. Plant Physiol. 2022, 272, 153684. [Google Scholar] [CrossRef] [PubMed]
  6. El-Sitiny, M.F.; Habeba, M.; El-Shehawi, A.M.; Elseehy, M.M.; El-Tahan, A.M.; El-Saadony, M.T.; Selem, G.S. Biochemical and molecular diagnosis of different tomato cultivars susceptible and resistant to Tuta absoluta (meyrick) infestation. Saudi J. Biol. Sci. 2022, 29, 2904–2910. [Google Scholar] [CrossRef]
  7. Guo, J.-E. Histone deacetylase gene SlHDT1 regulates tomato fruit ripening by affecting carotenoid accumulation and ethylene biosynthesis. Plant Sci. 2022, 318, 111235. [Google Scholar] [CrossRef]
  8. Nassiri, S.M.; Tahavoor, A.; Jafari, A. Fuzzy logic classification of mature tomatoes based on physical properties fusion. Inf. Process. Agric. 2021, 9, 547–555. [Google Scholar] [CrossRef]
  9. Morales-Rabanales, Q.N.; Coyotl-Pérez, W.A.; Rubio-Rosas, E.; Cortes-Ramírez, G.S.; Ramírez, J.F.S.; Villa-Ruano, N. Antifungal properties of hybrid films containing the essential oil of Schinus molle: Protective effect against postharvest rot of tomato. Food Control 2022, 134, 108766. [Google Scholar] [CrossRef]
  10. Li, Q.; Xie, F.; Zhao, Y.; Cao, J. Inhibitory effect of postharvest yeast mannan treatment on Alternaria rot of tomato fruit involving the enhancement of hemicellulose polysaccharides and antioxidant metabolism. Sci. Hortic. 2021, 277, 109798. [Google Scholar] [CrossRef]
  11. Li, H.; Sun, Q.; Liu, S.; Liu, L.; Shi, Y. A Novel Tomato Volume Measurement Method based on Machine Vision. Teh. Vjesn. 2021, 28, 1674–1680. [Google Scholar] [CrossRef]
  12. Xie, F.; Yuan, S.; Pan, H.; Wang, R.; Cao, J.; Jiang, W. Effect of yeast mannan treatments on ripening progress and modification of cell wall polysaccharides in tomato fruit. Food Chem. 2017, 218, 509–517. [Google Scholar] [CrossRef] [PubMed]
  13. Zhao, S.; Guo, Y.; Wang, Q.; Luo, H.; He, C.; An, B. Expression of flagellin at yeast surface increases biocontrol efficiency of yeast cells against postharvest disease of tomato caused by Botrytis cinerea. Postharvest Biol. Technol. 2020, 162, 111112. [Google Scholar] [CrossRef]
  14. Guo, J.; Sun, K.; Zhang, Y.; Hu, K.; Zhao, X.; Liu, H.; Wu, S.; Hu, Y.; Zhang, Y.; Wang, Y. SlMAPK3, a key mitogen-activated protein kinase, regulates the resistance of cherry tomato fruit to Botrytis cinerea induced by yeast cell wall and β-glucan. Postharvest Biol. Technol. 2021, 171, 111350. [Google Scholar] [CrossRef]
  15. Castanheira, M.; Deshpande, L.M.; Davis, A.P.; Rhomberg, P.R.; Pfaller, M.A. Monitoring Antifungal Resistance in a Global Collection of Invasive Yeasts and Molds: Application of CLSI Epidemiological Cutoff Values and Whole-Genome Sequencing Analysis for Detection of Azole Resistance in Candida Albicans. Antimicrob. Agents Chemother. 2017, 61, e00906-17. [Google Scholar] [CrossRef] [Green Version]
  16. Freimoser, F.M.; Rueda-Mejia, M.P.; Tilocca, B.; Migheli, Q. Biocontrol yeasts: Mechanisms and applications. World J. Microbiol. Biotechnol. 2019, 35, 154. [Google Scholar] [CrossRef] [Green Version]
  17. Ling, L.; Tu, Y.; Ma, W.; Feng, S.; Yang, C.; Zhao, Y.; Wang, N.; Li, Z.; Lu, L.; Zhang, J. A potentially important resource: Endophytic yeasts. World J. Microbiol. Biotechnol. 2020, 36, 110. [Google Scholar] [CrossRef]
  18. Hassan, S.E.-D. Plant growth-promoting activities for bacterial and fungal endophytes isolated from medicinal plant of Teucrium polium L. J. Adv. Res. 2017, 8, 687–695. [Google Scholar] [CrossRef]
  19. Buzzini, P.; Branda, E.; Goretti, M.; Turchetti, B. Psychrophilic yeasts from worldwide glacial habitats: Diversity, adaptation strategies and biotechnological potential. FEMS Microbiol. Ecol. 2012, 82, 217–241. [Google Scholar] [CrossRef]
  20. Sundh, I.; Melin, P. Safety and regulation of yeasts used for biocontrol or biopreservation in the food or feed chain. Antonie Van Leeuwenhoek 2010, 99, 113–119. [Google Scholar] [CrossRef]
  21. Van Lenteren, J.C.; Bolckmans, K.; Köhl, J.; Ravensberg, W.J.; Urbaneja, A. Biological control using invertebrates and microorganisms: Plenty of new opportunities. BioControl 2018, 63, 39–59. [Google Scholar] [CrossRef] [Green Version]
  22. Spadaro, D.; Droby, S. Development of biocontrol products for postharvest diseases of fruit: The importance of elucidating the mechanisms of action of yeast antagonists. Trends Food Sci. Technol. 2016, 47, 39–49. [Google Scholar] [CrossRef]
  23. Droby, S.; Wisniewski, M.; Teixidó, N.; Spadaro, D.; Jijakli, M.H. The science, development, and commercialization of postharvest biocontrol products. Postharvest Biol. Technol. 2016, 122, 22–29. [Google Scholar] [CrossRef]
  24. Petkova, M.; Petrova, S.; Spasova-Apostolova, V.; Naydenov, M. Tobacco Plant Growth-Promoting and Antifungal Activities of Three Endophytic Yeast Strains. Plants 2022, 11, 751. [Google Scholar] [CrossRef] [PubMed]
  25. Valeur, B.; Berberan-Santos, M.N. Molecular Fluorescence: Principles and Applications; John Wiley & Sons: Hoboken, NJ, USA, 2012. [Google Scholar]
  26. Qin, J.; Lu, R. Measurement of the optical properties of fruits and vegetables using spatially resolved hyperspectral diffuse reflectance imaging technique. Postharvest Biol. Technol. 2008, 49, 355–365. [Google Scholar] [CrossRef]
  27. Bachmann, L.; Zezell, D.M.; Ribeiro, A.D.C.; Gomes, L.; Ito, A.S. Fluorescence Spectroscopy of Biological Tissues—A Review. Appl. Spectrosc. Rev. 2006, 41, 575–590. [Google Scholar] [CrossRef]
  28. Mitschke, F.; Mitschke, F. Fiber Optics; Springer: Berlin/Heidelberg, Germany, 2016. [Google Scholar]
  29. Dakin, J.P.; Brown, R. Handbook of Optoelectronics: Concepts, Devices, and Techniques (Volume One); CRC Press: Boca Raton, FL, USA, 2017. [Google Scholar]
  30. Hoffmann, A.M.; Noga, G.; Hunsche, M. Fluorescence indices for monitoring the ripening of tomatoes in pre- and postharvest phases. Sci. Hortic. 2015, 191, 74–81. [Google Scholar] [CrossRef]
  31. Karoui, R.; Blecker, C. Fluorescence Spectroscopy Measurement for Quality Assessment of Food Systems—A Review. Food Bioprocess Technol. 2011, 4, 364–386. [Google Scholar] [CrossRef]
  32. Karim, S.; Zhang, Y.; Laghari, A.A.; Asif, M.R. Image processing based proposed drone for detecting and controlling street crimes. In Proceedings of the 2017 IEEE 17th International Conference on Communication Technology (ICCT), Chengdu, China, 27–30 October 2017; pp. 1725–1730. [Google Scholar]
  33. Karim, S.; Zhang, Y.; Yin, S.; Laghari, A.A.; Brohi, A.A. Impact of compressed and down-scaled training images on vehicle detection in remote sensing imagery. Multimed. Tools Appl. 2019, 78, 32565–32583. [Google Scholar] [CrossRef]
  34. Aslan, M.F.; Durdu, A.; Sabanci, K.; Ropelewska, E.; Gültekin, S.S. A Comprehensive Survey of the Recent Studies with UAV for Precision Agriculture in Open Fields and Greenhouses. Appl. Sci. 2022, 12, 1047. [Google Scholar] [CrossRef]
  35. Laghari, A.A.; He, H.; Shafiq, M.; Khan, A. Assessment of quality of experience (QoE) of image compression in social cloud computing. Multiagent Grid Syst. 2018, 14, 125–143. [Google Scholar] [CrossRef]
  36. Mitchell, T.M. Machine learning and data mining. Commun. ACM 1999, 42, 30–36. [Google Scholar] [CrossRef]
  37. Koza, J.R.; Bennett, F.H.; Andre, D.; Keane, M.A. Automated Design of Both the Topology and Sizing of Analog Electrical Circuits Using Genetic Programming. In Artificial Intelligence in Design ’96; Gero, J.S., Sudweeks, F., Eds.; Springer: Dordrecht, The Netherlands, 1996; pp. 151–170. [Google Scholar]
  38. Kumar, S.D.; Esakkirajan, S.; Bama, S.; Keerthiveena, B. A microcontroller based machine vision approach for tomato grading and sorting using SVM classifier. Microprocess. Microsyst. 2020, 76, 103090. [Google Scholar] [CrossRef]
  39. Iraji, M.S. Comparison between soft computing methods for tomato quality grading using machine vision. J. Food Meas. Charact. 2019, 13, 1–15. [Google Scholar] [CrossRef]
  40. Ropelewska, E.; Piecko, J. Discrimination of tomato seeds belonging to different cultivars using machine learning. Eur. Food Res. Technol. 2022, 248, 685–705. [Google Scholar] [CrossRef]
  41. Slavova, V.; Ropelewska, E.; Sabanci, K.; Aslan, M.F.; Nacheva, E. A comparative evaluation of Bayes, functions, trees, meta, rules and lazy machine learning algorithms for the discrimination of different breeding lines and varieties of potato based on spectroscopic data. Eur. Food Res. Technol. 2022, 248, 1765–1775. [Google Scholar] [CrossRef]
  42. Koklu, M.; Sarigil, S.; Ozbek, O. The use of machine learning methods in classification of pumpkin seeds (Cucurbita pepo L.). Genet. Resour. Crop Evol. 2021, 68, 2713–2726. [Google Scholar] [CrossRef]
  43. Ropelewska, E.; Slavova, V.; Sabanci, K.; Aslan, M.F.; Cai, X.; Genova, S. Discrimination of onion subjected to drought and normal watering mode based on fluorescence spectroscopic data. Comput. Electron. Agric. 2022, 196, 106916. [Google Scholar] [CrossRef]
  44. Yasmin, J.; Lohumi, S.; Ahmed, M.R.; Kandpal, L.M.; Faqeerzada, M.A.; Kim, M.S.; Cho, B.-K. Improvement in Purity of Healthy Tomato Seeds Using an Image-Based One-Class Classification Method. Sensors 2020, 20, 2690. [Google Scholar] [CrossRef]
  45. Bouckaert, R.R.; Frank, E.; Hall, M.; Kirkby, R.; Reutemann, P.; Seewald, A.; Scuse, D. WEKA Manual for Version 3-9-1; University of Waikato: Hamilton, New Zealand, 2016. [Google Scholar]
  46. Frank, E.; Hall, M.; Witten, I. Online Appendix for “Data Mining: Practical Machine Learning Tools and Techniques”; The WEKA Workbench; Elsevier: Amsterdam, The Netherlands, 2016. [Google Scholar]
  47. Witten, I.H.; Frank, E.; Hall, M.A.; Pal, C.J. Practical machine learning tools and techniques. In Proceedings of the DATA MINING, Las Vegas, NV, USA, 20–23 June 2005; p. 4. [Google Scholar]
  48. Ropelewska, E.; Szwejda-Grzybowska, J. A comparative analysis of the discrimination of pepper (Capsicum annuum L.) based on the cross-section and seed textures determined using image processing. J. Food Process Eng. 2021, 44, e13694. [Google Scholar] [CrossRef]
  49. Sabanci, K.; Aslan, M.F.; Ropelewska, E.; Unlersen, M.F. A convolutional neural network-based comparative study for pepper seed classification: Analysis of selected deep features with support vector machine. J. Food Process Eng. 2021, 45, e13955. [Google Scholar] [CrossRef]
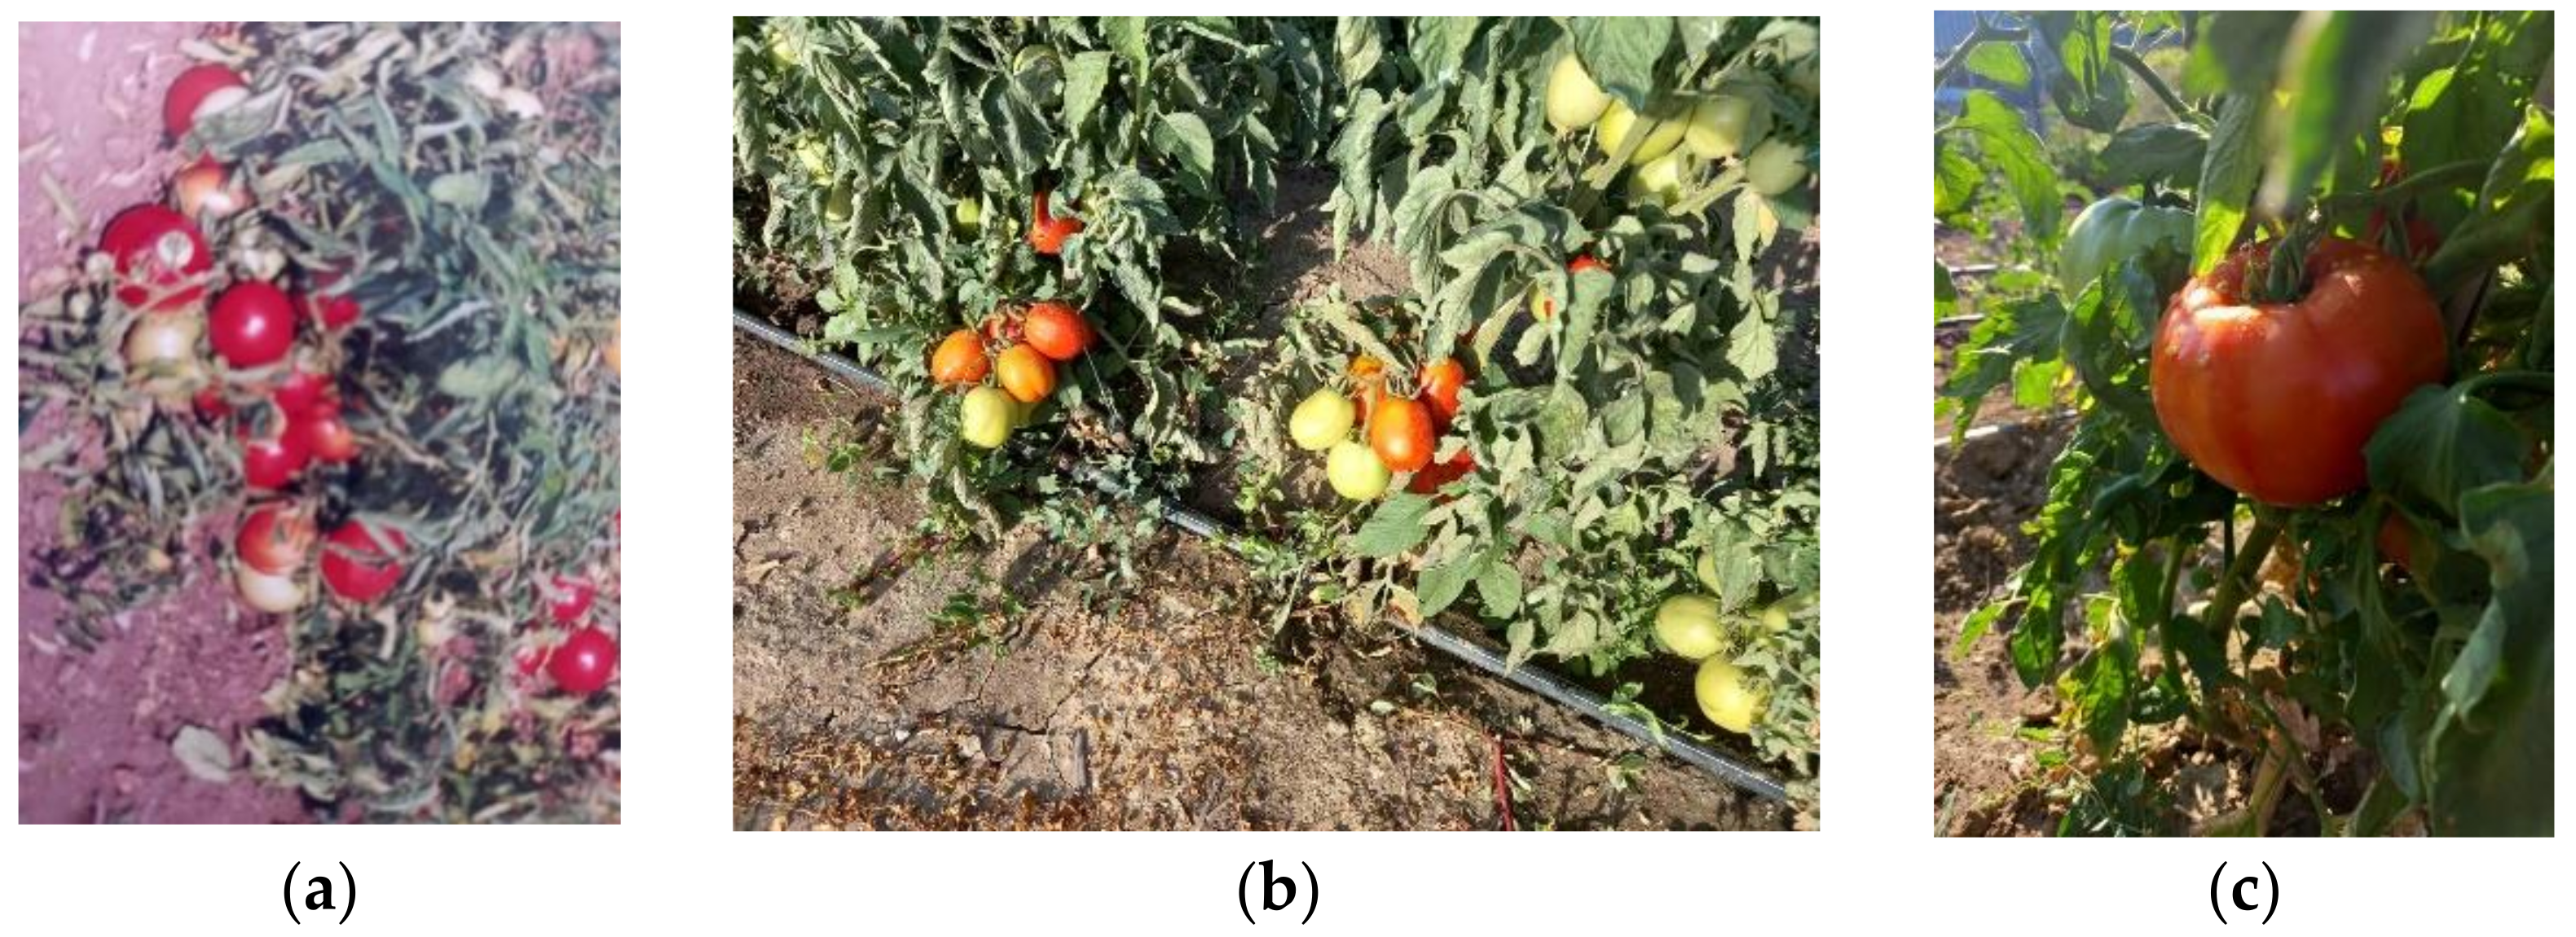
Figure 1. Sample images representing the different types of tomatoes used in this paper: (a) ‘local dwarf’, (b) ‘Pikador’, and (c) ‘Ideal’.
Agriculture 12 01887 g001
Figure 2. The fluorescence spectroscopy setup for the tomato sample measurements.
Agriculture 12 01887 g002
Figure 3. Schematic approach to fluorescence spectroscopic data acquisition and analysis.
Agriculture 12 01887 g003
Table 1. The discrimination of the control and yeast-inoculated local dwarf tomato (COE0158).
AlgorithmPredicted Class (%)Actual Class Average Accuracy (%)TP RatePrecisionROC AreaPRC AreaF-MeasureMCC
ControlInoculated
trees.HoeffdingTree1000control1001.0001.0001.0001.0001.0001.000
0100inoculated1.0001.0001.0001.0001.0001.000
rules.PART1000control951.0000.9090.9500.9090.9520.905
1090inoculated0.9001.0000.9500.9500.9470.905
meta.FilteredClassifier1000control951.0000.9090.9500.9090.9520.905
1090inoculated0.9001.0000.9500.9500.9470.905
lazy.IBk1000control951.0000.9090.9900.9820.9520.905
1090inoculated0.9001.0000.9900.9830.9470.905
functions.Logistic1000control951.0000.9091.0001.0000.9520.905
1090inoculated0.9001.0001.0001.0000.9470.905
bayes.BayesNet1000control1001.0001.0001.0001.0001.0001.000
0100inoculated1.0001.0001.0001.0001.0001.000
TP rate—true positive rate; ROC area—receiver operating characteristic area; PRC area—precision-recall area; MCC—Matthews correlation coefficient.
Table 2. The discrimination performance metrics of the control and yeast-inoculated tomato ‘Pikador’ (COE0159).
AlgorithmPredicted Class (%)Actual ClassAverage Accuracy (%)TP RatePrecisionROC AreaPRC AreaF-MeasureMCC
ControlInoculated
trees.HoeffdingTree 1000control1001.0001.0001.0001.0001.0001.000
0100inoculated1.0001.0001.0001.0001.0001.000
rules.PART 1000control1001.0001.0001.0001.0001.0001.000
0100inoculated1.0001.0001.0001.0001.0001.000
meta.FilteredClassifier 1000control951.0000.9090.9500.9090.9520.905
1090inoculated0.9001.0000.9500.9500.9470.905
lazy.IBk1000control1001.0001.0001.0001.0001.0001.000
0100inoculated1.0001.0001.0001.0001.0001.000
functions.Logistic1000control951.0000.9090.9500.9090.9520.905
1090inoculated0.9001.0001.0001.0000.9470.905
bayes.BayesNet1000control951.0000.9091.000 1.000 0.9520.905
1090inoculated0.9001.0001.000 1.000 0.9470.905
TP rate—true positive rate; ROC area—receiver operating characteristic area; PRC area—precision-recall area; MCC—Matthews correlation coefficient.
Table 3. The discrimination performance metrics of the control and yeast-inoculated tomato ‘Ideal’ (COE0160).
AlgorithmPredicted Class (%)Actual Class Average Accuracy (%)TP RatePrecisionROC AreaPRC AreaF-MeasureMCC
ControlInoculated
trees.HoeffdingTree9010control850.9000.8180.8800.8260.8570.704
2080inoculated0.8000.8890.8800.9230.8420.704
rules.PART9010control800.9000.7500.8300.7750.8180.612
3070inoculated0.7000.8750.8300.8130.7780.612
meta.FilteredClassifier9010control900.9000.9000.9600.9670.9000.800
1090inoculated0.9000.9000.9600.9620.9000.800
lazy.KStar1000control951.0000.9090.9350.8820.9520.905
1090inoculated0.9001.0000.9000.9500.9470.905
functions.Logistic9010control900.9000.9000.9600.9670.9000.800
1090inoculated0.9000.9000.9600.9620.9000.800
bayes.BayesNet9010control850.9000.8180.8900.8340.8570.704
2080inoculated0.8000.8890.8900.9320.8420.704
TP rate—true positive rate; ROC area—receiver operating characteristic area; PRC area—precision-recall area; MCC—Matthews correlation coefficient.
Publisher’s Note: MDPI stays neutral with regard to jurisdictional claims in published maps and institutional affiliations.