Article

Effects of Dietary Phosphorus Deficiency and High Phosphorus Content on the Growth Performance, Serum Variables, and Tibia Development in Goslings

1
College of Animal Science and Technology, Yangzhou University, Yangzhou 225009, China
2
College of Veterinary Medicine, Yangzhou University, Yangzhou 225009, China
3
Joint International Research Laboratory of Agriculture and Agri-Product Safety of Ministry of Education of China, Yangzhou University, Yangzhou 225009, China
*
Author to whom correspondence should be addressed.
Agriculture 2022, 12(11), 1908; https://doi.org/10.3390/agriculture12111908
Submission received: 18 October 2022 / Revised: 6 November 2022 / Accepted: 9 November 2022 / Published: 12 November 2022
(This article belongs to the Section Farm Animal Production)

Abstract

:
Understanding how dietary phosphorus (P) regulates the growth and skeletal development of goslings is essential for fully utilizing P in the production of geese. We aimed to study the effects of dietary P deficiency and high P content on growth performance, serum variables, tibia quality, and mRNA expression of osteogenesis-related genes in tibia to reveal how dietary P regulates bone development in goslings. Two hundred and sixteen one-day-old Jiangnan White male geese were fed corn-soybean meal diets for 14 days. The diets were set with the same calcium (Ca) level (0.80%) and three non-phytate P (NPP) levels: 0.08% (P deficiency), 0.38% (P control), and 0.80% (P high content). Each treatment consisted of six replicates with 12 goslings in each replicate. The P deficient group had a high cumulative mortality of 26.67% with lower body weight (BW), average daily feed intake (ADFI), average daily gain (ADG), serum P contents, tibia width, tibia length, tibia fresh weight at d 14 as compared with the control and high P content group (p ≤ 0.05). Dietary P deficiency caused a reduction in the goslings’ tibia strength, tibia ash content, tibia Ca content, and tibia P content during d 4–d 14 (p < 0.05). The P deficiency reduced tibia mRNA expression of osteoprotegerin (OPG) and runt-related transcription factor 2 (Runx2) on d 7 (p < 0.05), whereas up-regulated serum alkaline phosphatase (ALP) activity, calcitonin (CT) content, and the tibia mRNA ratio of receptor activator of NF-κB ligand (RNAKL)/OPG during d 7–d 14 (p < 0.05). The serum 1,25-(OH2)D3 content, serum bone Gla-protein (BGP), and the mRNA relative expression of RNAKL and BGP in tibia were decreased in the NPP 0.08% and 0.80% groups compared with the control on d 14 (p < 0.05). In conclusion, dietary P deficiency induced acute rickets in goslings as early as the fourth day. A P deficiency hindered the tibia and body growth partly due to poor skeletal calcification caused by a down-expression of osteogenesis-related genes regulated by high serum ALP activity and calcitonin contents and lower serum BGP and skeletal P contents.

1. Introduction

Phosphorus (P) plays an essential physiological role in an organism’s structural composition and metabolic regulation, for example, promoting the growth and development of bone [1,2]. However, a considerable amount of P is composed as phytate P in plant-based diets [3]. Phytate P is poorly available in poultry due to a lack of, or insufficient amount of, endogenous phytase to degrade phytate effectively [4,5]. Therefore, inorganic P deficiency and high P content in diets could negatively affect the tibia of goslings. Rickets refers to a condition of impaired mineralization of growing bones, which ultimately results in twisting and bowing [6]. Hypophosphatemia, tibia cartilage dysplasia and animal rickets could be caused by P deficiency in diets [2,7,8]. Poultry have a fast growth rate in the early growth period. Thus, birds’ bones are susceptible to P deficiency at the early growth stage. Many studies have reported that growth and bone mass in broilers were significantly reduced at 21 days of age due to P deficiency [9,10,11]. Our previous study showed that P deficiency could acutely induce rickets by impairing broiler chicks’ skeletal development and growth performance, in as fast as three days [8]. However, studies in goslings to date have mainly investigated the effects of dietary P levels on the bone and growth performance of goslings at 21 days old [12] and 28 days old [13,14]. The impact on the early stages of goslings needs further study. We hypothesize that P deficiency could induce acute rickets by affecting the bone characteristics in goslings as early as four days old.
The P deficiency [12,13] and high P content [12,14,15,16,17,18] were reported to affect poultry feed intake and growth rate. Our previous studies showed that goslings require non-phytate phosphorus (NPP) of 0.35% from 0 to 28 days old, and a low NPP level of 0.18% reduced the growth performance and bone quality in goslings at 28 days old [13]. However, the mechanism of how dietary levels affect bone development and growth performance needs further study. Studies have revealed that the bone Gla-protein (BGP) [19], runt-related transcription factor 2 (Runx2) [20], osteoprotegerin (OPG), and the receptor activator for nuclear factor kappa B ligand (RANKL) and receptor activator of nuclear factor kappa B (RANK) [21] are critical genes to regulate the osteoblast’s differentiation, maturation, calcification and function in various animals. However, the relationship between dietary P levels and these genes is unknown in geese. We hypothesize that the above genes regulate bone quality induced by different dietary NPP levels in goslings.
Thus, we aimed to study the effect of extreme NPP levels (P deficiency and high P content) on the growth performance and bone quality of goslings in the early stage, and explore its mechanism through the serum variables, tibia quality, and mRNA expression of osteogenesis-related genes. This study may improve our understanding of the symptoms of early rickets induced by P deficiency and the mechanisms of how dietary P levels affect the growth of goslings.

2. Materials and Methods

2.1. Animal and Housing

The procedures in this paper were approved by the Institutional Animal Care and Use Committee of Yangzhou University (ethical protocol code: YZUDWSY 202103008).
This experiment was conducted at the Gaoyou Campus of Yangzhou University (Yangzhou, China) in June 2021. A total of 216 healthy male Jiangnan White geese at one day old with similar BW from the same flock were obtained from a commercial hatchery (Changzhou Four Seasons Poultry Industry Co. Ltd., Jintan, China). All goslings were reared in plastic wire-floor pens (2.28 m × 1.24 m). The temperature for the first and second weeks of breeding was 29–31 °C and 26–29 °C. Goslings were exposed to light for 23 h per day for the first week and 21 h per day for the second week. Water and feed were provided ad libitum for 14 days.

2.2. Experimental Design and Diets

The 216 healthy male goslings were randomized to 3 dietary treatments, including 6 replicate pens and 12 goslings per pen. All feed raw materials (i.e., corn, soybean meal, rice husks, and wheat bran) were analyzed for crude protein, P, and calcium (Ca). Then, three isonitrogenous and isocaloric experimental diets were formulated according to prior research in our lab [22,23]. The Ca and P of the feeds were balanced by limestone, vermiculite, and calcium dihydrogen phosphate, respectively. The dietary NPP levels were 0.08%, 0.38%, and 0.80%, respectively, by supplementing 0%, 1.38%, and 3.12% calcium dihydrogen phosphate (Guizhou Chuanhen Chemical Co., Ltd., Guizhou, China). The 3 diets containing 0.08%, 0.38%, and 0.80% NPP in feed were recorded as P deficiency (PD), P control (PC), and P high content (PH) groups, respectively. The Ca level in each group of diets was kept at 0.80% by supplementation with limestone. Mash feed was used in the experiment.
Crude protein was measured by the Kjeldahl method with the instrument Kjeltec System 8400 (SBS800, FOSS NIR Systems., Inc., Hillerød, Denmark). The Ca was determined by the EDTA method, and P was determined by molybdenum yellow colorimetry [9]. Phytate P was determined via the ferric precipitation method [10,11]. The composition and nutrient levels of the experimental diets are listed in Table 1.

2.3. Growth Performance

The mental state of the goslings was observed, and dead birds were recorded and weighed daily. Growth performance was adjusted by mortality and evaluated in terms of body weight (BW), average daily feed intake (ADFI), average daily gain (ADG), and the feed/gain ratio (F/G). After fasting for 6 h, feed intake and BW for each replicate pen were recorded on day 14. The ADG, ADFI, and F/G from day 14 were calculated. An electronic platform scale recorded the BW.

2.4. Serum Indicators

One gosling was randomly selected from each replicate pen on days 4, 7, 11, and 14. Approximately 1.5 mL of blood was collected via the wing vein and centrifuged at 2000× g for 10 min at 4 °C to harvest the serum. Serum Ca, P, and alkaline phosphatase (ALP) were measured using a Synchron fully automated biochemistry analyzer (Hitachi–7180, Hitachi, Ltd., Tokyo, Japan). The serum BGP (goods no. YB-BGP-Go; batch no. E202110060953), calcitonin (CT; goods no. YB-CT-Go; batch no. E201909161721), OPG (goods no. YB-OPG-Go; batch no. E202109251546), 1,25-(OH)2D3 (goods no. YB-VD3-Go; batch no. E202109140955), and parathyroid hormone (PTH; goods no. YB-PTH-Go; batch no. E202109151327) contents were measured using an enzyme-linked immunosorbent assay from Shanghai Yubo Biotechnology Co., Ltd. (Shanghai, China).

2.5. Tibial Indicators

The goslings were sacrificed by cutting the neck after electrical stunning at 86 mA for 18 s. The left tibia was collected and refrigerated at −20 °C until further analysis. The right tibia was collected and preserved in paraformaldehyde.
The left tibia was defleshed, and the patella was removed. The weight and length were measured with a scale and a vernier caliper. Tibia bone strength was measured with an Instron 3367 double-column electronic testing (Guangzhou Lingtuo Instruments Technology Co., Ltd., Guangzhou, China). The skim weight and tibia ash weight were weighed according to the method of Li [13]. The Ca was determined by the EDTA method, and the P was determined by molybdenum yellow colorimetry [13].

2.6. Isolations of Total RNA and Reverse Transcription-Polymerase Chain Reactions

At 7 and 14 days, one gosling was randomly selected from each pen. Tibial cartilage was collected aseptically and quickly after slaughter, frozen rapidly in liquid nitrogen, and refrigerated at −70 °C until further analysis. Total RNA was extracted from the cartilage using the total RNA extraction kit (product name: Hieff® qPCR SYBR Green Master Mix(Low Rox); CAT, 11201ES08; Yisheng Biotechnology Co., Ltd., Shanghai, China). The concentration and purity of RNA were checked using a Nanodrop 2000 ultra-micro spectrophotometer and reverse transcribed using a reverse transcription kit. The cDNA was diluted, and the relative quantification of expression levels of cytokines OPG, RNAKL, BGP, Runx2, and bone morphogenic protein 2 (BMP-2) in cartilage were performed by CFX Connect TM real-time fluorescence quantitative PCR instrument. β-actin was used as the internal reference gene in a reaction system of 20 μL: qPCR SYRB Green Master Mix (No Rox) 10 μL, upstream and downstream primers 0.4 μL each, cDNA template 2 μL, enzyme-free water 7.2 μL. The reaction conditions were: pre-denaturation at 95 °C for 2 min, denaturation at 95 °C for 5 s, and annealing at 60 °C for 10 s. A total of 40 cycles were performed. The 2-∆∆CT method was used to calculate the relative expression at the end of the measurement. The primer sequences were designed using the mRNA of BMP-2, OPG, RANKL, Runx2, BGP, and β-actin of goose (Anser cygnoides domesticus) included in Genbank and synthesized (Suzhou Jinweizhi Biotechnology Co., Ltd., Suzhou, China). The primer information is shown in Table 2.

2.7. Statistical Analysis

Raw data were organized using Microsoft Excel 2016 of Microsoft Corp. Data were analyzed using one–way ANOVA via SPSS (ver. 20.0) for Windows from SPSS, Inc. (Chicago, IL, USA). The data analysis results are expressed as the mean value and pooled SEM. The difference was significant if p < 0.05 by Duncan’s multiple range tests.

3. Results

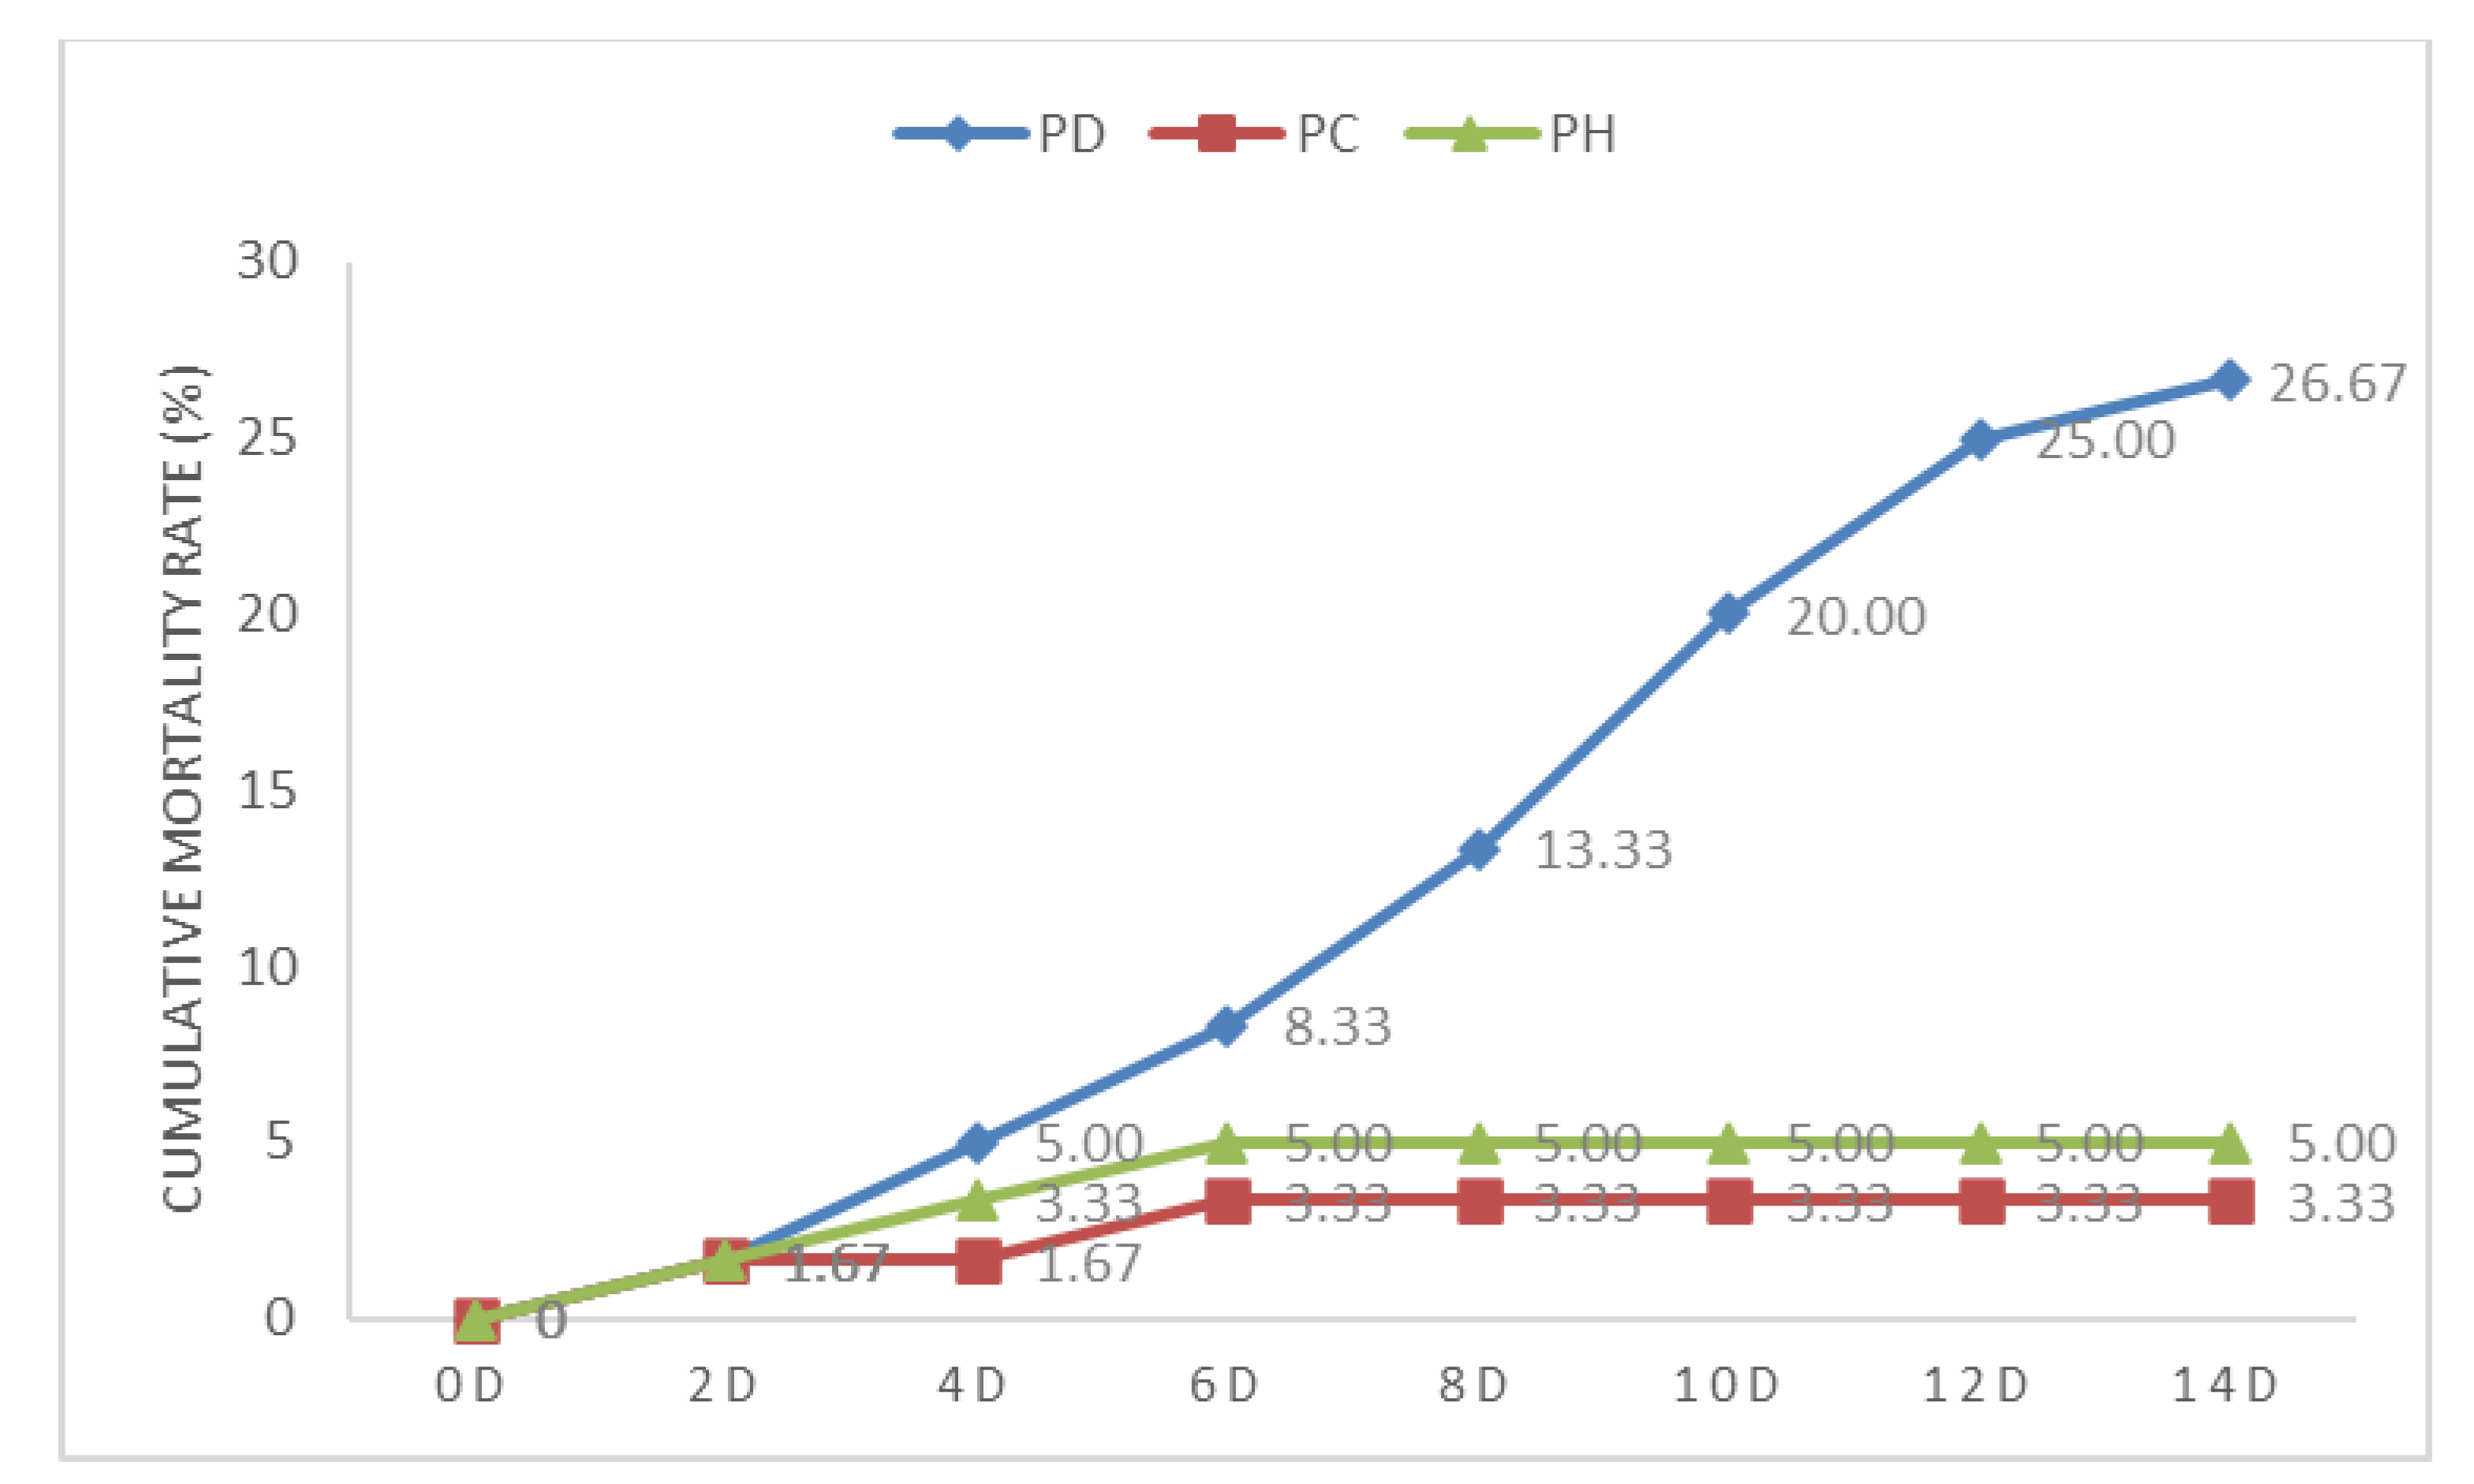
3.1. Growth Performance

Dietary P deficiency caused a reduction (p < 0.05) in the BW, ADG, and ADFI of 14-day-old goslings (Table 3). Cumulative mortality of goslings was increased in the PD group compared with groups PC and PH during d 4-d 14, with a cumulative mortality of 26.67% at d 14 in PD group (Figure 1). The BW, ADG, and ADFI were reduced (p < 0.05) in the PD group, with no difference among other groups (p > 0.05). The F/G was not different among the three groups (p > 0.05).

3.2. Serum Ca, P Contents, and ALP Activity

Dietary P deficiency caused a reduction (p < 0.05) in the serum P content and increased serum ALP activity of goslings (Table 4). Serum P content was decreased on day 14 in PD and PH, compared with PC. Serum ALP activity of goslings increased in group PD on days 7, 11, and 14, compared with PC. Serum ALP activity was not significantly affected in group PH on days 7, 11, and 14, compared with PC. Serum ALP activity was increased on day 7 in group PD, compared with PH, whereas serum ALP activity was not affected on days 11 and 14.

3.3. Serum Hormones Contents

Dietary P deficiency and high P content caused an increase (p < 0.05) of the serum CT and 1,25-(OH2)D3 contents and a reduction (p < 0.05) of the BGP content in goslings (Table 5). The serum CT content was increased on day 7 in group PD (p < 0.05), with no difference between groups PC and PH (p > 0.05). The serum CT content was increased on days 11 and 14 in groups PD and PH compared with group PC (p < 0.05). The serum 1,25-(OH2)D3 content was increased on days 11 and 14 in groups PD and PH compared with group PC (p < 0.05). The serum BGP content was reduced on day 14 in groups PD and PH compared with group PC (p < 0.05). The serum PTH and OPG contents were not different among the three groups (p > 0.05).

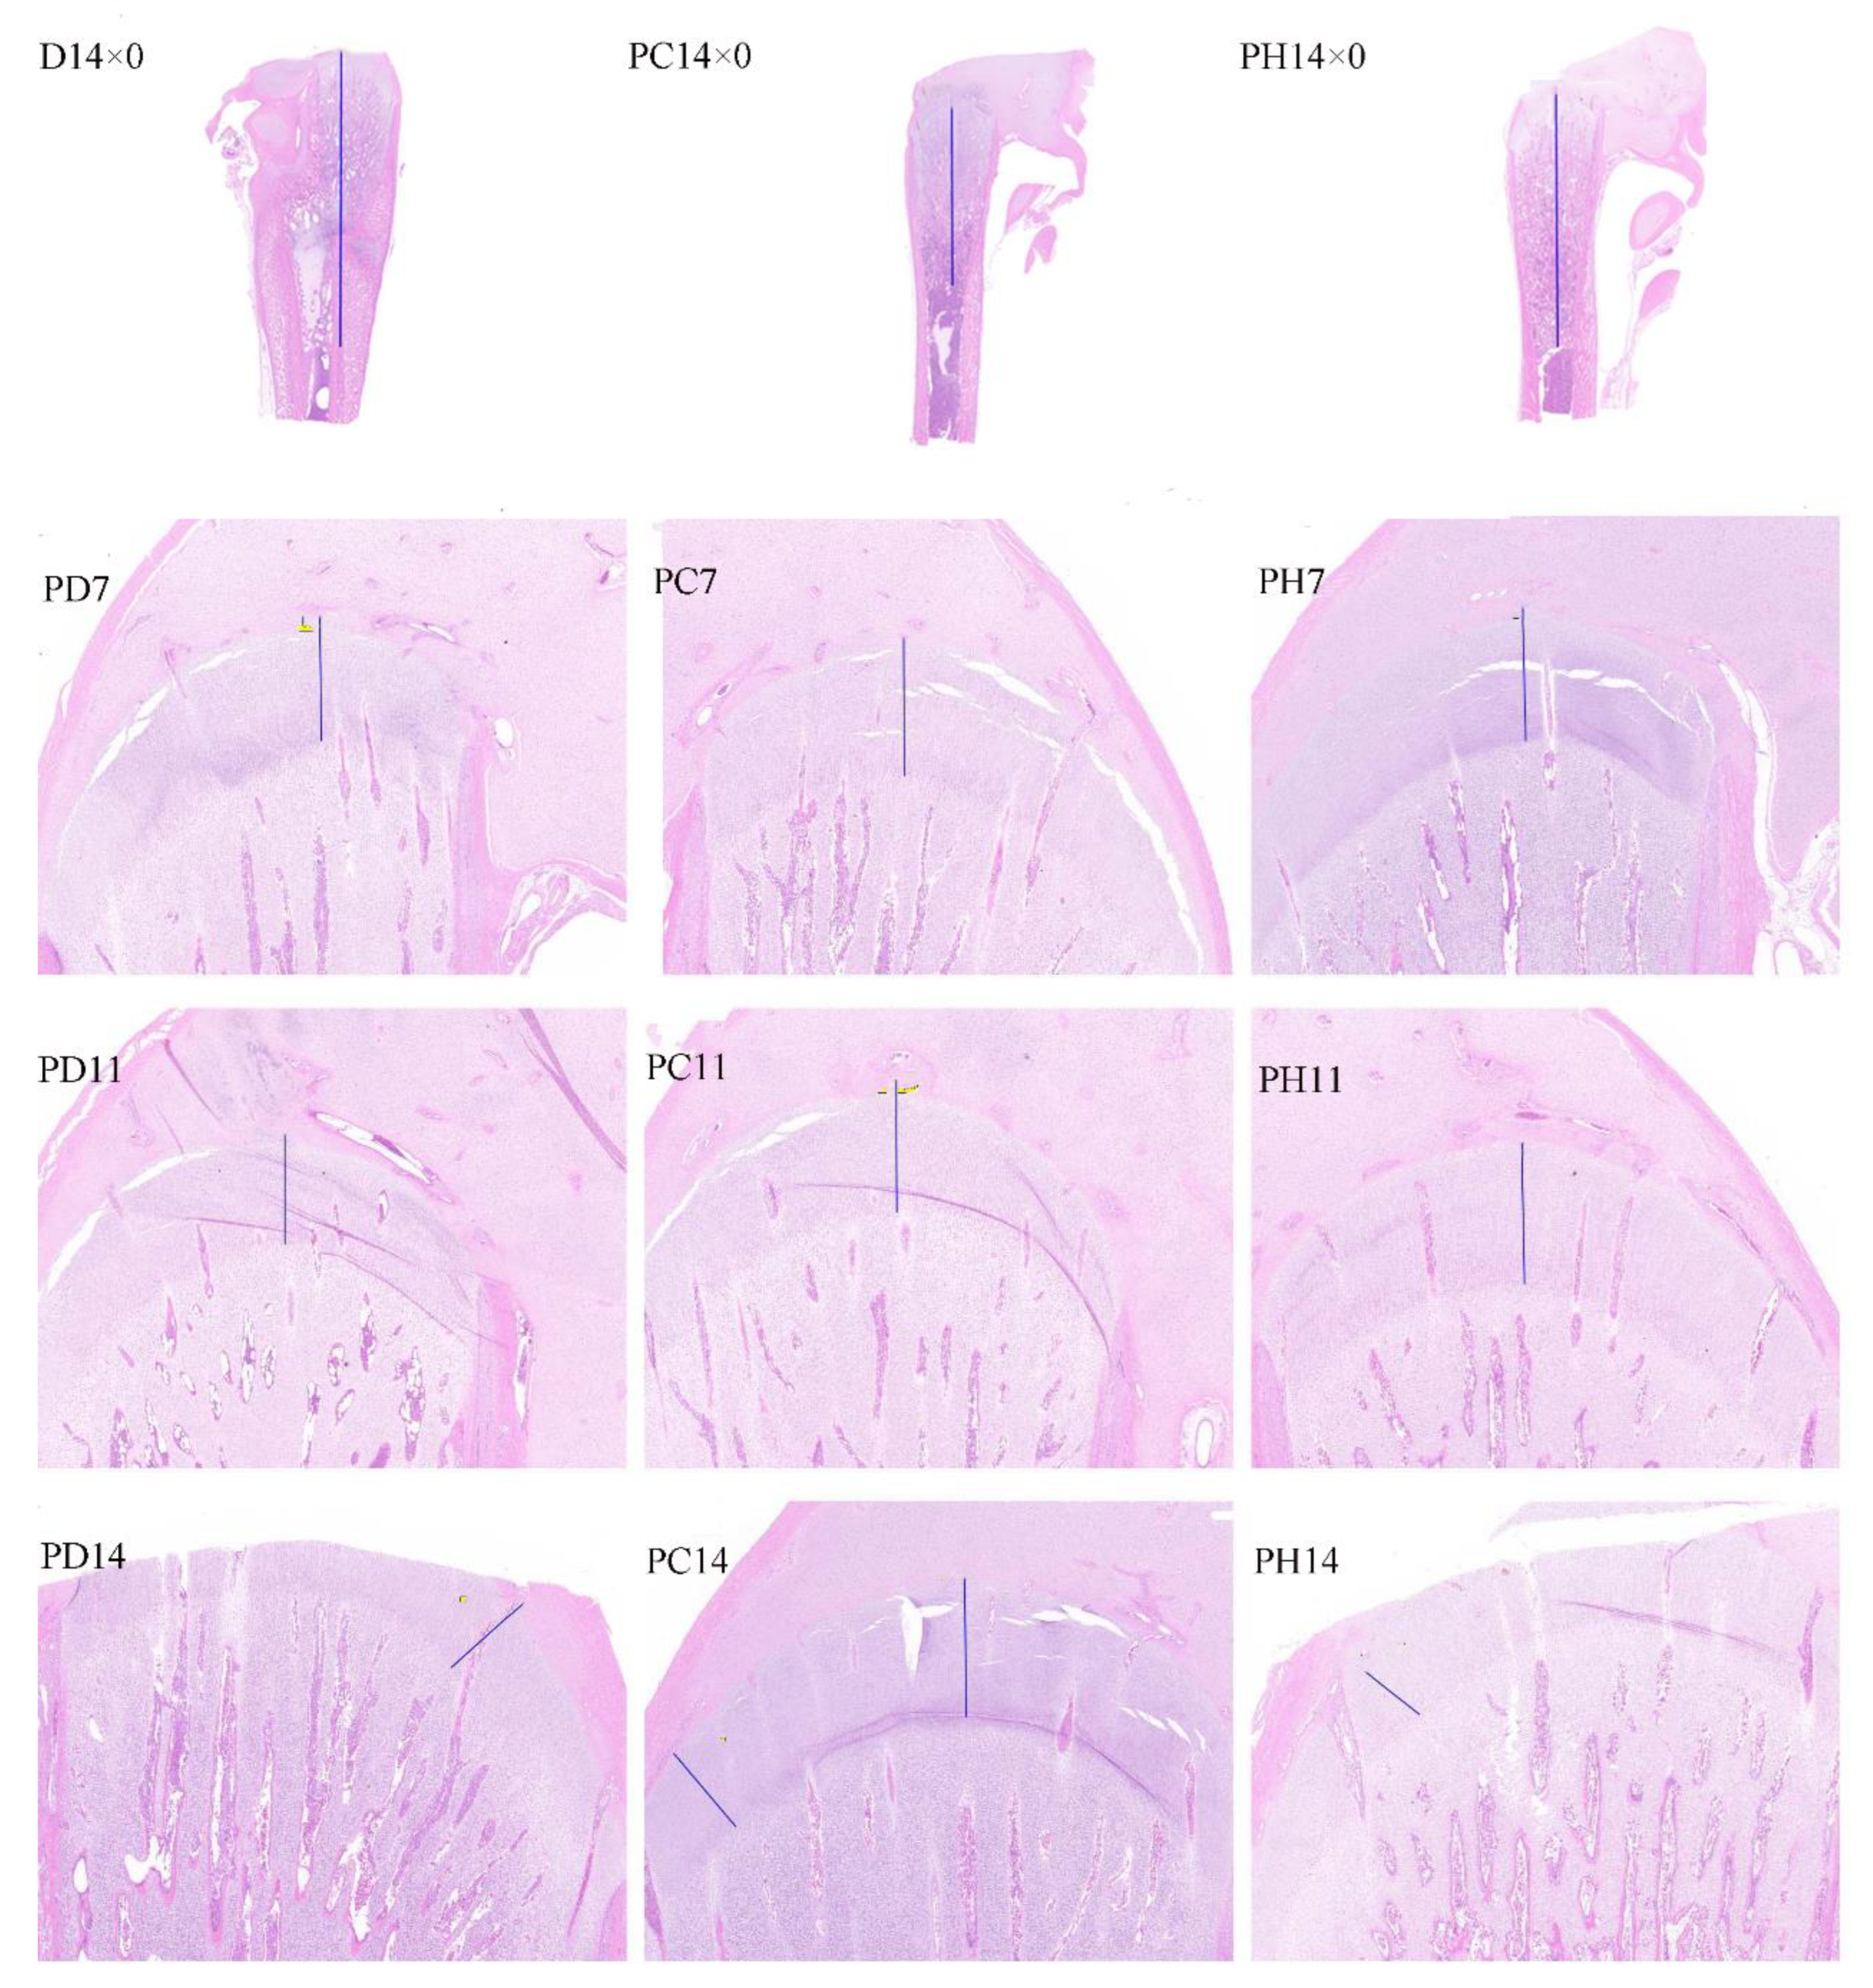
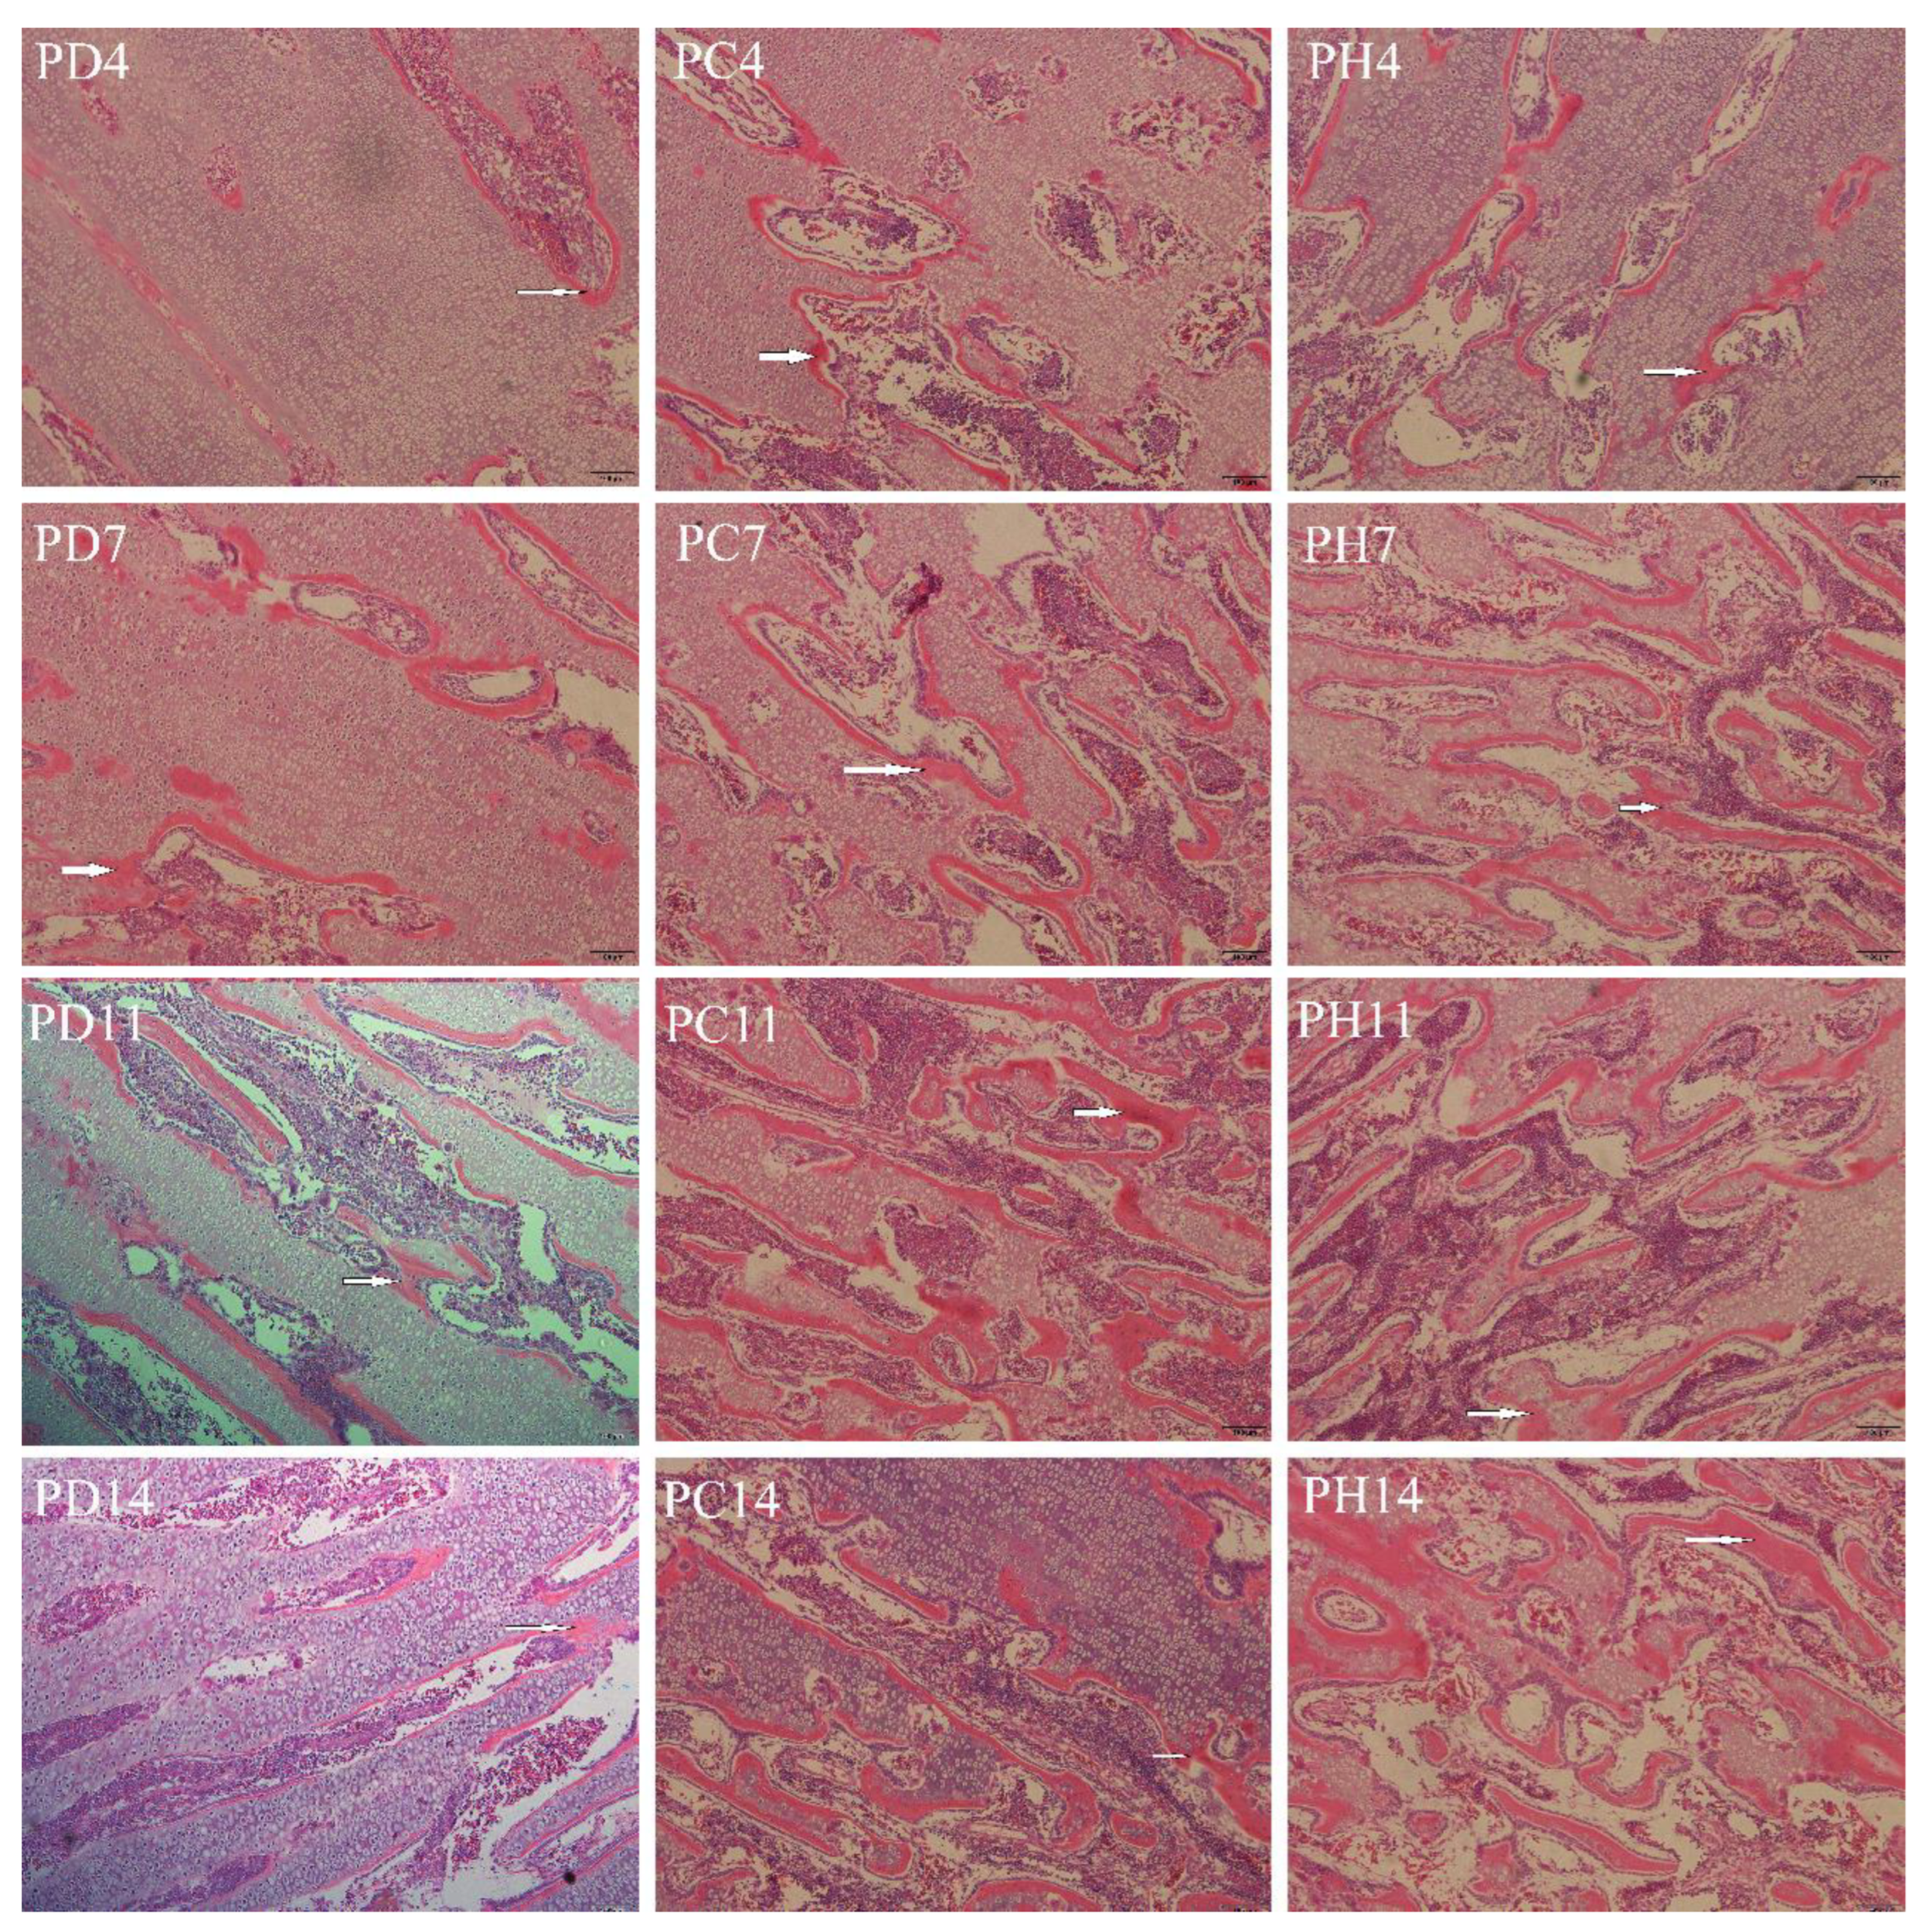
3.4. Tibial Development

Dietary P deficiency caused a reduction (p < 0.05) of the tibia width, length, fresh weight, and strength in goslings (Table 6). The tibia width was reduced on day 14 in the PD group compared with PC and PH (p < 0.05). The tibia length and fresh weight were reduced on days 11 and 14 in the PD group compared with PC and PH (p < 0.05). The tibia strength was decreased on days 4, 7, and 14 in the PD group compared with PC and PH (p < 0.05). The above indicators were not different between groups PC and PH (p > 0.05). The tibia strength, length and fresh weight, and width were less sensitive to P deficiency, in that order.
Dietary P deficiency led to a reduction (p < 0.05) of the tibia ash, P, and Ca contents in goslings (Table 7). As can be seen from Table 7, the tibia ash, P content, and Ca content were reduced on days 4, 7, 11, and 14 in the PD group, compared with PC and PH (p < 0.05), with no difference between groups PC and PH (p > 0.05). Sensitivity to dietary P deficiency decreased in tibia strength, ash content, P and Ca contents > tibia length, and fresh weight > tibia width.

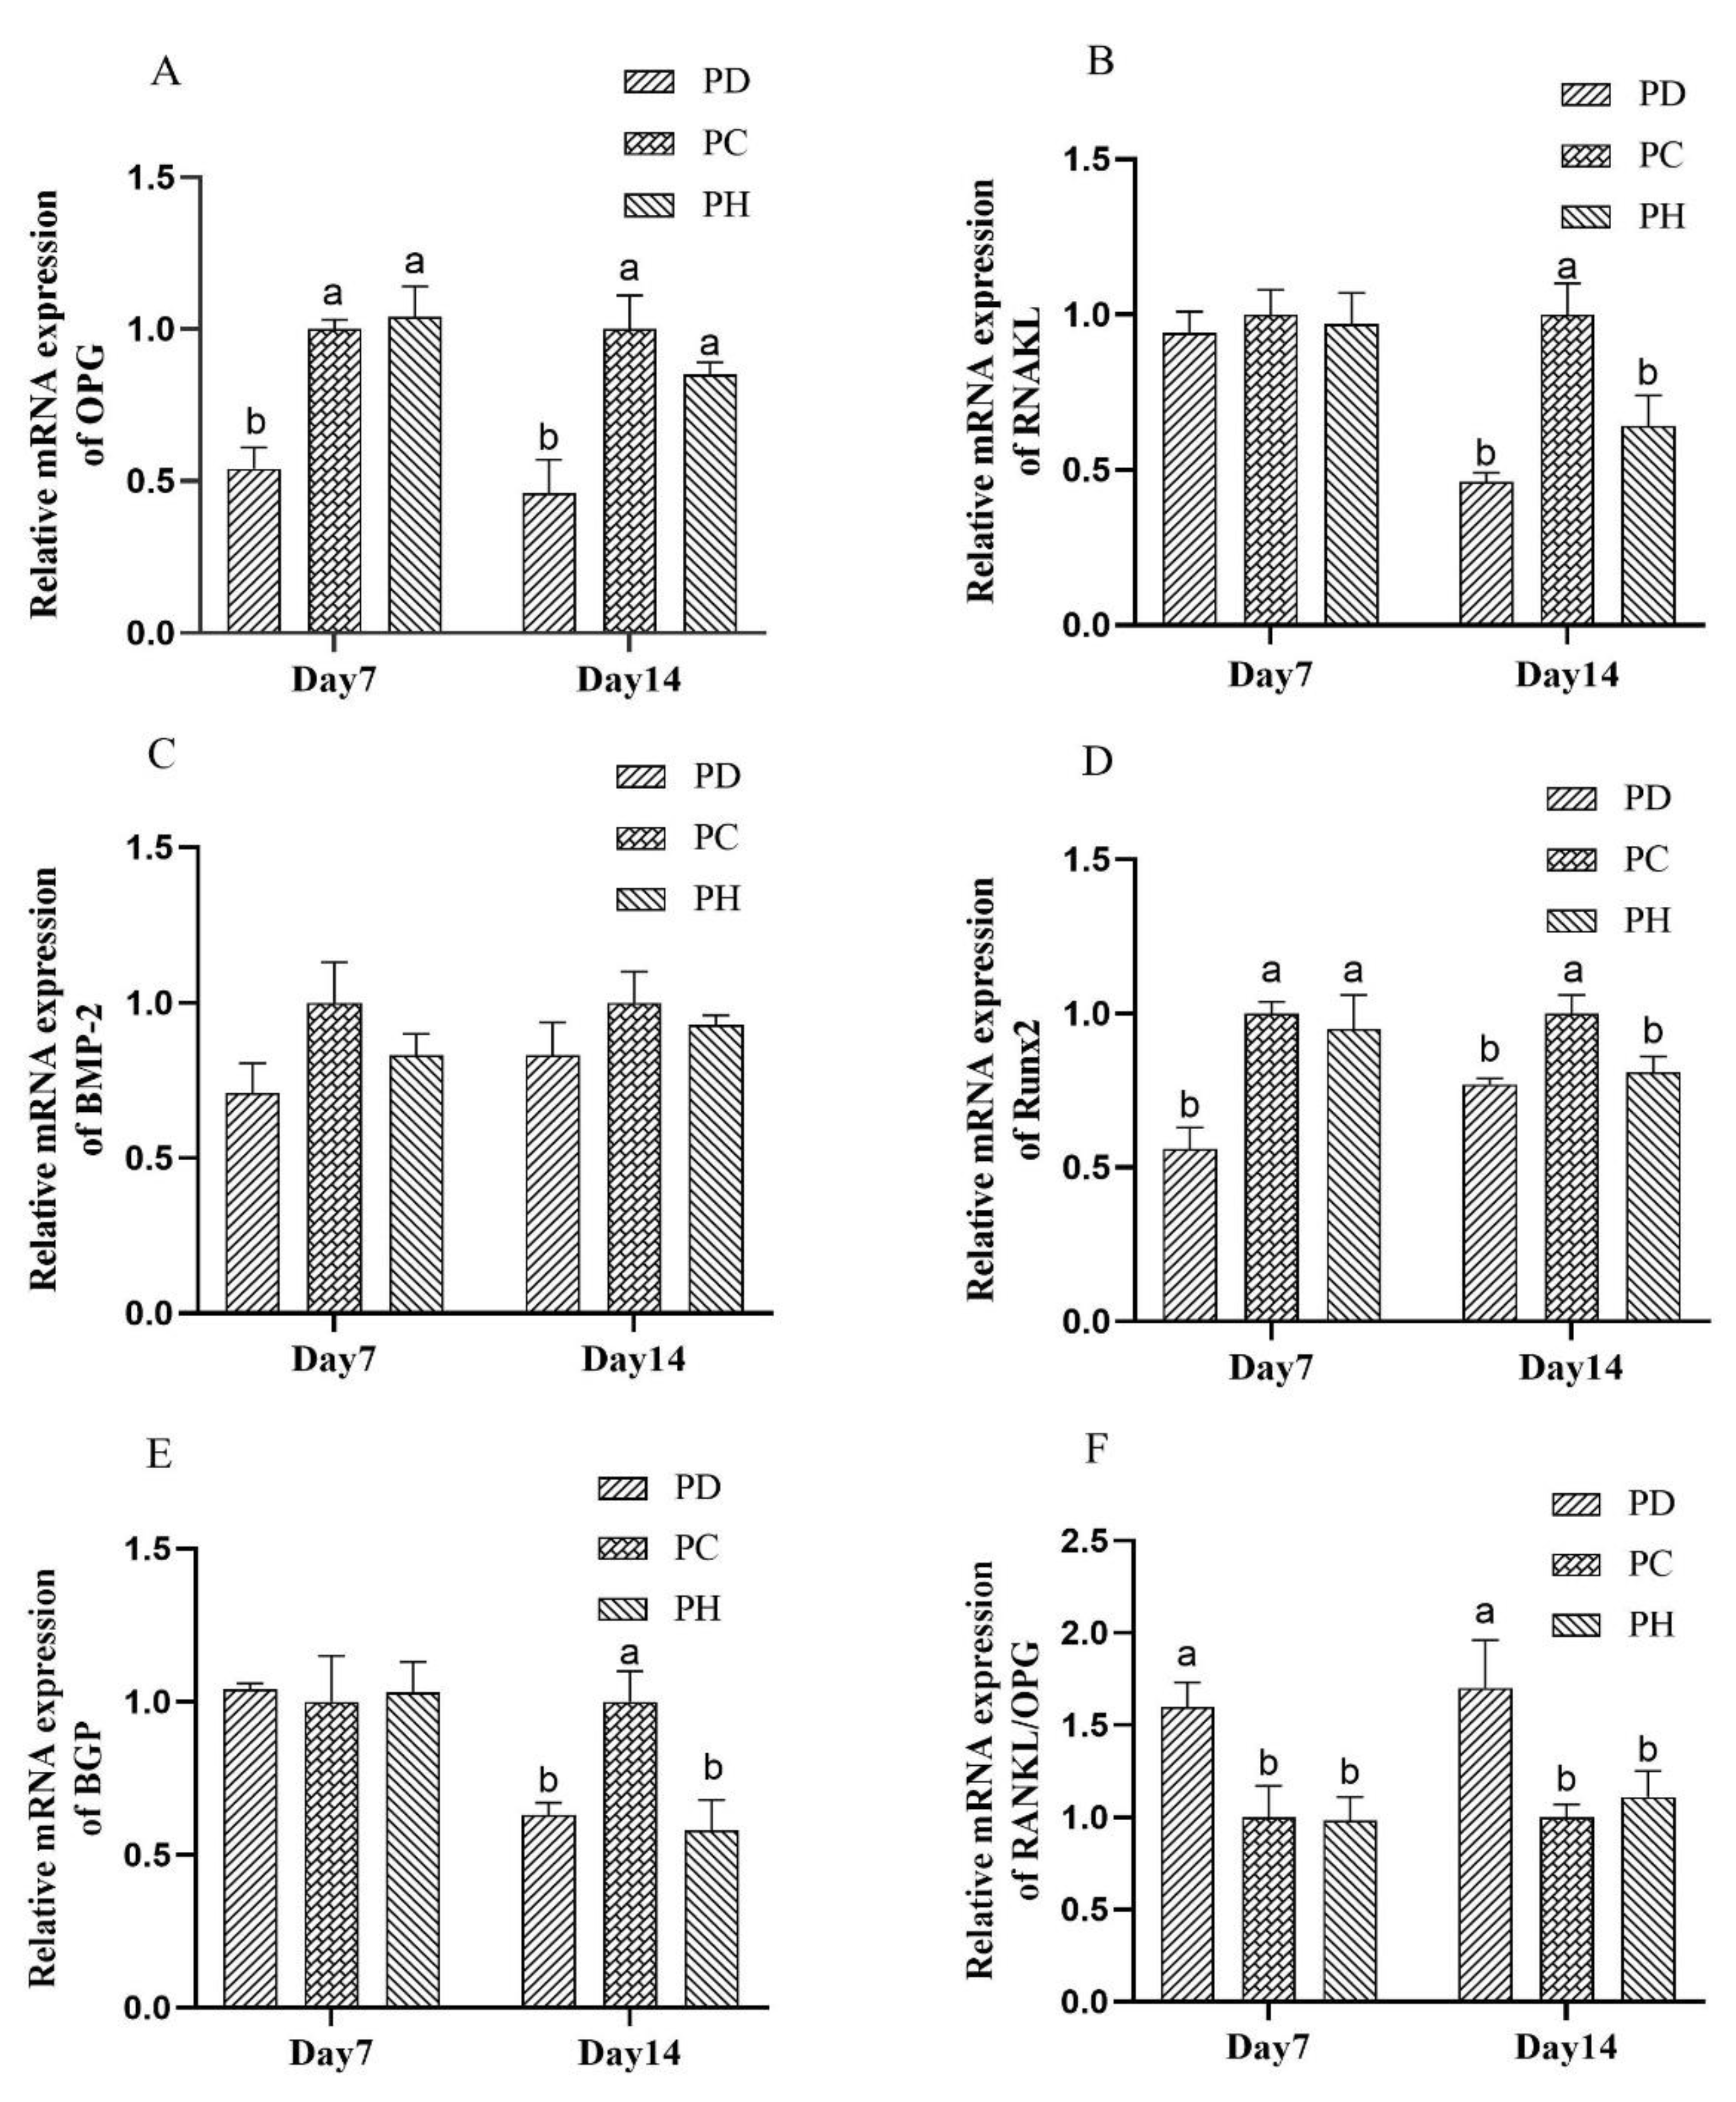
3.5. Gene Expression

Relative mRNA expression of the OPG, RNAKL, Runx2, and BGP were affected by dietary P deficiency and high P content (p < 0.05) (Figure 2). The relative mRNA expression of the OPG and Runx2 were reduced, whereas the RANKL/OPG ratio was increased on days 7 and 14 in the PD group, compared with PC (p < 0.05). The relative mRNA expression of RANKL and BGP was reduced on day 14 in groups PD and PH compared with PC. The relative mRNA expression of RNAKL and BGP was not different among the three groups on day 7 (p > 0.05). The relative mRNA expression of BMP-2 was not different among the three groups on days 7 and 14 (p > 0.05).

4. Discussion

4.1. Growth Performance

P is an essential mineral element in the growth and development of goslings. The BW, ADG, and ADFI of goslings were significantly reduced in the P-deficient group compared with other groups in this experiment. The result was consistent with previous studies where the BW [12,24,25,26], ADG [13,27], and feed intake [25,26] were reduced by a low P content diet. The body weight gain was decreased by 65.9% in broilers fed a dietary NPP of 0.06% compared with 0.44% [25]. The P-deficient group had a high Ca:NPP ratio (10.85) and had the lowest growth performance in our study. The result was consistent with studies which indicated that growth performance was reduced by high Ca:P ratios [8,27,28]. The growth performance was not different between our experiment’s control and the high P group. The data indicated that goslings had a higher tolerance to a high NPP level diet, up to 0.80%. An opposite result was obtained by Li et al. [17], Alagawany et al. [16], and Wang et al. [18], who found that the growth performance of geese fed 0.30%–0.35% NPP was not significantly affected compared with other groups. The result was similar to the results of our previous study, where NPP levels of 0.28% in the diet were sufficient to meet the weight gain of the goslings. Lower levels of dietary P are required for goslings to show signs of P deficiency. Du reported that the growth performance was lower in the high P group compared with the control group [13]. The inconsistency between their and our study may be that the P level in our high P group was not too high (NPP, 0.80% vs. 0.90%). Increased mortality in goslings may be due to P deficiency leading to disturbances in the body’s mineral metabolism and paralysis. Our data indicated that dietary P deficiency negatively affected the growth performance and survival rate of goslings, and goslings had a high tolerance to the diet with a high NPP content of up to 0.80%.

4.2. Serum Variables

The contents of serum Ca, P, CT, BGP, and 1,25-(OH2)D3 are reported to play essential roles in Ca and P metabolism [29,30,31,32]. Maintaining these hormones in a stable range is necessary for bone growth and development. Serum P content was significantly reduced on day 14 in the P-deficient and high P content group. The result was consistent with previous studies where a low P content diet [24,27], and high P content diet [33] reduced the serum P content. The reason that serum P content was not considerably reduced on days 4–11 may be due to the reduction of P deposition in bones to maintain P balance in the serum. The reduced serum P in the P-deficient group on day 14 may be due to insufficient P intake for two weeks. The first adaptive response of birds to dietary P insufficiency is to suppress growth, followed by a higher rate of Ca and P mobilization from the bone, and finally, the blood P level continuing to fall [34]. A different result was obtained by Liu et al. [9] and Rao et al. [24], who found no significant effect of high P diets on serum P levels in goslings. The different results could be explained by the higher NPP content of the rations in this experiment. The exceptional serum P levels in group PH goslings may be due to a disturbance in the body’s Ca and P metabolism caused by the prolonged intake of a low Ca/P ratio and high P content diet. The ALP is a group of isoenzymes widely distributed in the human liver, bones, and intestines. High blood ALP activity may indicate a negative impact on bone development. In the present experiment, serum ALP activity was increased in the P-deficient group since the 7th day. In other studies, serum ALP activity was also increased by low P content diets [12,18,27]. The serum ALP activity was inversely correlated with dietary NPP levels in broilers [13,27]. The higher serum ALP activity in the P-deficient group may reflect poor tibia health in goslings fed with a P-deficient diet.
High serum CT content can inhibit the activity of osteoclasts, weaken the osteolytic process, and reduce blood Ca contents [35]. A low P diet could increase the serum Ca range, but no significant difference was observed among groups [10,36]. The higher serum CT content in the P-deficient and high P content groups was related to the stable serum Ca level among groups from day 7 to day 14. The relationship of serum CT and Ca indicates that the body maintained the serum Ca at a balanced level by an elevated serum CT content in the goslings fed with both low and high dietary P feed from day 7 to day 14. The 1,25-(OH2)D3 promotes osteoclast formation, enhances bone resorption, and facilitates P transferring from the bones to the blood [37]. Serum 1,25-(OH2)D3 content was increased in the P-deficient and a high P group of goslings on day 11 and day 14. Serum 1,25-(OH2)D3 content could promote intestinal absorption of Ca and P, increasing serum P content [38]. The higher level of serum 1,25-(OH2)D3 in P-deficient and high-P groups may explain why serum P was maintained at an equilibrium state during days 4–11 when the Ca:P ratio was changed.
BGP is synthesized and secreted by osteoblasts [19], is essential in bone resorption and remodeling, and is a biochemical indicator of bone metabolism [19] and bone formation [39]. Serum BGP correlates positively with relative osteoid volume and bone formation rate [39], reflecting osteoblast activity [30]. Dietary P deficiency and high P content reduced serum BGP content on day 14 of this experiment. The result was consistent with previous studies where the serum BGP content of cows was decreased by a low P content diet [40]. The present study revealed that a dietary NPP of up to 0.80% might impair the regulation of bone formation in goslings. A dietary NPP of no more than 0.80% is suggested in the starter feed of geese.

4.3. Tibia Characteristics

Bone is the primary organ for the storage of P. In general, the length, weight, strength, ash content, Ca content, and P content of tibias were significantly correlated with dietary P levels in poultry. These indicators were used to assess tibial health and quality [9,27]. Dietary P deficiency reduced tibia length, width, fresh weight, strength, ash content, P content, and Ca content in the present study. This was consistent with previous studies where the tibia length [41], weight [42], tibial ash content [43,44], P content [19,43,44], Ca content [43], and tibia strength [19,20], were reduced by low dietary P content. The P deficiency caused lower bone mineral content (the contents of ash, Ca, and P), perhaps as the result of a decrease in the mineralization of the bone matrix. P deficiency increases bone resorption [45], decreases bone calcification and bone formation [46,47]. Consistent with the above report, the length of the hypertrophic zone was longer in the tibia of the P-deficient goslings. Trabeculae of the tibia of goslings exhibited less mineralized bone levels of P-deficiency. Details of bone mineralization are shown in the Appendix A. The abnormality of the tibial calcification might be partly responsible for the lower tibial length, width, and weight, in goslings fed with a P-deficient diet. In the present study, tibia strength, tibia ash content, tibia Ca content, and tibia P content were significantly reduced in the P-deficient geese, indicating that the onset of rickets in goslings is about four days. This duration of onset of rickets was similar to our previous report [8] in broilers (3 d), but earlier than other studies, which reported the onset duration as 7 d [46,48], 7–10 d [49], and 18 d [46]. The above studies’ differences may be due to different judging criteria and time gaps [7]. Modern poultry production has produced birds with higher growth rates and nutrient requirements, contributing to the more rapid onset of rickets caused by P deficiency [50]. In the present study, the onset time of rickets caused by P-deficient feed was approximately 4 days, as evidenced by lower bone strength, ash content, and P and Ca content in the tibia.
The body adapts to P deficiency through complex biological processes, and different tissues react differently [51]. The tibia width of goslings was significantly reduced on day 14 of P deficiency; the length and fresh weight were markedly decreased on day 11, and contents of ash, P, and Ca were significantly reduced on day 4 in the present study. These results were consistent with previous studies where the adaptive response of the chick to dietary P insufficiency was to retard growth [11,24,34]. In addition, our study supplied evidence that P deficiency could affect the development of rickets as early as the fourth day in goslings. In agreement with this finding, our team observed that the onset of P-deficient rickets was approximately three days in broilers fed a high Ca:P ratio feed [8]. However, the sensitivity of different tissue components to P deficiency was found to vary in this experiment. The sensitivity of tibia variables to dietary P deficiency decreases in the order of tibia strength ≈, tibia ash content ≈, tibia P content ≈, tibia Ca content > tibia length, and fresh tibia weight > tibia width.

4.4. Gene Expression

The tibial cartilage is critical for bone growth and development [52]. The BGP is a marker of osteoblast differentiation maturation and an essential factor in bone calcification [35]. Dietary P deficiency reduced the relative expression of BGP mRNA in tibia cartilage in the current study. In addition, the lower mRNA expression of BGP was consistent with the trend of lower serum BGP contents and lower tibia quality in the P-deficient group. Similarly, BGP mRNA levels were positively correlated with the mean bone formation and mineral apposition rates [52,53]. BGP functions in bone resorption and remodeling [35] and affects bone formation [36]. Thus, lower BGP mRNA levels in tibial cartilage may partly explain why P deficiency leads to poor tibia quality.
Runx2 is a downstream target of BMP signaling and a key transcription factor in controlling osteoblast differentiation [20]. Runx2 controls tibia development and calcification by regulating the differentiation of chondrocytes and osteoblasts and the expression of many extracellular matrix proteins [54,55]. Dietary P deficiency reduced the relative expression of Runx2 mRNA in tibia cartilage on days 7 and 14 in our study. The poor tibia mineralization and development were consistent with the lower Runx2 gene expression in the P-deficient group. Fracture healing might be promoted through the upregulation of BMP-2 and Runx2 gene expression in bones [56]. The Runx2 mRNA levels were positively correlated with the mean bone formation and mineral apposition rates [57]. The upregulation of Runx2 expression promotes osteoblast differentiation, bone development, and bone calcification [57]. The lower mRNA expression of Runx2 is possibly one reason for the poor tibia quality induced by a P-deficient diet in 1- to 14-day-old goslings in the present study.
OPG, RANKL, and RANK regulate the osteoblast’s differentiation, activation, and function [57], and OPG is a secreted protein that inhibits osteoclast formation [58]. Dietary NPP deficiency reduced the relative expression of OPG mRNA in the tibia cartilage on days 7 and 14 in the present study. A low relative expression of OPG mRNA promotes osteoclast differentiation and activation and inhibits osteoclastic apoptosis [59]. The biological effectiveness of RANKL is mainly dependent on the RANKL/OPG ratio [60]. The RANKL/OPG ratio is an essential indicator of tibia development and integrity [60]. Dietary NPP deficiency increased our study’s RANKL/OPG ratio of mRNA expression. Agreeing with the RANKL/OPG ratio change, the tibia quality was reduced in P-deficient goslings. The reason may be that a high RANKL/OPG ratio supports osteoclast genesis, negatively affecting bone development and integrity [61]. The RANKL/OPG ratio was significantly increased in patients suffering from severe osteolysis compared with the control group [62]. It was considerably higher in patients with low BMD compared with those with normal and normal controls [63]. The data of our study demonstrated that the down-regulation of mRNA expression in OPG and RANKL, together with a higher RANKL/OPG ratio, may be some reasons why dietary P deficiency harms tibia growth and calcification in goslings.

4.5. Overall Discussion

Dietary P deficiency reduced BW, feed intake [24,25,26], and daily P intake. Inadequate P intake directly affected bone calcification and reduced bone quality [42,43], development [40], and serum P contents [24,27]. The P in bones and blood can be transferred to each other [64], which ensures that goslings can resist the harmful effects of P deficiency for a short period. As the duration of P deficiency increases, the body undergoes a series of changes. The P deficiency affects normal tibia calcification and is reflected by serum ALP activity [12]. The P deficiency decreases serum BGP content and BGP gene expression in tibial cartilage, affecting bone development and calcification. Decreased relative expression of OPG and Runx2 genes in tibial cartilage inhibits osteoclast formation and differentiation and promotes osteoclast differentiation and activation [58,59]. Increased OPG/RANKL ratio in tibial cartilage reduces bone mass and tibia integrity and promotes osteoclast differentiation and activation [60]. In the present experiment, the organism ensured a stable serum P level by slowing down bone growth and calcification and regulating other serum variables at the initial stage of the P deficiency. However, as the P deficiency duration increased, serum variables and bone quality were negatively affected, further reducing the growth performance of goslings.
The high P dietary content had neither a negative impact on BW, serum P, and BGP contents, nor on the tibia’s length, weight, ash content, P content, and Ca content. The results indicated that goslings have a high tolerance to high NPP diets up to 0.80% of the feed. However, the high P dietary content significantly impacted serum BGP, CT, and 1,25-(OH2)D3 contents, and the relative mRNA expression of RNAKL, Runx2, and BGP in tibial cartilage on day 14, and had no difference compared with the P-deficient group. Data demonstrated that a dietary NPP level of 0.80% is close to excess for goslings from 1 to 14 days old. Thus, it is suggested that a dietary NPP level should not exceed 0.80% when the Ca content is 0.80%, with an approximate Ca:NPP ratio of 1:1 in the goslings’ feed at this time.

5. Conclusions

In conclusion, dietary P deficiency reduced growth performance, tibia calcification, and tibia growth in goslings. Goslings have a high tolerance to a high NPP level diet (0.80%). A P-deficient diet caused acute rickets as early as the fourth day, as evidenced by lower bone strength, ash content, and P and Ca content in the tibia. The sensitivity of tibia variables to dietary P deficiency decreases in the order of strength ≈ ash content ≈ P content, ≈ Ca content > length, and fresh weight > width. Dietary P deficiency reduced the tibia and body growth rates, which may be partly explained via poor tibia calcification caused by a down-expression of osteogenesis-related genes induced by increased serum ALP activity and calcitonin contents and decreased serum BGP and P contents.

Author Contributions

Data collection, animal trials, N.L., J.H., and H.C.; writing—original draft preparation, N.L. and L.C.; data analysis, N.L. and Y.C.; writing—review and editing, L.C., L.X. and Z.W.; funding acquisition, L.X., H.Y. and Z.W. All authors have read and agreed to the published version of the manuscript.

Funding

This work was financially supported by the earmarked fund for the China Agriculture Research System (CARS-42-11); the Jiangsu Agricultural Industry Technology System (JATS [2022]496); the National Natural Science Foundation of China (32102680); and the Basic Research Program of Jiangsu Province (Natural Science Foundation) (BK20200931).

Institutional Review Board Statement

The procedures in this paper were approved by the Institutional Animal Care and Use Committee of Yangzhou University (ethical protocol code: YZUDWSY 202103009) and conducted according to the relevant animal welfare regulations.

Informed Consent Statement

Not applicable.

Data Availability Statement

Data are available on reasonable request from the corresponding author.

Conflicts of Interest

The authors declare no conflict of interest.

Appendix A

Two figures are appended to show the visible changes in the tibia. Figure A1: The effect of dietary phosphorus (P) deficiency and high P content on the morphology of tibia in goslings. Figure A2: The effect of dietary phosphorus (P) deficiency and high P content on the morphology of tibia in goslings.
Figure A1. The effect of dietary phosphorus (P) deficiency and high P content on the morphology of tibia in goslings. 1 The goslings were fed, respectively, with a P deficiency (PD) diet, a control (PC) diet, and a high P content diet (PH). Samples were treated with H.E. staining. Numbers 4, 7, 11, and 14, respectively, refer to the accumulated days after feeding the above feeds by goslings; ×0, magnification × 0; other pictures, magnification ×2. Blue lines mark the length of the proliferative zone. Dietary P deficiency negatively affected the tibia development in goslings. The length of proliferative zones was reduced on days 7, 11, and 14 in the PD group, compared with PC and PH. The length of the hypertrophic zone was increased on day 14 in the PD group, compared with PC and PH.
Agriculture 12 01908 g0a1
Figure A2. The effect of dietary phosphorus (P) deficiency and high P content on tibia morphology in goslings (×100). 1 The goslings were fed, respectively, with a P deficiency (PD) diet, a control (PC) diet, and a high P content diet (PH). Samples were treated with H.E. staining. Numbers 4, 7, 11, and 14, respectively, refer to the accumulated days after feeding the above feeds by goslings; ×100, magnification ×100. White arrows mark the calcification of the bone matrix (bright red). Dietary P deficiency negatively affected the tibia calcification in goslings. Trabeculae of the tibia of goslings exhibited less mineralized bone levels in the PD group. The goslings in the PC and PH groups had a similar degree of tibia calcification and length of proliferative zones.
Agriculture 12 01908 g0a2

References

  1. Calvo, M.S.; Lamberg-allardt, C.J. Phosphorus. Adv. Nutr. 2015, 6, 860–862. [Google Scholar] [PubMed] [Green Version]
  2. Khoshniat, S.; Bourgine, A.; Julien, M.; Weiss, P.; Beck, L. The emergence of phosphate as a specific signaling molecule in bone and other cell types in mammals. Cell. Mol. Life. Sci. 2011, 68, 205–218. [Google Scholar] [PubMed]
  3. Eeckhout, W.; Paepe, M.D. Total phosphorus, phytate-phosphorus and phytase activity in plant feedstuffs. Anil. Feed. Sci. Tech. 1994, 47, 19–29. [Google Scholar]
  4. Walk, C.L.; Santos, T.T.; Bedfor, M.R. Influence of superdoses of a novel microbial phytase on growth performance, tibia ash, and gizzard phytate and inositol in young broilers. Poul. Sci. 2014, 93, 1172–1177. [Google Scholar]
  5. Jing, M.; Zhao, S.; Rogiewicz, A.; Slominski, B.A.; House, J.D. Effects of phytase supplementation on production performance, egg and bone quality, plasma biochemistry and mineral excretion of layers fed varying levels of phosphorus. Animal 2021, 15, 100010. [Google Scholar] [PubMed]
  6. Imel, E.A.; Carpenter, T.O. Rickets: The Skeletal Disorders of Impaired Calcium or Phosphate Availability. In Pediatric Endocrinology; Humana Press: Totowa, NJ, USA, 2013; pp. 357–378. [Google Scholar]
  7. Ansar, M.; Khan, S.A.; Chaudhary, Z.I.; Mian, N.A.; Tipu, M.Y.; Rai, M.F. Effects of high dietary calcium and low phosphorus on urinary system of broiler chicks. Pak. Vet. J. 2004, 24, 113–116. [Google Scholar]
  8. Xu, L.; Li, N.; Farnell, Y.Z.; Wan, X.L.; Yang, H.M.; Zhong, X.Q.; Farnell, M.B. Effect of feeding a high calcium: Phosphorus ratio, phosphorous deficient diet on hypophosphatemic rickets onset in broilers. Agriculture 2021, 11, 1–13. [Google Scholar]
  9. Liu, S.B.; Liao, X.D.; Lu, L.; Li, S.F.; Luo, X.G. Dietary non-phytate phosphorus requirement of broilers fed a conventional corn-soybean meal diet from 1 to 21 d of age. Poult Sci. 2017, 96, 151–159. [Google Scholar]
  10. Rutherfurd, S.M.; Chung, T.K.; Morel, P.C.; Moughan, P.J. Effect of microbial phytase on ileal digestibility of phytate phosphorus, total phosphorus, and amino acids in a low-phosphorus diet for broilers. Poult Sci. 2004, 83, 61–68. [Google Scholar]
  11. Leytem, A.B.; Willing, B.P.; Thacker, P.A. Phytate utilisation and phosphorus excretion by broiler chickens fed diets containing cereal grains varying in phytate and phytase content. Anim. Feed Sci. Tech. 2008, 146, 160–168. [Google Scholar]
  12. Du, G.B.; Wang, Y.B.; Jiang, B.L. Effects of dietary high non-phytate phosphorus level on growth performance, tibia bone composition and metabolism of calcium and phosphorus of geese. China Feed. 2018, 23, 891–897. [Google Scholar]
  13. Li, N.; Chen, Y.J.; Xu, L.; Su, G.Q.; Wang, Z.Y.; Yang, H.M. Requirement of non-phytate phosphorus in 1- to 28-day-old geese based on growth performance, serum variables, and bone characteristics. Agriculture 2022, 12, 479. [Google Scholar]
  14. Zhu, Y.W.; Wang, C.Y.; Wen, J.; Wang, W.C.; Yang, L. Effect of dietary high non–phytate phosphorus level on growth performance and metabolism of calcium and phosphorus in Lion–head geese. Animal 2018, 236, 115–121. [Google Scholar] [CrossRef]
  15. Baker, D.H.; Oduho, G.W. Manganese utilisation in the chick: Effects of excess phosphorus on chicks fed manganese-deficient diets. Poul. Sci. 1994, 73, 1162–1165. [Google Scholar]
  16. Alagawany, M.; Ashour, E.A.; El–Kholy, M.S.; Mohamed, L.A.; El–Hack, M.E.A. Effect of dietary calcium and phosphorus levels on growth, carcass characteristics and liver and kidney functions of growing Egyptian geese. Poult. Sci. 2021, 100, 101244. [Google Scholar] [PubMed]
  17. Li, W.L.; Wang, B.W.; Liu, G.L.; Lin, Y.T. Effects of different levels of calcium and phosphorus on the production and biochemistry indexes of plasma and tibia in young Wulong geese. J. Anhui Agri. Uni. 2005, 32, 283–288. [Google Scholar]
  18. Wang, Z.W.; Mou, X.L.; Yang, G.W.; Li, J.K.; Liu, D.S. Effect of dietary nutrient levels on growth performance and serum parameters for northeast geese (1–28 d). J. Nucl. Agri. Sci. 2009, 23, 891–897. [Google Scholar]
  19. Chopin, F.; Biver, E.; Funck-Brentano, T.; Bouvard, B.; Coillaume, G.; Garnero, P.; Thomas, T. Prognostic interest of bone turnover markers in the management of postmenopausal osteoporosis. Jt. Bone Spine 2012, 79, 26–31. [Google Scholar]
  20. Komori, T. Regulation of osteoblast differentiation by transcription factors. J. Cell. Biochem. 2006, 99, 1233–1239. [Google Scholar]
  21. Khosla, S. Minireview, The opg/rankl/rank system. Endocrinology 2001, 142, 5050–5055. [Google Scholar] [CrossRef]
  22. Wang, Z.Y.; Yang, H.M.; Lu, J.; Li, W.Z.; Zou, J.M. Influence of whole hulled rice and rice husk feeding on the performance, carcass yield and digestive tract development of geese. Anim. Feed Sci. Tech. 2014, 194, 99–105. [Google Scholar]
  23. Chen, Y.J.; Yang, H.M.; Wan, X.L.; Wan, Y.; Zhang, H.; Wang, Z.Y. The effect of different dietary levels of sodium and chloride on performance and blood parameters in goslings (1–28 days of age). J. Anim. Physiol. Anim. Nutr. 2020, 104, 507–516. [Google Scholar]
  24. Rao, S.V.R.; Reddy, V.R.; Reddy, V.R. Non-phytin phosphorus requirements of commercial broilers and white leghorn layers. Anim. Feed Sci. Tech. 1999, 80, 1–10. [Google Scholar]
  25. Hu, Y.X.; Liao, X.D.; Wen, Q.; Lu, L.; Zhang, L.Y.; Luo, X.G. Phosphorus absorption and gene expression levels of related transporters in the small intestine of broilers. Brit. J. Nut. 2018, 119, 1346–1354. [Google Scholar]
  26. Cozannet, P.; Davin, R.; Jlali, M.; Jachacz, J.; Preynat, A.; Molist, F. Dietary metabolisable energy, digestible lysine, available phosphorus levels and exogenous enzymes affect broiler chicken performance. Animal 2021, 15, 100206. [Google Scholar] [CrossRef]
  27. Baradaran, N.; Shahir, M.H.; Asadi Kermani, Z.; Waldroup, P.W.; Sirjani, M.A. Effects of high non-phytate phosphorus starter diet on subsequent growth performance and carcass characteristics of broiler chickens. J. Anim. Physiol. Anim. Nutr. 2014, 98, 643–650. [Google Scholar] [CrossRef]
  28. Yan, J.H.; Kerse, P.W.; Waldroup, P.W. Phosphorus requirements of broiler chicks to six weeks of age as influenced by phytase supplementation. Poult. Sci. 2001, 80, 455–459. [Google Scholar]
  29. Delmez, J.A.; Tindira, C.; Grooms, P.; Dusso, A.; windus, D.W.; Slatopolsky, E. Parathyroid hormone suppression by intravenous 1,25-dihydroxy vitamin D. A role for increased sensitivity to calcium. J. Clin. Invest. 1989, 83, 1349–1355. [Google Scholar] [CrossRef]
  30. Almaden, Y.; Hernandez, A.; Torregros, V.; Canalejo, A.; Sabate, L.; Fernandez Cruz, L.; Campistol, J.M.; Torres, A.; Rodriguez, M. High phosphate level directly stimulates parathyroid hormone secretion and synthesis by human parathyroid tissue in vitro. J. Am. Soc. Nephrolo. 1998, 9, 1845–1852. [Google Scholar] [CrossRef]
  31. Kemi, V.E.; Karkkainen, M.U.M.; Rita, H.J.; Laaksonen, M.M.L.; Outial, T.A.; Lamberg-Allardt, C.J.E. Low calcium: Phosphorus ratio in habitual diets affects serum parathyroid hormone concentration and calcium metabolism in healthy women with adequate calcium intake. Brit. J. Nutr. 2010, 103, 561–568. [Google Scholar] [CrossRef] [Green Version]
  32. Palmer, S.C.; Hayen, A.; Macaskill, P.; Pellegrini, F.; Craig, J.C.; Elder, G.L.; Stippoli, G.F.M. Serum levels of phosphorus, parathyroid hormone, and calcium and risks of death and cardiovascular disease in individuals with chronic kidney disease: A systematic review and meta–analysis. JAMA J. Am. Med. Assoc. 2011, 305, 1119–1127. [Google Scholar] [CrossRef] [PubMed]
  33. Wang, Z.W.; Mou, X.L.; Yang, G.W.; Li, J.K.; Liu, D.S. Effects of dietary nutritional levels on calcium, phosphorus concentrations and ALK activity in serum and calcium, phosphorus contents in tibia for geese. China Poult. 2009, 31, 16–20. [Google Scholar]
  34. Sommerville, B.A.; Blahos, J.; Harvey, S.; Chadwick, A.; Spencer, G.S.G. The time sequence of adaptive changes to dietary phosphorus deficiency in the chick. Horm. Metab. Res. 1985, 17, 247–250. [Google Scholar] [PubMed]
  35. Zhang, M.M.; Zhang, Y.H.; Mao, W.X.; Ma, Q.Q.; Gao, Y.; Liu, Y.; Liang, B.B. Correlation between BMD and TRACP, CTX-1, BALP, BGP, calcium, and phosphorus in 1084 women. Chin. J. Osteoporos. 2013, 19, 902–906. [Google Scholar]
  36. Namini, B.B.; Nezhad, Y.E.; Sarikhan, M.; Ahmadzadeh, A.R.; Hosseinzadeh, M.H.; Gholizadeh, B. Effects of dietary available phosphorus and microbial phytase on growth performance, carcass traits, serum minerals and toe ash content in broiler chicks. Int. J. Agric. Biol. 2012, 14, 435–439. [Google Scholar]
  37. Liu, P.; Oyajobi, B.O.; Russell, R.G.G.; Scutt, A. Regulation of osteogenic differentiation of human bone marrow stromal cells: Interaction between transforming growth factor-β and 1, 25 (OH)2 vitamin D3 in vitro. Calcif. Tissue Intl. 1999, 65, 173–180. [Google Scholar]
  38. Kumar, R. Metabolism of 1, 25-dihydroxyvitamin D3. Physiol. Rev. 1984, 64, 478–504. [Google Scholar]
  39. Brown, J.P.; Malaval, L.; Chapuy, M.C.; Delmas, P.D.; Edouard, C.; Meunier, P.J. Serum bone Gla-protein: A specific marker for bone formation in postmenopausal osteoporosis. Lancet 1984, 32, 1091–1093. [Google Scholar]
  40. Ekelund, A.; Spörndly, R.; Holtenius, K. Influence of low phosphorus intake during early lactation on apparent digestibility of phosphorus and bone metabolism in dairy cows. Livest Sci. 2006, 99, 227–236. [Google Scholar] [CrossRef]
  41. Qian, H.; Veit, H.P.; Kornegay, E.T.; Ravindran, V.; Denbow, D.M. Effects of supplemental phytase and phosphorus on histological and other tibial bone characteristics and performances of broilers fed semi-purified diets. Poul. Sci. 1996, 75, 618–626. [Google Scholar]
  42. Mohammed, A.; Gibney, M.J.; Taylor, T.G. The effects of dietary levels of inorganic phosphorus, calcium and cholecalciferol on the digestibility of phytate-P by the chick. Brit. J. Nutr. 1991, 66, 251–259. [Google Scholar] [CrossRef] [PubMed]
  43. Jiang, S.; Jiang, Z.; Zhou, G.; Chen, Z.; Li, D. Non–phytate phosphorus requirements and efficacy of a genetically engineered yeast phytase in male Lingnan Yellow broilers from 1 to 21 days of age. J. Anim. Physiol. Anim. Nutr. 2011, 95, 47–55. [Google Scholar] [CrossRef] [PubMed]
  44. Li, T.T.; Xing, G.Z.; Shao, Y.X.; Zhang, L.Y.; Li, S.F.; Lu, L.; Liu, Z.P.; Liao, X.D.; Luo, X.G. Dietary calcium or phosphorus deficiency impairs the bone development by regulating related calcium or phosphorus metabolic utilisation parameters of broilers. Poult. Sci. 2020, 99, 3207–3214. [Google Scholar] [CrossRef] [PubMed]
  45. Roy, P.K.; Witten, P.E.; Hall, B.K.; Lall, S.P. Effects of dietary phosphorus on bone growth and mineralisation of vertebrae in haddock (Melanogrammus aeglefinus L.). Fish. Physiol. Biochem. 2002, 27, 35–48. [Google Scholar] [CrossRef]
  46. Dinev, I. Comparative pathomorphological study of rickets types in broiler chickens. Iran. J. Vet. Sci. Technol. 2011, 3, 1–10. [Google Scholar]
  47. Long, P.H.; Lee, S.R.; Rowland, G.N.; Britton, W.M.A. Experimental rickets in broilers: Gross, microscopic, and radiographic lesions. I. Phosphorus deficiency and calcium excess. Avian Dis. 1984, 28, 460–474. [Google Scholar] [PubMed]
  48. Shao, Y.; Xing, G.; Zhang, L.; Li, L.; Li, S.; Liao, X.; Luo, X. Effects of Dietary Calcium and Phosphorus Deficiency on Growth Performance, Rickets Incidence characters and tibia histological structure of broilers during 1 to 21 days of age. Chin. J. Anim. Nutr. 2019, 31, 2107–2118. [Google Scholar]
  49. Zhu, L.Q.; Zhu, F.H.; Zhang, Z.M.; Wang, Q.J.; Gong, Q.J. Effect of dietary available phosphorus levels on growth and tissue phosphorous and calcium contents in chicks. Chin. J. Anim. Nutr. 2001, 37, 14–16. [Google Scholar]
  50. Zhang, L.H.; He, T.F.; Hu, J.X.; Li, M.; Piao, X.S. Effects of normal and low calcium and phosphorus levels and 25-hydroxycholecalciferol supplementation on performance, serum antioxidant status, meat quality, and bone properties of broilers. Poult. Sci. 2020, 99, 5663–5672. [Google Scholar] [CrossRef]
  51. Xu, W.F.; Shi, W.M.; Yan, F. Temporal and tissue-specific expression of tomato 14-3-3 gene family in response to phosphorus deficiency. Pedosphere 2012, 22, 735–745. [Google Scholar] [CrossRef]
  52. Turner, R.T.; Kapelner, S.N.; Spelsberg, T.C. Tissue-specific expression of bone proteins in femora of growing rats. Am. J. Physiol.-Endoc. M. 1992, 263, 724–729. [Google Scholar] [CrossRef] [PubMed]
  53. Dohi, Y.; Ohgushi, H.; Tabata, S.; Yoshikawa, T.; Dohi, K.; Moriyama, T. Osteogenesis associated with bone Gla protein gene expression in diffusion chambers by bone marrow cells with demineralised bone matrix. J. Bone. Miner. Res. 1992, 7, 1173–1180. [Google Scholar]
  54. Komori, T. Regulation of bone development and extracellular matrix protein genes by RUNX2. Cell. Tissue Res. 2010, 339, 189–195. [Google Scholar] [PubMed] [Green Version]
  55. Stricker, S.; Fundele, M.R.; Vortkamp, A.; Mundlos, S. Role of Runx genes in chondrocyte differentiation. Dev. Biol. 2002, 245, 95–108. [Google Scholar] [CrossRef] [Green Version]
  56. Sun, Z.Z.; Wan, H.T.; Yang, J.H.; Li, Y.U.; Shen, M.L.; Yu, H.E. Effect and mechanism of guhong injection promoting fracture healing in rats. Chin. Pharm. J. 2018, 53, 1734–1741. [Google Scholar]
  57. Ducy, P.; Starbuck, M.; Priemel, M.; Shen, J.; Pinero, G.; Geoffroy, V.; Amling, M.; Karsenty, G. A Cbfa1-dependent genetic pathway controls bone formation beyond embryonic development. Genes. Dev. 1999, 13, 1025–1036. [Google Scholar] [CrossRef] [PubMed] [Green Version]
  58. Bucay, N.; Sarosi, I.; Dunstan, C.R.; Morony, S.; Tarpley, J.; Capparelli, C.; Scully, S.; Tan, H.L.; Xu, W.; Lacey, D.L.; et al. Osteoprotegerin-deficient mice develop early onset osteoporosis and arterial calcification. Gene. Dev. 1998, 12, 1260–1268. [Google Scholar] [PubMed]
  59. Simonet, W.S.; Lacey, D.L.; Dunstan, C.R.; Kelley, M.; Chang, M.S.; Luthy, R.; Nguyen, H.Q.; Wooden, S.; Bennett, L.; Elliott, R.; et al. Osteoprotegerin: A novel secreted protein involved in the regulation of bone density. Cell 1997, 89, 309–319. [Google Scholar]
  60. Gori, F.; Hofbauer, L.C.; Dunstan, C.R.; Spelsberg, T.C.; Khosla, S.; Riggs, B.L. The expression of osteoprotegerin and RANK ligand and the support of osteoclast formation by stromal-osteoblast lineage cells is developmentally regulated. Endocrinology 2000, 141, 4768–4776. [Google Scholar]
  61. Silva, I.; Branco, J. Rank/Rankl/opg: Literature review. Acta. Reumatol. Port. 2011, 36, 209–218. [Google Scholar]
  62. Grimaud, E.; Soubigou, L.; Couillaud, S.; Coipeau, P.; Moreau, A.; Passuti, N.; Gouin, F.; Redini, F.; Heymann, D. Receptor activator of nuclear factor κB ligand (RANKL)/osteoprotegerin (OPG) ratio is increased in severe osteolysis. Am. J. Pathol. 2003, 163, 2021–2031. [Google Scholar] [PubMed]
  63. Bai, P.; Sun, Y.; Jin, J.; Hou, J.; Li, R.; Zhang, Q.; Yang, Y. Disturbance of the OPG/RANK/RANKL pathway and systemic inflammation in COPD patients with emphysema and osteoporosis. Resp. Res. 2011, 12, 1–8. [Google Scholar] [CrossRef] [Green Version]
  64. Cowin, S.C.; Hegedus, D.H. Bone remodeling I: Theory of adaptive elasticity. J. Elast. 1976, 6, 313–326. [Google Scholar] [CrossRef]
Figure 1. Cumulative mortality of goslings. The goslings were fed, respectively, with P deficiency (PD) diet, P control (PC) diet, and a high P content (PH) diet.
Agriculture 12 01908 g001
Figure 2. Effects of dietary phosphorus (P) deficiency and high P content on the mRNA relative expression of osteogenesis in the cartilage of the tibia of goslings. a,b Values within a row without common superscripts differ significantly (p < 0.05). Abbreviated letters in the figure: The goslings were fed, respectively, with P deficiency (PD) diet, P control (PC) diet, and a high P content (PH) diet; (A) OPG (osteoprotegerin); (B) RNAKL (receptor activator of NF-κB ligand); (C) Runx2 (runt-related transcription factor 2); (D) BMP-2 (bone morphogenetic protein 2); (E) BGP (bone Gla-protein); (F) RNAKL:OPG ratio.
Agriculture 12 01908 g002
Table 1. Composition and nutrient levels of experimental diets (air-dry basis).
Items 1Groups 2
PDPCPH
Ingredient, %
Corn58.3058.3058.30
Soybean meal, 43% CP31.6031.6031.60
Wheat bran2.602.602.60
Rice husk2.002.002.00
Limestone1.931.420.77
Calcium dihydrogen Phosphate0.001.383.12
Vermiculite2.071.200.11
DL–methionine0.200.200.20
NaCl0.300.300.30
Premix 31.001.001.00
Total100.0100.0100.0
Nutrient levels 2, %
ME (MJ/kg)11.2411.2411.24
CP18.2918.3718.44
Crude fiber4.274.274.27
Calcium (Ca)0.760.780.78
Total phosphorus (TP)0.350.671.05
Non–phytate P (NPP)0.070.390.77
Methionine0.490.490.49
Lysine1.001.001.00
1 Data of CP, Ca, TP, and NPP were analyzed, and other data were calculated. 2 The goslings were fed, respectively, with a phosphorus-deficiency (PD) diet, a control (PC) diet, and a high P content diet (PH). 3 Per kg of the premix contained the following items: vitamin A, 900,000 IU; vitamin D, 300,000 IU; vitamin E, 1800 IU; vitamin K, 150 mg; vitamin B1, 90 mg; vitamin B2, 800 mg; vitamin B6, 320 mg; vitamin B12, 1.2 mg; nicotinic acid, 4.5 g; pantothenic acid, 1100 mg; folic acid, 65 mg; biotin, 5 mg; Mn (manganese sulfate), 9.5 g; Zn (zinc sulfate), 9 g; Fe (ferrous sulfate), 6 g; Cu (copper sulfate), 1 g; I (potassium iodide), 50 mg; Se (sodium selenite), 30 mg.
Table 2. Gene primers’ information.
Gene Name 1Primer Sequence (5′→3′)Product (bp)Accession Number
BGPF: CGCTCCCGTTACGCTTATTT127XM_013202125.1
R: AGGTGTGACAAAAAGTGTCGT
OPGF:CATCTCAACACACTGATGGCAAG147XM_013185062
R: GATGGTGTCTTGGTCTCCATTCT
RNAKLF:ACCTGACTAAAAGAGGGCTTCAG102XM_013179680
R: AGTATTTGGTGCTTCCTCCCTTC
BMP-2F: GCACCCAGCACGATGAAAAT276XM_013182079.1
R: GACAATGGAGGGTCCGGATT
Runx2F: TTTACCTATACACCGCCAGTCAC115XM_013184488
R: GTCCACTTTGGTTTTGGGAAGAG
β-actinF: GCACCCAGCACGATGAAAAT150XM_013174886.1
R: GACAATGGAGGGTCCGGATT
1 OPG, expressions of osteoprotegerin; RNAKL, receptor activator of NF-κB ligand; Runx2, runt-related transcription factor 2; BMP-2, bone morphogenetic protein 2; BGP, bone Gla-protein.
Table 3. Effects of dietary phosphorus (P) deficiency and high P content on growth performance of 14-day-old goslings.
ItemGroups 2SEM 3p-Value
PDPCPH
Initial body weight (g)101.1100.7100.60.190.503
BW (g)437.2 a637.8 b663.9 b25.36<0.001
ADG (g/bird·d)22.77 a37.03 b38.59 b1.77<0.001
ADFI (g/bird·d)48.63 a68.21 b74.92 b3.03<0.001
Feed/gain2.131.821.910.060.068
a,b Values within a row without common superscripts differ significantly (p < 0.05). 2 The goslings were fed with a P deficiency (PD) diet, a P control (PC) diet, and a high P content (PH) diet. 3 Each value represents the mean of 6 replicates.
Table 4. Effects of dietary phosphorus (P) deficiency and high P content on serum variables of goslings.
ItemGroups 2SEM 3p-Value
PDPCPH
Calcium (Ca, mmol/L)
d 4 2.312.382.370.0290.646
d 7 2.352.292.400.0410.581
d 112.712.542.610.0350.138
d 14 2.512.332.480.0330.054
Phosphorus (P, mmol/L)
d 4 2.232.452.430.0630.301
d 7 2.232.362.330.0520.609
d 112.332.572.460.0590.247
d 14 1.91 a2.37 b2.12 a0.0620.002
Alkaline phosphatase (ALP) activity (U/L)
d 4 781.0769.3778.020.490.975
d 7 1188 b777.8 a842.7 a48.42<0.001
d 111125 b783.0 a947.5 ab49.370.008
d 14 1114 b772.0 a936.8 ab53.240.020
a,b Values within a row without common superscripts differ significantly (p < 0.05). 2 The goslings were fed with a P deficiency (PD) diet, a P control (PC) diet, and a high P content (PH) diet. 3 Each value represents the mean of 6 replicates.
Table 5. Effects of dietary phosphorus (P) deficiency and high P content on the serum hormones in goslings.
ItemGroups 2SEM 3p-Value
PDPCPH
Parathyroid hormone (PTH) content (pg/mg)
d 4 902.0836.7983.743.190.403
d 7 12491054133858.470.126
d 1112941200126542.450.679
d 14 14411359141046.650.791
Calcitonin (CT) content (pg/mg)
d 4 17.9414.4818.400.7740.069
d 7 25.01 b19.04 a22.67 ab0.9480.023
d 1123.61 b20.65 a27.33 c1.174<0.001
d 14 27.41 b20.08 a25.40 b1.1660.018
1,25-dihydroxyvitamin D3 (1,25-(OH2)D3) content (ng/mL)
d 4 21.4418.2523.481.0020.093
d 7 28.6824.3730.661.2230.094
d 1129.27 b22.91 a32.65 b1.3390.003
d 14 31.40 b27.81 a35.16 c0.9670.002
Bone-Gla-protein (BGP) content (ng/mL)
d 4 15.6316.7214.240.4500.069
d 7 13.3915.7313.130.5410.089
d 1114.9316.0114.410.4550.362
d 14 13.90 b15.53 c12.32 a0.4180.002
Osteoprotegerin (OPG) content (pg/mg)
d 4 588.8510.3566.116.240.124
d 7 636.1612.5639.114.090.725
d 11698.7596.7664.621.650.147
d 14 767.1717.2780.321.830.488
a–c Values within a row without common superscripts differ significantly (p < 0.05). 2 The goslings were fed with a P deficiency (PD) diet, a P control (PC) diet, and a high P content (PH) diet. 3 Each value represents the mean of 6 replicates.
Table 6. Effects of dietary phosphorus (P) deficiency and high P content on tibial development in goslings.
ItemGroups 2SEM 3p-Value
PDPC PH
Width (cm)
d 4 0.340.350.340.0030.177
d 7 0.400.410.410.0060.704
d 110.460.460.480.0080.512
d 14 0.48 a0.56 b0.55 b0.0120.008
Length (cm)
d 4 5.035.155.000.0340.174
d 7 5.585.735.750.0590.481
d 116.46 a6.94 b6.99 b0.0740.001
d 14 7.05 a8.07 b8.10 b0.143<0.001
Fresh weight (g)
d 4 1.001.061.050.0130.133
d 7 1.661.721.760.0600.494
d 112.70 a3.20 b3.23 b0.0910.016
d 14 3.83 a4.95 b4.92 b0.1870.010
Strength (N)
d 4 17.86 a25.53 b26.02 b1.079<0.001
d 7 21.78 a47.10 b50.52 b3.509<0.001
d 1439.62 a174.5 b170.1 b15.71<0.001
a,b Values within a row without common superscripts differ significantly (p < 0.05). 2 The goslings were fed with a P deficiency (PD) diet, a P control (PC) diet, and a high P content (PH) diet. 3 Each value represents the mean of 6 replicates.
Table 7. Effects of dietary phosphorus (P) deficiency and high P content on the content of ash, calcium (Ca), and P in the tibia in goslings.
ItemGroups 2SEM 3p-Value
PDPC PH
Ash content (%)
d 4 30.7 a37.7 b38.3 b1.130.003
d 7 29.6 a40.5 b42.0 b1.44<0.001
d 1131.5 a42.7 b43.9 b1.44<0.001
d 14 29.5 a44.7 b45.3 b1.87<0.001
Phosphorus (P) content (%)
d 4 4.63 a7.55 b7.60 b0.37<0.001
d 7 4.82 a8.40 b8.34 b0.43<0.001
d 115.01 a8.68 b8.81 b0.44<0.001
d 14 4.61 a 8.76 b8.69 b0.48<0.001
Calcium (Ca) content (%)
d 4 11.36 a17.26 b17.23 b0.76<0.001
d 7 12.18 a17.63 b18.14 b0.82<0.001
d 1111.24 a17.56 b18.41 b0.82<0.001
d 14 9.21 a18.03 b18.72 b1.08<0.001
a,b Values within a row without common superscripts differ significantly (p < 0.05). 2 The goslings were fed with a P deficiency (PD) diet, a P control (PC) diet, and a high P content (PH) diet. 3 Each value represents the mean of 6 replicates.
Publisher’s Note: MDPI stays neutral with regard to jurisdictional claims in published maps and institutional affiliations.

